Article

The BCO2 Genotype and the Expression of BCO1, BCO2, LRAT, and TTPA Genes in the Adipose Tissue and Brain of Rabbits Fed a Diet with Marigold Flower Extract

by
Janusz Strychalski
1,*,
Andrzej Gugołek
1,
Edyta Kaczorek-Łukowska
2,
Zofia Antoszkiewicz
3 and
Paulius Matusevičius
4
1
Department of Fur-Bearing Animal Breeding and Game Management, University of Warmia and Mazury in Olsztyn, Oczapowskiego 5, 10-719 Olsztyn, Poland
2
Department of Microbiology and Clinical Immunology, Faculty of Veterinary Medicine, University of Warmia and Mazury in Olsztyn, Oczapowskiego 13, 10-719 Olsztyn, Poland
3
Department of Animal Nutrition and Feed Science, University of Warmia and Mazury in Olsztyn, Oczapowskiego 5, 10-719 Olsztyn, Poland
4
Department of Animal Breeding and Nutrition, Faculty of Animal Husbandry Technology, Lithuanian University of Health Sciences, Tilžes 18, LT-47181 Kaunas, Lithuania
*
Author to whom correspondence should be addressed.
Int. J. Mol. Sci. 2023, 24(3), 2304; https://doi.org/10.3390/ijms24032304
Submission received: 30 November 2022 / Revised: 20 January 2023 / Accepted: 22 January 2023 / Published: 24 January 2023
(This article belongs to the Special Issue Neurological Diseases: A Molecular Genetic Perspective)

Abstract

:
This study was undertaken to evaluate the effect of the BCO2 genotype and dietary supplementation with marigold flower extract on the expression of BCO1, BCO2, LRAT, and TTPA genes in the adipose tissue and brain of rabbits. The concentrations of lutein, zeaxanthin, β-carotene, retinol, and α-tocopherol were determined in samples collected from rabbits. Sixty young male Termond White rabbits were allocated to three groups based on their genotype at codon 248 of the BCO2 gene (ins/ins, ins/del, and del/del). Each group comprised two subgroups; one subgroup was administered a standard diet, whereas the diet offered to the other subgroup was supplemented with 6 g/kg of marigold flower extract. The study demonstrated that the BCO2 genotype may influence the expression levels of the BCO2, LRAT, and TTPA genes in adipose tissue, and TTPA and BCO1 genes in the brain. Moreover, an increase in the amount of lutein in the diet of BCO2 del/del rabbits may increase the expression of BCO1, LRAT, and TTPA genes in adipose tissue, and the expression of the BCO2 gene in the brain. Another finding of the study is that the content of carotenoids and α-tocopherol increases in both the adipose tissue and brain of BCO2 del/del rabbits.

1. Introduction

Carotenoids, which belong to the isoprenoids, are synthesized by photosynthetic as well as non-photosynthetic organisms such as algae, bacteria, and fungi [1]. More than 750 structurally different carotenoids have been isolated to date. There are two main classes of carotenoids: Carotenes (e.g., α-carotene, β-carotene, and lycopene) and xanthophylls (e.g., lutein, zeaxanthin, and β-cryptoxanthin) [2]. During photosynthesis, carotenoids act as accessory pigments. They protect plants against photooxidative damage and serve as precursors for the biosynthesis of phytohormones [3,4]. Carotenoids give yellow, orange, and red colors not only to plants, fruits, and vegetables but also to insects, birds, and fish [5]. In animals, carotenoids are precursors to vitamin A, which plays a key role in eye health and vision, cellular growth, and differentiation [6]. In both plants and animals, carotenoids are potent antioxidants, effective singlet oxygen quenchers, and scavengers of other reactive oxygen species (ROS). They contribute to preventing many ROS-mediated disorders [7]. Animals are not able to synthesize carotenoids de novo, which is why they must be obtained from food [1]. Dietary carotenoids are absorbed and stored mainly in the liver and adipose tissue. They are metabolized with the involvement of digestive enzymes (pancreatic lipase and carboxylesterase) and enzymes that participate in their distribution to the target tissues (glutathione S-transferase Pi1, a protein homologous to StAR) [8,9,10]. Carotenoids are cleaved by two homologous enzymes: β-carotene oxygenase 1 (BCO1) and β-carotene oxygenase 2 (BCO2). Provitamin A carotenoids with unsubstituted β rings (such as α-carotene, β-carotene, and β-cryptoxanthin) can be cleaved by both enzymes. However, BCO2 has a higher affinity for carotenoids that do not serve as substrates for the biosynthesis of provitamin A (they do not have a β ring or have substituents at the β ring position, usually carbonyl, hydroxyl, or epoxy groups; examples of such carotenoids are lycopene, lutein, and zeaxanthin) [11]. BCO2 catalyzes the oxidative cleavage of carotenoids at the 9,10′ double bond, generating apo-10′-carotenals and ionones, whose functions remain largely unknown [12]. In turn, BCO1 converts β-carotene to retinal by centric oxidative cleavage at the 15,15′ double bond [13]. Retinal is then converted to retinol in a reaction catalyzed by retinol dehydrogenase. Next, lecithin retinol acyltransferase (LRAT) catalyzes the esterification of retinol to retinyl esters [14].
At slaughter, the fat of cattle, sheep, and rabbits can be assessed as white by a visual inspection. However, members of the above species may have a dysfunction in the BCO2 protein. As a result, non-provitamin A carotenoids are not cleaved; instead, they are deposited in the adipose tissue and impart a yellow color to fat [15,16,17]. Yellow fat is also often encountered in poultry [18]. Rabbits with the deletion of AAT nucleotides at codon 248 of the BCO2 gene have yellowish fat [19]. The yellow tint of fat is a recessive trait typical of homozygous individuals—carriers of the above deletion [16,19,20].
Marigold flowers are abundant in carotenoid pigments. The Aztec marigold (Tagetes erecta L.) belongs to the family Asteraceae. These annual plant species are native to Mexico, but it is also widely grown in Europe, Asia, and Africa. Marigolds are ornamental flowers, but they also have numerous medicinal and industrial uses [21]. Lutein is the major pigment in the petals of marigold flowers, accounting for almost 90% of total carotenoids. In turn, zeaxanthin makes up around 5% of the carotenoids present in marigold flowers [22,23]. Poultry diets are often supplemented with marigold powder to enhance the color of the birds’ fat, skin, and egg yolk [21]. Dried alfalfa is often the main source of carotenoids in commercial pelleted diets for rabbits [20,24]. However, fresh alfalfa and other forages, which are often fed in large quantities to rabbits raised on small backyard farms, have considerably higher carotenoid content [25].
Our previous studies have investigated the levels of carotenoids, retinol, and α-tocopherol in the liver and adipose tissue of rabbits and the milk of does, as dependent on their genotype determined by AAT-deletion mutation at codon 248 of the BCO2 gene [16,19,20]. A recent study evaluated the influence of the BCO2 genotype and Aztec marigold flower extract added to rabbit diets on the expression of genes associated with the metabolism of carotenoids, vitamin A, and vitamin E (BCO1, BCO2, LRAT, and TTPA - α-tocopherol transfer protein) in the liver [26]. However, the responses of other tissues and organs have not been analyzed to date. Thus, to contribute to a more comprehensive understanding of carotenoid metabolism in rabbits, the present study was undertaken to analyze the effect of the BCO2 genotype and dietary supplementation with marigold extract on the expression of BCO1, BCO2, LRAT, and TTPA genes in the adipose tissue and brain of rabbits. The levels of lutein, zeaxanthin, β-carotene, retinol, and α-tocopherol were also determined in the collected samples.

2. Results

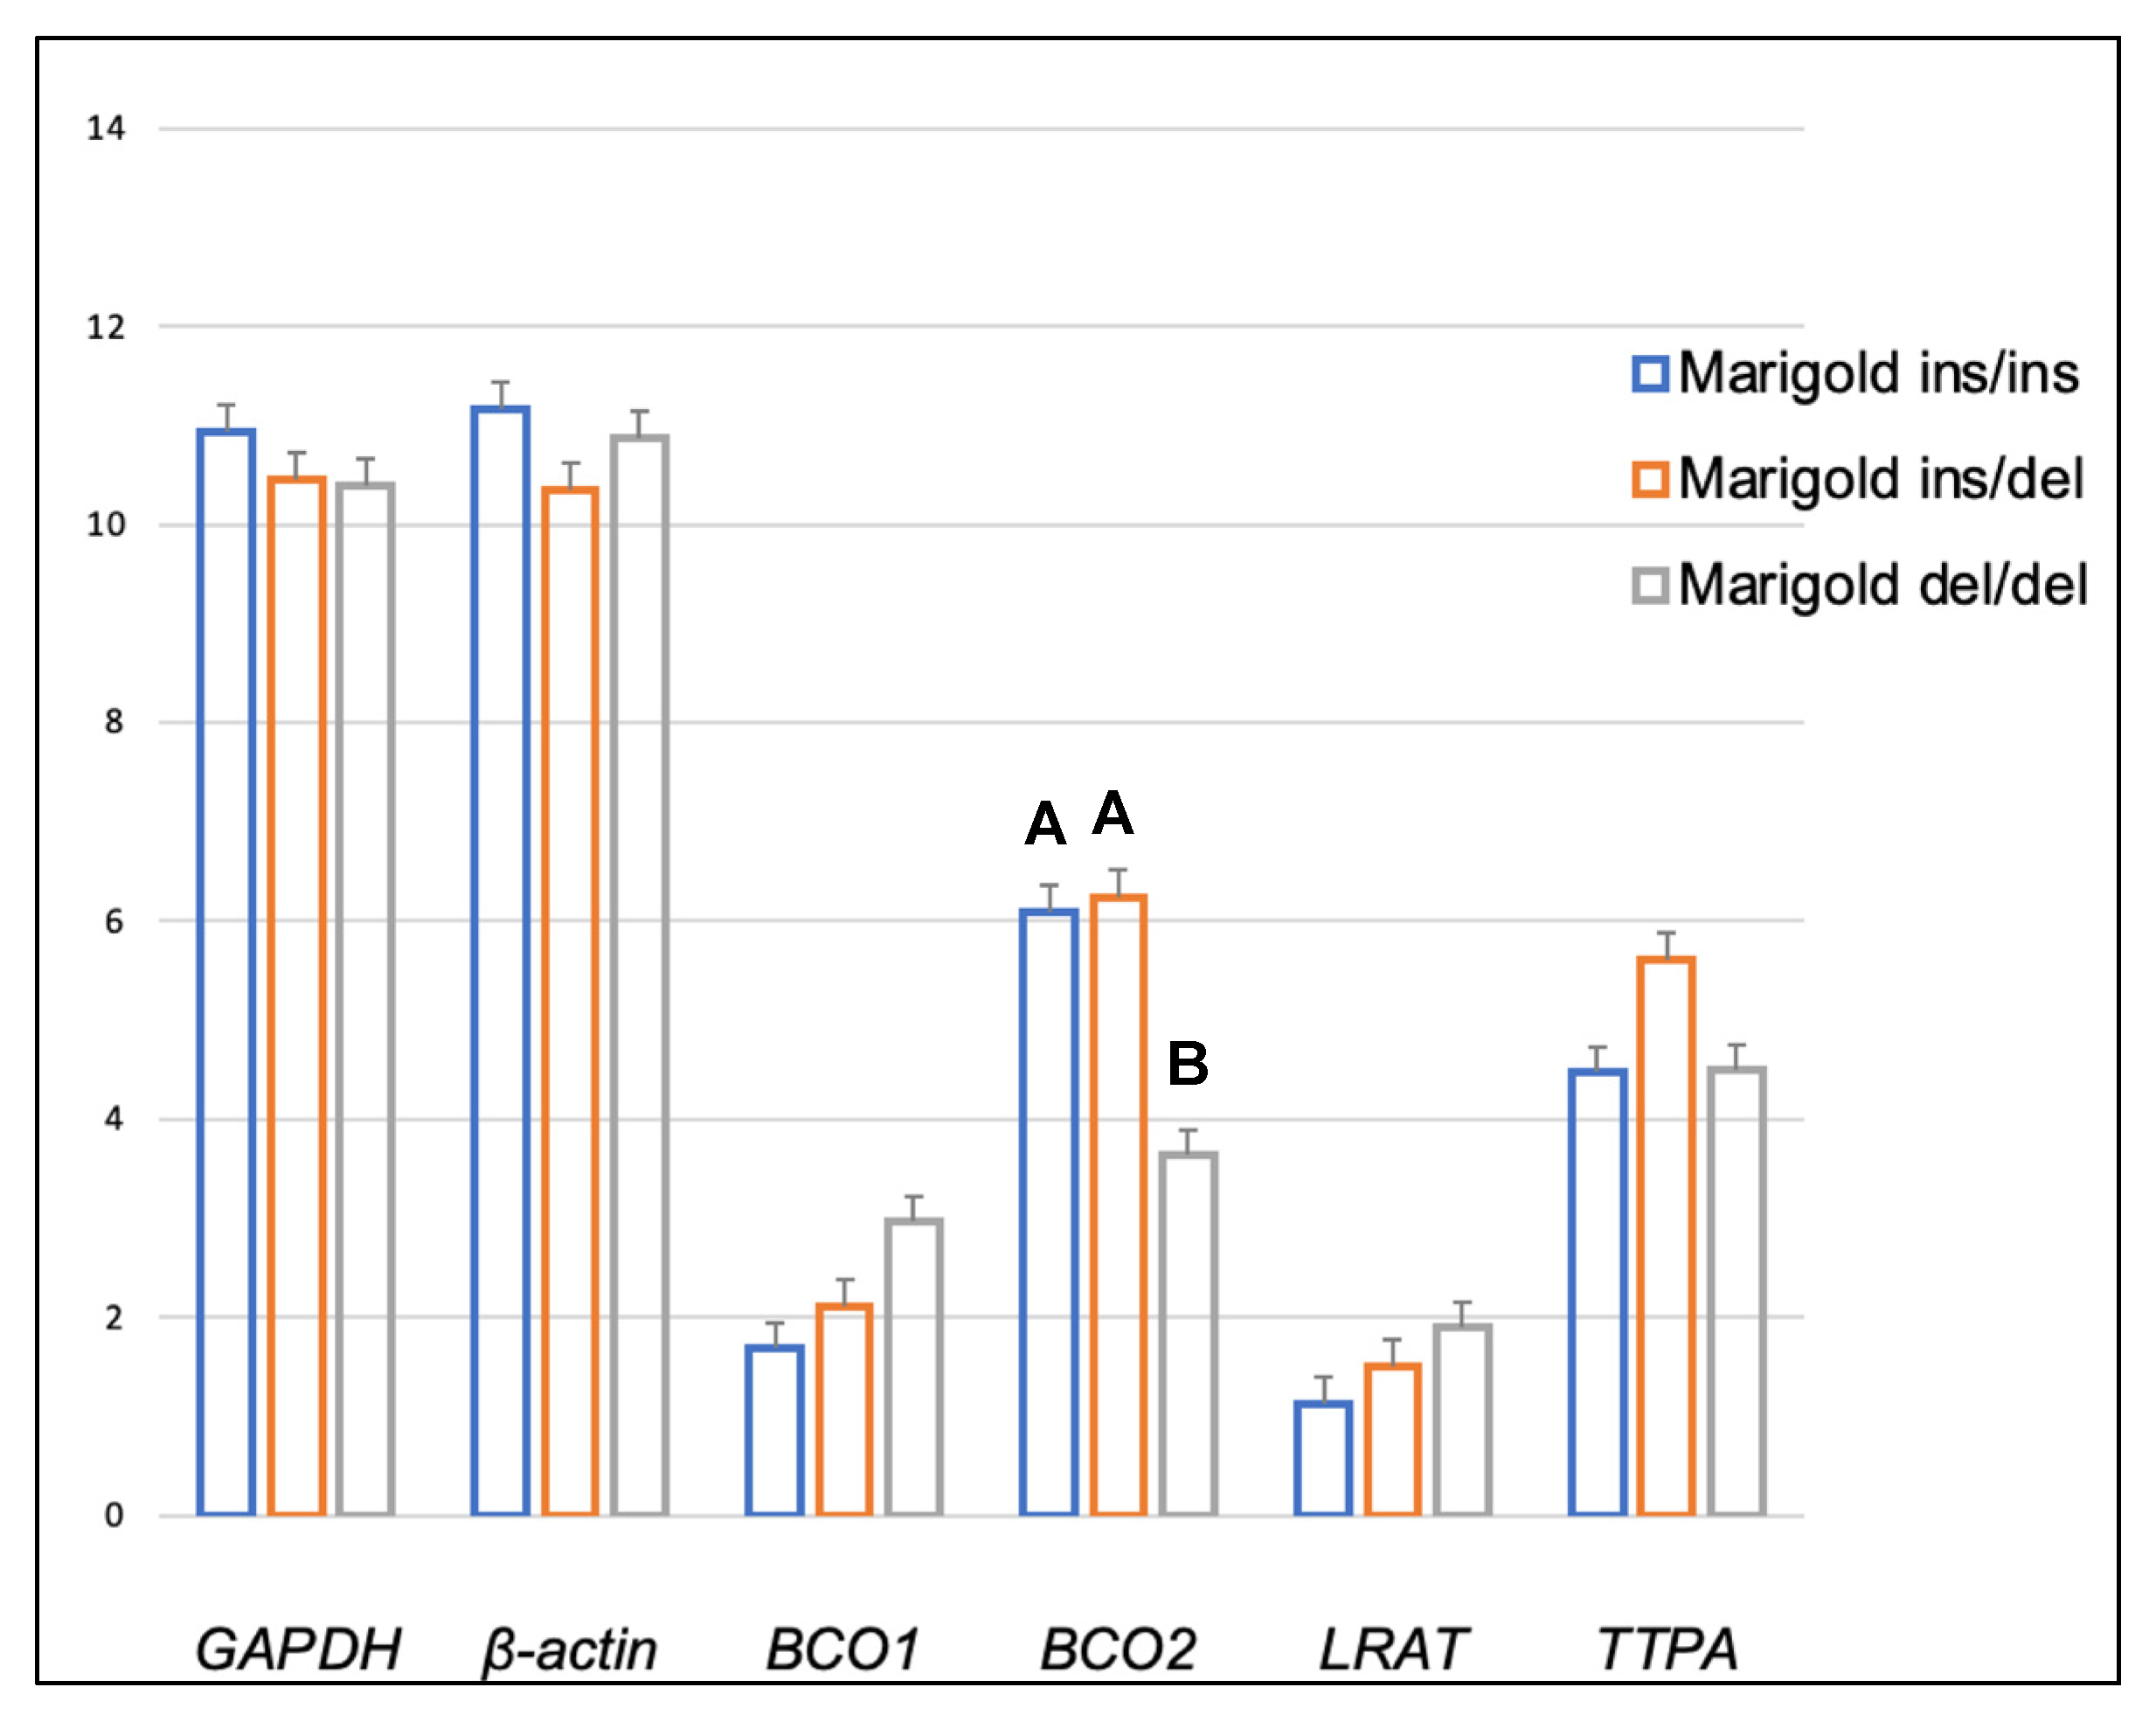
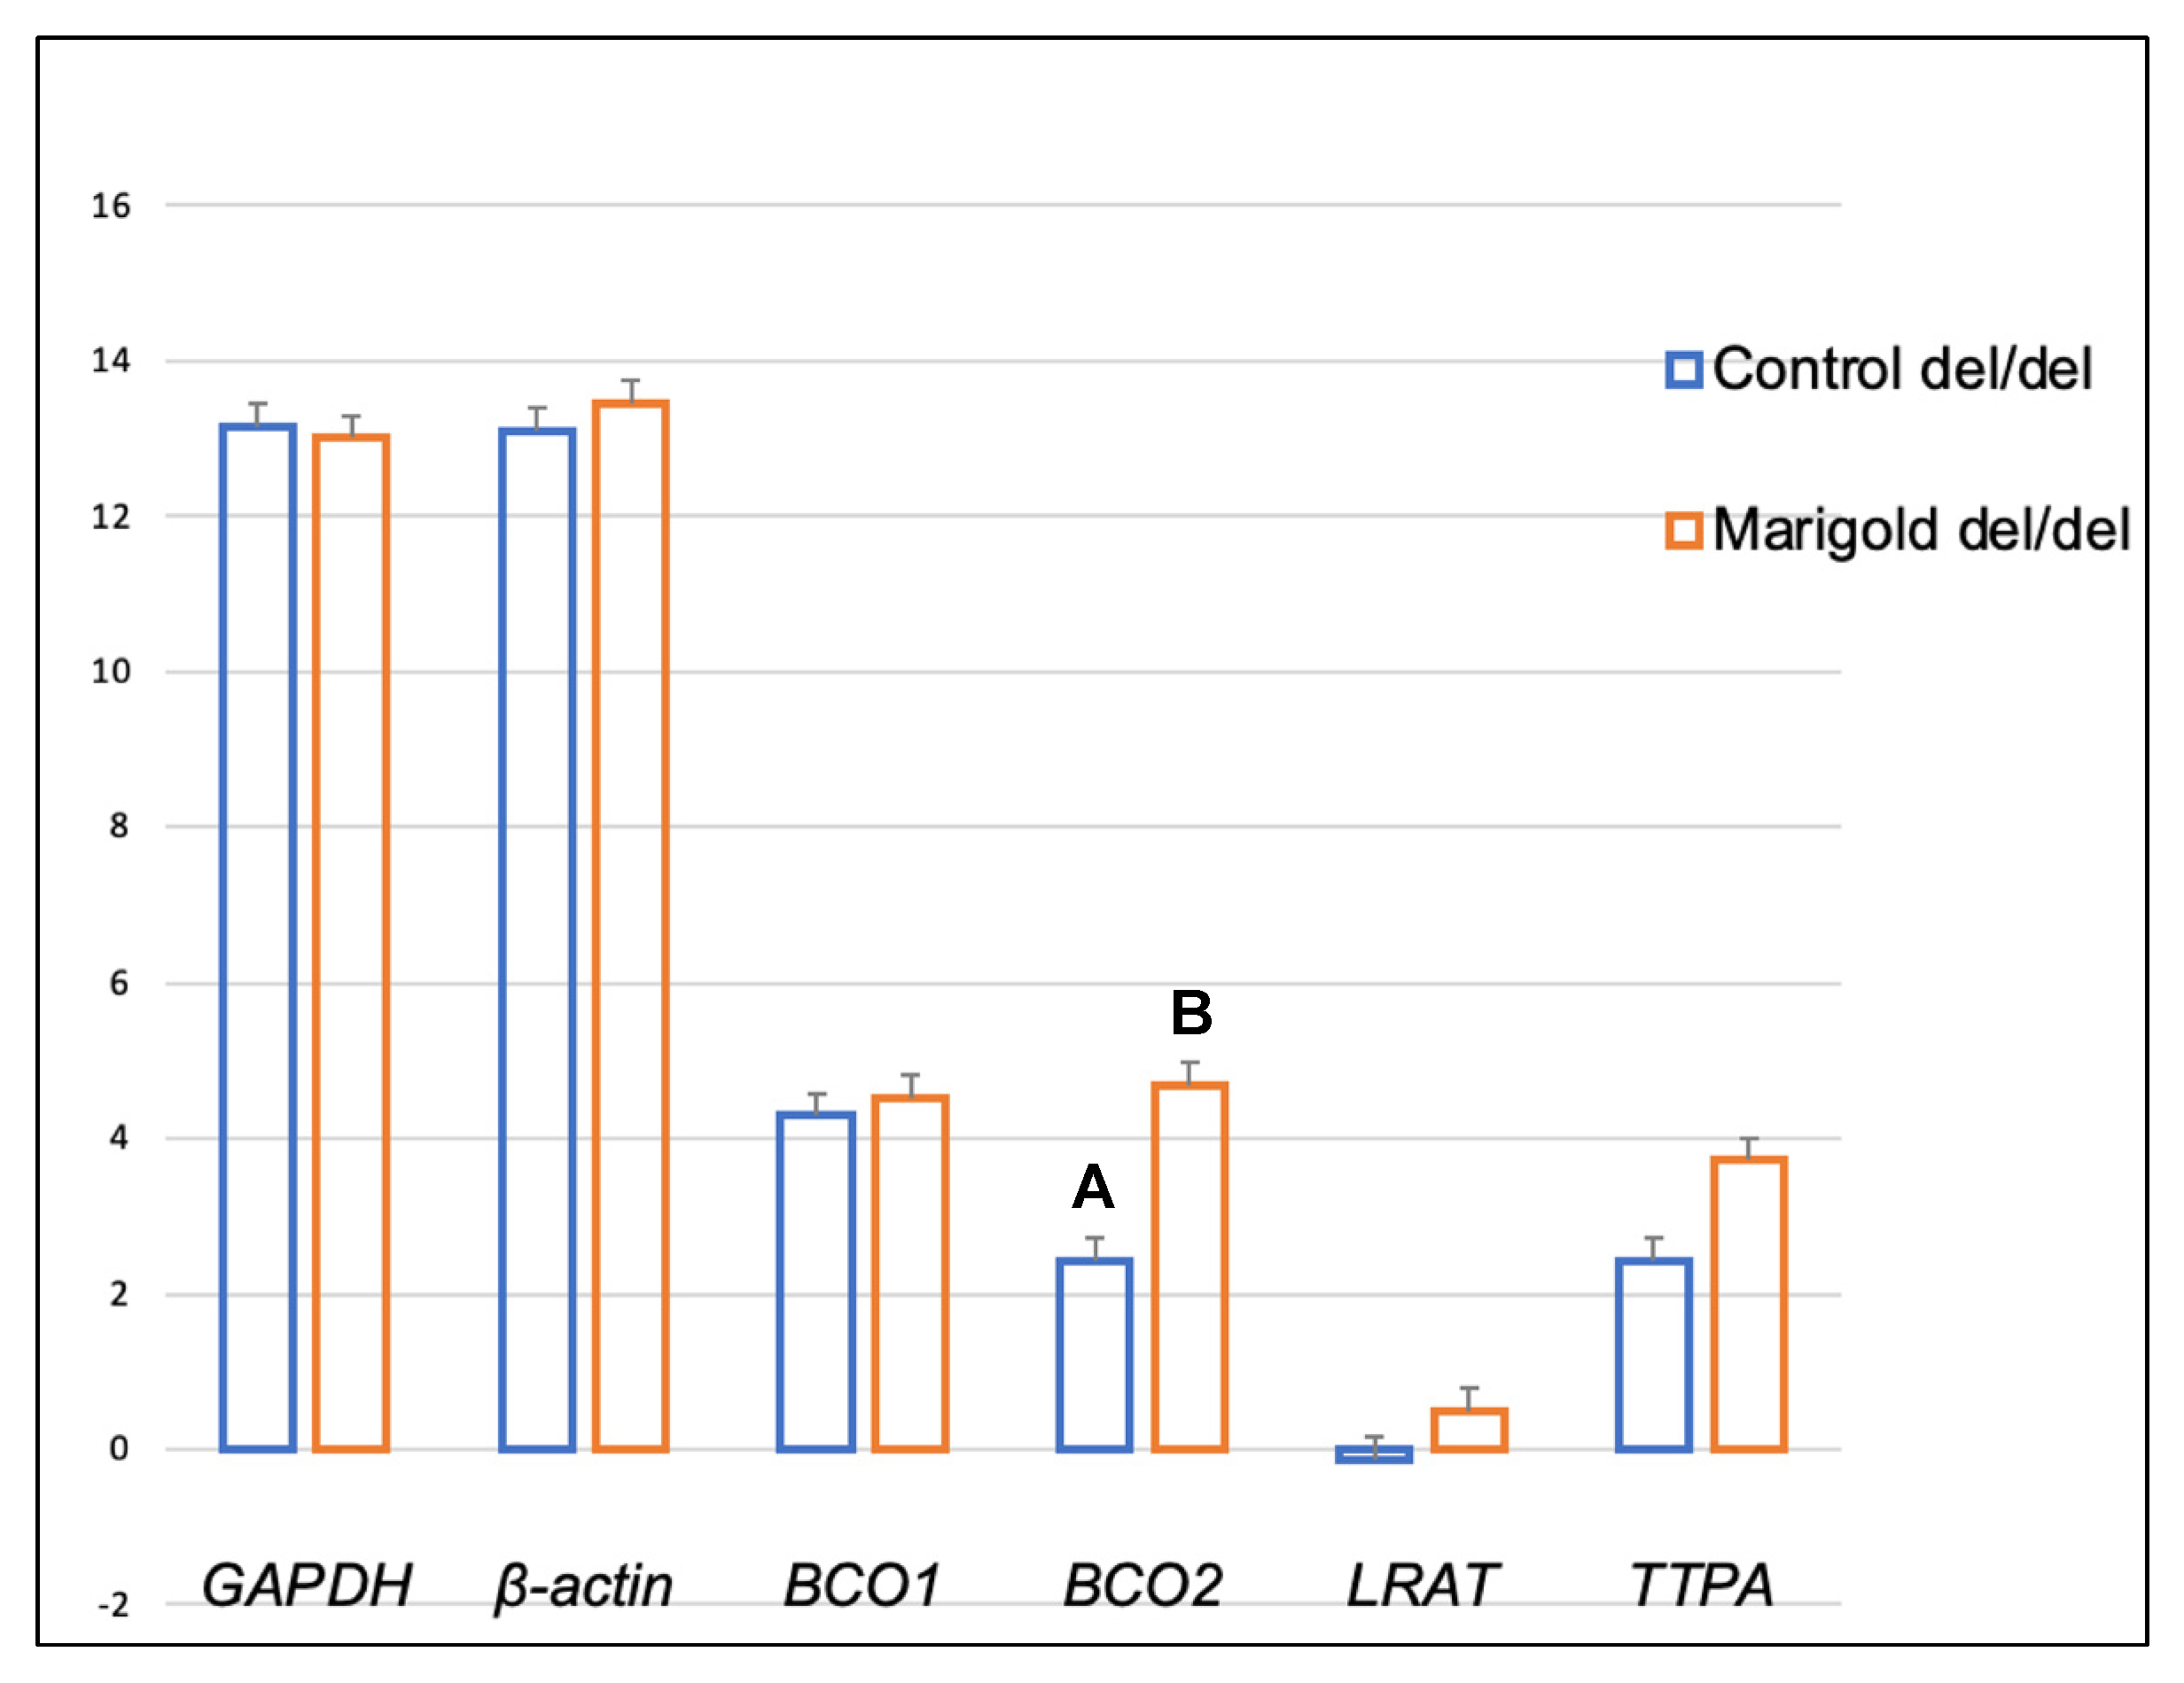
Genotype at codon 248 of the BCO2 gene differentiated the expression levels of LRAT and TTPA genes in the adipose tissue of rabbits receiving the control diet (Figure 1). The relative expression level of the LRAT gene was higher in ins/del than in del/del animals (p < 0.05), and the relative expression level of the TTPA gene was higher in ins/ins than in del/del animals (p < 0.05). In turn, in rabbits administered a diet containing 6 g/kg of marigold flower extract, the BCO2 genotype influenced the differentiation of BCO2 gene expression (Figure 2). Animals with the BCO2 del/del genotype were characterized by a lower expression of this gene than ins/ins and ins/del individuals. However, no differences were found between the ins/ins and ins/del genotypes.
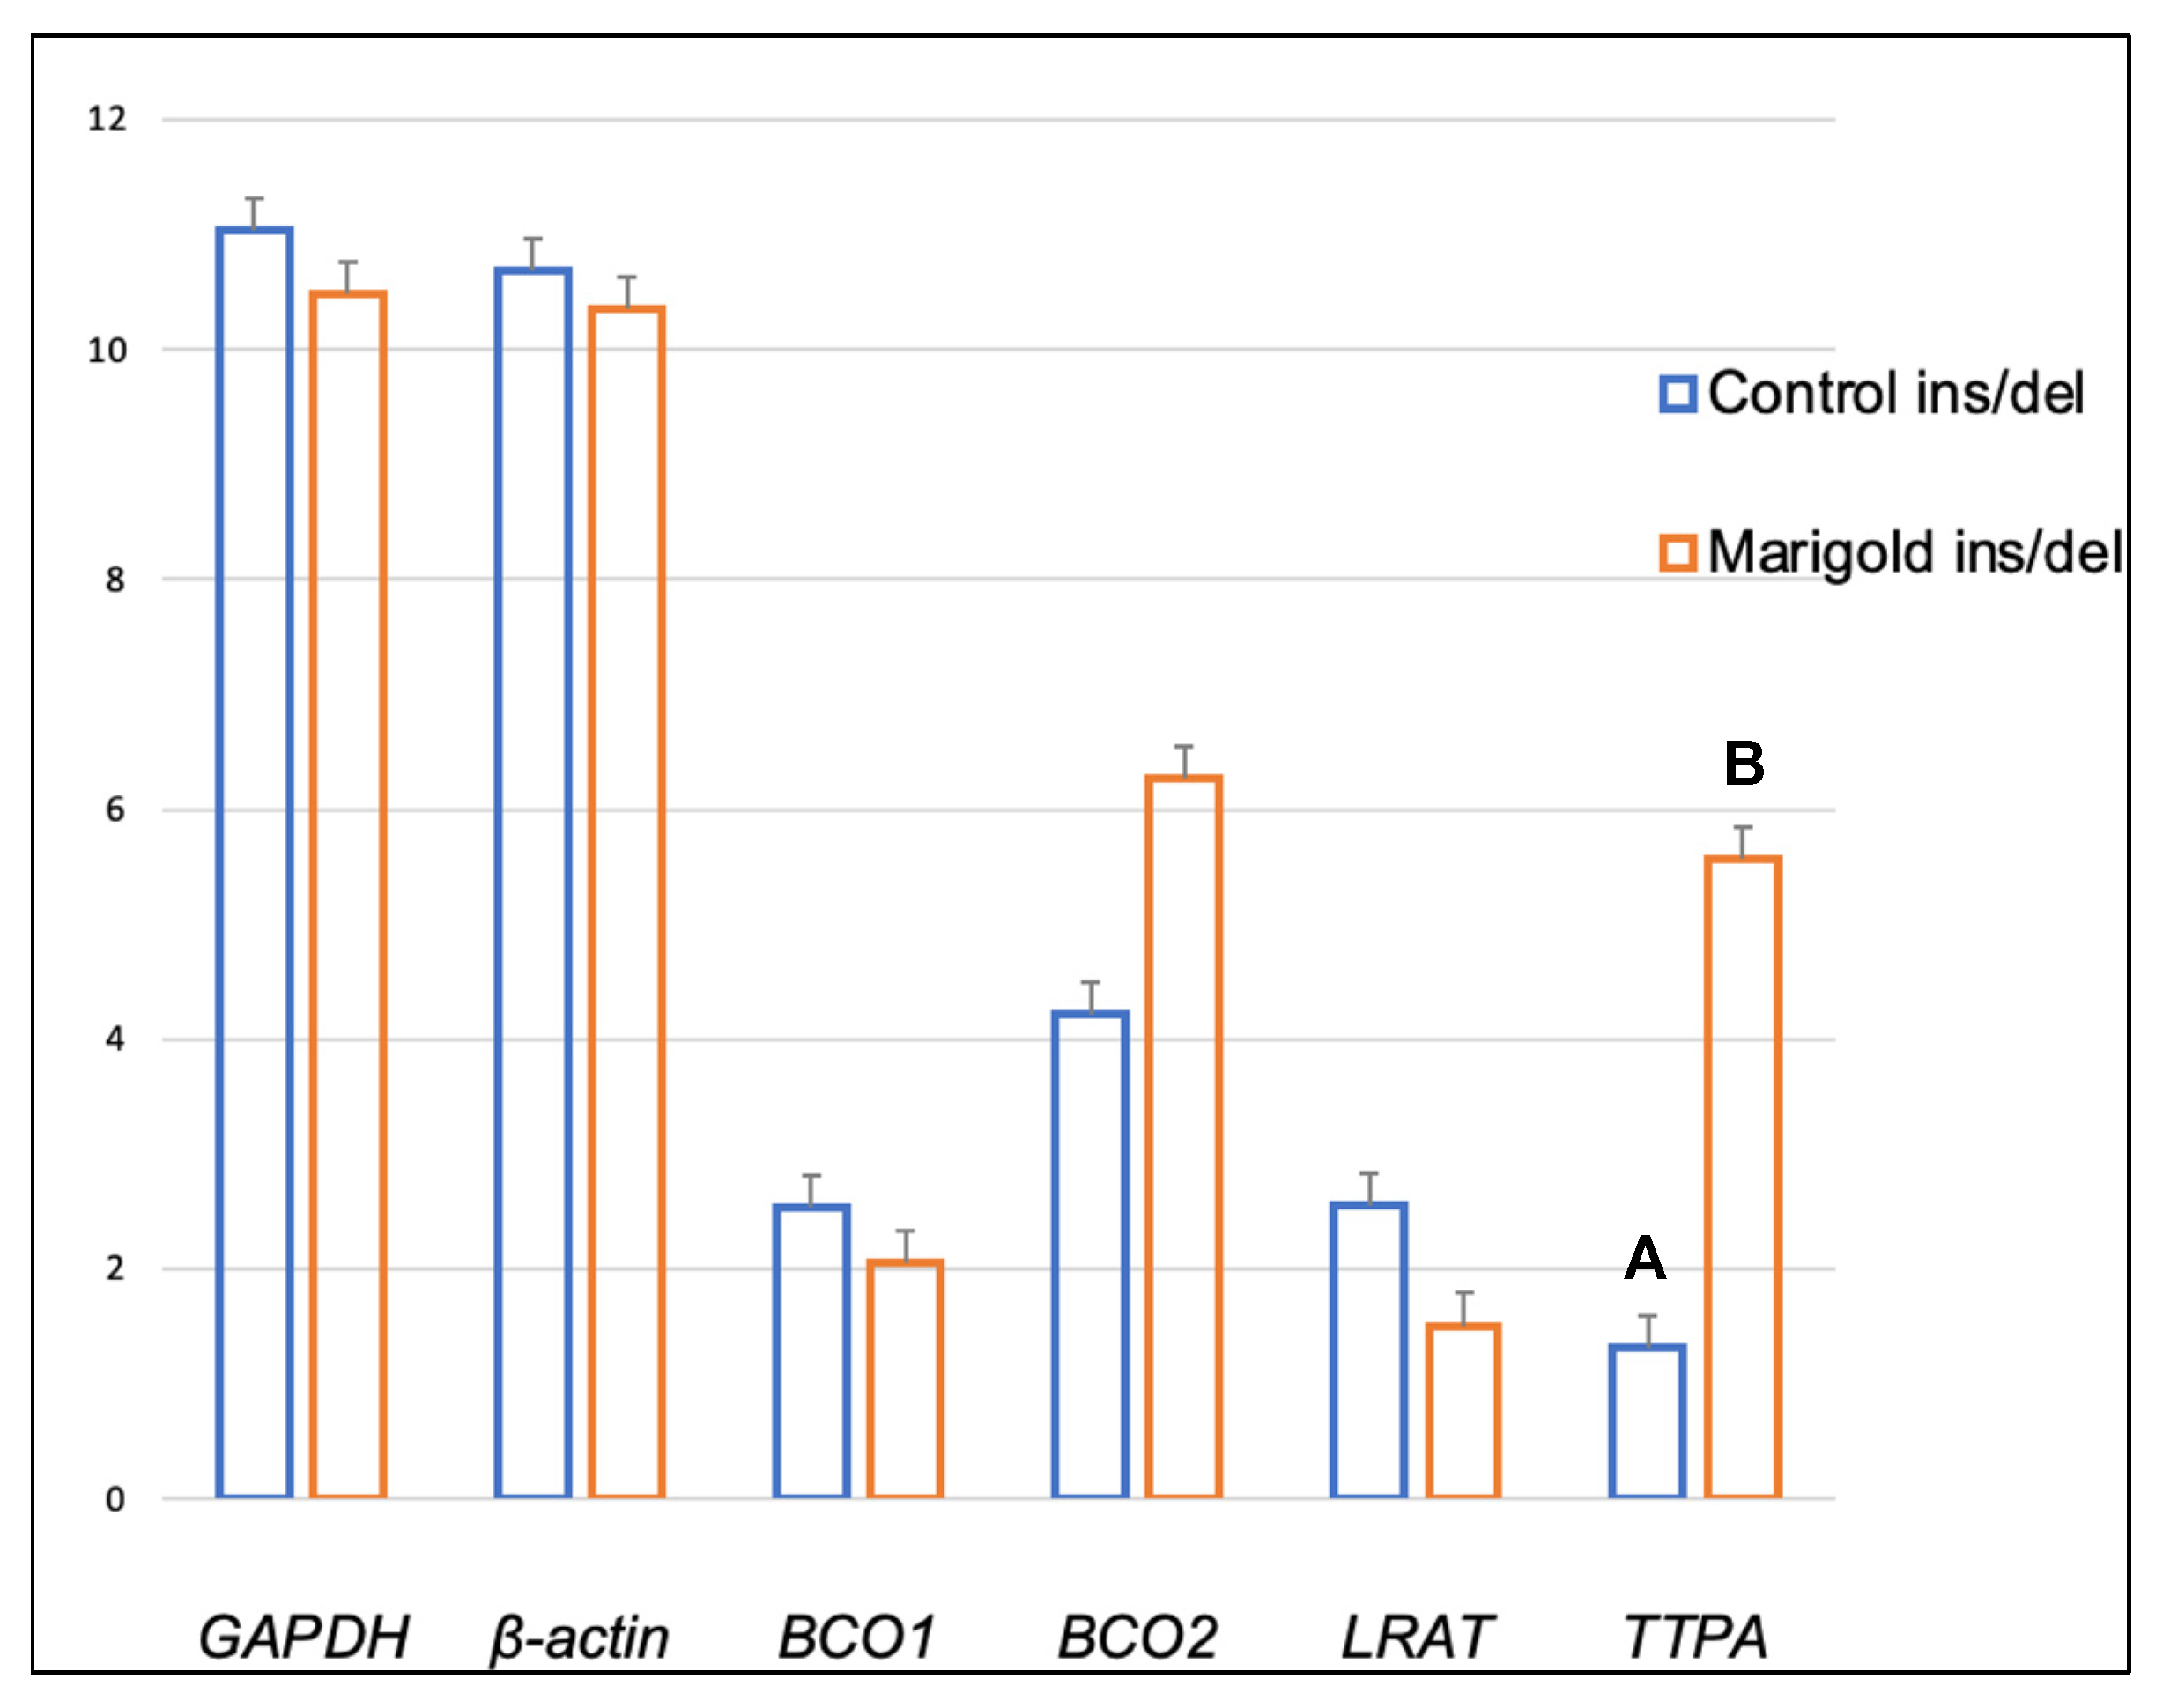
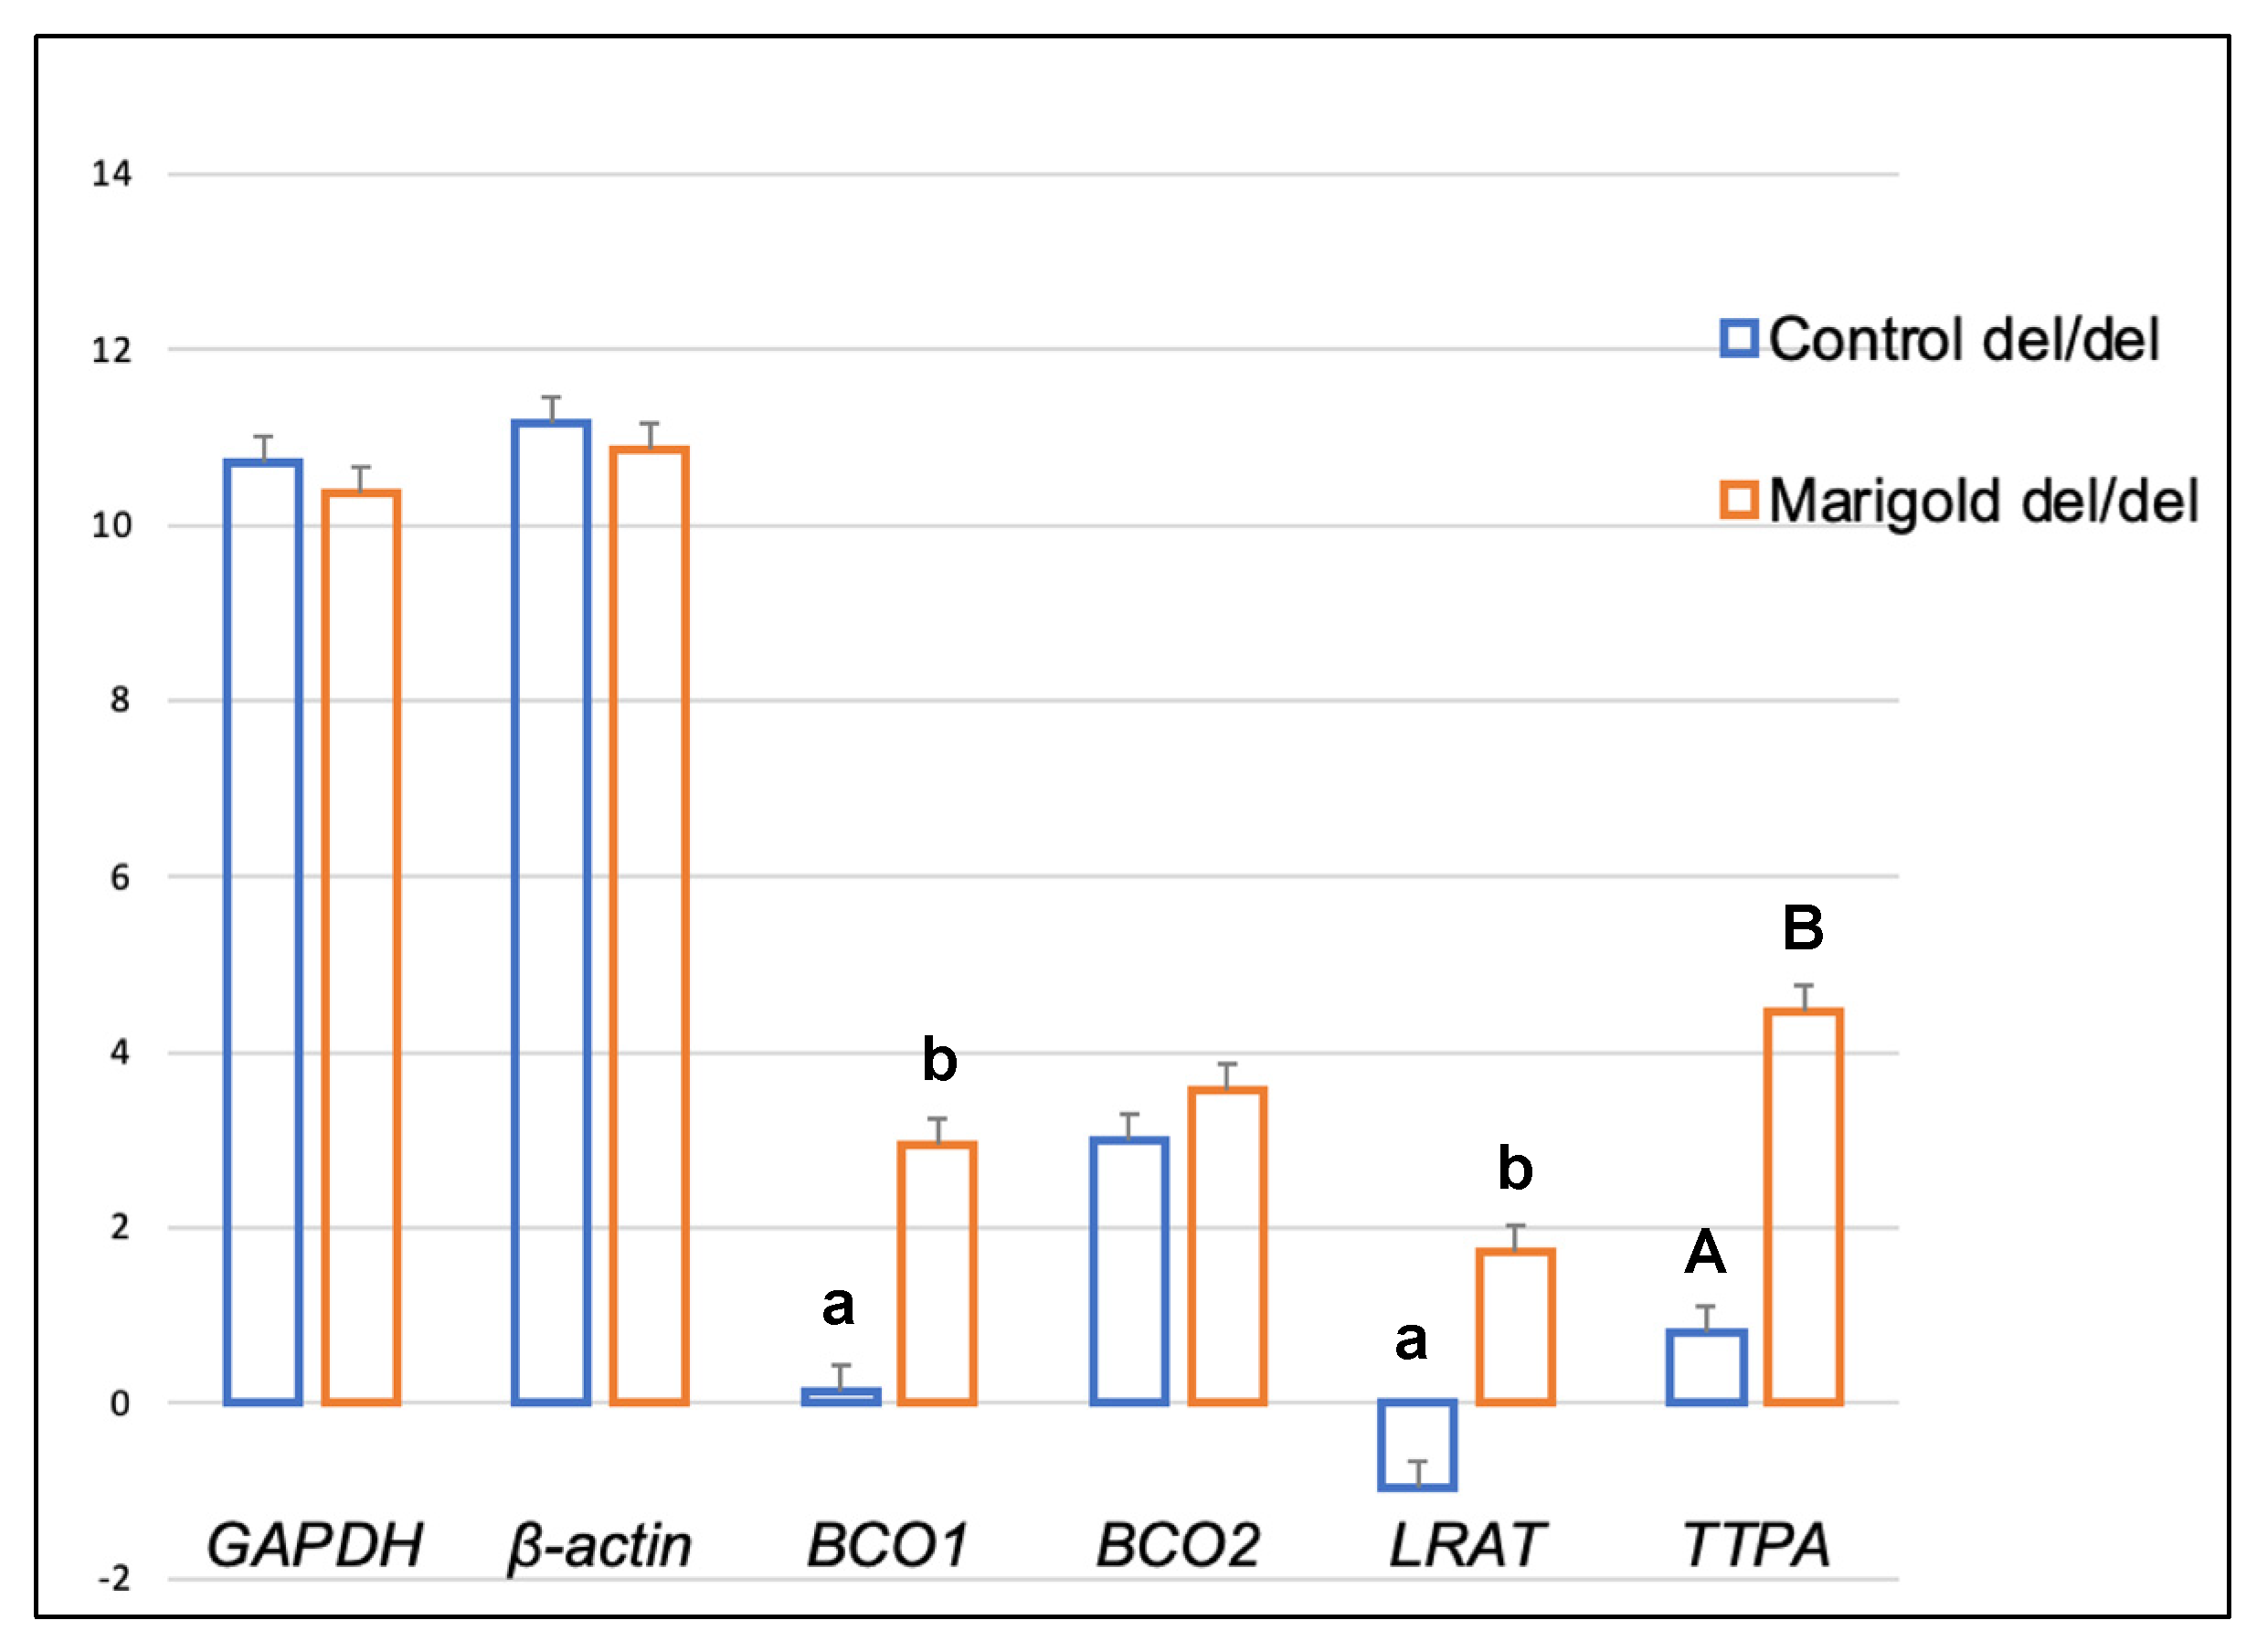
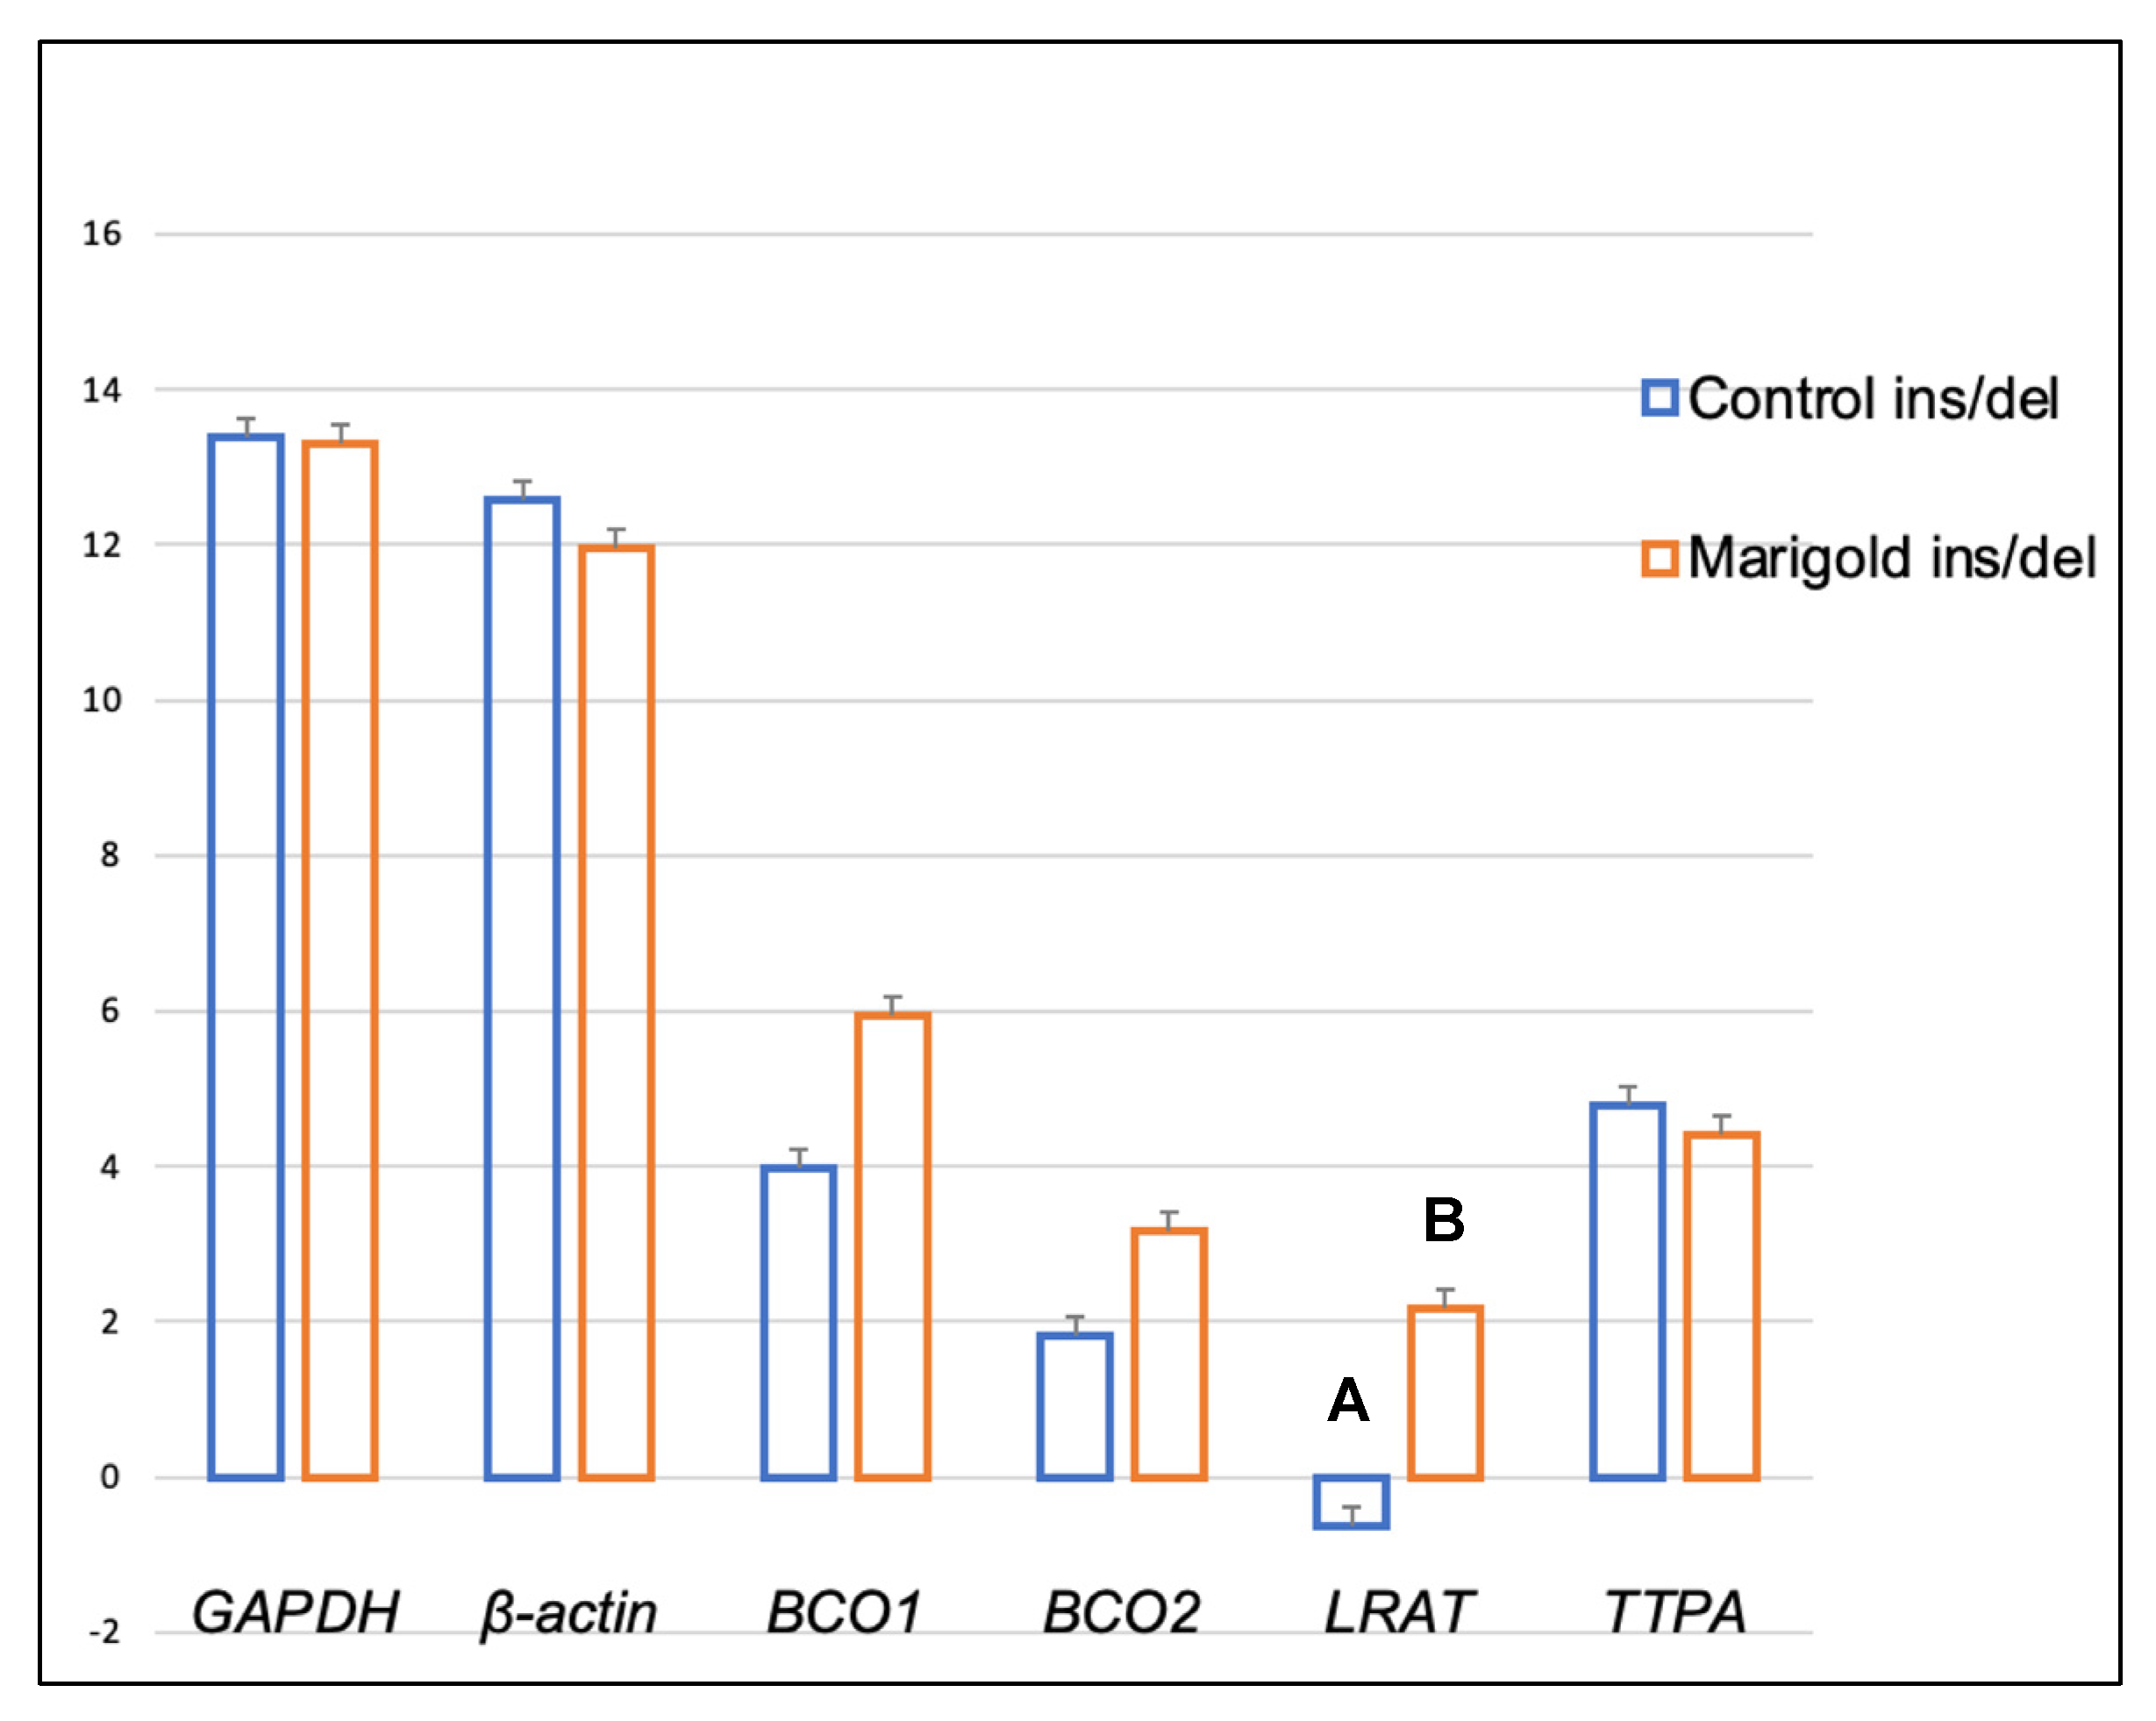
Dietary supplementation with marigold flower extract increased the expression of the TTPA gene in the adipose tissue of rabbits with BCO2 ins/del and del/del genotypes (p < 0.01 in both cases) (Figure 3 and Figure 4). Moreover, dietary marigold supplementation increased the expression of BCO1 and LRAT genes in rabbits carrying the BCO2 del/del genotype (p < 0.05 in both cases) (Figure 4).
In perirenal fat, the levels of all tested micronutrients excluding retinol were affected by the BCO2 genotype (Table 1). The content of xanthophylls (lutein and zeaxanthin) was many-fold higher in rabbits with the del/del genotype than in the animals with the remaining two genotypes (p <0.01 in all cases), and the noted differences were much greater in animals fed the marigold-supplemented diet (more than hundred-fold for lutein and more than fifty-fold for zeaxanthin) than in non-supplemented individuals (nine-fold and five-fold, respectively). Similarly, higher levels of β-carotene and α-tocopherol were observed in rabbits with the del/del genotype (vs. ins/ins and ins/del genotypes), and the noted differences were more pronounced in animals fed the fortified diet. Importantly, feeding marigold extract to rabbits with the del/del genotype induced a nine-fold increase in lutein concentration (p < 0.01), an eleven-fold increase in zeaxanthin concentration (p < 0.01), and a two-fold increase in β-carotene concentration (p < 0.05).
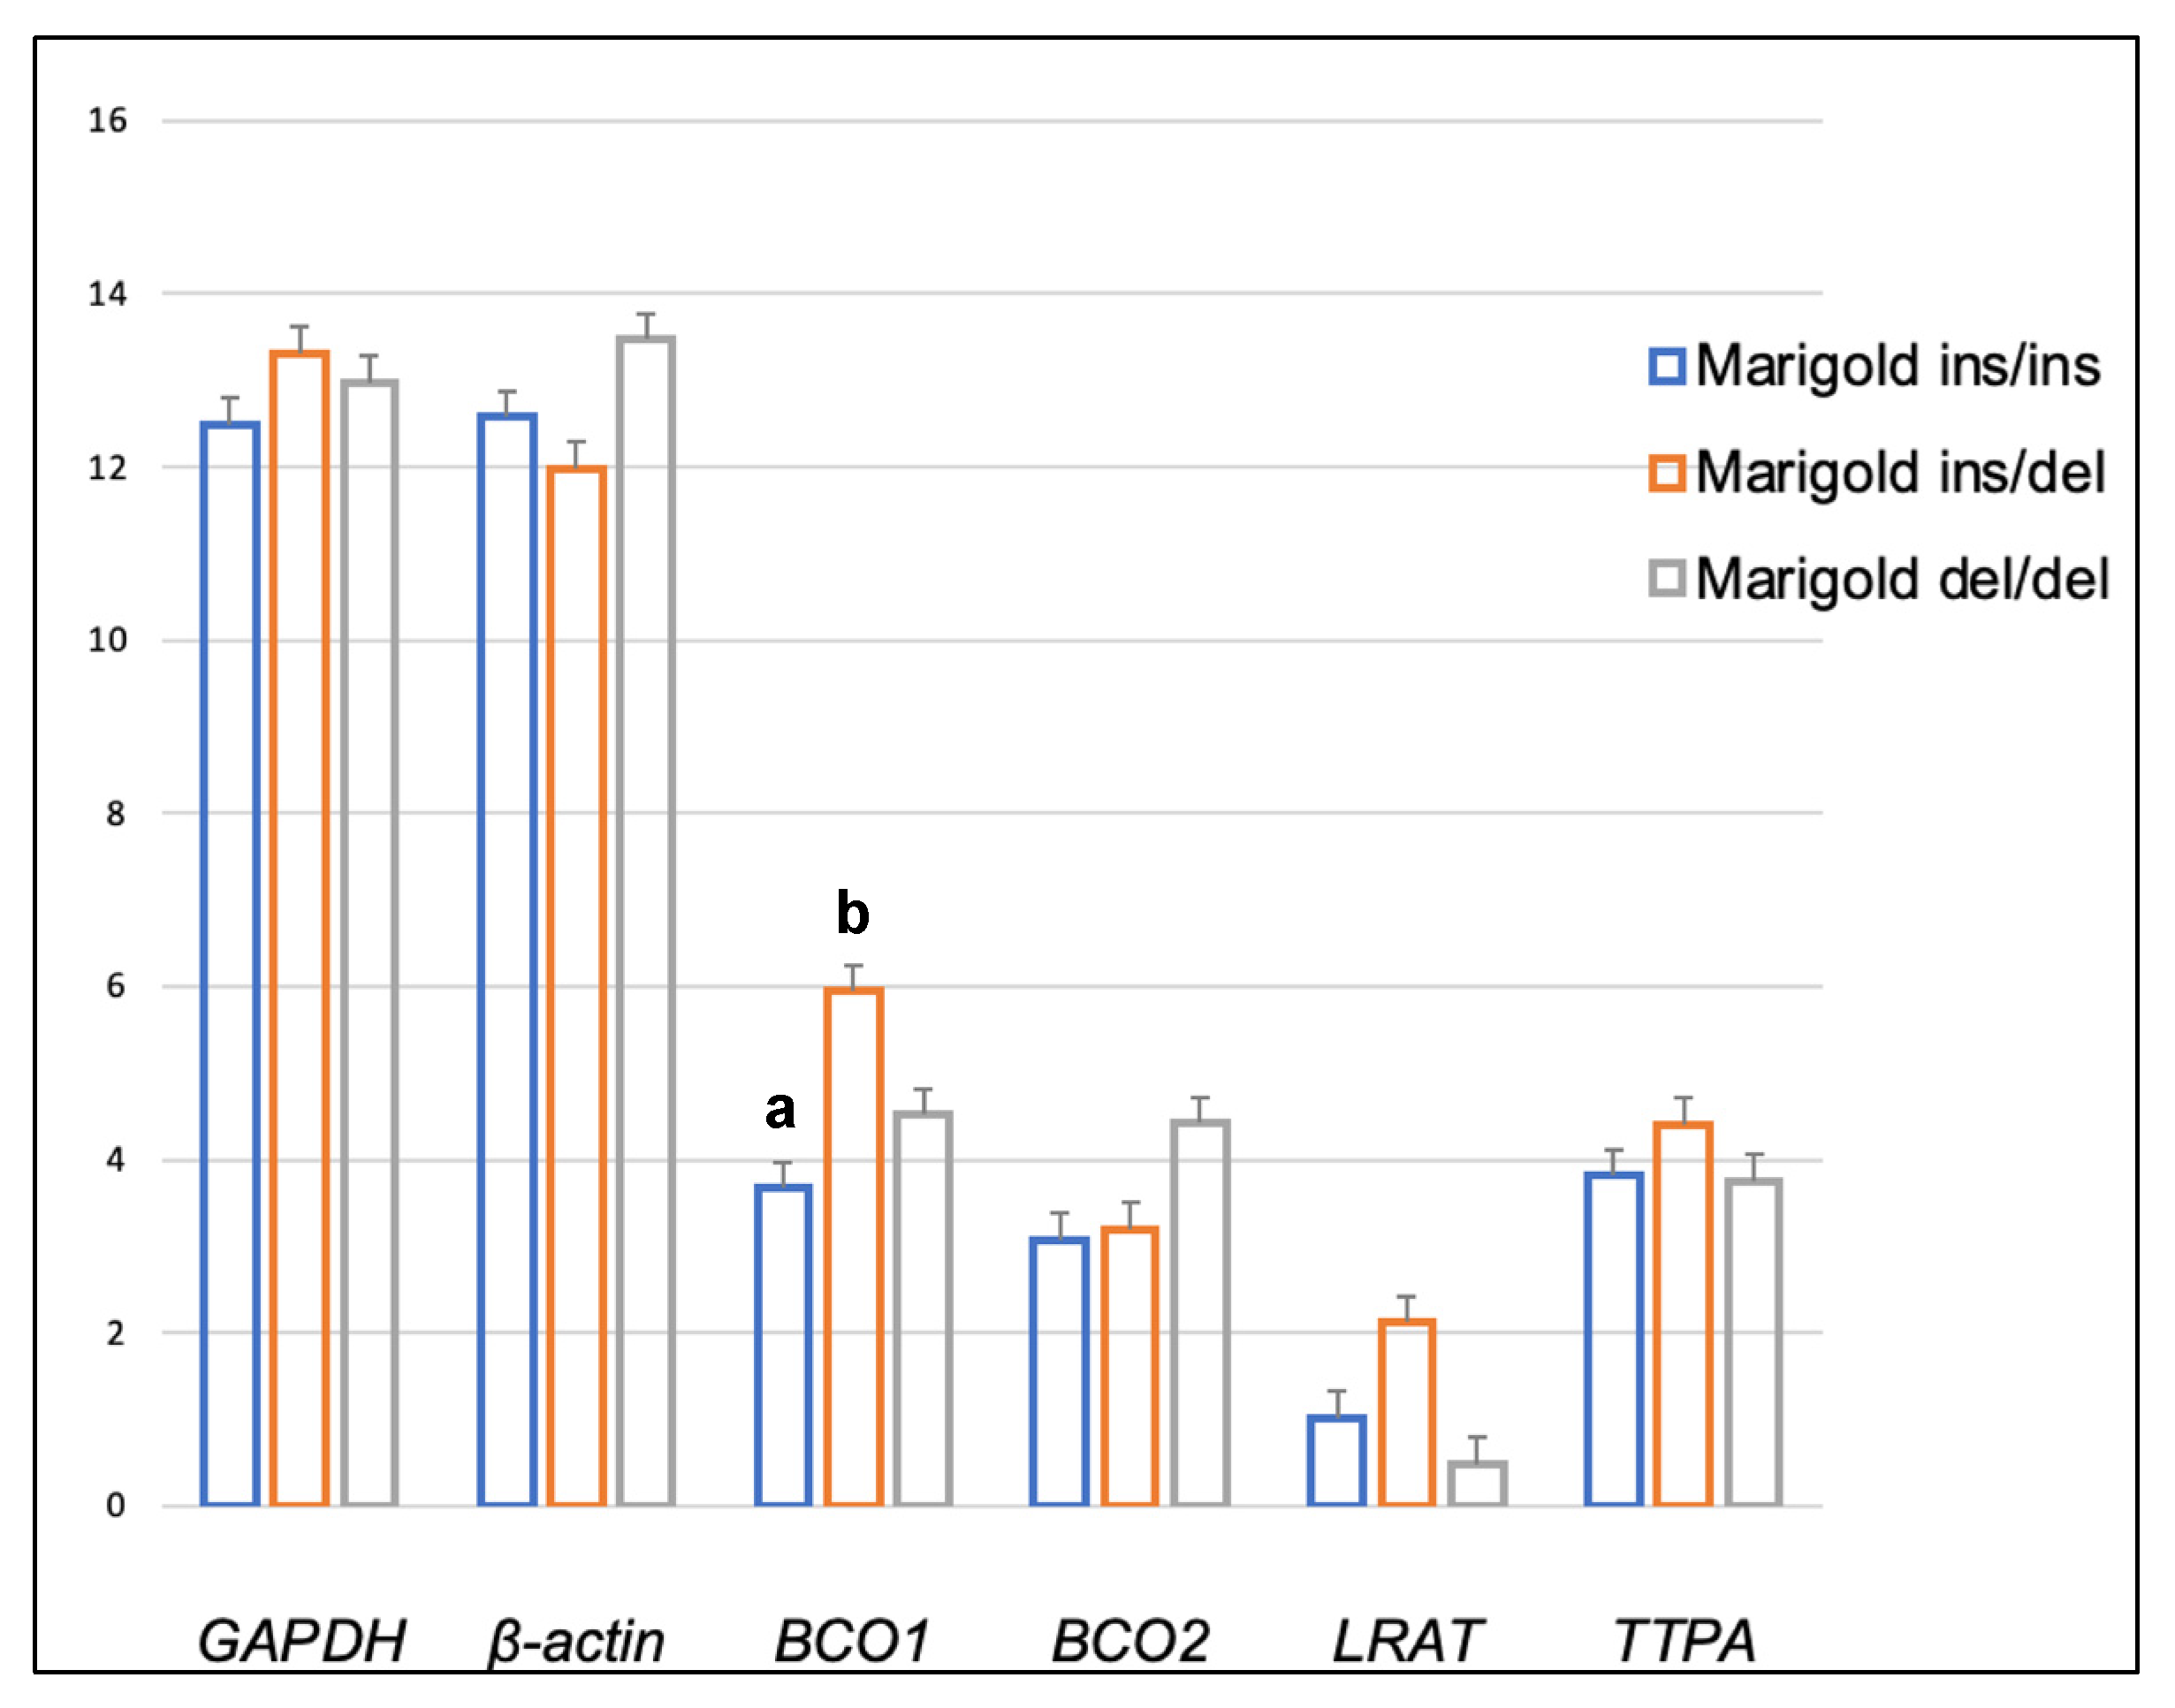
In rabbits fed the control diet, the relative expression level of the TTPA gene in the brain was higher in BCO2 ins/del than in del/del (p < 0.01) animals (Figure 5), whereas in rabbits fed the marigold-enriched diet, a higher expression level of the BCO1 gene was noted in heterozygous BCO2 ins/del individuals compared to their counterparts with the ins/ins genotype (p < 0.05) (Figure 6).
As shown in Figure 7, heterozygous BCO2 ins/del rabbits fed the fortified diet exhibited a higher expression of the LRAT gene in the brain than control group animals (p < 0.01). In turn, a higher expression of the BCO2 gene (p < 0.01) was observed in the brain of homozygous del/del rabbits from the marigold group, compared with control group animals (Figure 8).
BCO2 genotype and dietary xanthophyll concentrations affected the differentiation of carotenoid and α-tocopherol levels in the rabbits’ brains (Table 2). Animals with the BCO2 del/del genotype were characterized by higher concentrations of these micronutrients than rabbits with ins/ins and ins/del genotypes. Overall, the intergroup relationships were similar to those found in adipose tissue, but the noted differences were smaller. Marigold extract added to rabbit diets increased the differences in the levels of lutein, zeaxanthin, and β-carotene in the brain between rabbits with the BCO2 del/del genotypes and carriers of the other two genotypes. However, a lower concentration of α-tocopherol was noted in del/del rabbits fed the marigold-supplemented diet than in those fed the control diet (p < 0.01).

3. Discussion

To the best of the authors’ knowledge, this is the first study to evaluate changes in the expression levels of genes associated with the metabolism of carotenoids, vitamin A, and vitamin E in the adipose tissue and brain of rabbits. Moreover, we determined the rates of carotenoid, retinol, and α-tocopherol accumulation in the adipose tissue and, for the first time, in the brain of rabbits. The animals were allocated to three groups based on their BCO2 genotype (ins/ins, ins/del, and del/del), and then each genotype was further divided into two subgroups based on dietary lutein level (the control diet contained 21.64 mg/kg of lutein, the marigold diet contained almost 320 mg/kg of lutein).
A comparison of the expression levels of the analyzed genes in the liver [26] vs. the adipose tissue and brain of rabbits (present study) revealed certain differences. The expression level of the BCO1 gene was higher in the liver of heterozygous BCO2 ins/del rabbits fed a typical farm-made (control) diet than in the liver of ins/ins rabbits [26], whereas the differences in the expression of this gene in adipose tissue and the brain were not significant (Figure 1 and Figure 5). However, the expression of the LRAT and TTPA genes in adipose tissue varied depending on both the rabbits’ BCO2 genotype and dietary xanthophyll levels. The LRAT gene encodes an enzyme that transfers the acyl group from the sn-1 position of phosphatidylcholine to all-trans retinol, generating all-trans retinyl esters (the storage form of vitamin A) [27]. The TTPA gene encodes a transfer protein that binds α-tocopherol, with high selectivity and affinity, and transfers it between separate membranes [28]. The above genes are expressed not only in the liver but also in the brain, spleen, lung, kidneys, intestines, uterus and placenta, and peripheral tissues [29,30]. Thus, it appears that the levels of vitamins A and E in the adipose tissue and brain of rabbits could be modulated not only by the liver but also by local processes. This is natural since tissues and organs perform different functions. The liver is responsible for the synthesis of biochemicals and proteins; this excretory organ consists mostly (in 60–70%) of hepatocytes [31]. Cells of the brain, neurons, are electrically excitable and able to process and transmit information in the form of electrical signals [32]. Adipose tissue is composed of fat cells known as adipocytes. Its main role in mammals is to store energy and provide insulation. However, it should be noted that adipose tissue also participates in metabolism by secreting bioactive molecules (adipokines) including leptin, adiponectin, resistin, TNF, IL-6, IL-10, chemokine ligand 2, and TGFβ [33].
Our previous study [26] demonstrated that an increase in dietary lutein content could increase the expression of the BCO2 gene in the liver of rabbits with the BCO2 del/del genotype. Similar observations were made when the BCO2 gene expression in the brain was analyzed (Figure 8). It should be noted that in BCO2 del/del animals, dietary supplementation with marigold extract did not affect the expression level of this gene in adipose tissue, whereas the expression of BCO1, LRAT, and TTPA, increased (Figure 4). The antioxidant properties of carotenoids and vitamins A and E have been extensively researched [34], and it appears that their excess may be harmful [35]. It cannot be ruled out that the increased expression of the above genes in BCO2 del/del animals constituted a line of defense against the excessive dietary intake of antioxidant compounds. Possibly, the above genes could produce different expression patterns if the examined animals were subjected to pro-oxidative treatment. This issue may be addressed in our future research.
Previous research has shown that the concentrations of lutein and β-carotene in adipose tissue are higher in BCO2 del/del rabbits than in their counterparts with other genotypes (ins/ins and ins/del) [16,20,36]. Upon absorption, a major part of β-carotene is cleaved by BCO1, and the remaining part is either cleaved by BCO2 or accumulated in adipose tissue [13]. Therefore, functional impairment of BCO2 should be associated with an increase in both xanthophyll and β-carotene levels. Such a relationship was also observed in the present study, in adipose tissue and the brain. β-carotene is a precursor of vitamin A; therefore, its increased accumulation in the body may enhance vitamin A production, followed by its storage in adipose tissue. Elevated levels of retinol (a major form of vitamin A) in the adipose tissue of homozygous rabbits with a deletion in the BCO2 gene were observed in New Zealand Red rabbits [20,36], but not in crossbred rabbits [16]. They were not noted in the adipose tissue or the brain of Termond White rabbits in the current experiment, either. Apart from retinol, we also measured TTPA gene expression and the levels of α-tocopherol (the most biologically active form of vitamin E), because vitamins A and E are non-enzymatic antioxidants [37]. However, quite unexpectedly, higher α-tocopherol levels in the perirenal fat and brain of BCO2 del/del rabbits were not accompanied by higher retinol concentrations (Table 1 and Table 2). An absence of a simultaneous significant increase in the levels of vitamins A and E in del/del homozygous rabbits was noted in an earlier study [16,20]. The correlation between the concentrations of vitamins A and E in animals remains to be elucidated, but according to Napoli et al. [38], α-tocopherol may play an important role in tissue retinol homeostasis in rats.
A novel finding from this experiment is that in homozygous rabbits with AAT-deletion mutation at codon 248 of the BCO2 gene (BCO2 del/del), compared with their counterparts carrying other genotypes (ins/ins and ins/del), the expression of BCO2, LRAT, and TTPA genes may decrease in adipose tissue, and TTPA gene expression may decrease in the brain. Moreover, an increase in dietary lutein content in BCO2 del/del rabbits (to 320 mg/kg) may increase the expression of BCO1, LRAT, and TTPA genes in adipose tissue and the expression of the BCO2 gene in the brain. Another implication of the study is that the content of lutein, β-carotene, and α-tocopherol increases in both the adipose tissue and brain of BCO2 del/del rabbits. These findings can promote our understanding of carotenoid metabolism in rabbits as well as other animal species. The gene expression levels noted in the current study indicate that the metabolism of vitamin E, vitamin A, and carotenoids is interrelated, even if it is not reflected in the final levels of these micronutrients in the tissues or organs of animals. Due to the limitations of this study, further research should focus on rabbits of different breeds fed different diets as well as on specialized cell lines. Moreover, gene expression was determined based on only one gene from each metabolic pathway, and the obtained data are incomplete. To address this limitation, other tissues and organs and a larger number of genes involved in metabolic pathways should be analyzed.

4. Materials and Methods

All experimental procedures were approved by the Local Ethics Committee in Olsztyn, Poland (consent No. 065.12.2020), and the animals were cared for in accordance with the guidelines of the European Parliament (EC Directive 86/60963/2010 on the protection of animals used for experimental and other scientific purposes).
The rabbits used in this experiment were also involved in the feeding trial described by Strychalski et al. [26]. In brief, sixty male 35-day-old Termond White rabbits were allocated to three groups based on their genotype at codon 248 of the BCO2 gene (ins/ins, ins/del, and del/del). Each group comprised two subgroups; one subgroup (control group, n = 10) was administered a standard diet, whereas the diet offered to the other subgroup was supplemented with 6 g/kg of Aztec marigold flower extract offered as a dried powder containing 4.96% of lutein and 0.28% of zeaxanthin (marigold group, n = 10). The ingredients and chemical composition of the control diet are shown in Table S1.
The experiment lasted for 8 weeks, from weaning at 35 days of age until 91 days of age. The initial and final body weights of the rabbits were 726.1 ± 66.09 g and 2411.2 ± 210.99 g, respectively (mean ± SD). The rabbits were kept in individual wire-mesh cages, under standard management conditions. The temperature was maintained within the range of 16–18 °C, and humidity was within the range of 60–75%. The room was intensively ventilated. The photoperiod consisted of 12 h of light and 12 h of darkness.
Genotyping was performed and RNA expression was determined according to the methods described in our previous study [26]; approximately 10 g samples of perirenal fat and the right hemisphere of the brain were analyzed in the current experiment.
Chemical analyses were described earlier by Strychalski et al. [26]. Briefly, the nutrient content of the feed was determined with AOAC methods [39], and NDF was determined according to the method of Van Soest et al. [40]. The content of retinol and α-tocopherol in feed was analyzed by high-performance liquid chromatography (HPLC), in accordance with Polish Standards (PN–EN ISO 14565 2002; PN–EN ISO 6867 2002). The concentrations of retinol and α-tocopherol in animal tissues were determined as described by Hőgberg et al. [41] and Xu [42], and their levels in feed samples and the liver and blood serum of rabbits were determined by reversed-phase (RP) HPLC.
Calculations were made using R software [43]. The specialized MCMC.qpcr package was used for qPCR analyses [44]. A one-way design model was used to compare three different genotypes within the same diet, and two different diets within the same genotype. Reference genes (GAPDH and β-actin) were added as priors to the model function to account for variations in cDNA and were allowed 1.2-fold changes [44]. In charts, posterior means and standard errors of the mean (SEM) were plotted as log2-transformed abundance. The data on the content of selected compounds in the adipose tissue and brain of rabbits were processed statistically by analysis of variance (ANOVA) followed by Duncan’s multiple range test. These data are presented in the Tables as means ± standard deviations (SD).

Supplementary Materials

The following supporting information can be downloaded at: https://www.mdpi.com/article/10.3390/ijms24032304/s1, Supplement1.txt: Relative RNA expression analysis; Supplement2.docx: Table S1: Ingredients, chemical composition and energy content of the control diet; Table S2: RT-qPCR primers; Figure S1: Relative BCO1, BCO2, LRAT, and TTPA mRNA levels in the perirenal fat of rabbits fed different diets (control diet vs. diet with the addition of Aztec marigold flower extract) having ins/ins genotype at codon 248 of the BCO2 gene; Figure S2: Relative BCO1, BCO2, LRAT, and TTPA mRNA levels in the brain of rabbits fed different diets (control diet vs. diet with the addition of Aztec marigold flower extract) having ins/ins genotype at codon 248 of the BCO2 gene.

Author Contributions

Conceptualization, J.S.; methodology, J.S, E.K.-Ł., Z.A. and P.M.; software, J.S.; validation, A.G.; formal analysis, J.S. and A.G.; investigation, J.S. and A.G.; resources, J.S., A.G., E.K.-Ł. and P.M.; data curation, J.S., A.G., E.K.-Ł. and Z.A.; writing—original draft preparation, J.S, A.G. and Z.A.; writing—review and editing, J.S, A.G. and Z.A.; visualization, J.S.; supervision, J.S. and A.G.; project administration, J.S. All authors have read and agreed to the published version of the manuscript.

Funding

The project was financially supported by the Minister of Education and Science under the program entitled “Regional Initiative of Excellence” for the years 2019-2023, Project No. 010/RID/2018/19, amount of funding PLN 12 000 000.

Institutional Review Board Statement

All experimental procedures were approved by the Local Ethics Committee in Olsztyn, Poland (consent No. 065.12.2020), and the animals were cared for in accordance with the guidelines of the European Parliament (EC Directive 86/60963/2010 on the protection of animals used for experimental and other scientific purposes).

Informed Consent Statement

Not applicable.

Data Availability Statement

The authors declare that the data of this research are not deposited in an official repository and data will be available upon reasonable request.

Conflicts of Interest

The authors declare no conflict of interest.

References

  1. Kotake-Nara, E.; Nagao, A. Absorption and metabolism of xanthophylls. Mar. Drugs 2011, 9, 1024. [Google Scholar] [CrossRef] [PubMed]
  2. Milani, A.; Basirnejad, M.; Shahbazi, S.; Bolhassani, A. Carotenoids: Biochemistry, pharmacology and treatment. Br. J. Pharmacol. 2017, 174, 1290–1324. [Google Scholar] [CrossRef] [PubMed] [Green Version]
  3. Ruiz-Sola, M.A.; Rodríguez-Concepción, M. Carotenoid biosynthesis in arabidopsis: A colorful pathway. Arab. Book 2012, 10, e0158. [Google Scholar] [CrossRef] [PubMed] [Green Version]
  4. De Quirós, A.R.-B.; Costa, H.S. Analysis of carotenoids in vegetable and plasma samples: A review. J. Food Compos. Anal. 2006, 19, 97–111. [Google Scholar] [CrossRef]
  5. Stahl, W.; Sies, H. Bioactivity and protective effects of natural carotenoids. Biochim. Biophys. Acta 2005, 1740, 101–107. [Google Scholar] [CrossRef] [Green Version]
  6. Olson, J.A. Benefits and liabilities of vitamin A and carotenoids. Rev. J. Nutr. 1996, 126, 1208S–1212S. [Google Scholar] [CrossRef] [Green Version]
  7. Fiedor, J.; Burda, K. Potential role of carotenoids as antioxidants in human health and disease. Nutrients 2014, 6, 466. [Google Scholar] [CrossRef] [Green Version]
  8. Bhosale, P.; Larson, A.J.; Frederick, J.M.; Southwick, K.; Thulin, C.D.; Bernstein, P.S. Identification and characterization of a Pi isoform of glutathione S-transferase (GSTP1) as a zeaxanthinbinding protein in the macula of the human eye. J. Biol. Chem. 2004, 279, 49447–49454. [Google Scholar] [CrossRef] [Green Version]
  9. Li, B.; Vachali, P.; Frederick, J.M.; Bernstein, P.S. Identification of StARD3 as a luteinbinding protein in the macula of the primate retina. Biochemistry 2011, 50, 2541–2549. [Google Scholar] [CrossRef] [Green Version]
  10. Niu, Y.; Jin, M.; Li, Y.; Li, P.; Zhou, J.; Wang, X.; Chen, Y. Biallelic β-carotene oxygenase 2 knockout results in yellow fat in sheep via CRISPR/Cas9. Anim. Gen. 2017, 48, 242–244. [Google Scholar] [CrossRef]
  11. Borel, P. Genetic variations involved in interindividual variability in carotenoid status. Molec. Nutr. Food Res. 2012, 56, 228–240. [Google Scholar] [CrossRef] [Green Version]
  12. Lietz, G.; Oxley, A.; Boesch-Saadatmandi, C.; Kobayashi, D. Importanceof β,β-carotene 15,15′-monooxygenase 1 (BCMO1) and β,β-carotene 9′,10′-dioxygenase 2 (BCDO2) in nutrition and health. Molec. Nutr. Food Res. 2012, 56, 241–250. [Google Scholar] [CrossRef]
  13. Lietz, G.; Lange, J.; Rimbach, G. Molecular and dietary regulation of beta, beta-carotene 15,15-monooxygenase 1 (BCMO1). Arch. Biochem. Biophys. 2010, 502, 8–16. [Google Scholar] [CrossRef]
  14. Kiefer, C.; Hessel, S.; Lampert, J.M.; Vogt, K.; Lederer, M.O.; Breithaupt, D.E.; von Lintig, J. Identification and characterization of a mammalian enzyme catalyzing the asymmetric oxidative cleavage of provitamin A. J. Biol. Chem. 2001, 276, 14110–14116. [Google Scholar] [CrossRef] [Green Version]
  15. Våge, D.I.; Boman, I.A. A nonsense mutation in the betacarotene oxygenase 2 (BCO2) gene is tightly associated with accumulation of carotenoids in adipose tissue in sheep (Ovis aries). BMC Genet. 2010, 11, 10. [Google Scholar] [CrossRef] [Green Version]
  16. Strychalski, J.; Gugołek, A.; Brym, P.; Antoszkiewicz, Z.; Chwastowska-Siwiecka, I. Polymorphism of the BCO2 gene and the content of carotenoids, retinol and α-tocopherol in the liver and fat of rabbits. Braz. J. Anim. Sci. 2019, 48, e20180243. [Google Scholar] [CrossRef] [Green Version]
  17. Tian, R.; Cullen, N.G.; Morris, C.A.; Fisher, P.J.; Pitchford, W.S.; Bottema, C.D.K. Major effect of retinal short-chain dehydrogenase reductase (RDHE2) on bovine fat colour. Mamm. Genome 2012, 23, 378–386. [Google Scholar] [CrossRef]
  18. Eriksson, J.; Larson, G.; Gunnarsson, U.; Bed’hom, B.; Tixier-Boichard, M.; Strömstedt, L.; Wright, D.; Jungerius, A.; Vereijken, A.; Randi, E.; et al. Identification of the yellow skin gene reveals a hybrid origin of the domestic chicken. PLoS Genet. 2008, 4, e1000010. [Google Scholar] [CrossRef] [Green Version]
  19. Strychalski, J.; Brym, P.; Czarnik, U.; Gugołek, A. A novel AAT-deletion mutation in the coding sequence of the BCO2 gene in yellow-fat rabbits. J. Appl. Gen. 2015, 56, 535–537. [Google Scholar] [CrossRef]
  20. Strychalski, J.; Gugołek, A.; Brym, P.; Antoszkiewicz, Z. Effect of the β-carotene oxygenase 2 genotype on the content of carotenoids, retinol and α-tocopherol in the liver, fat and milk of rabbit does, reproduction parameters and kitten growth. J. Anim. Phys. Anim. Nutr. 2019, 103, 1585–1593. [Google Scholar] [CrossRef]
  21. Abdul-Wasea, A.A.; Khalid, M. Elhindi. Alleviation of drought stress of marigold (Tagetes erecta) plants by using arbuscular mycorrhizal fungi. Saudi J. Biol. Sci. 2011, 18, 93–98. [Google Scholar] [CrossRef] [Green Version]
  22. Piccaglia, R.; Marotti, M.; Grandi, S. Lutein and lutein ester content in different types of Tagetes patula and T. erecta. Ind. Crops Prod. 1998, 8, 45–51. [Google Scholar] [CrossRef]
  23. Tanaka, Y.; Sasaki, N.; Ohmiya, A. Biosynthesis of plant pigments: Anthocyanins, betalains and carotenoids. Plant J. 2008, 54, 733–749. [Google Scholar] [CrossRef] [PubMed]
  24. Sun, B.; Zhang, Y.; Ding, M.; Xi, Q.; Liu, G.; Li, Y.; Liu, D.; Chen, X. Effects of Moringa oleifera leaves as a substitute for alfalfa meal on nutrient digestibility, growth performance, carcass trait, meat quality, antioxidant capacity and biochemical parameters of rabbits. J. Anim. Physiol. Anim. Nutr. 2018, 102, 194–203. [Google Scholar] [CrossRef] [PubMed]
  25. Prache, S.; Priolo, A.; Grolier, P. Persistence of carotenoid pigments in the blood of concentrate-finished grazing sheep: Its significance for the traceability of grass-feeding. J. Anim. Sci. 2003, 81, 360–367. [Google Scholar] [CrossRef]
  26. Strychalski, J.; Gugołek, A.; Antoszkiewicz, Z.; Fopp-Bayat, D.; Kaczorek-Łukowska, E.; Snarska, A.; Zwierzchowski, G.; Król-Grzymała, A.; Matusevičius, P. The Effect of the BCO2 Genotype on the Expression of Genes Related to Carotenoid, Retinol, and α-Tocopherol Metabolism in Rabbits Fed a Diet with Aztec Marigold Flower Extract. Int. J. Mol. Sci. 2022, 23, 10552. [Google Scholar] [CrossRef]
  27. Ruiz, A.; Winston, A.; Lim, Y.H.; Gilbert, B.A.; Rando, R.R.; Bok, D. Molecular and biochemical characterization of lecithin retinol acyltransferase. J. Biol. Chem. 1999, 274, 3834–3841. [Google Scholar] [CrossRef] [Green Version]
  28. Arita, M.; Sato, Y.; Miyata, A.; Tanabe, T.; Takahashi, E.; Kayden, H.J.; Arai, H.; Inoue, K. Human alpha-tocopherol transfer protein: cDNA cloning, expression and chromosomal localization. Biochem. J. 1995, 306, 437–443. [Google Scholar] [CrossRef]
  29. Koh, M.; Takitani, K.; Miyazaki, H.; Yamaoka, S.; Tamai, H. Liver X receptor up-regulates α-tocopherol transfer protein expression and α-tocopherol status. J. Nutr. Biochem. 2013, 24, 2158–2167. [Google Scholar] [CrossRef]
  30. Liang, X.; Chen, M.; Wang, D.; Wen, J.; Chen, J. Vitamin A deficiency indicating as low expression of LRAT may be a novel biomarker of primary hypertension. Clin. Exp. Hypertens 2021, 43, 151–163. [Google Scholar] [CrossRef]
  31. Buechter, M.; Gerken, G. Liver function—How to screen and to diagnose: Insights from personal experiences, controlled clinical studies and future perspectives. J. Pers. Med. 2022, 12, 1657. [Google Scholar] [CrossRef]
  32. Terenzio, M.; Schiavo, G.; Fainzilber, M. Compartmentalized signaling in neurons: From cell biology to neuroscience. Neuron 2017, 96, 667–679. [Google Scholar] [CrossRef]
  33. Pereira, S.; Alvarez-Leite, J. Adipokines: Biological functions and metabolically healthy obese profile. J. Recept. Ligand Channel Res. 2014, 7, 15–25. [Google Scholar] [CrossRef] [Green Version]
  34. Fang, Y.Z.; Yang, S.; Wu, G. Free radicals, antioxidants, and nutrition. Nutrition 2002, 18, 872–879. [Google Scholar] [CrossRef]
  35. Rafieian-Kopaei, M.; Baradaran, A.; Rafieian, M. Oxidative stress and the paradoxical effects of antioxidants. J. Res. Med. Sci. 2013, 18, 628. [Google Scholar]
  36. Strychalski, J.; Gugołek, A.; Antoszkiewicz, Z.; Kowalska, D.; Konstantynowicz, M. Biologically active compounds in selected tissues of white-fat and yellow-fat rabbits and their production performance parameters. Livest. Sci. 2016, 183, 92–97. [Google Scholar] [CrossRef]
  37. Zwolińska, D.; Grzeszczak, W.; Szczepańska, M.; Kiliś-Pstrusińska, K.; Szprynger, K. Vitamins A, E and C as non-enzymatic antioxidants and their relation to lipid peroxidation in children with chronic renal failure. Nephron Clin. Pract. 2006, 103, 12–18. [Google Scholar] [CrossRef]
  38. Napoli, J.L.; McCormick, A.M.; O’Meara, B.; Dratz, E.A. Vitamin A metabolism: α-tocopherol modulates tissue retinol levels in vivo, and retinyl palmitate hydrolysis in vitro. Arch. Biochem. Biophys. 1984, 230, 194–202. [Google Scholar] [CrossRef]
  39. AOAC International. Official Methods of Analysis, 18th ed.; Association of Analytical Communities: Arlington, VA, USA, 2006. [Google Scholar]
  40. Van Soest, P.J.; Robertson, J.B.; Lewis, B.A. Methods for dietary fibre, neutral detergent fibre and non-starch polysaccharides in relation to animal nutrition. J. Dairy Sci. 1991, 74, 3583–3597. [Google Scholar] [CrossRef]
  41. Högberg, A.; Pickova, J.; Babol, J.; Andersson, K.; Dutta, P.C. Muscle lipids, vitamins E and A, and lipid oxidation as affected by diet and RN genotype in female and castrated male Hampshire crossbreed pigs. Meat Sci. 2002, 60, 411–420. [Google Scholar] [CrossRef]
  42. Xu, Z. Comparison of extraction methods for quantifying vitamin E from animal tissues. Bioresour. Technol. 2008, 99, 8705–8709. [Google Scholar] [CrossRef] [PubMed]
  43. R Core Team. R: A Language and Environment for Statistical Computing, R Foundation for Statistical Computing: Vienna, Austria. 2021. Available online: https://www.R-project.org/ (accessed on 10 December 2021).
  44. Matz, M.V.; Wright, R.M.; Scott, J.G. No control genes required: Bayesian analysis of qRT-PCR data. PLoS One 2013, 8, e71448. [Google Scholar] [CrossRef] [PubMed]
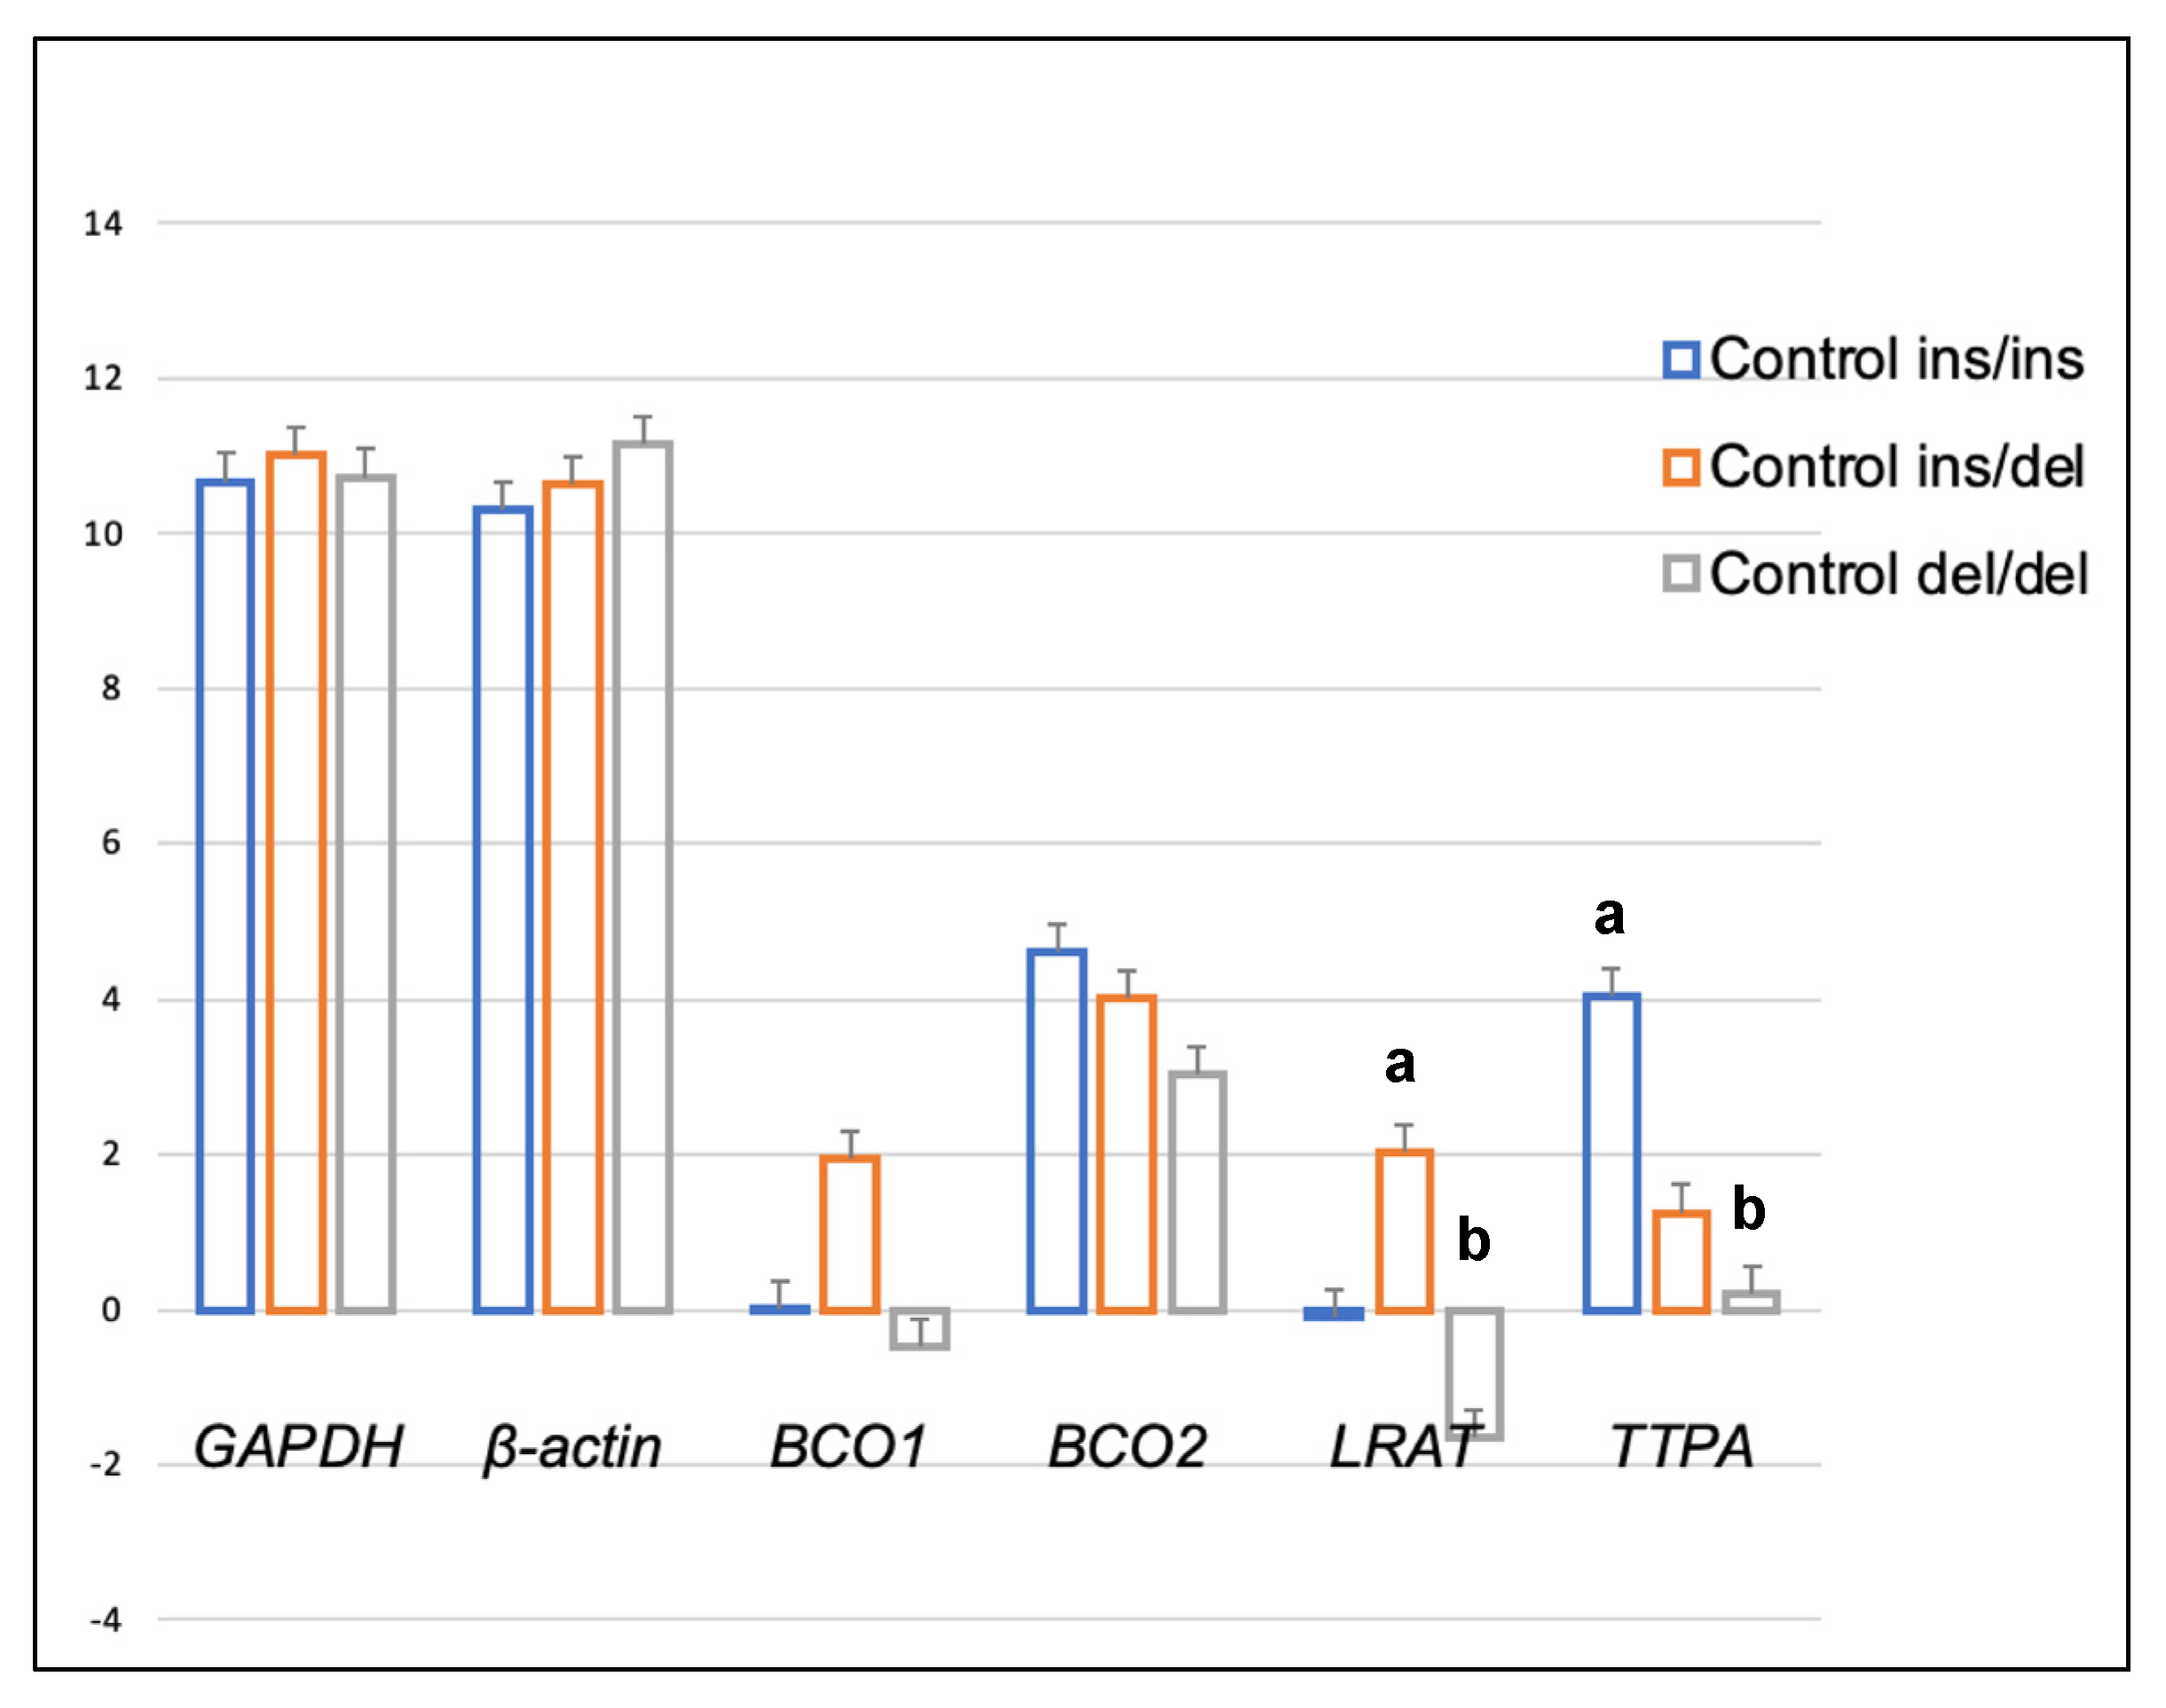
Figure 1. Relative BCO1, BCO2, LRAT, and TTPA mRNA levels (log2 abundance) in the perirenal fat of rabbits with different genotypes at codon 248 of the BCO2 gene (ins/ins vs. ins/del vs. del/del) fed the control diet. GAPDH and ß-actin were used as reference genes. Data represent posterior means (expressed as arbitrary units) ± SEM (standard error of the mean). Means followed by the different superscripts (a, b) differ significantly (p ≤ 0.05).
Ijms 24 02304 g001
Figure 2. Relative BCO1, BCO2, LRAT, and TTPA mRNA levels (log2 abundance) in the perirenal fat of rabbits with different genotypes at codon 248 of the BCO2 gene (ins/ins vs. ins/del vs. del/del) fed a diet with the addition of Aztec marigold flower extract. GAPDH and ß-actin were used as reference genes. Data represent posterior means (expressed as arbitrary units) ± SEM (standard error of the mean). Means within a row followed by the different superscripts (A, B) differ highly significantly (p ≤ 0.01).
Ijms 24 02304 g002
Figure 3. Relative BCO1, BCO2, LRAT, and TTPA mRNA levels (log2 abundance) in the perirenal fat of rabbits with the ins/del genotype at codon 248 of the BCO2 gene, fed different diets (control diet vs. a diet with the addition of Aztec marigold flower extract). GAPDH and ß-actin were used as reference genes. Data represent posterior means (expressed as arbitrary units) ± SEM (standard error of the mean). Means followed by the different superscripts (A, B) differ highly significantly (p ≤ 0.01).
Ijms 24 02304 g003
Figure 4. Relative BCO1, BCO2, LRAT, and TTPA mRNA levels (log2 abundance) in the perirenal fat of rabbits with the del/del genotype at codon 248 of the BCO2 gene, fed different diets (control diet vs. a diet with the addition of Aztec marigold flower extract). GAPDH and ß-actin were used as reference genes. Data represent posterior means (expressed as arbitrary units) ± SEM (standard error of the mean). Means followed by the different superscripts (A, B) differ highly significantly (p ≤ 0.01). Means followed by the different superscripts (a, b) differ significantly (p ≤ 0.05).
Ijms 24 02304 g004
Figure 5. Relative BCO1, BCO2, LRAT, and TTPA mRNA levels (log2 abundance) in the brain of rabbits with different genotypes at codon 248 of the BCO2 gene (ins/ins vs. ins/del vs. del/del) fed the control diet. GAPDH and ß-actin were used as reference genes. Data represent posterior means (expressed as arbitrary units) ± SEM (standard error of the mean). Means followed by the different superscripts (A, B) differ highly significantly (p ≤ 0.01).
Ijms 24 02304 g005
Figure 6. Relative BCO1, BCO2, LRAT, and TTPA mRNA levels (log2 abundance) in the brain of rabbits with different genotypes at codon 248 of the BCO2 gene (ins/ins vs. ins/del vs. del/del) fed a diet with the addition of Aztec marigold flower extract. GAPDH and ß-actin were used as reference genes. Data represent posterior means (expressed as arbitrary units) ± SEM (standard error of the mean). Means followed by the different superscripts (a, b) differ significantly (p ≤ 0.05).
Ijms 24 02304 g006
Figure 7. Relative BCO1, BCO2, LRAT, and TTPA mRNA levels (log2 abundance) in the brain of rabbits with the ins/del genotype at codon 248 of the BCO2 gene, fed different diets (control diet vs. a diet with the addition of Aztec marigold flower extract). GAPDH and ß-actin were used as reference genes. Data represent posterior means (expressed as arbitrary units) ± SEM (standard error of the mean). Means followed by the different superscripts (A, B) differ highly significantly (p ≤ 0.01).
Ijms 24 02304 g007
Figure 8. Relative BCO1, BCO2, LRAT, and TTPA mRNA levels (log2 abundance) in the brain of rabbits with the del/del genotype at codon 248 of the BCO2 gene, fed different diets (control diet vs. a diet with the addition of Aztec marigold flower extract). GAPDH and ß-actin were used as reference genes. Data represent posterior means (expressed as arbitrary units) ± SEM (standard error of the mean). Means followed by the different superscripts (A, B) differ highly significantly (p ≤ 0.01).
Ijms 24 02304 g008
Table 1. Content of selected compounds in the perirenal fat (μg/g) of rabbits (mean ± SD).
CompoundDietBCO2 Genotypesp-Value
ins/insins/deldel/del
LuteinControl0.06±0.05 A0.07±0.07 A0.58±0.24 B<0.001
Marigold0.04±0.02 A0.05±0.05 A5.37±3.16 B<0.001
p-value 0.3040.655<0.001
ZeaxanthinControl0.01±0.01 A0.01±0.01 A0.05±0.04 B<0.001
Marigold0.01±0.01 A0.01±0.01 A0.57±0.40 B<0.001
p-value 0.0930.031<0.001
β-caroteneControl0.08±0.04 A0.13±0.07 a0.25±0.14 Bb<0.001
Marigold0.08±0.04 A0.08±0.03 A0.56±0.39 B<0.001
p-value 0.8540.2190.034
RetinolControl6.48±3.896.01±5.417.03±6.150.772
Marigold6.19±4.826.39±6.556.80±4.780.965
p-value 0.8860.8640.851
α-tocopherolControl4.02±2.33 A6.90±3.319.63±4.99 B0.009
Marigold6.65±3.81 a7.60±4.15 a13.32±6.34 b0.011
p-value 0.0790.6160.165
Means within a row followed by the different superscripts (A, B) differ highly significantly (p ≤ 0.01). Means within a row followed by the different superscripts (a, b) differ significantly (p ≤ 0.05).
Table 2. Content of selected compounds in the brain (μg/g) of rabbits (mean ± SD).
CompoundDietBCO2 Genotypesp-Value
ins/insins/deldel/del
LuteinControl0.15±0.05A0.15±0.07A0.66±0.47B<0.001
Marigold0.18±0.18A0.26±0.16A1.89±1.39B<0.001
p-value 0.6620.0540.016
ZeaxanthinControl0.02±0.01a0.01±0.01A0.04±0.02Bb<0.001
Marigold0.01±0.01A0.01±0.01A0.21±0.20B<0.001
p-value 0.1530.542<0.001
β-caroteneControl0.06±0.04a0.09±0.050.13±0.06b0.019
Marigold0.07±0.03A0.07±0.04A0.21±0.11B<0.001
p-value 0.5200.3200.074
RetinolControl0.33±0.240.28±0.220.39±0.370.691
Marigold0.53±0.280.68±0.460.73±0.460.455
p-value 0.1000.0250.052
α-tocopherolControl0.00±0.00A0.00±0.00A0.04±0.02B<0.001
Marigold0.00±0.00A0.00±0.00A0.02±0.01B<0.001
p-value 0.9380.9640.002
Means within a row followed by the different superscripts (A, B) differ highly significantly (p ≤ 0.01). Means within a row followed by the different superscripts (a, b) differ significantly (p ≤ 0.05).
Disclaimer/Publisher’s Note: The statements, opinions and data contained in all publications are solely those of the individual author(s) and contributor(s) and not of MDPI and/or the editor(s). MDPI and/or the editor(s) disclaim responsibility for any injury to people or property resulting from any ideas, methods, instructions or products referred to in the content.