
Serum Myostatin among Excessive Drinkers

 , ,
, ,
Abstract
:1. Introduction
2. Results
2.1. Ethanol Ingestion
2.2. Liver Function
2.3. Body Composition
3. Discussion
4. Materials and Methods
4.1. Laboratory Assessment: Myostatin
4.2. Body Composition
4.3. Statistics
5. Conclusions
Author Contributions
Funding
Institutional Review Board Statement
Informed Consent Statement
Data Availability Statement
Acknowledgments
Conflicts of Interest
References
- Ilich, J.Z.; Gilman, J.C.; Cvijetic, S.; Boschiero, D. Chronic Stress Contributes to Osteosarcopenic Adiposity via Inflammation and Immune Modulation: The Case for More Precise Nutritional Investigation. Nutrients 2020, 12, 989. [Google Scholar] [CrossRef] [PubMed]
- Ilich, J.Z.; Kelly, O.J.; Inglis, J.E.; Panton, L.B.; Duque, G.; Ormsbee, M.J. Interrelationship among Muscle, Fat, and Bone: Connecting the Dots on Cellular, Hormonal, and Whole Body Levels. Ageing Res. Rev. 2014, 15, 51–60. [Google Scholar] [CrossRef]
- Hirschfeld, H.P.; Kinsella, R.; Duque, G. Osteosarcopenia: Where Bone, Muscle, and Fat Collide. Osteoporos. Int. 2017, 28, 2781–2790. [Google Scholar] [CrossRef] [PubMed]
- Oh, S.; Lee, J. Sarcopenia and Blood Myokine Levels as Prognostic Biomarkers in Patients with Liver Cirrhosis or Hepatocellular Carcinoma. Clin. Mol. Hepatol 2020, 26, 476–479. [Google Scholar] [CrossRef]
- Rolland, Y.; van Kan, G.A.; Gillette-Guyonnet, S.; Vellas, B. Cachexia versus Sarcopenia. Curr. Opin. Clin. Nutr. Metab. Care 2011, 14, 15–21. [Google Scholar] [CrossRef]
- Fielding, R.A.; Vellas, B.; Evans, W.J.; Bhasin, S.; Morley, J.E.; Newman, A.B.; Abellan van Kan, G.; Andrieu, S.; Bauer, J.; Breuille, D.; et al. Sarcopenia: An Undiagnosed Condition in Older Adults. Current Consensus Definition: Prevalence, Etiology, and Consequences. International Working Group on Sarcopenia. J. Am. Med. Dir. Assoc. 2011, 12, 249–256. [Google Scholar] [CrossRef] [PubMed]
- Duane, P.; Peters, T.J. Nutritional Status in Alcoholics with and without Chronic Skeletal Muscle Myopathy. Alcohol Alcohol. 1988, 23, 271–277. [Google Scholar]
- Preedy, V.R.; Ohlendieck, K.; Adachi, J.; Koll, M.; Sneddon, A.; Hunter, R.; Rajendram, R.; Mantle, D.; Peters, T.J. The Importance of Alcohol-Induced Muscle Disease. J. Muscle Res. Cell Motil. 2003, 24, 55–63. [Google Scholar] [CrossRef]
- Dasarathy, J.; McCullough, A.J.; Dasarathy, S. Sarcopenia in Alcoholic Liver Disease: Clinical and Molecular Advances. Alcohol. Clin. Exp. Res. 2017, 41, 1419–1431. [Google Scholar] [CrossRef]
- Traversy, G.; Chaput, J.P. Alcohol Consumption and Obesity: An Update. Curr. Obes. Rep. 2015, 4, 122–130. [Google Scholar] [CrossRef]
- Simon, L.; Jolley, S.E.; Molina, P.E. Alcoholic Myopathy: Pathophysiologic Mechanisms and Clinical Implications. Alcohol Res. 2017, 38, 207. [Google Scholar] [PubMed]
- Pascual-Fernández, J.; Fernández-Montero, A.; Córdova-Martínez, A.; Pastor, D.; Martínez-Rodríguez, A.; Roche, E. Sarcopenia: Molecular Pathways and Potential Targets for Intervention. Int. J. Mol. Sci 2020, 21, 8844. [Google Scholar] [CrossRef] [PubMed]
- Yang, Y.J.; Kim, D.J. An Overview of the Molecular Mechanisms Contributing to Musculoskeletal Disorders in Chronic Liver Disease: Osteoporosis, Sarcopenia, and Osteoporotic Sarcopenia. Int. J. Mol. Sci 2021, 22, 2604. [Google Scholar] [CrossRef] [PubMed]
- Qiu, J.; Thapaliya, S.; Runkana, A.; Yang, Y.; Tsien, C.; Mohan, M.L.; Narayanan, A.; Eghtesad, B.; Mozdziak, P.E.; McDonald, C.; et al. Hyperammonemia in Cirrhosis Induces Transcriptional Regulation of Myostatin by an NF-ΚB-Mediated Mechanism. Proc. Natl. Acad. Sci. USA 2013, 110, 18162–18167. [Google Scholar] [CrossRef]
- Suh, J.; Lee, Y.S. Myostatin Inhibitors: Panacea or Predicament for Musculoskeletal Disorders? J. Bone Metab. 2020, 27, 151–165. [Google Scholar] [CrossRef]
- Sato, S.; Namisaki, T.; Murata, K.; Fujimoto, Y.; Takeda, S.; Enomoto, M.; Shibamoto, A.; Ishida, K.; Ogawa, H.; Takagi, H.; et al. The Association between Sarcopenia and Endotoxin in Patients with Alcoholic Cirrhosis. Medicine 2021, 100, e27212. [Google Scholar] [CrossRef]
- Alexopoulus, T.; Vasilieva, L.; Kontogianni, M.D.; Tenta, R.; Georgiou, A.; Stroumpouli, E.; Mani, I.; Alexopoulou, A. Myostatin in Combination with Creatine Phosphokinase or Albumin May Differentiate Patients with Cirrhosis and Sarcopenia. Am. J. Physiol. Gastrointest. Liver Physiol. 2021, 321, G543–G551. [Google Scholar] [CrossRef]
- Nishikawa, H.; Enomoto, H.; Ishii, A.; Iwata, Y.; Miyamoto, Y.; Ishii, N.; Yuri, Y.; Hasegawa, K.; Nakano, C.; Nishimura, T.; et al. Elevated Serum Myostatin Level Is Associated with Worse Survival in Patients with Liver Cirrhosis. J. Cachexia Sarcopenia Muscle 2017, 8, 915–925. [Google Scholar] [CrossRef]
- Stolz, L.E.; Li, D.; Qadri, A.; Jalenak, M.; Klaman, L.D.; Tobin, J.F. Administration of Myostatin Does Not Alter Fat Mass in Adult Mice. Diabetes Obes. Metab. 2008, 10, 135–142. [Google Scholar] [CrossRef]
- Deng, B.; Zhang, F.; Wen, J.; Ye, S.; Wang, L.; Yang, Y.; Gong, P.; Jiang, S. The Function of Myostatin in the Regulation of Fat Mass in Mammals. Nutr. Metab. (Lond.) 2017, 14, 2–7. [Google Scholar] [CrossRef]
- Pan, H.; Ping, X.-C.; Zhu, H.-J.; Gong, F.-Y.; Dong, C.-X.; Li, N.-S.; Wang, L.-J.; Yang, H.-B. Association of Myostatin Gene Polymorphisms with Obesity in Chinese North Han Human Subjects. Gene 2012, 494, 237–241. [Google Scholar] [CrossRef]
- Amor, M.; Itariu, B.K.; Moreno-Viedma, V.; Keindl, M.; Jürets, A.; Prager, G.; Langer, F.; Grablowitz, V.; Zeyda, M.; Stulnig, T.M. Serum Myostatin Is Upregulated in Obesity and Correlates with Insulin Resistance in Humans. Exp. Clin. Endocrinol. Diabetes 2019, 127, 550–556. [Google Scholar] [CrossRef]
- Carvalho, L.P.; Basso-Vanelli, R.P.; di Thommazo-Luporini, L.; Mendes, R.G.; Oliveira-Junior, M.C.; Vieira, R.d.P.; Bonjorno-Junior, J.C.; Oliveira, C.R.; Luporini, R.; Borghi-Silva, A. Myostatin and Adipokines: The Role of the Metabolically Unhealthy Obese Phenotype in Muscle Function and Aerobic Capacity in Young Adults. Cytokine 2018, 107, 118–124. [Google Scholar] [CrossRef]
- Scimeca, M.; Piccirilli, E.; Mastrangeli, F.; Rao, C.; Feola, M.; Orlandi, A.; Gasbarra, E.; Bonanno, E.; Tarantino, U. Bone Morphogenetic Proteins and Myostatin Pathways: Key Mediator of Human Sarcopenia. J. Transl. Med. 2017, 15, 34. [Google Scholar] [CrossRef]
- Polyzos, S.A.; Margioris, A.N. Sarcopenic Obesity. Hormones (Athens) 2018, 17, 321–331. [Google Scholar] [CrossRef]
- Baczek, J.; Silkiewicz, M.; Wojszel, Z.B. Myostatin as a Biomarker of Muscle Wasting and Other Pathologies-State of the Art and Knowledge Gaps. Nutrients 2020, 12, 2401. [Google Scholar] [CrossRef]
- Malla, J.; Zahra, A.; Venugopal, S.; Selvamani, T.Y.; Shoukrie, S.I.; Selvaraj, R.; Dhanoa, R.K.; Hamouda, R.K.; Mostafa, J. What Role Do Inflammatory Cytokines Play in Cancer Cachexia? Cureus 2022, 14, e26798. [Google Scholar] [CrossRef]
- McFarlane, C.; Hui, G.Z.; Amanda, W.Z.W.; Lau, H.Y.; Lokireddy, S.; Ge, X.; Mouly, V.; Butler-Browne, G.; Gluckman, P.D.; Sharma, M.; et al. Human Myostatin Negatively Regulates Human Myoblast Growth and Differentiation. Am. J. Physiol. Cell Physiol. 2011, 301, C195–C203. [Google Scholar] [CrossRef]
- Gonzalez-Reimers, E.; Santolaria-Fernandez, F.; Martin-Gonzalez, M.C.; Fernandez-Rodriguez, C.M.; Quintero-Platt, G. Alcoholism: A Systemic Proinflammatory Condition. World J. Gastroenterol. 2014, 20, 14660–14671. [Google Scholar] [CrossRef]
- Ji, Y.; Li, M.; Chang, M.; Liu, R.; Qiu, J.; Wang, K.; Deng, C.; Shen, Y.; Zhu, J.; Wang, W.; et al. Inflammation: Roles in Skeletal Muscle Atrophy. Antioxidants 2022, 11, 1686. [Google Scholar] [CrossRef]
- Alvarez, A.M.; DeOcesano-Pereira, C.; Teixeira, C.; Moreira, V. IL-1β and TNF-α Modulation of Proliferated and Committed Myoblasts: IL-6 and COX-2-Derived Prostaglandins as Key Actors in the Mechanisms Involved. Cells 2020, 9, 2005. [Google Scholar] [CrossRef] [PubMed]
- Tsien, C.; Davuluri, G.; Singh, D.; Allawy, A.; ten Have, G.A.M.; Thapaliya, S.; Schulze, J.M.; Barnes, D.; McCullough, A.J.; Engelen, M.P.K.J.; et al. Metabolic and Molecular Responses to Leucine-Enriched Branched Chain Amino Acid Supplementation in the Skeletal Muscle of Alcoholic Cirrhosis. Hepatology 2015, 61, 2018–2029. [Google Scholar] [CrossRef] [PubMed]
- García, P.S.; Cabbabe, A.; Kambadur, R.; Nicholas, G.; Csete, M. Brief-Reports: Elevated Myostatin Levels in Patients with Liver Disease: A Potential Contributor to Skeletal Muscle Wasting. Anesth. Analg. 2010, 111, 707–709. [Google Scholar] [CrossRef] [PubMed]
- Delogu, W.; Caligiuri, A.; Provenzano, A.; Rosso, C.; Bugianesi, E.; Coratti, A.; Macias-Barragan, J.; Galastri, S.; di Maira, G.; Marra, F. Myostatin Regulates the Fibrogenic Phenotype of Hepatic Stellate Cells via C-Jun N-Terminal Kinase Activation. Dig. Liver Dis. 2019, 51, 1400–1408. [Google Scholar] [CrossRef] [PubMed]
- Lin, J.; Arnold, H.B.; Della-Fera, M.A.; Azain, M.J.; Hartzell, D.L.; Baile, C.A. Myostatin Knockout in Mice Increases Myogenesis and Decreases Adipogenesis. Biochem. Biophys. Res. Commun. 2002, 291, 701–706. [Google Scholar] [CrossRef]
- Artaza, J.N.; Bhasin, S.; Magee, T.R.; Reisz-Porszasz, S.; Shen, R.; Groome, N.P.; Meerasahib, M.F.; Gonzalez-Cadavid, N.F. Myostatin Inhibits Myogenesis and Promotes Adipogenesis in C3H 10T(1/2) Mesenchymal Multipotent Cells. Endocrinology 2005, 146, 3547–3557. [Google Scholar] [CrossRef]
- Guo, W.; Flanagan, J.; Jasuja, R.; Kirkland, J.; Jiang, L.; Bhasin, S. The Effects of Myostatin on Adipogenic Differentiation of Human Bone Marrow-Derived Mesenchymal Stem Cells Are Mediated through Cross-Communication between Smad3 and Wnt/Beta-Catenin Signaling Pathways. J. Biol. Chem. 2008, 283, 9136–9145. [Google Scholar] [CrossRef]
- Lei, H.; Yu, B.; Yang, X.; Liu, Z.; Huang, Z.; Mao, X.; Tian, G.; He, J.; Han, G.; Chen, H.; et al. Inhibition of Adipogenic Differentiation by Myostatin Is Alleviated by Arginine Supplementation in Porcine-Muscle-Derived Mesenchymal Stem Cells. Sci. China Life Sci. 2011, 54, 908–916. [Google Scholar] [CrossRef]
- Dong, J.; Dong, Y.; Dong, Y.; Chen, F.; Mitch, W.E.; Zhang, L. Inhibition of Myostatin in Mice Improves Insulin Sensitivity via Irisin-Mediated Cross Talk between Muscle and Adipose Tissues. Int. J. Obes. (Lond) 2016, 40, 434–442. [Google Scholar] [CrossRef]
- Allen, D.L.; Hittel, D.S.; McPherron, A.C. Expression and Function of Myostatin in Obesity, Diabetes, and Exercise Adaptation. Med. Sci. Sports Exerc. 2011, 43, 1828–1835. [Google Scholar] [CrossRef]
- Czaja, W.; Nakamura, Y.K.; Li, N.; Eldridge, J.A.; DeAvila, D.M.; Thompson, T.B.; Rodgers, B.D. Myostatin Regulates Pituitary Development and Hepatic IGF1. Am. J. Physiol. Endocrinol. Metab. 2019, 316, E1036–E1049. [Google Scholar] [CrossRef]
- Aguirre, G.A.; de Ita, J.R.; de la Garza, R.G.; Castilla-Cortazar, I. Insulin-like Growth Factor-1 Deficiency and Metabolic Syndrome. J. Transl. Med. 2016, 14, 3. [Google Scholar] [CrossRef]
- Li, Y.; Zhang, F.; Modrak, S.; Little, A.; Zhang, H. Chronic Alcohol Consumption Enhances Skeletal Muscle Wasting in Mice Bearing Cachectic Cancers: The Role of TNFα/Myostatin Axis. Alcohol. Clin. Exp. Res. 2020, 44, 66–77. [Google Scholar] [CrossRef]
- Hube, F.; Hauner, H. The Role of TNF-Alpha in Human Adipose Tissue: Prevention of Weight Gain at the Expense of Insulin Resistance? Horm. Metab. Res. 1999, 31, 626–631. [Google Scholar] [CrossRef]
- Patel, H.J.; Patel, B.M. TNF-α and Cancer Cachexia: Molecular Insights and Clinical Implications. Life Sci. 2017, 170, 56–63. [Google Scholar] [CrossRef]
- Ma, Y.; Li, X.; Zhang, H.; Ou, Y.; Zhang, Z.; Li, S.; Wu, F.; Sheng, Z.; Liao, E. Serum Myostatin in Central South Chinese Postmenopausal Women: Relationship with Body Composition, Lipids and Bone Mineral Density. Endocr. Res. 2016, 41, 223–228. [Google Scholar] [CrossRef]
- Ambroszkiewicz, J.; Chełchowska, M.; Mazur, J.; Rowicka, G.; Gajewska, J. Relationships between Body Weight Status and Serum Levels of Adipokine, Myokine and Bone Metabolism Parameters in Healthy Normal Weight and Thin Children. J. Clin. Med. 2022, 11, 4013. [Google Scholar] [CrossRef]
- Wu, L.-F.; Zhu, D.-C.; Wang, B.-H.; Lu, Y.-H.; He, P.; Zhang, Y.-H.; Gao, H.-Q.; Zhu, X.-W.; Xia, W.; Zhu, H.; et al. Relative Abundance of Mature Myostatin Rather than Total Myostatin Is Negatively Associated with Bone Mineral Density in Chinese. J. Cell. Mol. Med. 2018, 22, 1329–1336. [Google Scholar] [CrossRef]
- Hamrick, M.W.; Shi, X.; Zhang, W.; Pennington, C.; Thakore, H.; Haque, M.; Kang, B.; Isales, C.M.; Fulzele, S.; Wenger, K.H. Loss of Myostatin (GDF8) Function Increases Osteogenic Differentiation of Bone Marrow-Derived Mesenchymal Stem Cells but the Osteogenic Effect Is Ablated with Unloading. Bone 2007, 40, 1544–1553. [Google Scholar] [CrossRef]
- Qin, Y.; Peng, Y.; Zhao, W.; Pan, J.; Ksiezak-Reding, H.; Cardozo, C.; Wu, Y.; Divieti Pajevic, P.; Bonewald, L.F.; Bauman, W.A.; et al. Myostatin Inhibits Osteoblastic Differentiation by Suppressing Osteocyte-Derived Exosomal MicroRNA-218: A Novel Mechanism in Muscle-Bone Communication. J. Biol. Chem. 2017, 292, 11021–11033. [Google Scholar] [CrossRef]
- Kellum, E.; Starr, H.; Arounleut, P.; Immel, D.; Fulzele, S.; Wenger, K.; Hamrick, M.W. Myostatin (GDF-8) Deficiency Increases Fracture Callus Size, Sox-5 Expression, and Callus Bone Volume. Bone 2009, 44, 17–23. [Google Scholar] [CrossRef] [Green Version]
- Dankbar, B.; Fennen, M.; Brunert, D.; Hayer, S.; Frank, S.; Wehmeyer, C.; Beckmann, D.; Paruzel, P.; Bertrand, J.; Redlich, K.; et al. Myostatin Is a Direct Regulator of Osteoclast Differentiation and Its Inhibition Reduces Inflammatory Joint Destruction in Mice. Nat. Med. 2015, 21, 1085–1090. [Google Scholar] [CrossRef]
- Baig, M.H.; Ahmad, K.; Moon, J.S.; Park, S.Y.; Ho Lim, J.; Chun, H.J.; Qadri, A.F.; Hwang, Y.C.; Jan, A.T.; Ahmad, S.S.; et al. Myostatin and Its Regulation: A Comprehensive Review of Myostatin Inhibiting Strategies. Front. Physiol. 2022, 13. [Google Scholar] [CrossRef]
- Child, C.; Turcotte, J. Surgery and Portal Hypertension. Major Probl. Clin. Surg. 1964, 1, 1–85. [Google Scholar]
- Pugh, R.N.H.; Murray-Lyon, I.M.; Dawson, J.L.; Pietroni, M.C.; Williams, R. Transection of the Oesophagus for Bleeding Oesophageal Varices. Br. J. Surg. 1973, 60, 646–649. [Google Scholar] [CrossRef]
- Imboden, M.T.; Swartz, A.M.; Finch, H.W.; Harber, M.P.; Kaminsky, L.A. Reference Standards for Lean Mass Measures Using GE Dual Energy X-ray Absorptiometry in Caucasian Adults. PLoS ONE 2017, 12, e0176161. [Google Scholar] [CrossRef]
- Nie, Y.-Z.; Yan, Z.-Q.; Yin, H.; Shan, L.-H.; Wang, J.-H.; Wu, Q.-H. Osteosarcopenic Obesity and Its Components-Osteoporosis, Sarcopenia, and Obesity-Are Associated with Blood Cell Count-Derived Inflammation Indices in Older Chinese People. BMC Geriatr. 2022, 22, 532. [Google Scholar] [CrossRef]
- Kelly, O.J.; Gilman, J.C.; Boschiero, D.; Ilich, J.Z. Osteosarcopenic Obesity: Current Knowledge, Revised Identification Criteria and Treatment Principles. Nutrients 2019, 11, 747. [Google Scholar] [CrossRef] [Green Version]


| Patients (n = 59) | Controls (n = 18) | Z(T); p | Cirrhosis (n = 27) | No Cirrhosis (n = 32) | Z(T); p | |
|---|---|---|---|---|---|---|
| Age (years) | 59.25 ± 11.09 | 54.44 ± 8.10 | T = 1.70; 0.093 | 59.19 ± 9.48 | 59.31 ± 12.43 | T = 0.44; NS |
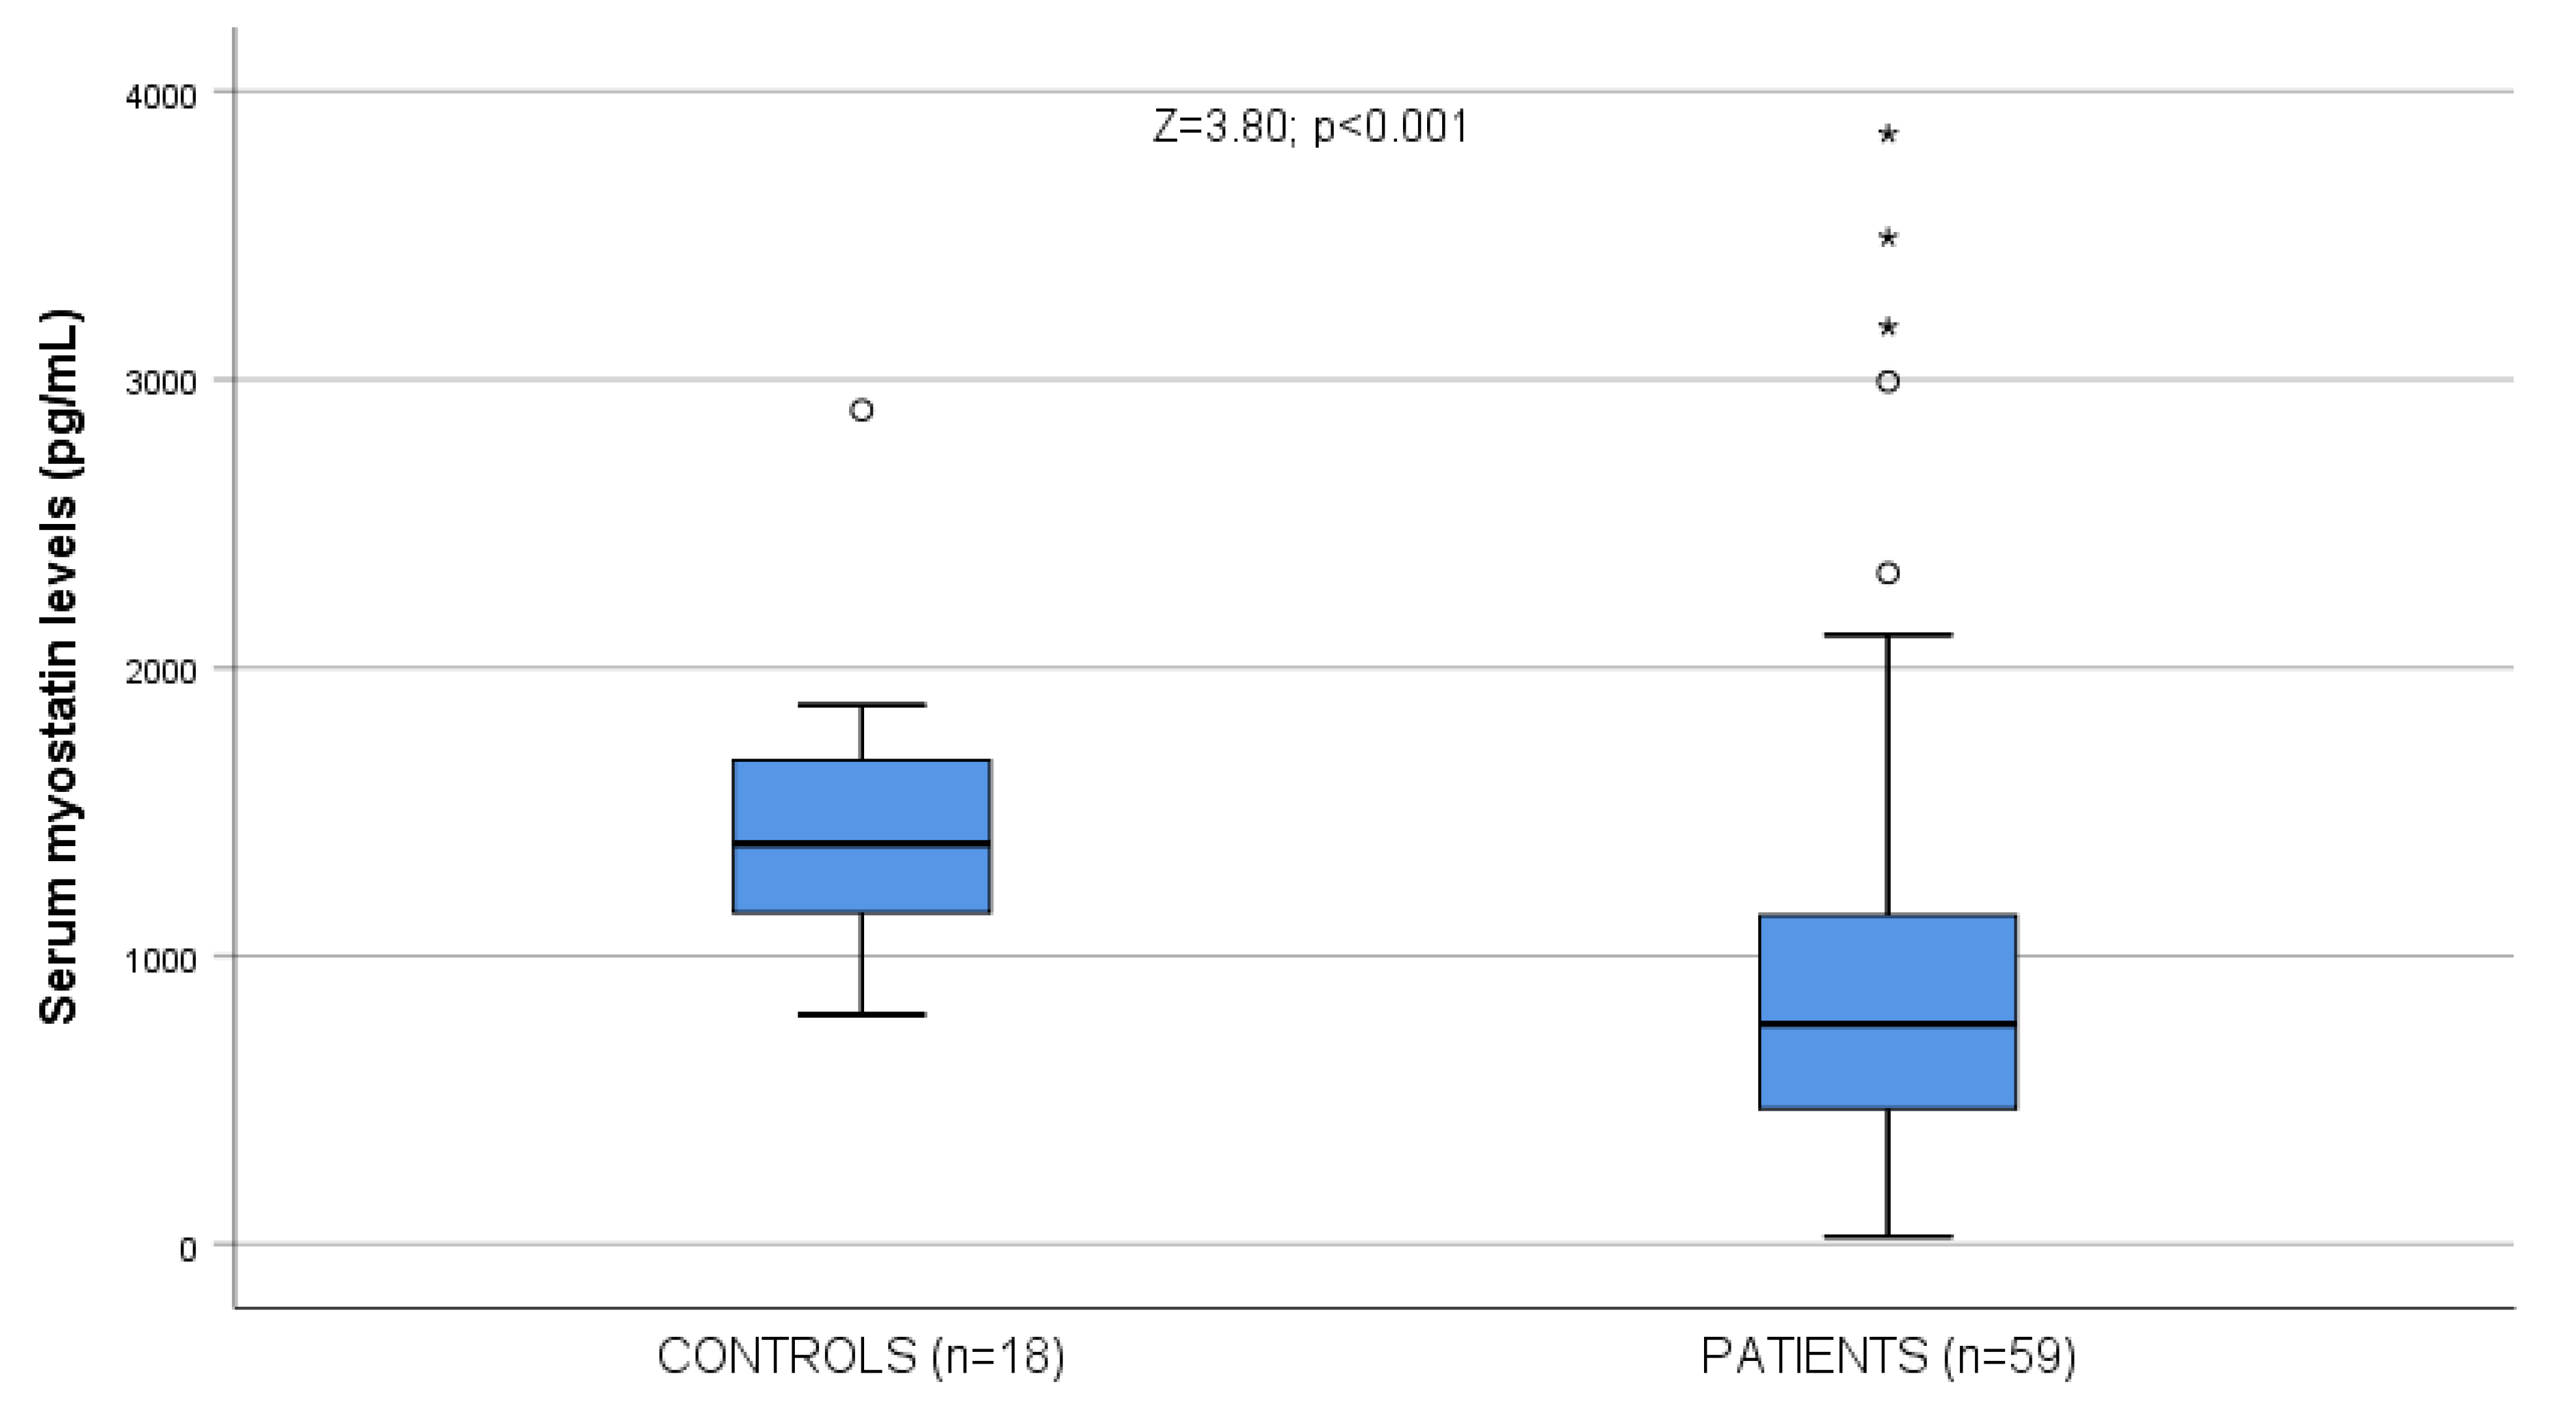
| Myostatin levels (pg/mL) | 978.48 ± 805.84 763.08 (450.36–1164.48) | 1440.89 ± 479.62 1389.22 (1147.08–1694.79) | Z = 3.80; p < 0.001 | 996.10 ± 810.13 763.08 (450.36–1273.24) | 963.61 ± 814.86 786.94 (459.79–1102.74) | Z = 0.24; NS |
| Handgrip (kp) | 17.20 ± 14.07 | 38.88 ± 9.73 | T = 5.89; p < 0.001 | 16.04 ± 10.99 | 18.22 ± 16.482 | T = 0.56; NS |
| BMI (kg/m2) | 26.66 ± 5.16 25.26 (23.80–27.68) | 25.34 ± 2.28 24.41 (23.72–26.37) | Z = 0.54; p = 0.59 | 26.44 ± 4.74 25.26 (23.71–26.51) | 26.90 ± 5.66 26.06 (23.80–28.30) | Z = 0.27; NS |
| Ethanol ingestion | ||||||
| Daily ethanol consumption (g) | 200.58 ± 171.49 160.00 (96.00–240.00) | - | - | 179.11 ± 88.20 192.00 (125.00–240.00) | 218.69 ± 218.53 140.50 (96.00–272.00) | Z = 0.38; NS |
| Years of addiction | 32.92 ± 15.17 | - | - | 33.22 ± 13.17 | 32.66 ± 16.87 | T = 0.14; NS |
| MCV | 101.38 ± 9.25 | 91.97 ± 3.53 | T = 6.37; p < 0.001 | 101.72 ± 12.29 | 101.09 ± 5.76 | T = 0.26; NS |
| GGT | 288.33 ± 348.83 175.50 (54.50–375.25) | 23.06 ± 6.02 22.00 (18.50–26.00) | Z = 4.95; p < 0.001 | 405.48 ± 428.81 307.00 (76.00–611.00) | 196.29 ± 220.73 92.00 (41.00–316.00) | Z = 2.25; p = 0.025 |
| Albumin | 3.59 ± 0.67 | 4.58 ± 0.32 | T = 8.54; p < 0.001 | 3.57 ± 0.74 | 3.60 ± 0.60 | T = 0.20; NS |
| Prothrombin | 76.88 ± 19.70 | 97.65 ± 3.44 | T = 7.70; p < 0.001 | 66.63 ± 22.1 | 85.53 ± 12.13 | T = 3.97; p < 0.001 |
| Bilirubin | 2.29 ± 3.42 1.00 (1.00–2.30) | 0.99 ± 0.06 1.00 (1.00–1.00) | Z = 2.73; p = 0.006 | 3.56 ± 4.72 2.00 (1.00–3.30) | 1.21 ± 0.72 1.00 (1.00–1.00) | Z = 4.35; p < 0.001 |
| Body composition (g) * | ||||||
| Right arm fat mass | 970.96 ± 529.35 | - | - | 1048.96 ± 526.74 | 889.57 ± 531.29 | T = 1.03; NS |
| Left arm fat mass | 961.00 ± 503.55 | - | - | 991.33 ± 459.07 | 929.35 ± 554.80 | T = 0.42; NS |
| Right leg fat mass | 2954.94 ±1609.91 | - | - | 3133.25 ± 1576.38 | 2768.87 ± 1658.44 | T = 0.77; NS |
| Left leg fat mass | 2929.83 ± 1609.92 | - | - | 3117.75 ± 1636.90 | 2733.74 ± 1593.53 | T = 0.81; NS |
| Trunk fat mass | 12,590.72 ± 6077.49 | - | - | 13,686.38 ± 6065.83 | 11,447.43 ± 6007.22 | T = 1.27; NS |
| Total fat mass | 20,747.47 ± 9849.06 | - | - | 21,936.42 ± 9699.45 | 19,506.83 ± 10,065.76 | T = 0.84; NS |
| Android fat mass | 2230.55 ± 1095.30 | - | - | 2337.71 ± 1106.44 | 2118.74 ± 1096.82 | T = 0.68; NS |
| Gynoid fat mass | 3489.94 ± 1929.80 | - | - | 3813.58 ± 2011.83 | 3152.22 ± 1822.60 | T = 1.18; NS |
| Right arm lean mass | 2796.26 ± 616.76 | - | - | 2830.46 ± 516.25 | 2760.56 ± 717.02 | T = 0.85; NS |
| Left arm lean mass | 2786.09 ± 663.97 | - | - | 2704.83 ± 568.57 | 2870.87 ± 754.39 | T = 0.85; NS |
| Right leg lean mass | 7460.89 ± 1796.58 | - | - | 7697.46 ± 1806.72 | 7214.04 ± 1792.05 | T = 0.92; NS |
| Left leg lean mass | 7391.47 ± 1781.77 | - | - | 7607.42 ± 1889.43 | 7166.13 ± 1673.86 | T = 0.85; NS |
| Trunk lean mass | 24,854.57 ± 4554.08 | - | - | 25,570.08 ± 5123.57 | 23,951.71 ± 3774.99 | T = 1.34; NS |
| Total lean mass | 49,044.55 ± 8623.82 | - | - | 50,315.71 ± 8870.36 | 47,718.13 ± 8345.03 | T = 1.03; NS |
| Android lean mass | 3947.15 ± 1045.88 | - | - | 4189.58 ± 1240.06 | 3694.17 ± 740.61 | T = 1.65; NS |
| Gynoid lean mass | 6276.66 ± 1571.75 | - | - | 6521.38 ± 1277.61 | 6021.30 ± 1823.58 | T = 1.09; NS |
| Total BMC | 2823.77 ± 522.96 | - | - | 2891.38 ± 526.60 | 2753.22 ± 521.29 | T = 0.90; NS |
| Right arm BMC | 250.49 ± 37.34 | - | - | 215.00 ± 36.71 | 287.52 ± 42.76 | T = 0.83; NS |
| Left arm BMC | 203.43 ± 38.35 | - | - | 201.25 ± 34.59 | 205.70 ± 42.60 | T = 0.39; NS |
| Right leg BMC | 537.30 ± 107.26 | - | - | 554.75 ± 111.49 | 519.09 ± 101.90 | T = 1.14; NS |
| Left leg BMC | 538.81 ± 111.54 | - | - | 549.63 ± 119.40 | 527.53 ± 104.15 | T = 0.68; NS |
| Trunk BMC | 870.89 ± 238.82 | - | - | 919.17 ± 239.15 | 820.53 ± 232.95 | T = 1.43; NS |
| Total BMD | 1.19 ± 0.11 | - | - | 1.200 ± 0.120 | 1.190 ± 0.110 | T = 0.41; NS |
| Pelvis BMD | 1.12 ± 0.15 | - | - | 1.162 ± 0.146 | 1.085 ± 0.147 | T = 1.80; NS |
| Total hip BMD | 0.99 ± 0.21 | - | - | 1.027 ± 0.197 | 0.949 ± 0.227 | T = 1.27; NS |
| Spine BMD | 1.12 ± 0.16 | - | - | 1.132 ± 0.143 | 1.107 ± 0.169 | T = 0.54; NS |
| Unstandardized Coefficients | Standardized Coefficients | 95% Confidence Interval for B | |||||
|---|---|---|---|---|---|---|---|
| Variable | B | Standard Error | Beta | T | p | Lower Bound | Upper Bound |
| Serum myostatin | 1.948 | 0.687 | 0.393 | 2.837 | 0.007 | 0.564 | 3.332 |
| * Dependent variable: Fat at lower limbs. ** Non-selected variables: age, cirrhosis. | |||||||
| Unstandardized Coefficients | Standardized Coefficients | 95% Confidence Interval for B | |||||
| Variable | B | Standard Error | Beta | T | p | Lower Bound | Upper Bound |
| Serum myostatin | 0.004 | 0.002 | 0.324 | 2.270 | 0.028 | 0.000 | 0.007 |
| * Dependent variable: Proportion of total fat. ** Non-selected variables: age, cirrhosis. | |||||||
| Unstandardized Coefficients | Standardized Coefficients | 95% Confidence Interval for B | |||||
| Variable | B | Standard Error | Beta | T | p | Lower Bound | Upper Bound |
| Serum myostatin | 0.004 | 0.002 | 0.369 | 2.631 | 0.012 | 0.001 | 0.008 |
| * Dependent variable: Gynoid fat distribution. ** Non-selected variables: age, cirrhosis. | |||||||
| Unstandardized Coefficients | Standardized Coefficients | 95% Confidence Interval for B | |||||
| Variable | B | Standard Error | Beta | T | p | Lower Bound | Upper Bound |
| Serum myostatin | 0.986 | 0.343 | 0.398 | 2.875 | 0.006 | 0.295 | 1.677 |
| * Dependent variable: Right leg fat. ** Non-selected variables: age, cirrhosis. | |||||||
| Unstandardized Coefficients | Standardized Coefficients | 95% Confidence Interval for B | |||||
| Variable | B | Standard Error | Beta | T | p | Lower Bound | Upper Bound |
| Serum myostatin | 0.962 | 0.344 | 0.388 | 2.793 | 0.008 | 0.268 | 1.656 |
| * Dependent variable: Left leg fat. ** Non-selected variables: age, cirrhosis. | |||||||
| Unstandardized Coefficients | Standardized Coefficients | 95% Confidence Interval for B | |||||
| Variable | B | Standard Error | Beta | T | p | Lower Bound | Upper Bound |
| Serum myostatin | 2.835 | 1.347 | 0.302 | 2.104 | 0.041 | 0.120 | 5.550 |
| * Dependent variable: Trunk fat. ** Unselected variables: age and cirrhosis. | |||||||
| Unstandardized Coefficients | Standardized Coefficients | 95% Confidence Interval for B | |||||
|---|---|---|---|---|---|---|---|
| Variable | B | Standard Error | Beta | T | p | Lower Bound | Upper Bound |
| Serum myostatin | 0.003 | 0.001 | 0.408 | 2.794 | 0.008 | 0.001 | 0.005 |
| Serum Myostatin Below the Median (705.9 pg/mL) (n = 24) | Serum Myostatin Over the Median (705.9 pg/mL) (n = 22) | T (Z); p | |
|---|---|---|---|
| Handgrip (kp) | 14.04 ± 11.51 | 20.23 ± 15.79 | T = 1.60; p = 0.12 |
| Femoral Neck T-Score | −0.64 ± 1.42 | −0.62 ± 1.57 | T = 0.03; NS |
| Appendicular lean mass/height2 (Kg/m2) | 6.99 ± 1.23 | 7.17 ± 1.37 | T = 0.44; NS |
| Proportion of total fat > 25% (%) | 26.46 ± 7.95 27.10 (18.60–34.33) | 31.32 ± 7.34 31.85 (28.05–38.33) | Z = 2.15; p = 0.037 |
| Android/Gynoid fat ratio | 1.00 ± 0.27 | 1.06 ± 0.15 | T = 0.94; NS |
| Clinical and Laboratory Criteria | Points | ||
|---|---|---|---|
| 1 | 2 | 3 | |
| Bilirubin (mg/dL) | <2 | 2–3 | >3 |
| Albumin (g/dL) | >3.5 | 2.8–3.5 | <2.8 |
| Prothrombin time | |||
| % | >60 | 40–60 | <40 |
| International normalized ratio | <1.7 | 1.7–2.3 | >2.3 |
| Encephalopathy | None | Mild to moderate (grade 1 or 2) | Severe (grade 3 or 4) |
| Ascites | None | Mild to moderate (diuretic responsive) | Severe (diuretic refractory) |
Disclaimer/Publisher’s Note: The statements, opinions and data contained in all publications are solely those of the individual author(s) and contributor(s) and not of MDPI and/or the editor(s). MDPI and/or the editor(s) disclaim responsibility for any injury to people or property resulting from any ideas, methods, instructions or products referred to in the content. |
© 2023 by the authors. Licensee MDPI, Basel, Switzerland. This article is an open access article distributed under the terms and conditions of the Creative Commons Attribution (CC BY) license (https://creativecommons.org/licenses/by/4.0/).
Share and Cite
Martín-González, C.; Pérez-Hernández, O.; García-Rodríguez, A.; Abreu-González, P.; Ortega-Toledo, P.; Fernández-Rodríguez, C.M.; Alvisa-Negrín, J.C.; Martínez-Riera, A.; González-Reimers, E. Serum Myostatin among Excessive Drinkers. Int. J. Mol. Sci. 2023, 24, 2981. https://doi.org/10.3390/ijms24032981
Martín-González C, Pérez-Hernández O, García-Rodríguez A, Abreu-González P, Ortega-Toledo P, Fernández-Rodríguez CM, Alvisa-Negrín JC, Martínez-Riera A, González-Reimers E. Serum Myostatin among Excessive Drinkers. International Journal of Molecular Sciences. 2023; 24(3):2981. https://doi.org/10.3390/ijms24032981
Chicago/Turabian StyleMartín-González, Candelaria, Onán Pérez-Hernández, Alen García-Rodríguez, Pedro Abreu-González, Paula Ortega-Toledo, Camino María Fernández-Rodríguez, Julio César Alvisa-Negrín, Antonio Martínez-Riera, and Emilio González-Reimers. 2023. "Serum Myostatin among Excessive Drinkers" International Journal of Molecular Sciences 24, no. 3: 2981. https://doi.org/10.3390/ijms24032981
APA StyleMartín-González, C., Pérez-Hernández, O., García-Rodríguez, A., Abreu-González, P., Ortega-Toledo, P., Fernández-Rodríguez, C. M., Alvisa-Negrín, J. C., Martínez-Riera, A., & González-Reimers, E. (2023). Serum Myostatin among Excessive Drinkers. International Journal of Molecular Sciences, 24(3), 2981. https://doi.org/10.3390/ijms24032981