2.2.1. Biogas, CH4, and H2 Production
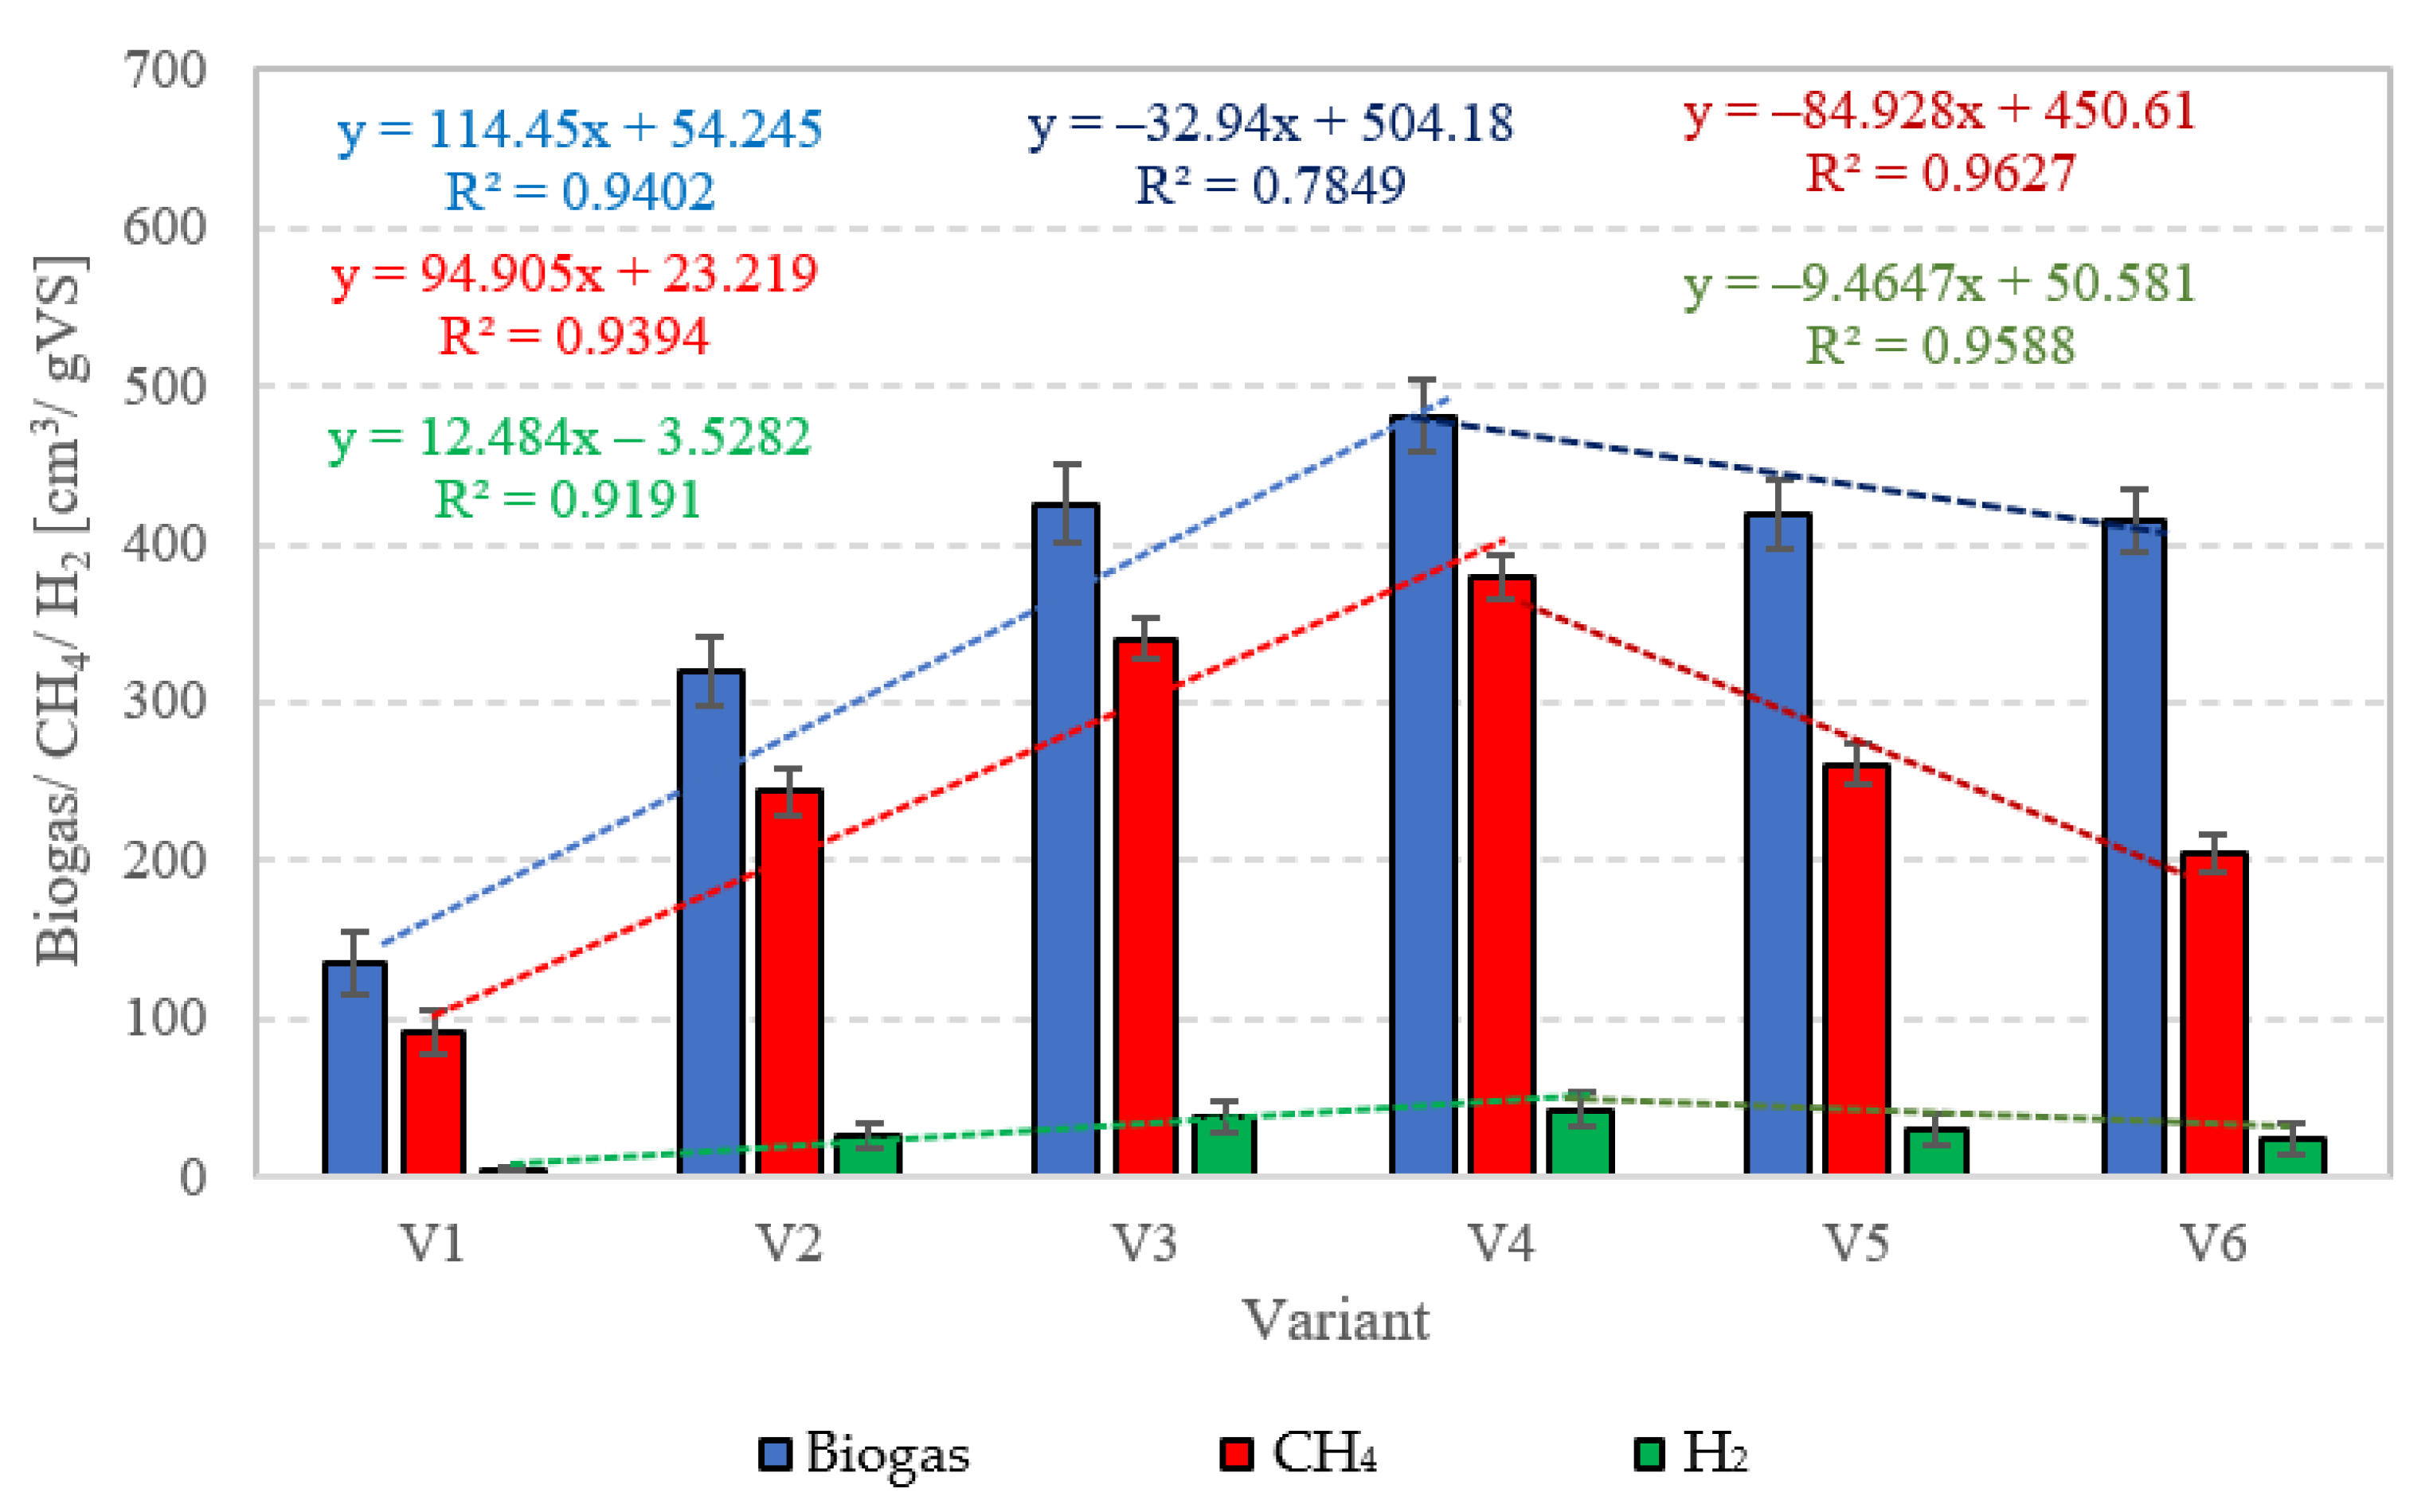
In this experimental stage, variants V1–V4 produced significant increases in the yield of biogas and its main fractions. Biogas yield of crude AGS (V1) was 135 ± 20 cm
3/gVS (
Figure 2), whereas the reaction rate constant reached r = 60.72 cm
3/d (
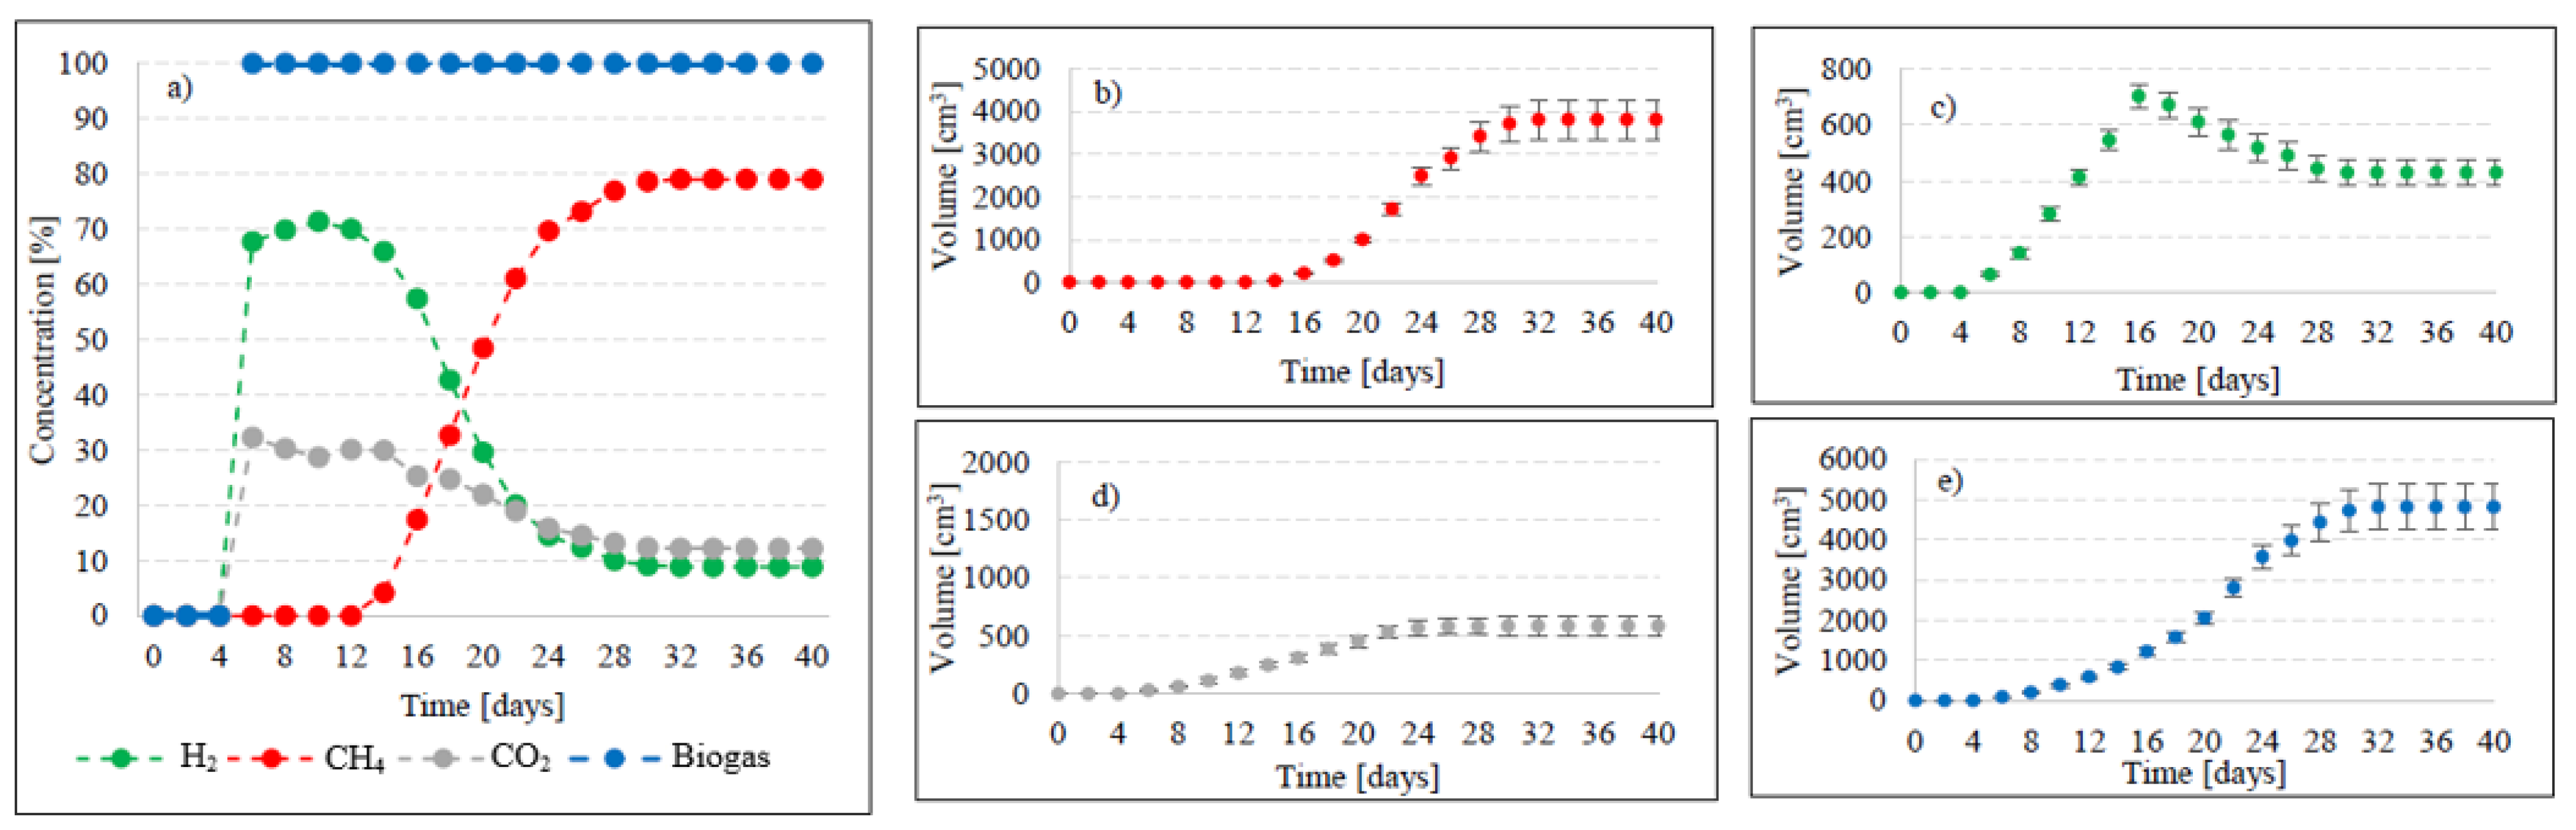
Table 1). In V1, the initiation of the metabolic activity of anaerobes was observed after 10 days of retention in respirometers. At the initial stage of anaerobic digestion, CO
2 and H
2 were the main biogas fractions, with their concentrations reaching 75% and 25% on day 10 and 67.9% and 32.1% on day 14, respectively (
Figure 3). On day 16, CH
4 was detected in biogas. Its percentage content reached 11.5% and was observed to increase successively throughout the process. On day 20, H
2 production ceased at 79 cm
3, and its volume ultimately dropped to 49 cm
3 at the end of experiment (
Figure 3). The volume of CO
2 stabilized at 381 cm
3 on day 30, whereas that of CH
4 stabilized at 920 cm
3 on day 32. The ultimate biogas composition was as follows: 3.6% of H
2, 28.2% of CO
2, and 68.2% of CH
4 (
Figure 3,
Table 2).
Variants V2–V4 resulted in the production of biohythane, namely biogas with an admixture of gaseous H
2 exceeding 8% [
26]. The H
2/(H
2 + CH
4) ratio reached 0.10 ± 0.01 in these variants. The highest yields of biohythane, CH
4, and H
2 were obtained in V4 and reached 481 ± 23 cm
3/gVS, 380 ± 14 cm
3/gVS, and 42.76 ± 11 m
3/gVS, respectively (
Figure 2,
Table 2). The production rates were as follows: 723.61 cm
3/d biohythane, 424.71 cm
3/d CH
4, and 30.71 cm
3/d H
2 (
Table 1). In V2, the onset of production of biogas containing 52.0% of H
2 and 48% of CO
2 was noted on day 6 of anaerobic digestion (
Figure 4). Similar ratios of biogas fractions were observed within the subsequent 10 days. On day 16, CH
4 was detected in the biogas and its concentration reached 4.6%. Ever since, it became the major biogas fraction and its concentration stabilized at 76.5% after 34 days of the process (
Figure 4). A significant increase in H
2 volume to the value of 482 cm
3 was observed until day 18 of anaerobic digestion. At the end of the process, the ultimate volume reached 262 cm
3, which accounted for 8.2% of the total biogas composition (
Figure 4). In V3, the H
2 content in the biogas ranged from 65.7% to 72.6% between days 10 and 16 of anaerobic digestion (
Figure 5). The CH
4 concentration of 6.3% was determined on day 16 of the process. In the subsequent days of AD, this biogas fraction was produced most intensively, which had a direct impact on the qualitative composition of gaseous metabolites of anaerobes. At the end of digestion, the biogas contained 9% of H
2, 79.9% of CH
4, and 11.1% of CO
2 (
Figure 5,
Table 2). Analogous course of AD was observed in V4. Between days 6 and 14, the content of H
2 fell within a narrow range from 65.9% to 71.3%, whereas that of CO
2 was from 29.9% to 32.3% (
Figure 6). The highest H
2 content in the biogas, peaking to 701 cm
3, was determined on day 16 of AD (
Figure 6). In the consecutive days of the process, the volume of H
2 produced dropped to 428 cm
3. In turn, a successive increase in CH
4 production in the subsequent days directly affected biogas characteristics, which ultimately contained 8.9% of H
2, 79.0% of CH
4, and 12.1% of CO
2 (
Figure 6,
Table 2).
Variants V5–V6 brought about AD yield reduction and a significant decrease in CH
4 and H
2 concentrations, whose values reached 418 ± 22 cm
3/gVS biogas, 261 ± 10 cm
3/gVS CH
4, and 29.39 ± 10 cm
3/gVS H
2 in V5 (
Figure 2), as well as 415 ± 20 cm
3/gVS biogas, 205 ± 12 cm
3/gVS CH
4, and 23.32 ± 10 cm
3/gVS H
2 in V6 (
Figure 2,
Table 2). In V5, until day 12 of AD, the CO
2 turned out to be the major biogas fraction, with its content in the biogas ranging from 51.2% to 53.4% (
Figure 7). In the same time span, the content of H
2 in the biogas ranged from 46.6% to 48.8%, which was significantly lower compared to that noted in V2–V4. The presence of CH
4 was noted on day 14 of AD, when its volume reached 112 cm
3 (18.7%), (
Figure 7). At the end of digestion, the total CH
4 volume was 2610 cm
3, and its percentage content in the biogas reached 62.4%. The content of CO
2 accounted for 30.6%, whereas that of H
2 was 7% (
Figure 7). In V6, biogas production was initiated on day 10 of AD (
Figure 8). Since the very beginning, CO
2 was the major biogas fraction, with its content in the biogas ranging from 66% to 76.5% until day 20 of AD (
Figure 8). This variant produced the lowest H
2 content in the biogas, which decreased from 28.5% on day 12 to 5.6% at the end of AD. The total volume of produced CH
4 was 2050 cm
3, and its content in the biogas ultimately accounted for 49.4% (
Figure 8,
Table 2).
Productivity of biohydrogen and biohythane from AGS pretreated with SCO
2 has not been explored yet. Studies conducted so far have only determined the feasibility of producing typical biogas. Bernat et al. (2017) [
50] achieved biogas yield ranging from 318.5 cm
3/gVS at OLR = 6 gVS/cm
3·d to 408.9 cm
3/gVS at OLR = 2 gVS/cm
3·d and concluded that the yield decreased along with OLR increase. In turn, the CH
4 concentration in the biogas ranged from 56.7% to 59.5%. These values were significantly lower compared to those achieved in the present study. Another study demonstrated that biogas productivity from AGS was 1.8-fold lower than from CAS [
50]. In turn, Cydzik-Kwiatkowska et al. (2022) [
37] applied the ultrasound pretreatment of AGS. After 0.5, 4.0, and 8.0 min of disintegration, the biogas yield approximated 400 cm
3/gVS, 420 cm
3/gVS, and 455 cm
3/gVS, respectively. Hence, a significant improvement was achieved in AD effectiveness compared to the nonsonicated AGS, which allowed ca. 375 cm
3/gVS biogas to be produced [
37]. A study conducted by Xiao and Liu (2009) [
51] showed the impact of sewage sludge pretreatment on H
2 yield. The alkaline pretreatment at the initial pH = 11.5 enabled H
2 yield of 11.68 cm
3/gVS and heat treatment ensured 8.62 cm
3/gVS H
2, whereas ultrasound pretreatment allowed the production of 3.83 cm
3/gVS H
2. No sludge pretreatment at pH = 7 resulted in H
2 production at 1.21 cm
3/gVS. In another study [
52], municipal CAS was pretreated prior to AD using SCO
2. In the most effective variant, biogas yield was 49% higher compared to that obtained with raw CAS [
52]. Zawieja (2019) [
49] also investigated the effect of pretreatment using SCO
2 on the course of methane fermentation of CAS. At the SCO
2 to CAS volume ratio of 0.55/1, they achieved biogas yield of 620 cm
3/gVS and CH
4 concentration in the biogas reaching ca. 78% [
49].
2.2.2. pH, FOS/TAC, and Bacterial Community Structure
In V1, the pH value reached 7.78 ± 0.1 and decreased successively as a result of the AGS pretreatment with SCO
2, reaching 6.92 ± 0.1 in V4 (
Table 3). A further increase in the SCO
2 dose in V5 and V6 reduced the pH value of AGS to 6.41 ± 0.1 and 6.33 ± 0.1, respectively. During CO
2 sublimation, its part was most likely dissolved in the supernatant. CO
2 is well soluble in aqueous solutions, and its solubility at a temperature of 25 °C reaches 2900 mg/dm
3 [
53]. Hydrogen ions H
+, carbonate ions CO
32−, and bicarbonate ions HCO
3− are formed then, causing pH drop [
54] and negatively affecting AD yield [
48]. This phenomenon may contribute to the inhibition of methanogenesis and—to a lesser extent—the activity of hydrogen-producing bacteria which are more resistant to low pH values [
55]. Hence, the pH values measured in digesters were a consequence of initial conditions after pretreatment with SCO
2. In V1, after AD, the pH value decreased from 7.51 ± 0.1 to 7.21 ± 0.1 (
Table 3). In V2–V4, the pH ranged from 7.08 ± 0.1 to 7.38 ± 0.1 and decreased after AD to the values ranging from 6.64 ± 0.1 to 6.88 ± 0.1 (
Table 3). In V5 and V6, in which the pretreatment caused environment acidification, the pH value dropped significantly after AD, from 6.84 ± 0.1 to 6.32 ± 0.1 in V5 and from 6.79 ± 0.1 to 6.25 ± 0.1 in V6 (
Table 3). These pH changes were reflected in the structure of anaerobic microorganisms and, consequently, in biogas production yield and composition. The pH value in the anaerobic digester is a key driver of process stability [
56]. The present study results confirm findings from earlier research [
49], which also demonstrated a decrease in pH values after pretreatment with SCO
2 and a subsequent decline in AD effectiveness.
The values of the FOS/TAC ratio fell within a narrow range from 0.36 ± 0.03 in V1 to 0.43 ± 0.03 in V5 and V6 (
Table 3). These differences were not statistically significant. The FOS/TAC ratio, used to assess AD stability, represents the ratio of volatile organic acids to the alkaline buffer capacity [
57]. According to existing literature [
58], the FOS/TAC values of a stable AD process range from 0.3 to 0.4. Hence, this condition was met in the present study. The FOS/TAC values exceeding 0.5 are indicative of operating conditions that are inappropriate for anaerobic microorganisms and cause biogas yield decline [
57].
The bacteria (EUB338) turned out to be the prevailing consortium of microorganisms in all technological variants, with their percentage in the population of anaerobes ranging from 68 ± 11% in V6 to 70 ± 12% in V2 and V3 (
Table 4). In V1–V4, the taxonomic structure of the population of fermentative bacteria was similar. The methanogenic archaea (ARC915) accounted for 23 ± 3 to 24 ± 5%,
Methanosarcinaceae (MSMX860) for 11 ± 3% to 13 ± 4%, whereas
Methanosaeta (MX825) for 6 ± 2 to 8 ± 4% of the total anaerobic bacteria community (
Table 4). In V5 and V6, the contribution of archaea (ARC915) diminished to ca. 21%, whereas
Methanosarcinaceae (MSMX860) accounted for 12 ± 3% in V5 and for 11 ± 5% in V6, and
Methanosaeta (MX825) for 7 ± 3% in V5 and 6 ± 2% in V6 (
Table 4). This structure of the anaerobic bacteria community could be due to environment acidification prior to fermentation caused by sludge pretreatment with SCO
2, which has a significant impact on the environmental conditions and on the course and effectiveness of AD, since methanogenic bacteria are functionally active at the pH range from 6.5 to 7.5 [
59].
In all experimental variants, the most abundant taxonomic group was
Methanosarcinaceae, being facultative acetoclastic methanogens that may also use H
2 and CO
2 compounds to produce CH
4 [
60].
Methanosaeta are obligate acetoclastic methanogens known to use only acetate or electrons gained via direct interspecies electron transfer [
60]. It is also speculated that hydrogenotrophic methanogens, such as
Methanobacterium sp., were present in digesters during AD, which converted H
2 and CO
2 formed upon anaerobic digestion and CO
2 dissolved in the substrate as a result of pretreatment with SCO
2 into CH
4 [
61].
The often promoted biohythane production technologies are two-stage solutions, where H
2 and CH
4 are produced in separate anaerobic chambers [
62]. This is justified by the required different optimal environmental conditions for communities of hydrogen bacteria and methanogenic archaea. However, the practical implementation of such technological systems is very limited due to the single-stage anaerobic process prevailing on a commercial scale. Two-stage digesters account for only 7% of all installations operated in Europe, which is determined primarily by economic and operational aspects [
62]. For this reason, a justified direction of research is the development of a single-stage biohythane production technology. The work published so far shows that this is an entirely viable alternative [
62]. The most important factor is to maintain balance in the structure of anaerobic bacteria, because in a single-stage biohythane production system, microorganisms of different groups compete at H
2 production stage [
62]. During DF, H
2 produced by hydrogen bacteria is mainly consumed by methanogenic bacteria in a metabolic pathway called hydrogenotrophic methanogenesis; the reduction of carbon dioxide (CO
2) produces CH
4 according to the reaction (4H
2 + CO
2 → CH
4 + 2H
2O) [
62]. The low content of H
2 in biogas prevents the production of biohythane, because commercial hythane contains more than 8% H
2 by volume [
62]. Thus, the increase in H
2 concentration in biogas depends on the rate of hydrogenotrophic methanogenesis [
63]. On the other hand, inhibition of hydrogenotrophic methanogenesis can lead to a decrease in CH
4 production, as this mechanism maintains a low H
2 partial pressure state which is necessary for the metabolic reactions of methanogenic bacteria [
63]. Therefore, to achieve the desired biohythane production in a single-stage system, it is crucial to overcome the conflict of H
2 and CH
4 production that is associated with hydrogenotrophic methanogenesis. Previous studies have shown that the taxonomic structure of microorganisms plays a key role in the bioprocess of biohythane production. It is related to the efficiency of degradation of organic substances and metabolic mechanisms leading to the production of final gaseous products. In previous works, it was proved that the production of biohythane was dominated by hydrogen bacteria of the species
Clostridium butyricum, and that
Methanovbacterium beijiingense and
Methanothrix soehngeni were dominant for methanogenic bacteria [
63]. In other works, the dominant hydrogen bacteria were
Clostridium pasteurianumi, while the methanogenic genus
Methanosaeta and
Methanobacterium [
63,
64].
2.2.3. Correlations and Empirical Models
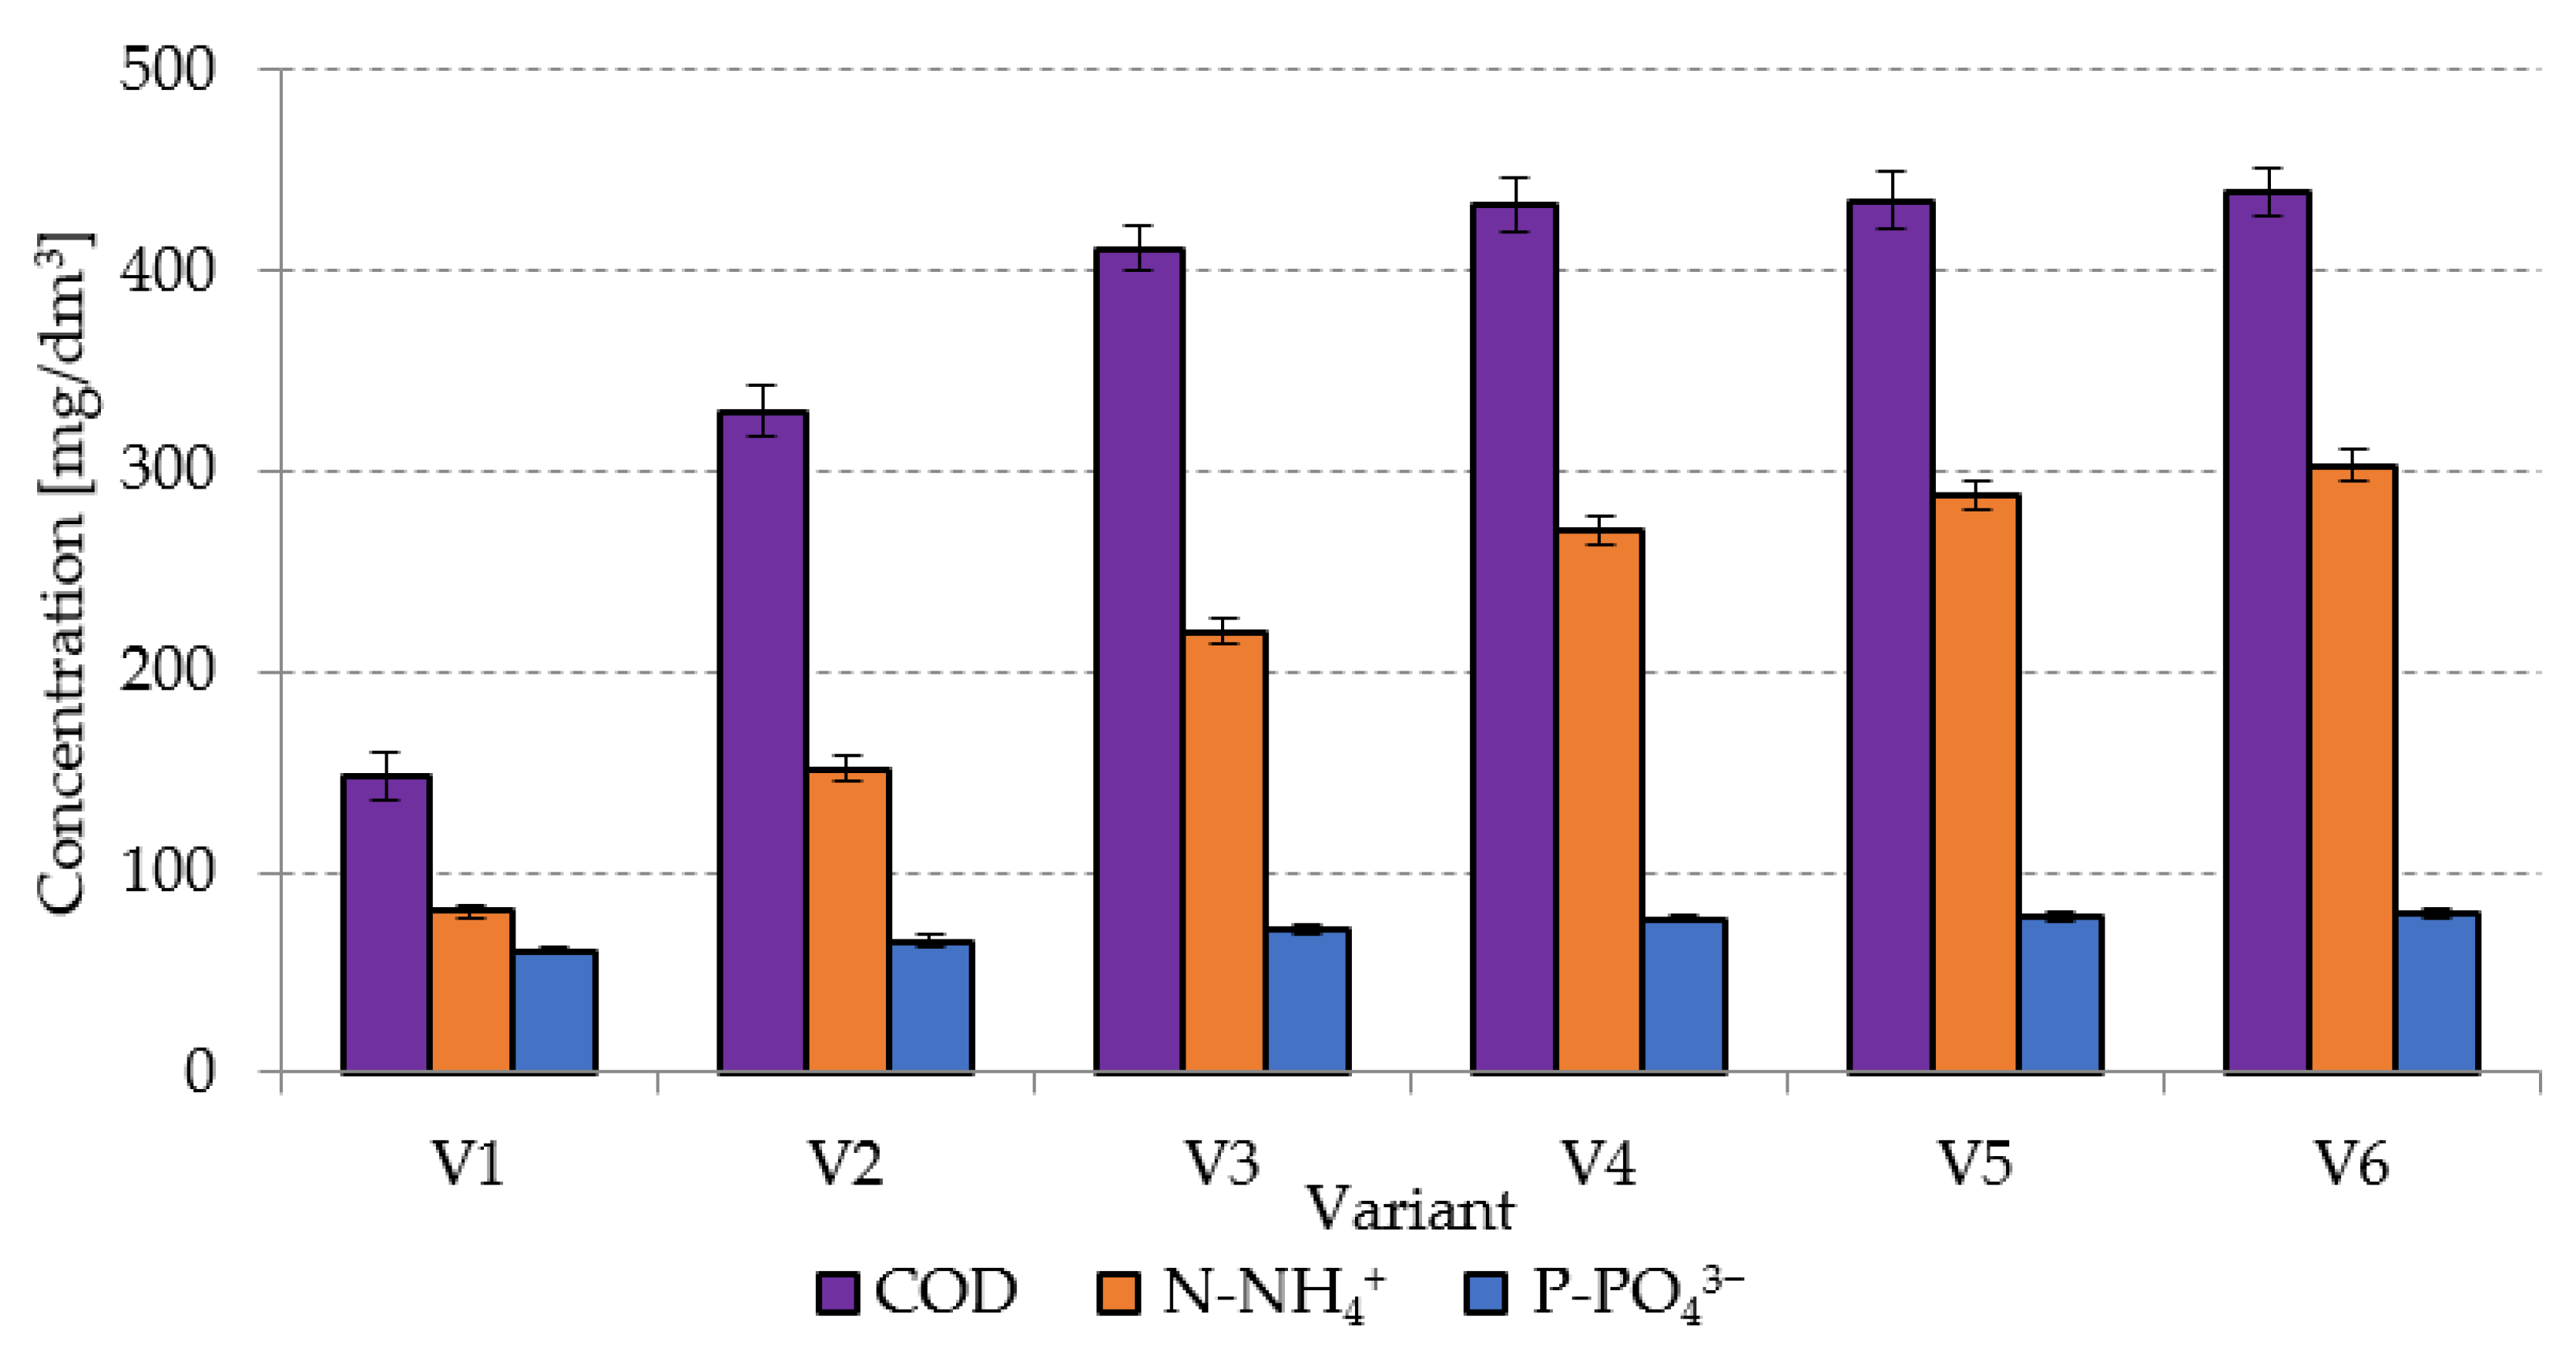
In variants from V1 to V4, very strong positive correlations were found between the concentrations of COD, N-NH
4+, and P-PO
43− in the dissolved phase and biogas yield (
Figure 9). The respective coefficients of determination reached R
2 = 0.9876 (
Figure 9a), R
2 = 0.9643 (
Figure 9b), and R
2 = 0.9151 (
Figure 9c). In the subsequent technological variants, increased SCO
2 doses applied resulted in negative correlations between the concentrations of indicators monitored in the dissolved phase and biogas yield, i.e., R
2 = 0.5999 for COD, R
2 = 0.804 for N-NH
4+, and R
2 = 0.7437 for P-PO
43− (
Figure 9). Analogous phenomena were observed for the concentrations of COD, N-NH
4+, and P-PO
43− in the dissolved phase and the CH
4 and H
2 yields (
Figure 9). In variants V1–V4, very strong positive correlations were found between COD (R
2 = 0.9862), N-NH
4+ (R
2 = 0.9664), and P-PO
43− (R
2 = 0.9163) concentrations in the dissolved phase and CH
4 yield, as well as among COD (R
2 = 0.9937), N-NH
4+ (R
2 = 0.951) and P-PO
43− (R
2 = 0.8937) concentrations in the dissolved phase and H
2 yield (
Figure 9). The subsequent variants produced strong negative correlations, whose coefficients of determination reached R
2 = 0.8526, R
2 = 0.9721, and R
2 = 0.9435 in the case of CH
4 as well as R
2 = 0.8456, R
2 = 0.9688, and R
2 = 0.9389 in the case of H
2, respectively (
Figure 9).
The V1–V4 variants were characterized by very strong negative correlations between pH after AD and production yields of biogas (R
2 = 0.9968), CH
4 (R
2 = 0.9958), and H
2 (R
2 = 0.999) (
Figure 9d). In these variants, the taxonomic structure of the population of fermentative bacteria was similar, whereas an increase in the yields of biogas, CH
4, and H
2 was due to the increased availability and improved biodegradability of the substrate after pretreatment. In variants V5 and V6, the availability and biodegradability were similar to those noted in V4, as indicated by concentrations of the analyzed indicators in the dissolved phase, whereas high SCO
2 doses applied decreased the pH value, thereby inhibiting the populations of methanogenic bacteria. The methanogenic bacteria require neutral pH for their optimal metabolic activity and are highly sensitive to environmental changes [
65].
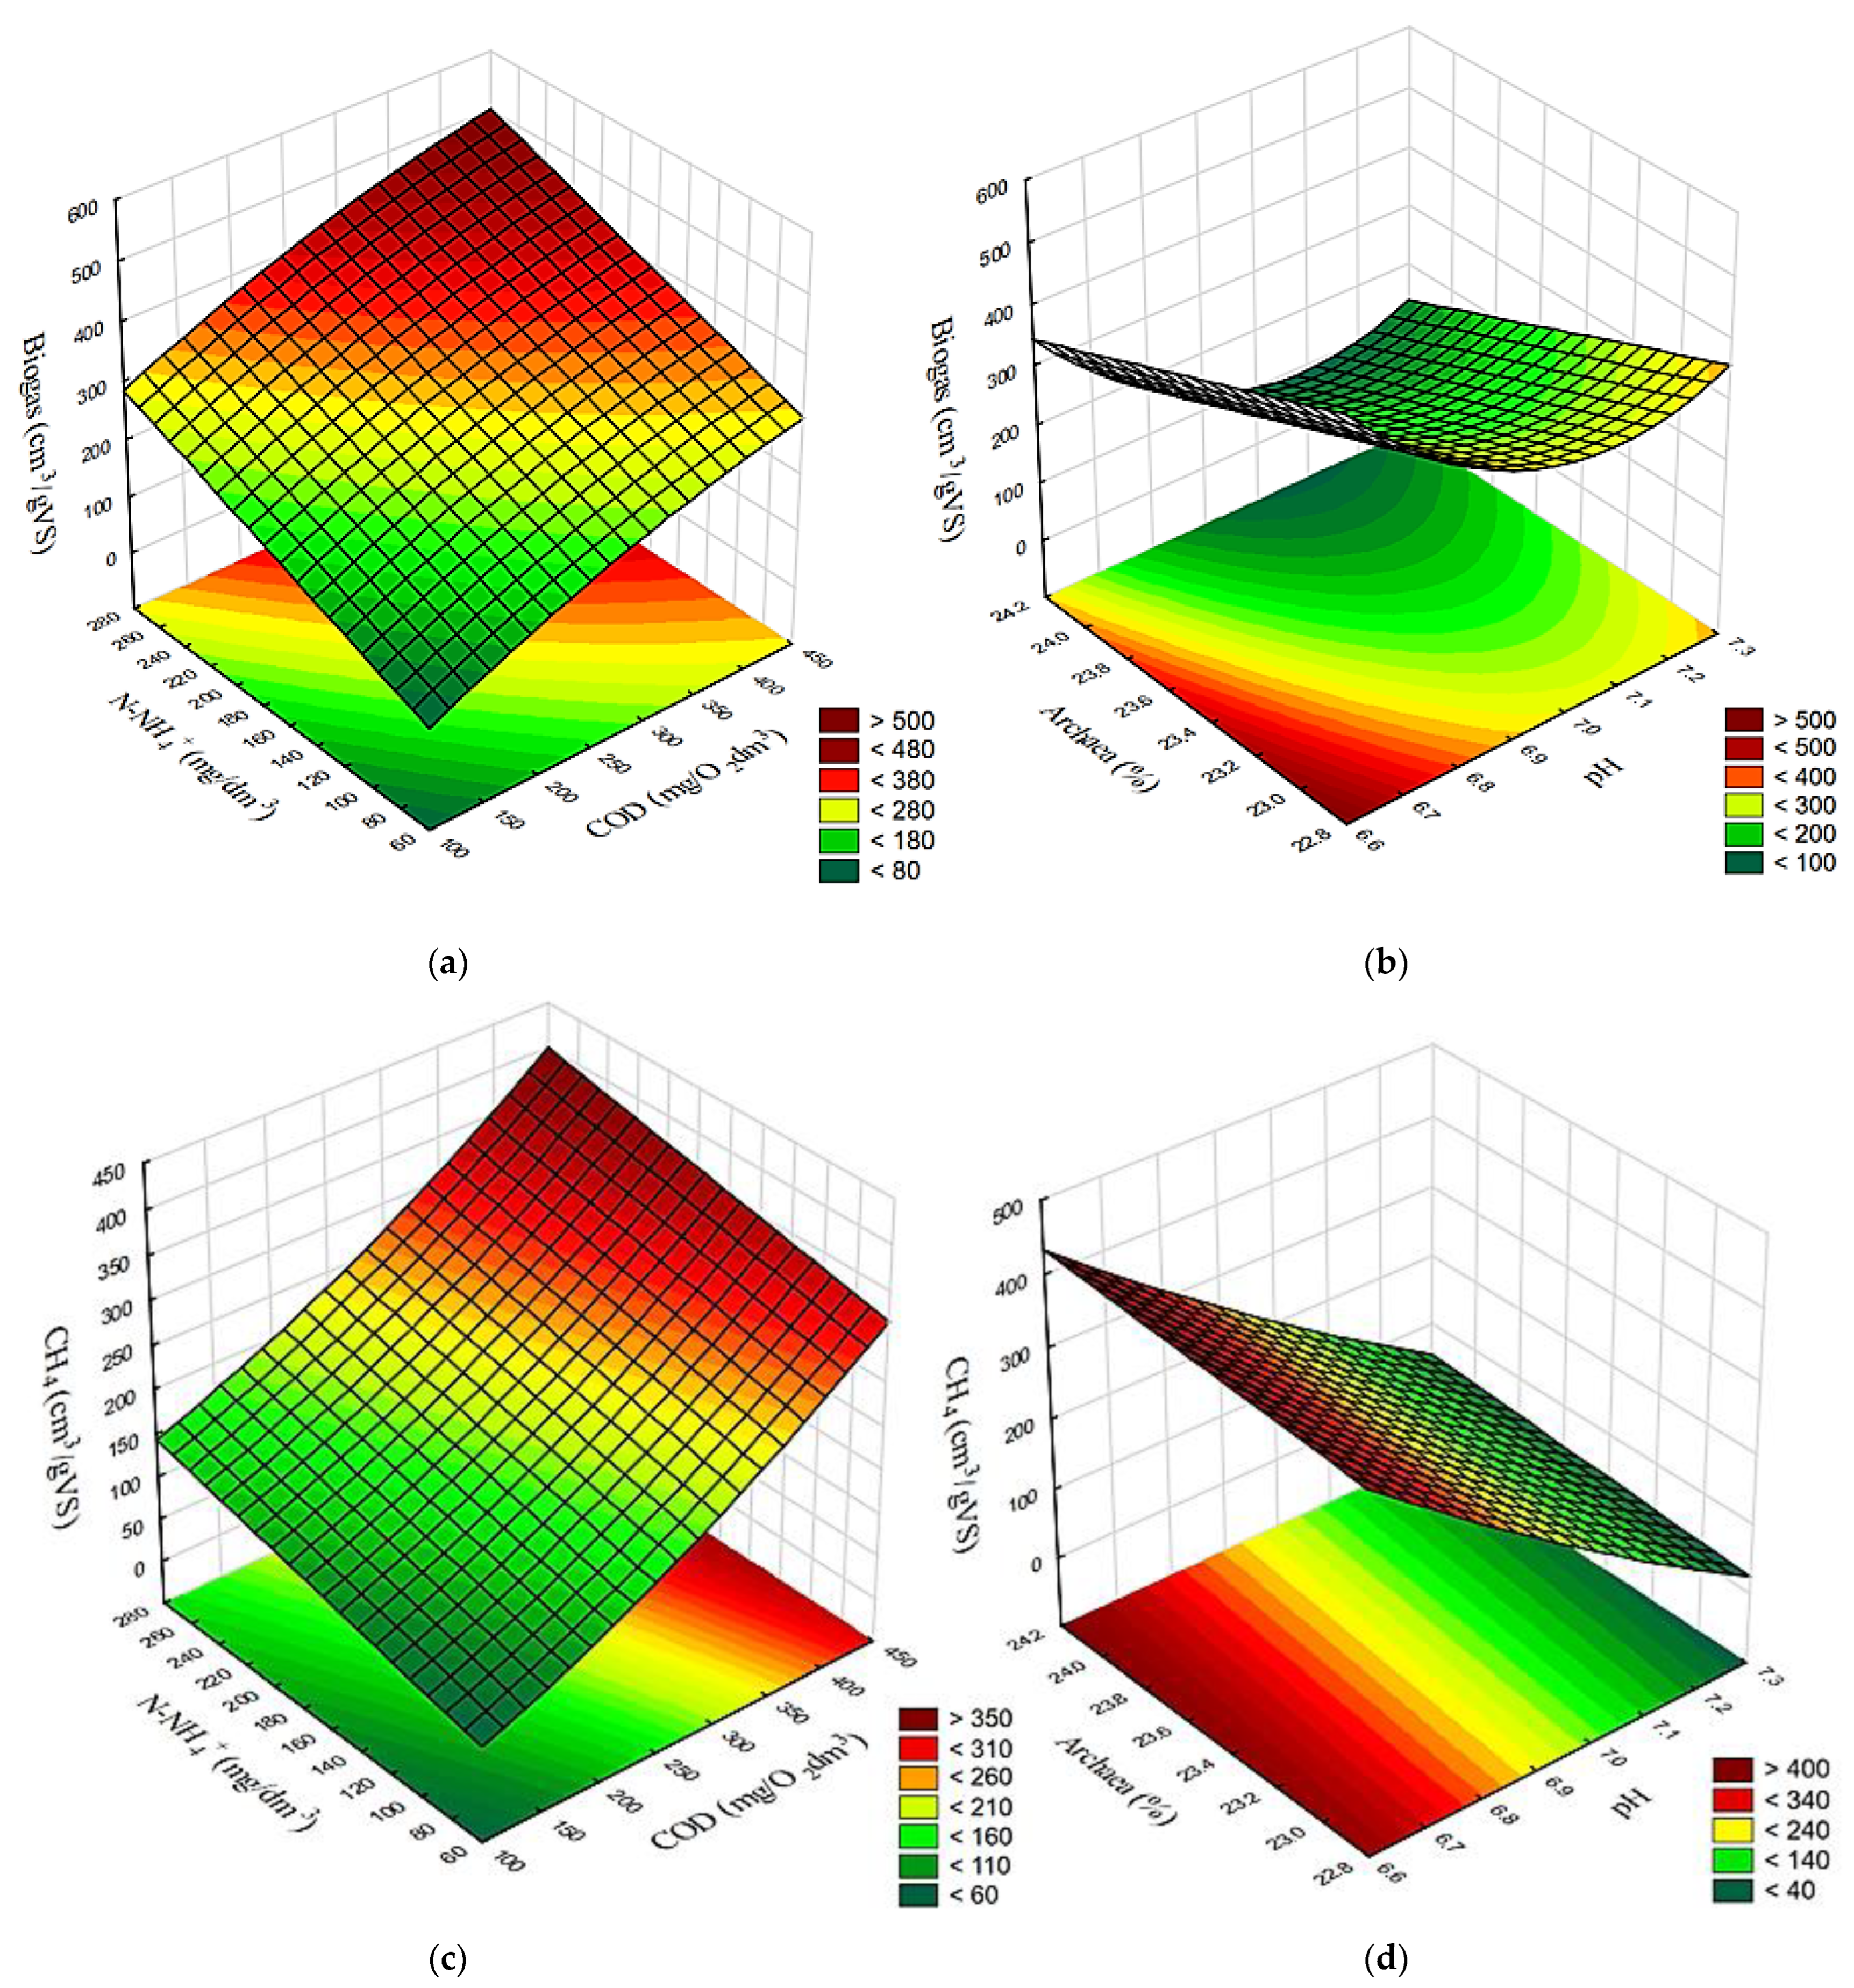
The results achieved in variants V1–V4 demonstrated a correlated surface effect of COD and N-NH
4+ concentrations in the supernatant as well as the effect of pH and Archaea contribution in the populations of methanogens on the yields of biogas (
Figure 10a,b), CH
4 (
Figure 10c,d), and H
2 (
Figure 10e,f).
The multiple regression method was deployed to develop empirical equations for estimating production yields of biogas, CH
4, and H
2. Only variants V1–V4 were considered in the estimation due to linear correlation. It was found that biogas and methane yields were statistically significantly affected by such predictors as COD concentration in the dissolved phase and the SCO
2/AGS volume ratio. The postulated model of biogas yield (1) is characterized by an estimation error of ±1.5157 and reflects ca. 98.99% of changes in the process of biogas production (R
2 = 0.9899). The CH
4 yield model (2) reflects ca. 98.74% changes in the process of its production, with a coefficient of determination at R
2 = 0.9874 and an estimation error of ±6.5299. In turn, the empirical model of H
2 production (3) has a coefficient of determination at R
2 = 0.9979 and an estimation error of ±0.7867.
BIOGAS—biogas yield, cm3/gVS,
CH4—methane yield, cm3/gVS,
H2—hydrogen yield, cm3/gVS,
COD—COD concentration in the supernatant, mgO2/dm3,
N-NH4+—N-NH4+ concentration in the supernatant, mg/dm3,
SCO2/AGS—volume ratio of SCO2 to AGS.
The analysis of concentrations of selected indicators in the dissolved phase of the organic substrate subjected to pretreatment is one of the means used to evaluate the effectiveness of pretreatment processes [
66]. Usually, concentrations of organic compounds are monitored to enable this assessment [
67]. In some cases, it is feasible to develop reliable correlations and empirical models to estimate AD efficiency based on the presence of organic compounds in the dissolved phase [
68]. Conducting analyses of this type is useful from a practical standpoint, as it eliminates the need to conduct more advanced measurements to estimate the effectiveness of the pretreatment methods applied.


