Article

Insertion Depth Modulates Protein Kinase C-δ-C1b Domain Interactions with Membrane Cholesterol as Revealed by MD Simulations

by
Patrick T. Judge
1,
Sarah A. Overall
2,* and
Alexander B. Barnes
2,*
1
Department of Biochemistry, Biophysics & Structural Biology, Washington University in St. Louis, St. Louis, MO 63130, USA
2
Laboratory of Physical Chemistry, ETH Zürich, 8093 Zurich, Switzerland
*
Authors to whom correspondence should be addressed.
Int. J. Mol. Sci. 2023, 24(5), 4598; https://doi.org/10.3390/ijms24054598
Submission received: 12 January 2023 / Revised: 22 February 2023 / Accepted: 23 February 2023 / Published: 27 February 2023
(This article belongs to the Section Molecular Biophysics)

Abstract

:
Protein kinase C delta (PKC-δ) is an important signaling molecule in human cells that has both proapoptotic as well as antiapoptotic functions. These conflicting activities can be modulated by two classes of ligands, phorbol esters and bryostatins. Phorbol esters are known tumor promoters, while bryostatins have anti-cancer properties. This is despite both ligands binding to the C1b domain of PKC-δ (δC1b) with a similar affinity. The molecular mechanism behind this discrepancy in cellular effects remains unknown. Here, we have used molecular dynamics simulations to investigate the structure and intermolecular interactions of these ligands bound to δC1b with heterogeneous membranes. We observed clear interactions between the δC1b-phorbol complex and membrane cholesterol, primarily through the backbone amide of L250 and through the K256 side-chain amine. In contrast, the δC1b-bryostatin complex did not exhibit interactions with cholesterol. Topological maps of the membrane insertion depth of the δC1b-ligand complexes suggest that insertion depth can modulate δC1b interactions with cholesterol. The lack of cholesterol interactions suggests that bryostatin-bound δC1b may not readily translocate to cholesterol-rich domains within the plasma membrane, which could significantly alter the substrate specificity of PKC-δ compared to δC1b-phorbol complexes.

Graphical Abstract

1. Introduction

Protein kinase C δ (PKC-δ) is a serine/threonine kinase that plays a central role in regulating cell proliferation [1], growth [2], apoptosis [3,4] and differentiation [5,6]. It is one of the novel PKC isoforms, along with ε, η and θ, which do not require Ca2+ for activation, unlike the conventional PKC isotypes, α, β and γ. PKC-δ is comprised of an N-terminal regulatory domain that is linked to a C-terminal catalytic domain by a flexible hinge region. The regulatory domain contains the C2-like domain, the pseudosubstrate domain, which auto inhibits the catalytic domain, followed by a membrane-binding C1 domain. The C1 domain is comprised of two zinc finger motifs, C1A and C1B, which bind agonists such as diacylglycerol (DAG) and phorbol esters. Upon agonist and membrane binding, PKC-δ undergoes a conformational change which releases the kinase domain from the pseudosubstrate and allows the binding and phosphorylation of substrates. Overexpression of PKC-δ is associated with increased apoptosis and cell cycle arrest in many cell types through p53 activation [2,7,8]. Conversely, the PKC-δ-mediated activation of NFκB is often associated with tumor progression in pancreatic [9], hepatic [10] and breast [11,12,13] cancers as well as with HIV latency reversal in T cells [14,15]. While these cell-type-specific effects complicate our understanding of PKC-δ signaling, the participation of PKC-δ in many signaling cascades gives rise to the attractiveness of PKC-δ modulators as drug targets for a wide range of applications, including HIV latency reversal [14,16,17], anti-cancer therapies [18,19,20,21] and Alzheimer’s treatments [22,23], many of which are currently in clinical trials [24,25].
The endogenous modulator of PKC-δ is diacylglycerol (DAG) which binds to the C1 domain [26,27]. The C1 domain comprises the C1a and C1b regulatory domains, of which the C1b domain (δC1b) is predominantly responsible for anchoring PKC-δ to the plasma membrane upon ligand binding [27,28,29], a process that requires the presence of phosphatidylserine (PS) [30,31]. Bryostatins and phorbol esters are two major classes of PKC-δ modulators that bind to the δC1b domain, but which have opposing effects on cells [16,32,33]. Both efficiently reactivate latent HIV provirus and bryostatins suppress inflammatory cytokine production, limiting T cell responsiveness [34,35,36], while phorbol esters promote excessive inflammatory cytokine production causing uncontrolled immune cell proliferation [37]. The mechanism behind these phenotypic disparities is not yet understood. Both molecules bind to δC1b with an affinity of Kd = 3–4 nM [38,39] and display a similar binding mode involving hydrogen bonding to the backbone amide of T242 and the backbone carbonyl of T242 and L251 [40,41] through an alkoxy group on the drugs. This is a binding mode recapitulated by DAG [41]. In addition, both classes of modulators also bind to other PKC isoforms [38,39]. Collectively, the study of ligand binding to PKC-δ has revealed that the structure and biochemistry of ligand interactions cannot fully explain the disparate cellular responses to different PKC-δ agonists.
The nature of the ligands’ interaction with membrane lipids could be a greater determinant of PKC-δ activity [42,43,44,45]. DAG acyl chain composition greatly affects the membrane recruitment of many PKC isoforms, with longer, more unsaturated chains providing the enhanced activation of novel and conventional PKCs [46,47]. The effects of acyl chain saturation on membrane order parameters are thought to be the driving force behind the phenomenon [44]. Decreased membrane order and the formation of non-lamellar phases are associated with increased PKC activity [48,49,50]. The cooperative effects of DAG and cholesterol on membrane order parameters further promotes PKC-δ recruitment to lipid bilayers and correlates with PKC-δ kinase activity [51,52]. The effect can be recapitulated with ceramides of increasing unsaturation instead of cholesterol, promoting non-bilayer phases, as determined by 2H solid-state NMR [49,53]. In addition, the nature of the ligand may influence the membrane-bound topology of δC1b in homogenous PS membranes [54]. Differences in the interaction of phorbol and bryostatin with water molecules appears to modulate the insertion depth of δC1b and was a clear distinction between the two modulators in molecular dynamics (MD) simulations, suggesting membrane insertion depth might somehow influence PKC-δ activity.
The requirement for PS in PKC-δ activity has led to most MD simulations [44,54,55] and experimental studies [39,48,56] using PS or phosphatidylserine:phosphatidylcholine (PS:PC) model membranes to study PKC activity, which does not reflect the complex composition of the plasma membrane. Given the sensitivity of PKC-δ activity and membrane binding to lipid composition, it is clear the membrane environment beyond the presence of PS is important. However, lipid interactions with peripheral membrane proteins are difficult to detect experimentally without prior knowledge being used to guide the design of appropriate experiments. This is especially difficult in complex membrane systems. Here, we use all atom molecular dynamics simulations to explore the interactions between different δC1b-ligand complexes and heterogenous membranes mimicking the plasma membrane composition, specifically analyzing differences in how these complexes interact with cholesterol. We provide a rationale for the mechanism by which δC1b insertion depth might influence cell signaling as a guide for future experimental studies.

2. Results

2.1. δC1b-Phorbol and δC1b-Bryostatin Show Differential Lipid Headgroup Engagement

To assess the potential for δC1b-ligand complexes to interact with different membrane components, we simulated δC1b bound to phorbol and bryostatin (Figure S1) in heterogenous membranes mimicking the plasma membrane based on the composition used by [57] and comprising 25% cholesterol. Membrane systems were equilibrated after pre-insertion of the δC1b-ligand complex and thus report on interactions post the initial membrane-binding event. We expected to observe extensive interactions with PS through lysine residues, which have been observed in reported MD simulations of the C1b domains of PKC-α [55] and PKC-δ [54], as well as demonstrated experimentally in the structurally analogous C2 [58,59] and C1a domains [27,28,60]. While PS interactions were observed for both ligand complexes (Figure 1a), long-lived interactions were predominantly observed with the δC1b-bryostatin complex. Ionic interactions of ≤6 Å between the phosphate and carboxyl moieties of PS with lysine amine groups of δC1b generally lasted for 100–200 ns and were sampled multiple times during the simulations (Figure 1b,d), on average occupying K271 for 80% and K275 for 26% of the δC1b-bryostatin simulation time (Figure 1c). In contrast, lysine residues of δC1b-phorbol complexes were occupied with PS for only 15% of the simulation time and exhibited reduced interaction stability manifesting as increased distance fluctuations as a function of time (Figure 1b), a phenomenon also reported in simulations of PKC-α in PS:PC membranes [55]. Interestingly, δC1b contains five lysines, but K256, K271 and K275 accounted for almost all of the interactions observed with PS head groups, irrespective of the bound ligand. The close proximity of these lysines to one another also promoted multivalent interactions. In our simulations, multiple lysines were simultaneously engaged with the same PS molecule as well as with multiple PS molecules (Figure 1d), which has been suggested to contribute to the high affinity of PKC for PS membranes [55]. The simulation data is therefore consistent with our experimental knowledge of PKC-δ and its requirement for PS in membrane binding, but also revealed a significant disparity between phorbol- and bryostatin-bound complexes in the occupancy of lysine residues with PS.
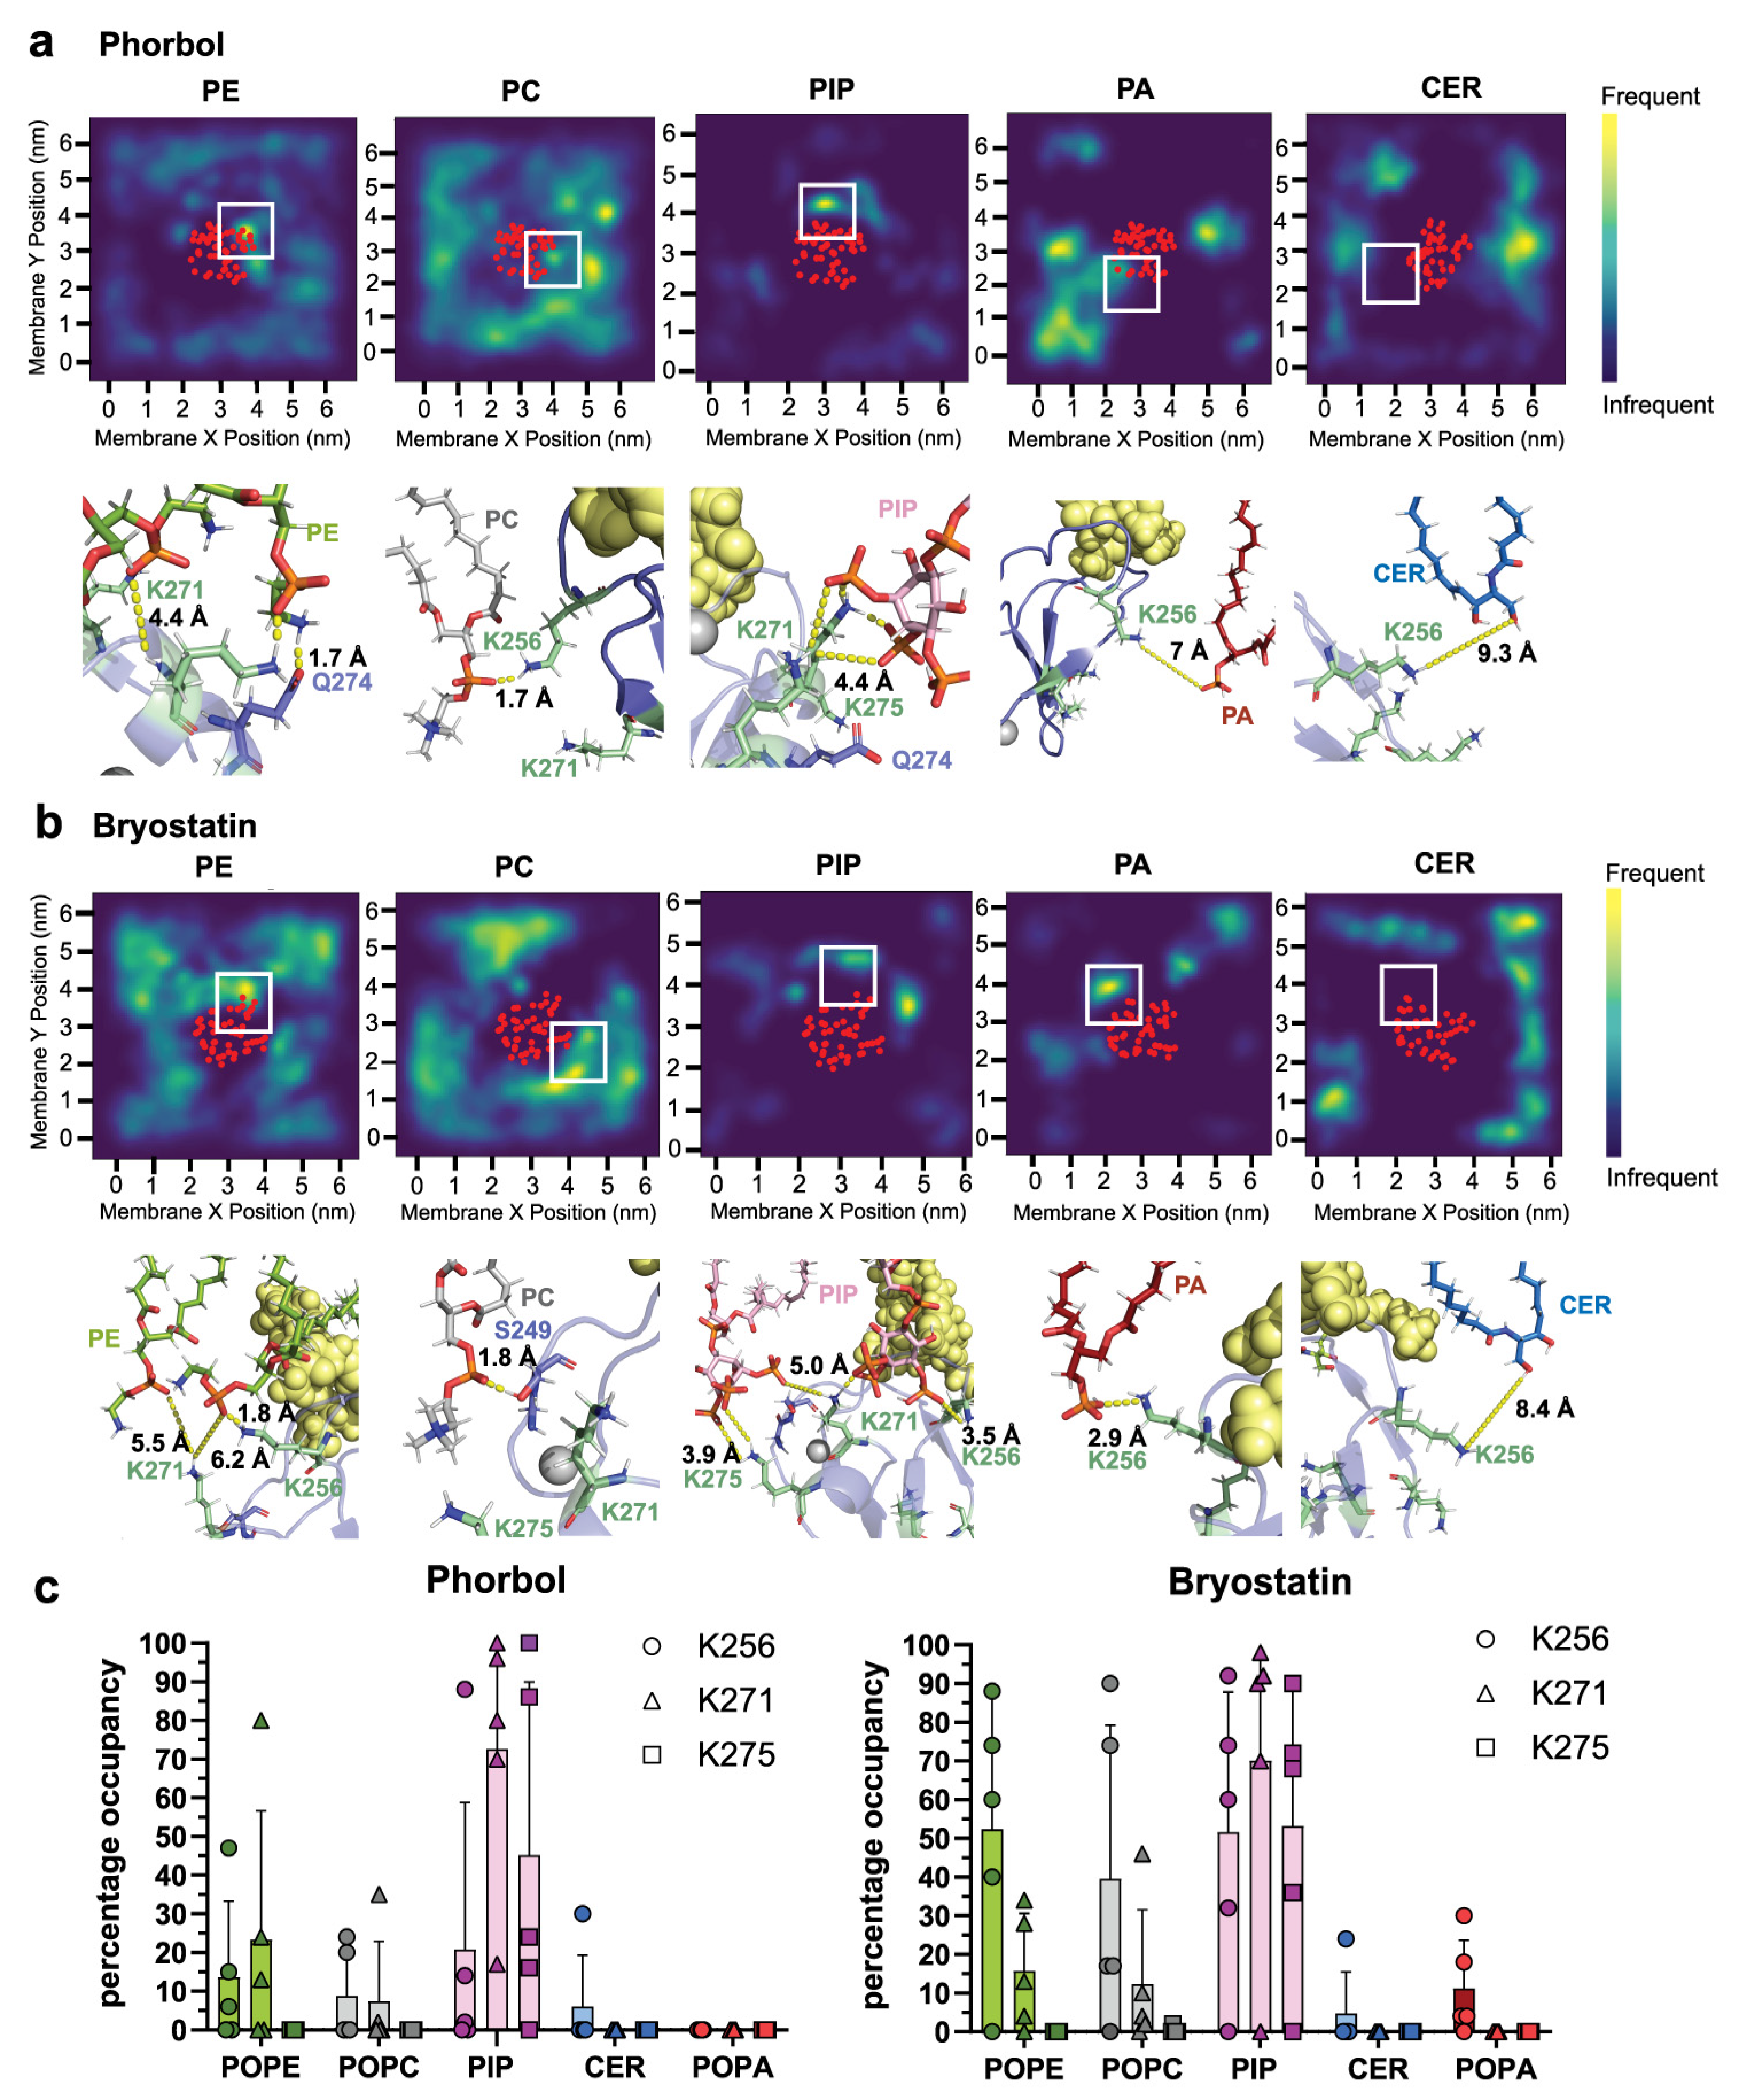
To determine whether this could be explained by occupancy with other lipids we analyzed the interaction of δC1b-lysine residues with other types of lipids. In δC1b-phorbol simulations we observed transient interactions (<10 ns continuous interaction time or <50 ns total interaction time) with phosphate groups of most phospholipids but found the highest occupancy with phosphatidylethanolamine (PE), phosphatidylinositol (PIP) and, to a lesser extent, phosphatidylcholine (PC) (Figure 2a–c). In fact, interactions with PE and PIP exceeded those observed with PS. δC1b-bryostatin complexes also showed significant interactions with PE, PIP and PC. Short–lived interactions with phosphatidic acid (PA) were also observed. No short-range stable interactions were observed between ceramide and δC1b, suggesting ceramide does not interact with surface residues of ligand-δC1b complexes, consistent with the PKC-δ literature. Most of the interactions were concentrated around K256 with no preference for PS. δC1b interactions with PIP were particularly long-lived, forming stable, close (2.6–5 Å) interactions centered around lysines 256, 271 and 275. These interactions were particularly multivalent with other surrounding residues readily participating in the coordination of the multiple phosphates of PIP (Figure 2 and Figure S3). The distribution of δC1b occupancy with various lipids reflects the dynamic nature of the heterogenous membrane. The exchange of lipid groups with one another for residue occupancy is a significant contributor to this distribution. As well as factors such as PIP engagement, which was especially long-lived (Figure S3); thus, whether PIP became engaged early or late in the simulation greatly influenced the net interaction time with other lipids, as the sheer size and charge density of PIP effectively excluded other lipids from the interacting residue. This resulted in a large distribution of residue occupancies across simulations, which would likely even out over a longer simulation period. Together these data reveal δC1b to be stabilized by interactions with a range of lipids through its lysine residues and that membrane association after the initial binding step does not appear to be particularly stabilized by PS association.

2.2. δC1b-Phorbol Interacts with Cholesterol in Heterogenous Membranes

Cholesterol is known to enhanced PKC binding to model membranes, primarily through changes in bilayer order parameters [51,52]. Interactions between cholesterol and C1b have never been observed, although the ligand’s interaction with cholesterol remains unknown. To address this, we analyzed the interactions of δC1b-ligand complexes with membrane cholesterol. Heatmaps of cholesterol localization frequency showed the accumulation of cholesterol at the ligand binding loops of δC1b-phorbol complexes but not in δC1b-bryostatin simulations (Figure 3a). Examination of structures from the simulation revealed no significant direct interactions between cholesterol and phorbol. Instead revealing the accumulation of cholesterol around the binding loops to be due to hydrogen bonding between the amide proton of L250 and the cholesterol hydroxyl (Figure 3d). These interactions were long-lived, lasting for 100–400 ns and occupying L250 for an average 50% of the total simulation time (Figure 3b,c). Interaction lifetimes of δC1b-phorbol with cholesterol exceeded those observed with PS and were largely absent from δC1b-bryostatin simulations. More transient interactions were observed with S240 and K256, exhibiting an average occupancy of 11% and 16%, respectively. An occupancy time equivalent to that of PS interactions (Figure 1c). It can be observed from the interaction lifetime plots that δC1b-phorbol could be engaged with multiple cholesterols at multiple sites simultaneously (Figure 3b), raising the possibility of an avidity-enhancing δC1b-cholesterol association.
Only one of five bryostatin simulations showed a significant interaction between S240 or K256 (Figure 3b,c), and to a lesser extent L250. Manual inspection of the simulations suggested L250 to not be accessible to cholesterol in most simulations due to a shallower membrane topology when bound to bryostatin. Topological heatmaps of the average insertion depth and tilt angle of δC1b-ligand complexes shows δC1b inserts deeper into the membrane when bound to phorbol (Figure 4a), averaging an 8 Å insertion depth and 48° tilt angle compared to 5 Å when bound to bryostatin and with a 38° tilt angle. This is consistent with previous studies [54]. Though the effect appears small, the change in topology positions L250 outside the membrane interface and it is no longer accessible to cholesterol for most of the simulation time (Figure 4b). The sustained interaction of S240 and P241 observed in one of five simulations was predicated on a deeper binding mode in this simulation (Figure S5). Regardless, it can be seen that δC1b-phorbol is significantly engaged in cholesterol interactions, particularly through L250, and this appears to be modulated by insertion depth and tilt angle. An increased tilt with respect to the membrane normal tilts the L250 up towards the membrane, increasing its membrane penetration depth and accessibility to cholesterol, even when the protein’s insertion depth becomes shallower. Thus, the shallower binding mode elicited by the bryostatin-bound complex and the upright positioning of the protein may have an important role in dictating the potential interactions δC1b has with surrounding lipids and its inclusion or exclusion from cholesterol-rich regions. Since the C1b domain is the primary determinant of membrane association of the novel class of PKCs [27,28,29], this could influence PKC-δ accessibility to particular substrates.

2.3. δC1b-Merle27 Mimics δC1b-Phorbol in Insertion Depth and Cholesterol Interactions

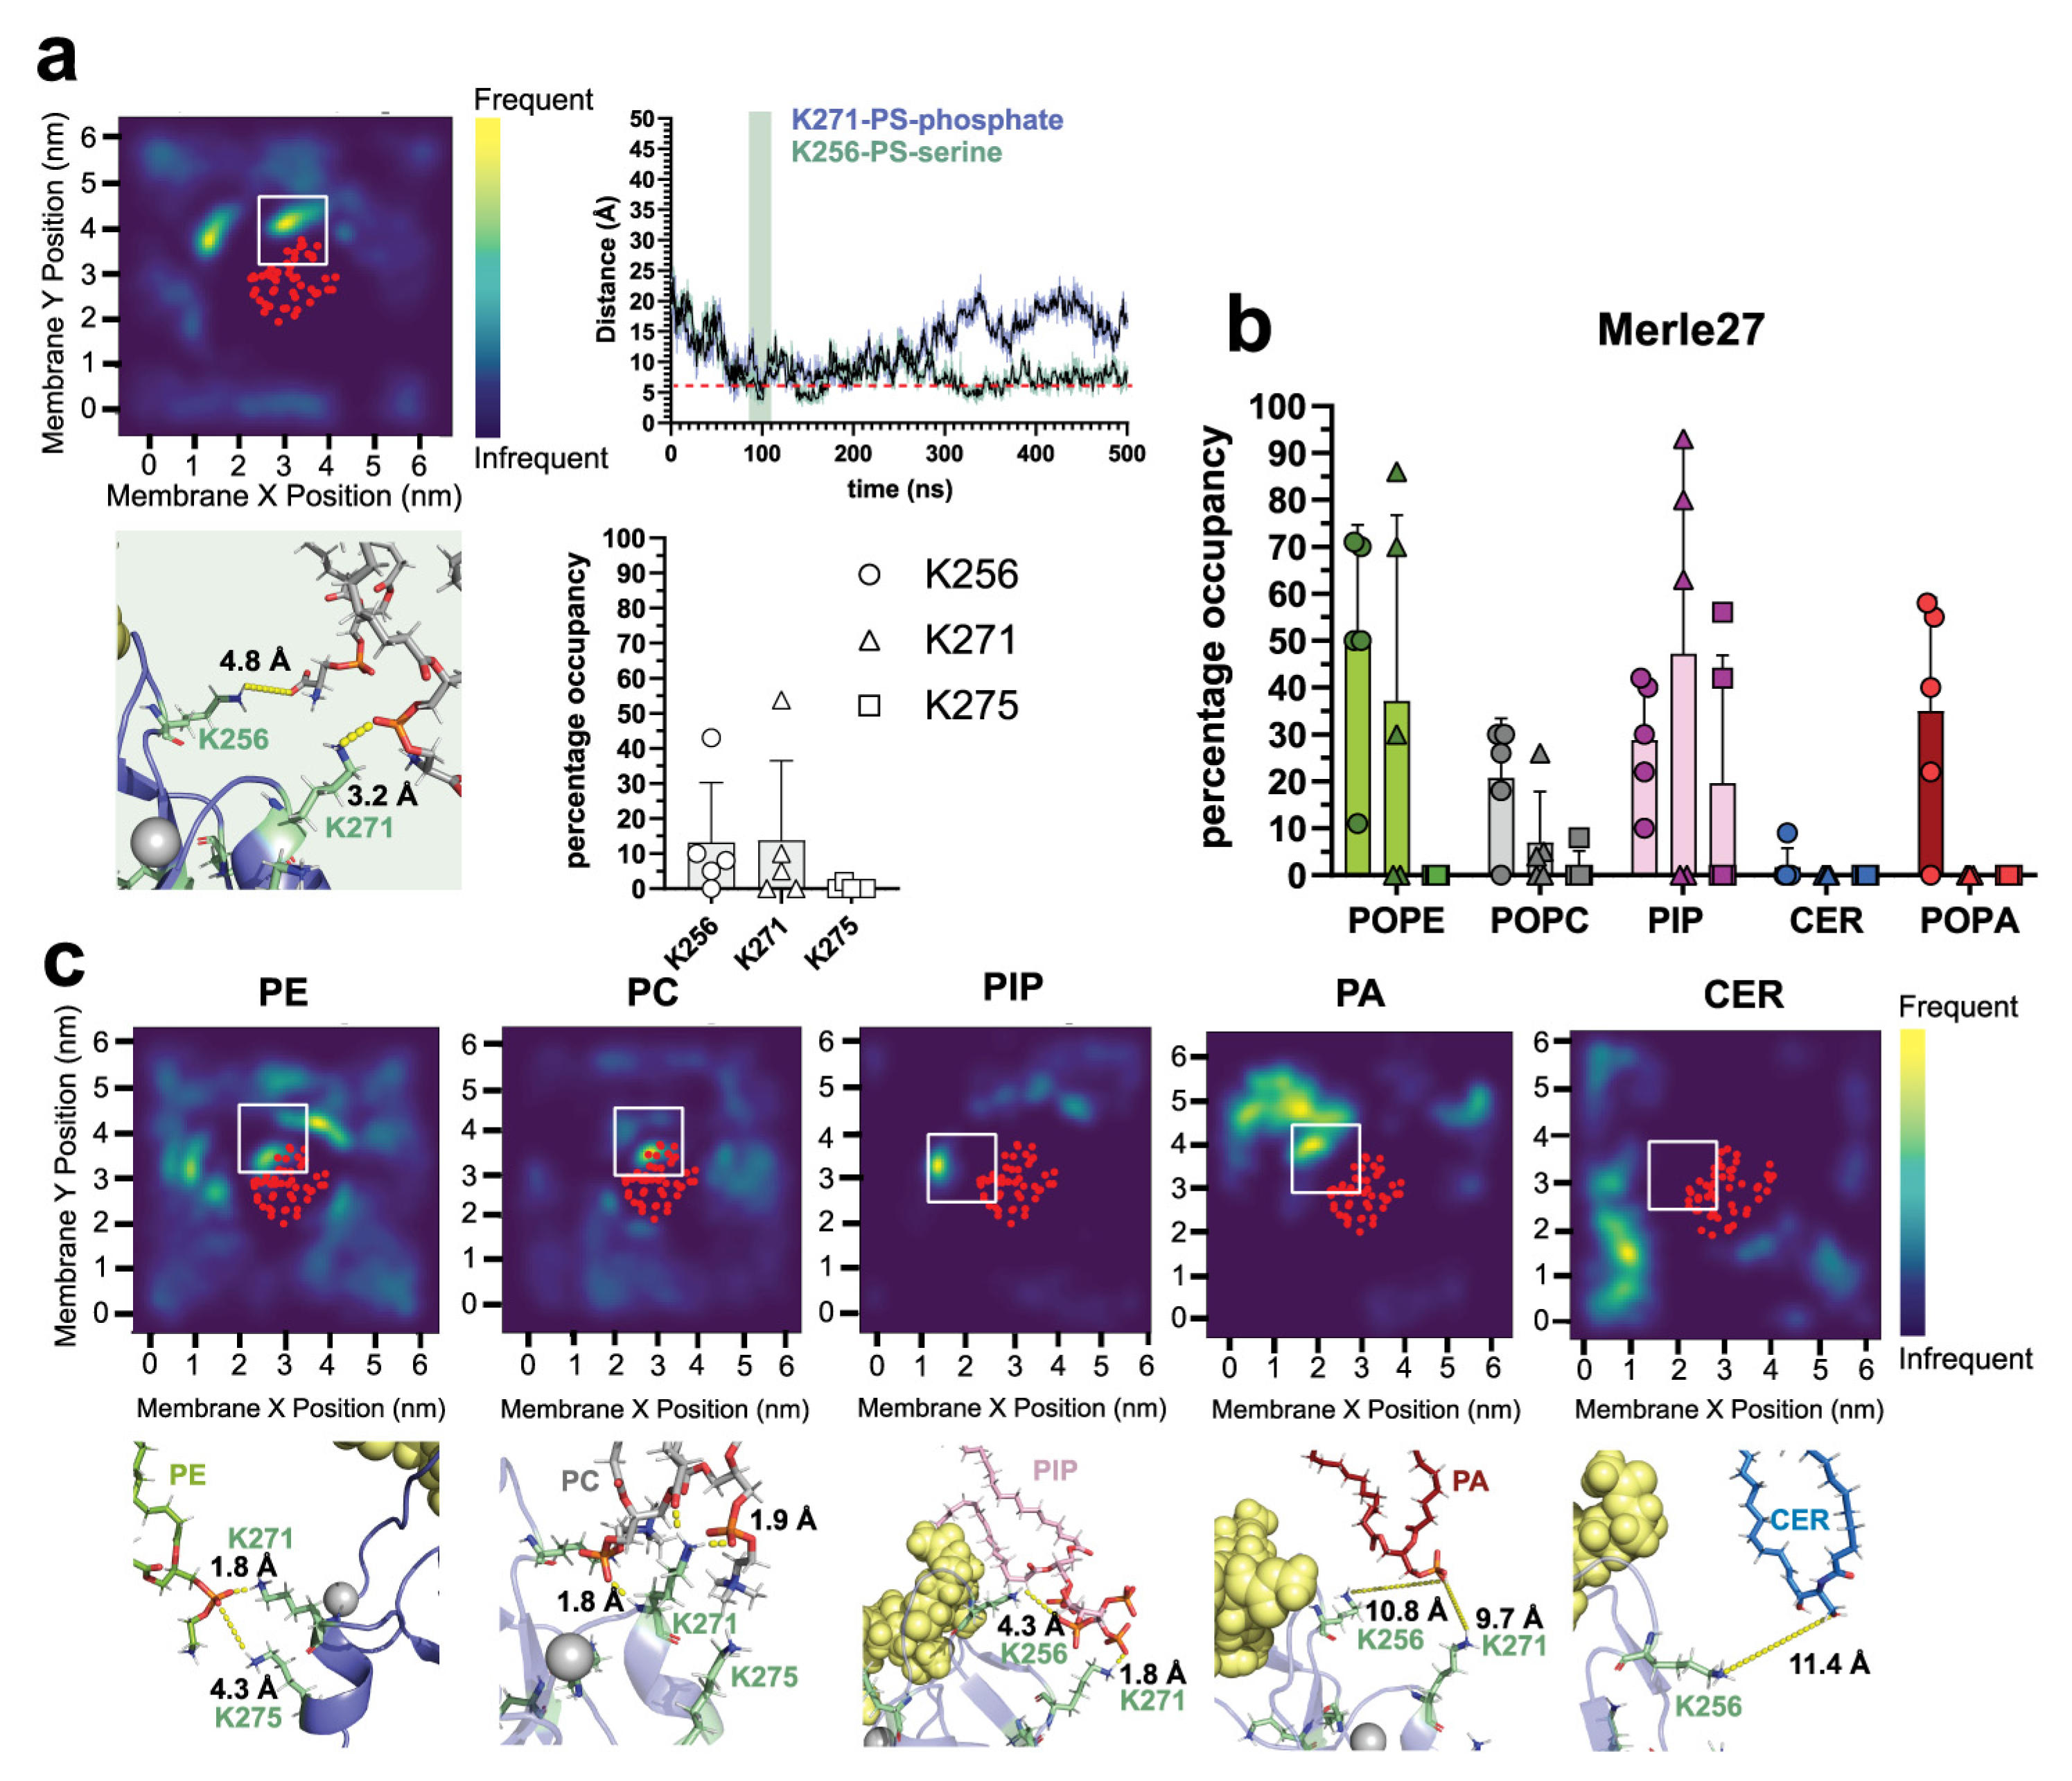
To determine whether insertion depth can explain the distinct biological function of phorbol and bryostatin, we simulated a bryostatin analogue, Merle27. Merle27 is known to elicit cellular responses that are similar to those initiated by phorbol [61], despite its structural similarities to bryostatin (Figure S1). We observed interactions between PS and δC1b-Merle27 lysine residues (Figure 5a,b), predominantly occupying K256 and K271 for an average of 13% of the simulation time (Figure 5a), similar to that observed in δC1b-phorbol simulations (Figure 1c). We also observed increased interactions between δC1b-Merle27 and PE, PC, PIP and PA compared to PS, particularly through K256, similar to that observed in δC1b-bryostatin simulations (Figure 2c and Figure 5c). There were also no interactions with ceramide, as observed for the phorbol and bryostatin complexes.
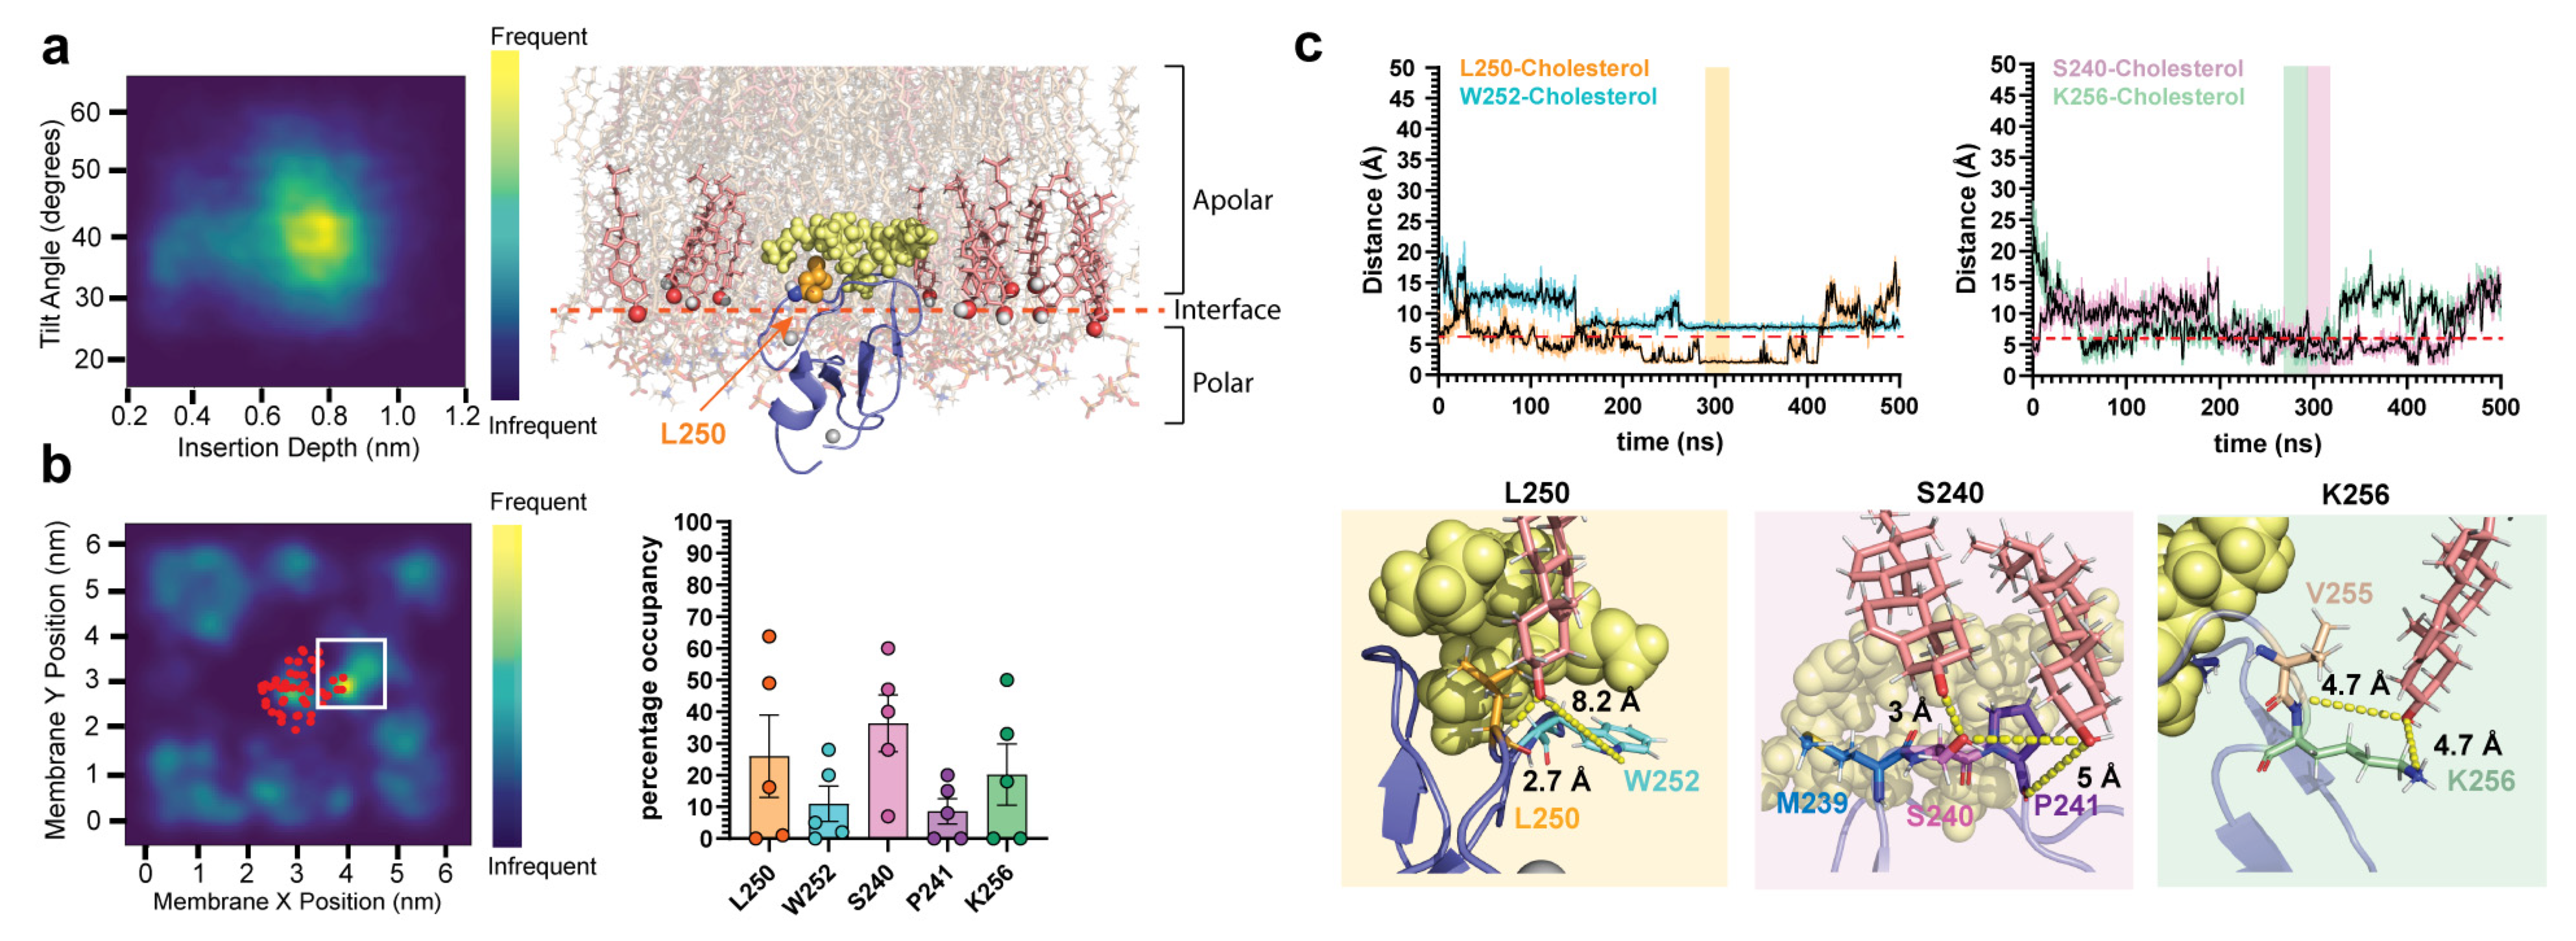
A comparison of topological heatmaps of the δC1b-ligand complexes in Figure 3 with those of δC1b-Merle27 (Figure 6a) shows the δC1b-Merle27 complex to insert deeper into the membrane, at 6.2 Å, but with a tilt angle in between bryostatin and phorbol at 43°. The reduced tilt angle in comparison to phorbol simulations may influence the participation of K256 in interactions with lipid headgroups as this does influence the membrane positioning of K256 (Figure S6). In addition, the δC1b-Merle27 complex exhibited a propensity to interact with cholesterol. We observed shorter-lived interactions between L250 and cholesterol compared to the δC1b-phorbol complexes (Figure 6b), but increased interactions with W252, S240 and K256, which persisted for >100 ns.
The C20 fatty acid of Merle27 extends out near L250, sterically hindering access of cholesterol to this residue and explaining the reduced interaction time observed (Figure S7). In δC1b-Merle27 complexes, the W252 side chain extended away from the ligand and showed a restricted ring-flipping motion compared to δC1b-phorbol complexes, which appears to be due to steric hindrance by the C21 methyl ester of Merle27 (Figures S7 and S8). This tryptophan has been shown to be important in the membrane binding of C1b domains by NMR, but only in the context of DAG binding and not phorbol ester binding [62,63]. In some instances, W252-cholesterol interactions were stabilized by additional hydrogen bonding with the backbone amide nitrogen of G253. δC1b-phorbol did not show interactions with W252, likely due to an increased side-chain motion, which we suggest inhibits long-lasting interactions with cholesterol (Figure S8). In δC1b-bryostatin simulations, it can be seen that the indole nitrogen of W252 is turned inwards and is hydrogen-bonded with bryostatin, stabilizing the protein–ligand complex (Figure S8). This makes the W252 side chain unavailable for interactions with cholesterol in the presence of bryostatin. We also observed the clustering of cholesterol molecules around the S240 and K256 side chain and backbone amide moieties (Figure 6c), engaging multiple cholesterols simultaneously. Overall, our simulations suggest a strong association between δC1b-Merle27 and cholesterol, albeit not site-specific and largely driven by ionic interactions with δC1b backbone amides and cholesterol hydroxyls.

3. Discussion

The mechanism by which different PKC modulators cause disparate cellular phenotypes is unknown. Biochemical and structural studies find little difference in the interaction of modulators, such as phorbol and bryostatin, in terms of binding modes and affinity for PKC to explain the dichotomous phenotypes induced by these modulators. The role of ligand–membrane interactions is known to be important, whereby the ligand influences the insertion depth of PKC and effects membrane order, potentially modulating PKC accessibility to ligands within the membrane. Here, we provide the first indication that insertion depth modulation and ligand hydrogen bonding influences cholesterol interactions with PKC itself and hypothesize how this might impact cell signaling.
MD simulations are a powerful predictive tool for studying membrane–protein interactions [64,65]. Typically, simulations of PKC are conducted in homogenous PS membranes or PS:PC membranes, a composition also typically adopted experimentally. However, cellular membranes are much more complex compositionally. Despite it being difficult or impossible to capture the full complexity in simulations, studying a composition more reminiscent of cellular membranes can reveal previously unknown interactions that may be physiologically relevant. However, the prediction of potential interactions is required in order to design appropriate experimental approaches for detecting these associations. In heterogenous membranes, we observed interactions between the PS and lysine residues of δC1b consistent with published studies [54,55,60]. Stable interactions with other lipids, particularly PIP and PE but to a lesser extent PC and PA, were also identified and support experimental data demonstrating some degree of C1b affinity for anionic lipids and headgroup moieties [66]. However, the occupancy time depended on the bound ligand, with bryostatin promoting the most diverse and longest-lived interactions. The low occupancy of δC1b-phorbol is, however, consistent with published studies of PKCα-C1b [55] and may be reflective of the deeper membrane topology observed in phorbol complexes. This could place lysine residues closer to the interfacial region of the bilayer and beyond close interactions with headgroup moieties. This is supported by the reduced headgroup interactions observed in δC1b-Merle27 simulations, which also exhibited a deep insertion topology. Overall, we found little evidence of specificity for PS over other lipids. Our study does not report on the initial binding of δC1b to heterogenous membranes as the protein–ligand complex is pre-inserted into the bilayer before equilibration and subsequent simulation. The specificity of δC1b for PS membranes may be a requirement for the initial binding event but does not appear to specifically stabilize the complex after insertion beyond the provision of charge contacts which can be adequately supplied by other charged lipids [67]. Multivalent interactions between PS and δC1b-lysine residues could provide an order of magnitude increase in membrane-binding avidity and apparent affinity for PS, as suggested by Voth and colleagues [55]. We also observed multivalent interactions with PS, but especially PIP, with multiple lysine residues coordinating to PS and PIP molecules. While increased binding avidity undoubtedly contributes to the stability of the initial binding event, we believe that this only partly explains the experimental data. Mutagenesis studies have shown little effect of the mutation K271G on δC1b binding to PS membranes [68], a finding recapitulated in conventional PKCs [60]. Our observation of the key involvement of K271 in multivalent interactions (essentially bridging between K275 and K256) would suggest that this multivalent interaction is not essential or is at least redundant with other interactions. It is possible that the mutation of K271G alters the membrane-binding topology, allowing K260 and K234 increased participation in headgroup interactions during the initiation of membrane binding and possibly compensating for the loss of this K271 bridge.
The implication of membrane insertion depth as a distinction between δC1b-phorbol and δC1b-bryostatin were identified in MD simulations by Pande and co-workers in PS membranes [54]. Chelation of water molecules to bryostatin was suggested as a mechanism by which δC1b-bryostatin adopts a shallower binding mode in PS membranes, a topology we recapitulate in heterogenous membranes, suggesting the membrane composition does not determine δC1b insertion depth. However, we find cholesterol has a strong propensity to associate with more deeply embedded δC1b-ligand complexes which could be physiologically significant. Insertion depth appeared to modulate cholesterol interactions through the residues L250, S240 and K256. These interactions were largely absent from δC1b-bryostatin simulations. Furthermore, many of these interactions persisted for 100–200 ns within 6 Å suggesting stable associations [69]. There are no studies published to date (to our knowledge) on the potential for cholesterol to interact directly with PKC-δ. Conventional PKC kinase activity has been associated with cholesterol in terms of substrate specificity [70], which was due to a reduction in membrane order and the promotion of non-bilayer lipid phases [51,52,71]. Mutation studies of PKC-δ show that L250G mutants have significantly reduced kinase activity and membrane binding to PS bilayers [68]. Although this study does not report on the potential localization differences of the L250G mutant in bilayers containing cholesterol, the result most likely suggests a change in hydrophobicity by the L250G mutant. This may affect membrane insertion, as suggested by recent elegant work by Igumenova and colleagues [41]. Alternatively, the L250G mutant could exhibit increased flexibility about the backbone position of this residue due to the mutation to glycine which may influence stable ligand binding and may not reflect membrane association per se. Such an effect might also be predicted to influence long-lived interactions with cholesterol.
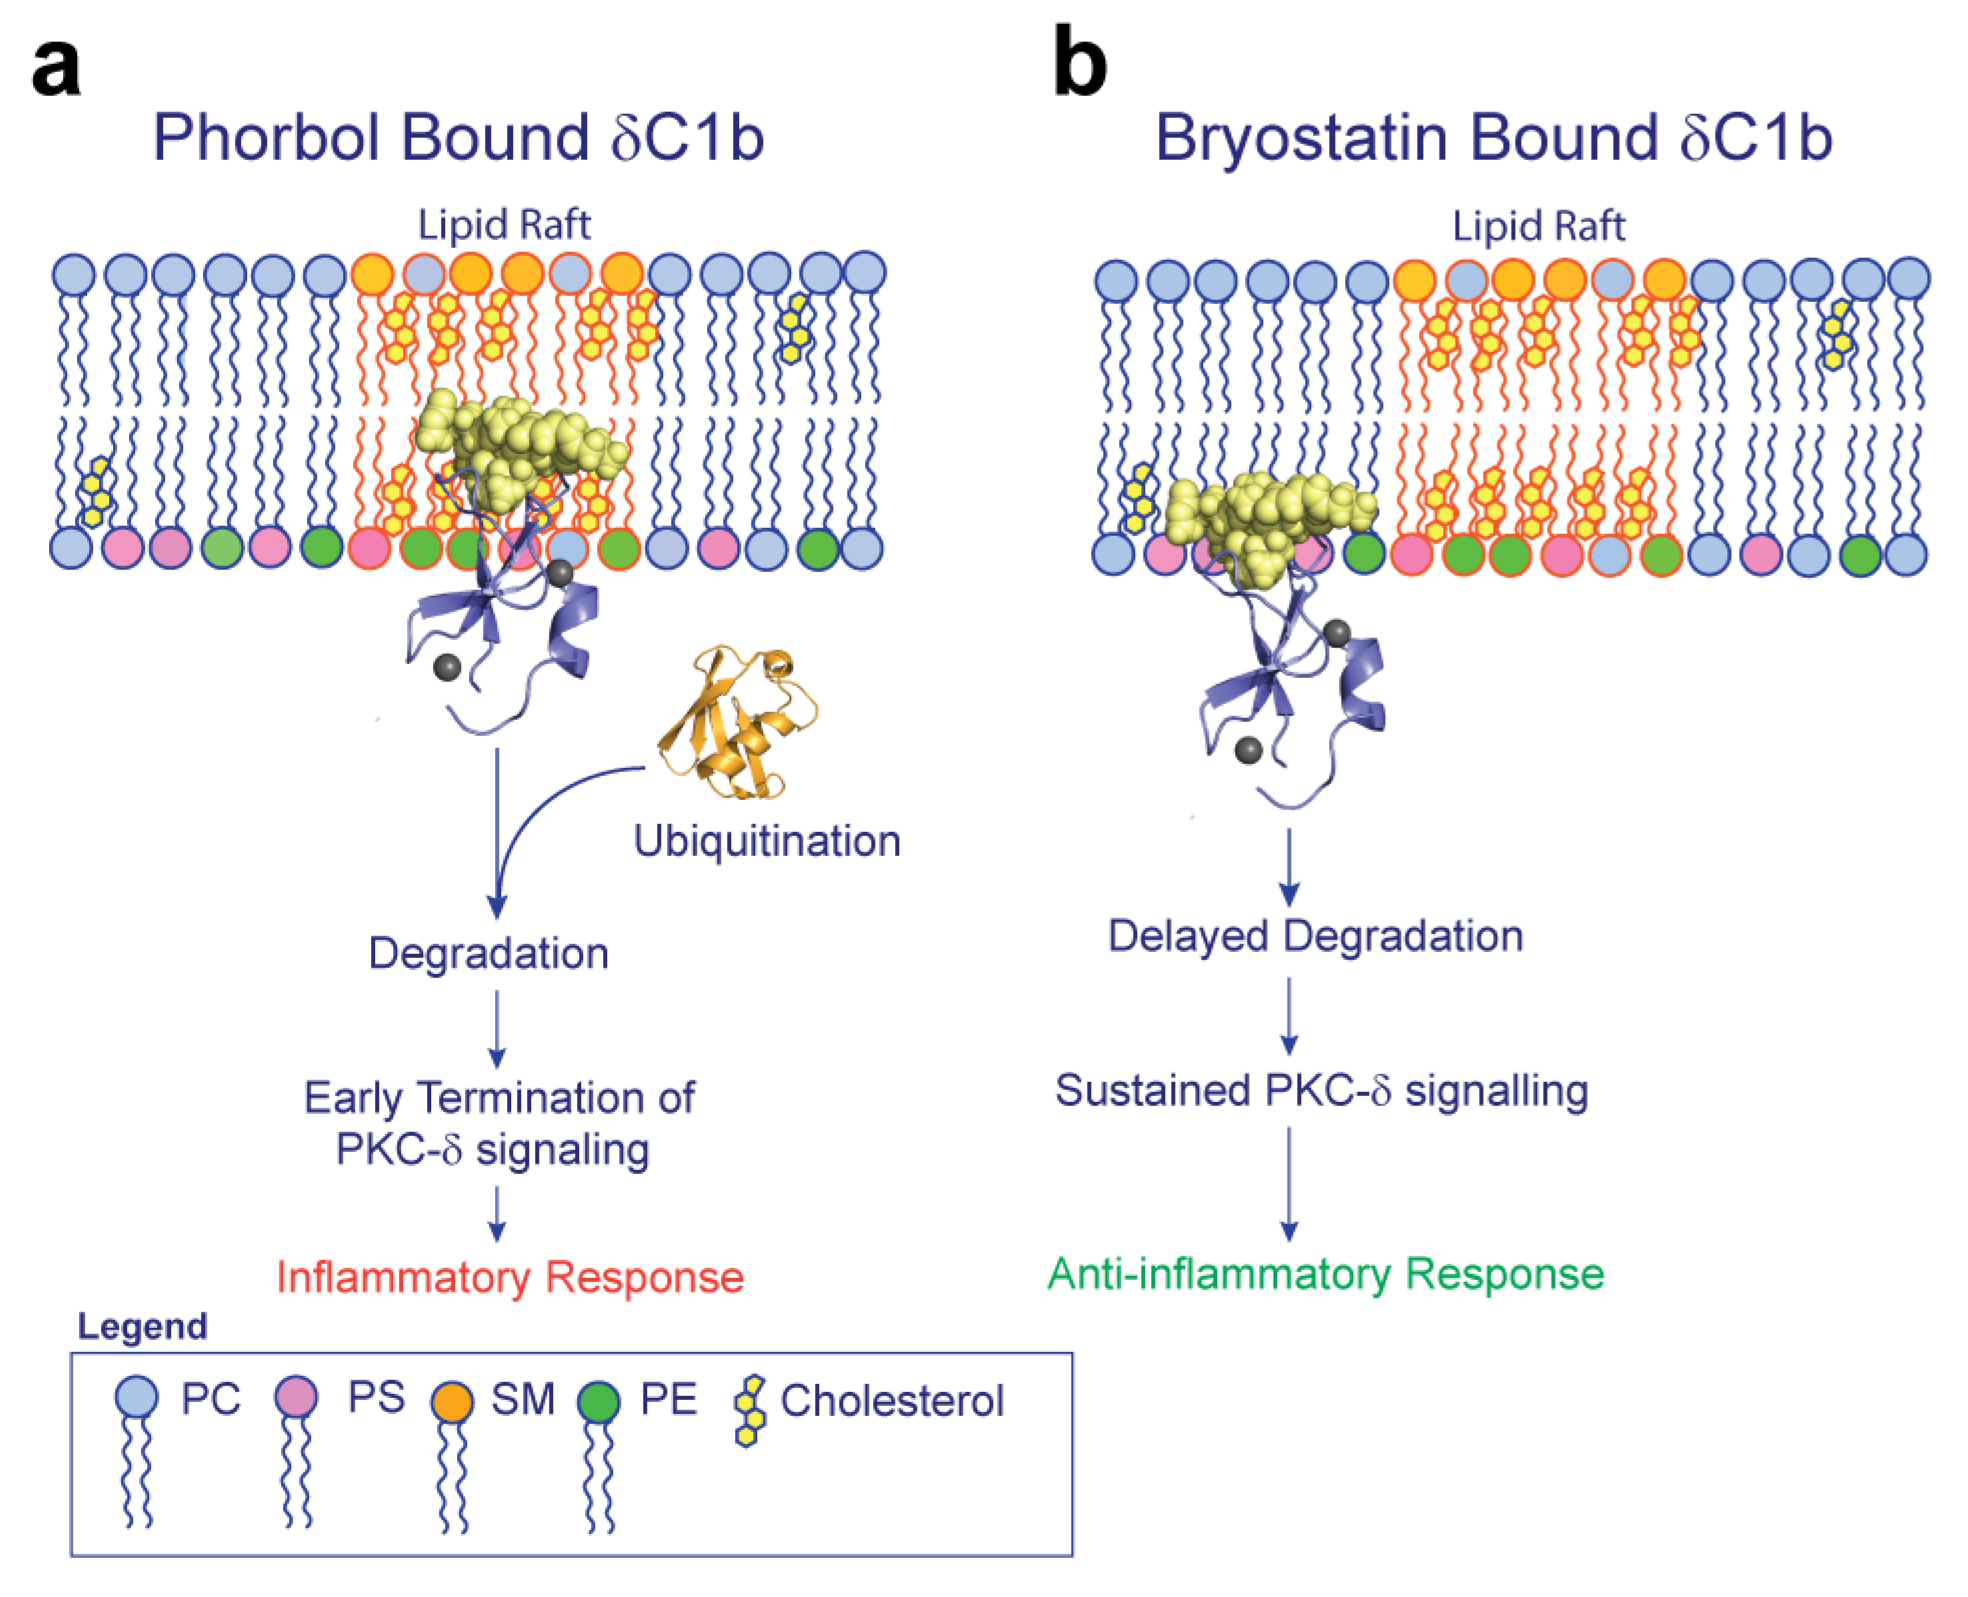
In model membrane systems, the addition of cholesterol increases the propensity of PS bilayers to form non-lamellar phases [52]. PS promotes non-bilayer phases and lowers bilayer order due to its small headgroup to tail volume ratio [72]. This phenomenon is enhanced by the presence of unsaturated acyl chains, particularly associated with DAG. The recruitment of PKC to cell membranes is increased in the presence of polyunsaturated DAG, the endogenous ligand of the PKC C1 domain, and is linked to enhanced PKC activity [43]. Recent MD simulations provide a rationale for this effect, suggesting DAG unsaturation increases solvent accessibility of the glycerol alkoxy, presumably increasing its availability for PKC binding. The effect was enhanced by the presence of cholesterol [73], essentially suggesting a shallower binding mode of DAG with increasing acyl chain unsaturation correlated with increased PKC activation [47,48]. This shallower binding topology may indeed increase PKC accessibility to membrane-embedded ligands. It is currently unclear whether this shallower binding mode is maintained after δC1b engagement, but it is likely that that the thermodynamic landscape shifts after PKC binding due to hydrogen bonding of the DAG alkoxy group by C1b, promoting deeper insertion of the hydrophobic surface formed by the ligand [41]. As we observed significant differences in membrane insertion depth of δC1b when bound to different ligands and within identical membrane compositions, we do not think that headgroup composition influences the membrane insertion depth of δC1b after the initial binding event. In addition, the calculated insertion depths are equivalent to that observed in PS homogenous membranes [54]. Therefore, it seems likely that the ligand alone determines the δC1b insertion depth. Thus, we hypothesize that after the initial binding event, the ligand’s interaction with water influences the insertion depth of the protein which determines cholesterol interactions and the potential to associate with cholesterol-rich regions, driving lipid raft partitioning (Figure 7). The interactions we observed are not cholesterol binding sites per se, but we suggest that the backbone orientation of residues in the β12 and β34 loops expose backbone amides for cholesterol–hydroxyl interactions and are thermodynamically favorable when δC1b inserts deeply into the hydrophobic environment of the inner bilayer. The potential for cholesterol to directly interact with the L250 backbone amide of δC1b bound to phorbol could be experimentally determined through NMR studies using isotopically labeled δC1b and 13C-labeled cholesterol. As the interaction appears to be somewhat dynamic, we would expect low dynamic systems and methods such as low temperature solid-state NMR to perform the best at demonstrating this potential interaction.
Lipid raft partitioning has long been associated with the spatial regulation of cell signaling [75,76]. It is known that phorbol esters promote the partitioning of PKC-δ into lipid rafts [77], followed by its rapid degradation [74]. While the microdomain localization of PKC-δ following bryostatin stimulation is unknown, the degradation of PKC-δ is delayed following bryostatin stimulation, which has tangible outcomes on the differentiation of keratinocytes [78]. As the cellular phenotypes of phorbol-stimulated cells compared to bryostatin-stimulated cells recapitulates the phenotypes of PKC-δ deficient [79,80] and PKC-δ overexpressing cells [7,81,82], respectively, we hypothesize that the temporal regulation of PKC-δ degradation could adequately explain the phenotypic differences observed between these two drugs. The hypothesis is readily testable by observing the colocalization of bryostatin-bound PKC to non-raft microdomains within the plasma membrane, either by Western blotting of fractionated cell lysates or super resolution microscopy. The spatiotemporal regulation of cell signaling is not new and has been suggested as a mechanism for PKC regulation by Newton and colleagues [83,84]. Elegant work by Berg and coworkers also demonstrate the sensitivity of T cell phenotypes to this kind of regulation [85]. The temporal delay of transcription factor translocation into the nucleus by weak TCR agonists is sufficient to attenuate the T cell response, despite the identity of involved transcription factors between strong agonists and weak agonists being the same. We hypothesize that PKC-δ could be subject to this kind of regulation and that differential raft-mediated signaling is one mechanism by which these pathways could be regulated.

4. Materials and Methods

4.1. Preparation of Protein–Ligand Complexes

4.1.1. δC1b-Phorbol Complex

The crystal structure of the mouse δC1b regulatory domain of PKC-δ bound to phorbol 13-acetate was obtained from the RCSB Protein Data Bank (PDB ID: 1PTR). The Orientation of Proteins in Membranes (OPM) PPM server [86] was used to obtain a structure with the initial orientation and insertion depth into a membrane and was saved as a PDB file. This structure was then used in the Membrane Builder module of the online CHARMM-GUI interface [86,87], which creates a pre-equilibrated membrane around the inserted protein. A heterogeneous membrane bilayer with cholesterol, phosphatidylethanolamine (PE), phosphatidylcholine (PC), phosphatidylserine (PS), phosphatidic acid (PA), phosphatidylinositol (PIP) and ceramide (CER) was constructed with the lipid composition shown in Table 1. Lower leaflet numbers are slightly lower due to the presence of the inserted δC1b-ligand complex. A water height of 17 was used with the TIP3P water model, and a neutralizing amount of ions were added using the replacement method. The protein–ligand complex was parameterized with CGenFF and input files for GROMACS [88] were generated for use with the CHARMM36m [89] forcefield, with a system temperature of 310.15 K. This process was repeated for a total of 5 δC1b-phorbol systems.

4.1.2. δC1b-Bryostatin and δC1b-Merle 27 Complexes

As above, the crystal structure of the C1b regulatory domain of PKC-δ bound to phorbol 13-acetate was obtained (PDB ID: 1PTR). The ligand was removed using the BIOVIA Discovery Studio Visualizer (BIOVIA (2020), Dassault Systèmes, San Diego, CA, USA). The bryostatin and Merle27 structures were sketched as mol2 files in the BIOVIA Discovery Studio Visualizer. The AutoDock Tools package [90] was used to create pdbqt files of the protein and ligands. The size of the three-dimensional grid box for docking was set to 18, 26, 16 (x, y, z) and centered at 10.707, 21.52, 25.199 (x, y, z). The docking was performed using an AutoDock Vina in Ubuntu 16.4 with exhaustiveness = 10 and energyrange = 5 kcal/mol. From the resulting files, one structure exhibited the expected interaction between the C1 carbonyl on bryostatin/Merle27 with Gly253. This structure was used to generate input files for GROMACS, with a membrane composition shown in Table 2. As with phorbol, this process was repeated for a total of 5 C1b-bryostatin and 5 C1b-Merle27 systems. The RMSD between the post-equilibration structures for the C1b-bryostatin and C1b-phorbol simulations was 0.398 Å, and 0.364 Å for the C1b-Merle27 and C1b-phorbol structures. RMSD fluctuations across the production runs as a function of time are shown in Figure S9b).

4.2. Molecular Dynamics Simulations

All 15 systems comprising the three δC1b/ligand complexes were energy minimized, equilibrated, and simulated using the CHARMM36m forcefield [91] with GROMACS. All systems were simulated out to 500 ns (2.5 μs total for each complex). Residue Y6 of the C1b-domain crystal structure was mutated to H6 to model human PKC. Cysteines involved in zinc ion coordination were deprotonated, and all other residues were protonated as dictated by their pKa values at pH 7.4. Zinc ions were restrained so that they remained coordinated within their zinc finger motifs with harmonic springs. A lack of restraints resulted in a loss of coordination of the zinc ions with their respective residues. Energy minimization was completed with the steepest descent method using a Berendsen thermostat and a barostat for a maximum of 5000 steps or until Fmax < 1000 kJ/mol/nm was reached (Figure S9a). Equilibration for a total time of 1125 picoseconds with a pressure of 1 bar and reference temperature of 310.15 K was carried out. Equilibration was assessed based on the area per lipid stability (Figure S9d). All bonds with rigid hydrogen atoms were kept with the LINCS algorithm, and long-range electrostatic interactions were investigated with the particle-mesh Ewald algorithm. The production runs were carried out at 310.15 K with times steps of 2 fs using a Nose-Hoover thermostat and Parrinello–Rahman barostat. Periodic boundary conditions in x, y, z dimensions were used with a final box size of approximately 60 × 60 × 90 Å in x, y, z, respectively.

4.3. Data Analysis

Data analysis was carried out using home-written PYTHON code, including MDTraj [92] to read the trajectories into the code. Heatmaps were obtained by tracking the x and y position of the atoms listed below in the lower leaflet housing the protein–ligand complexes. Cholesterol heatmaps were generated by tracking the position the oxygen of cholesterol and the amide nitrogen of L250, indole nitrogen of W252, side-chain oxygen or amide nitrogen of S240, backbone carbonyl oxygen or amide nitrogen of P241 and the side-chain amine nitrogen of K256. Heatmaps of lipid headgroup interactions were generated by tracking the position of the side-chain amine nitrogen of K256, K271, K275 and K260 and the position of phosphatidylserine phosphate oxygens and carboxylic oxygens, phosphatidylethanolamine phosphate oxygens, phosphatidylcholine phosphate oxygens, phosphatidylinositol phosphate oxygens, phosphatidic acid phosphate oxygen and ceramide glycerol hydroxyl oxygens. The same method was used for obtaining the average position of the backbone of the δC1b domain using the Cα carbons. Occupancy was defined as the distance between the atoms listed above being within ≤6 Å. Insertion depth was determined as the z-position of Gly253 relative to the average z-position of the PS phosphate groups. The stability and equilibration of the system was also assessed by assessing insertion depth over time (Figure S9c). Tilt angle was determined by calculating a centroid for the upper third of the C1b domain (using residues M239, P241, G253, and V255) and the bottom third of the C1b domain (using residues P233, H246, D263, and V276). A vector passing through these two centroids forms an angle with a line perpendicular to the membrane normal. This angle was used to report the tilt of the C1b domain in the membrane. PyMOL [93] was used to observe the structure and trajectories for each system. Graphical plots of interaction data were generated in GraphPad Prism 9.

5. Conclusions

Through molecular dynamics simulations, we show that cholesterol interacts with the δC1b domain. Through topological changes and variations in δC1b-lipid interactions, the δC1b domain displays a significant decrease in cholesterol interactions when bound to bryostatin due to a shallow membrane insertion depth. This decrease in the δC1b domain’s interactions with cholesterol when bound to bryostatin could affect its likelihood of translocating to cholesterol-rich regions of the cell membrane, such as lipid rafts, which could alter substrate accessibility and degradation rates of PKC-δ, thereby influencing cell signaling. This work highlights the importance of including physiologically relevant lipids into simulations of membrane–protein interactions.

Supplementary Materials

The following supporting information can be downloaded at: https://www.mdpi.com/article/10.3390/ijms24054598/s1.

Author Contributions

Conceptualization, P.T.J., S.A.O. and A.B.B.; Data curation, P.T.J.; Formal analysis, P.T.J. and S.A.O.; Funding acquisition, A.B.B.; Investigation, P.T.J.; Methodology, P.T.J. and S.A.O.; Visualization, S.A.O.; Writing—original draft, P.T.J. and S.A.O.; Writing—review and editing, S.A.O. and A.B.B. All authors have read and agreed to the published version of the manuscript.

Funding

This research was funded by the Camille Dreyfus Teacher-Scholar Awards Program (A.B.B.) and internal ETH funding and funding from the Swiss National Science Foundation (201070 to A.B.B).

Data Availability Statement

The data presented in this study are available on request from the corresponding authors.

Acknowledgments

We thank Andrew McShan for critical feedback on the manuscript.

Conflicts of Interest

The authors declare no conflict of interest. The funders had no role in the design of the study; in the collection, analyses, or interpretation of data; in the writing of the manuscript; or in the decision to publish the results.

Abbreviations

Protein Kinase C (PKC), Molecular Dynamics (MD), phosphotidylethanolamine (PE), phosphatidic acid (PA), phosphatidylinositol phosphate (PIP), ceramide (CER), phosphotidylserine (PS), phosphotidylcholine (PC), diacylglycerol (DAG), nuclear magnetic resonance (NMR).

References

  1. Liu, B.; Ryer, E.J.; Kundi, R.; Kamiya, K.; Itoh, H.; Faries, P.L.; Sakakibara, K.; Kent, K.C. Protein Kinase C-δ Regulates Migration and Proliferation of Vascular Smooth Muscle Cells through the Extracellular Signal-Regulated Kinase 1/2. J. Vasc. Surg. 2007, 45, 160–168. [Google Scholar] [CrossRef] [Green Version]
  2. Livneh, E.; Fishman, D.D. Linking Protein Kinase C to Cell-Cycle Control. Eur. J. Biochem. 1997, 248, 1–9. [Google Scholar] [CrossRef]
  3. Reyland, M.E. Protein Kinase Cδ and Apoptosis. Biochem. Soc. Trans. 2007, 35, 1001–1004. [Google Scholar] [CrossRef] [PubMed]
  4. Basu, A.; Pal, D. Two Faces of Protein Kinase Cδ: The Contrasting Roles of PKCδ in Cell Survival and Cell Death. Sci. World J. 2010, 10, 2272–2284. [Google Scholar] [CrossRef] [Green Version]
  5. Nishizuka, Y. Protein Kinase C and Lipid Signaling for Sustained Cellular Responses. FASEB J. 1995, 9, 484–496. [Google Scholar] [CrossRef] [PubMed]
  6. Takai, Y.; Kishimoto, A.; Kikkawa, U.; Mori, T.; Nishizuka, Y. Unsaturated Diacylglycerol as a Possible Messenger for the Activation of Calcium-Activated, Phospholipid-Dependent Protein Kinase System. Biochem. Biophys. Res. Commun. 1979, 91, 1218–1224. [Google Scholar] [CrossRef]
  7. Watanabe, T.; Ono, Y.; Taniyama, Y.; Hazama, K.; Igarashi, K.; Ogita, K.; Kikkawa, U.; Nishizuka, Y. Cell Division Arrest Induced by Phorbol Ester in CHO Cells Overexpressing Protein Kinase C-δ Subspecies. Proc. Natl. Acad. Sci. USA 1992, 89, 10159–10163. [Google Scholar] [CrossRef] [PubMed] [Green Version]
  8. Dashzeveg, N.; Yoshida, K. Crosstalk between Tumor Suppressors P53 and PKCδ: Execution of the Intrinsic Apoptotic Pathways. Cancer Lett. 2016, 377, 158–163. [Google Scholar] [CrossRef] [PubMed]
  9. El-Rayes, B.F.; Ali, S.; Philip, P.A.; Sarkar, F.H. Protein Kinase C: A Target for Therapy in Pancreatic Cancer. Pancreas 2008, 36, 346–352. [Google Scholar] [CrossRef]
  10. Wu, C.-H.; Hsu, F.-T.; Chao, T.-L.; Lee, Y.-H.; Kuo, Y.-C. Revealing the Suppressive Role of Protein Kinase C δ and P38 Mitogen-Activated Protein Kinase (MAPK)/NF-ΚB Axis Associates with Lenvatinib-Inhibited Progression in Hepatocellular Carcinoma In Vitro and In Vivo. Biomed. Pharmacother. 2022, 145, 112437. [Google Scholar] [CrossRef]
  11. Leonard, B.; McCann, J.L.; Starrett, G.J.; Kosyakovsky, L.; Luengas, E.M.; Molan, A.M.; Burns, M.B.; McDougle, R.M.; Parker, P.J.; Brown, W.L.; et al. The PKC/NF-ΚB Signaling Pathway Induces APOBEC3B Expression in Multiple Human Cancers. Cancer Res. 2015, 75, 4538–4547. [Google Scholar] [CrossRef] [PubMed] [Green Version]
  12. Grossoni, V.C.; Falbo, K.B.; Kazanietz, M.G.; de Kier Joffé, E.D.B.; Urtreger, A.J. Protein Kinase C δ Enhances Proliferation and Survival of Murine Mammary Cells. Mol. Carcinog. 2007, 46, 381–390. [Google Scholar] [CrossRef] [PubMed]
  13. Lønne, G.K.; Masoumi, K.C.; Lennartsson, J.; Larsson, C. Protein Kinase Cδ Supports Survival of MDA-MB-231 Breast Cancer Cells by Suppressing the ERK1/2 Pathway. J. Biol. Chem. 2009, 284, 33456–33465. [Google Scholar] [CrossRef] [PubMed] [Green Version]
  14. Williams, S.A.; Chen, L.; Kwon, H.; Fenard, D.; Bisgrove, D.; Verdin, F.; Greene, W.C. Prostratin Antagonizes HIV Latency by Activating NF-KB. J. Biol. Chem. 2014, 279, 42008–42017. [Google Scholar] [CrossRef] [Green Version]
  15. Verdin, E.; Paras, P., Jr.; van Lint, C. Chromatin Disruption in the Promoter of Human Immunodeficiency Virus Type 1 during Transcriptional Activation. EMBO J. 1993, 12, 3249–3259. [Google Scholar] [CrossRef]
  16. Marsden, M.D.; Wu, X.; Navab, S.M.; Loy, B.A.; Schrier, A.J.; DeChristopher, B.A.; Shimizu, A.J.; Hardman, C.T.; Ho, S.; Ramirez, C.M.; et al. Characterization of Designed, Synthetically Accessible Bryostatin Analog HIV Latency Reversing Agents. Virology 2018, 520, 83–93. [Google Scholar] [CrossRef]
  17. Sloane, J.L.; Benner, N.L.; Keenan, K.N.; Xiaoyu, Z.; Soliman, M.S.A.; Xiaomeng, W.; Melanie, D.; Tae-Wook, C.; Marsden, M.; Zack, J.A.; et al. Prodrugs of PKC Modulators Show Enhanced HIV Latency Reversal and an Expanded Therapeutic Window. Proc. Natl. Acad. Sci. USA 2020, 117, 10688–10698. [Google Scholar] [CrossRef]
  18. Ajani, J.A.; Jiang, Y.; Faust, J.; Chang, B.B.; Ho, L.; Yao, J.C.; Rousey, S.; Dakhil, S.; Cherny, R.C.; Craig, C.; et al. A Multi-Center Phase II Study of Sequential Paclitaxel and Bryostatin-1 (NSC 339555) in Patients with Untreated, Advanced Gastric or Gastroesophageal Junction Adenocarcinoma. Investig. New Drugs 2006, 24, 353. [Google Scholar] [CrossRef] [PubMed]
  19. Le, T.T.T.; Gardner, J.; Hoang-Le, D.; Schmidt, C.W.; MacDonald, K.P.; Lambley, E.; Schroder, W.A.; Ogbourne, S.M.; Suhrbier, A. Immunostimulatory Cancer Chemotherapy Using Local Ingenol-3-Angelate and Synergy with Immunotherapies. Vaccine 2009, 27, 3053–3062. [Google Scholar] [CrossRef] [PubMed]
  20. Barr, P.M.; Lazarus, H.M.; Cooper, B.W.; Schluchter, M.D.; Panneerselvam, A.; Jacobberger, J.W.; Hsu, J.W.; Janakiraman, N.; Simic, A.; Dowlati, A.; et al. Phase II Study of Bryostatin 1 and Vincristine for Aggressive Non-Hodgkin Lymphoma Relapsing after an Autologous Stem Cell Transplant. Am. J. Hematol. 2009, 84, 484–487. [Google Scholar] [CrossRef] [Green Version]
  21. Carducci, M.A.; Musib, L.; Kies, M.S.; Pili, R.; Truong, M.; Brahmer, J.R.; Cole, P.; Sullivan, R.; Riddle, J.; Schmidt, J.; et al. Phase I Dose Escalation and Pharmacokinetic Study of Enzastaurin, an Oral Protein Kinase C Beta Inhibitor, in Patients with Advanced Cancer. J. Clin. Oncol. 2006, 24, 4092–4099. [Google Scholar] [CrossRef]
  22. Du, Y.; Zhao, Y.; Li, C.; Zheng, Q.; Tian, J.; Li, Z.; Huang, T.Y.; Zhang, W.; Xu, H. Inhibition of PKCδ Reduces Amyloid-β Levels and Reverses Alzheimer Disease Phenotypes. J. Exp. Med. 2018, 215, 1665–1677. [Google Scholar] [CrossRef] [PubMed] [Green Version]
  23. Etcheberrigaray, R.; Tan, M.; Dewachter, I.; Kuipéri, C.; Van der Auwera, I.; Wera, S.; Qiao, L.; Bank, B.; Nelson, T.J.; Kozikowski, A.P.; et al. Therapeutic Effects of PKC Activators in Alzheimer’s Disease Transgenic Mice. Proc. Natl. Acad. Sci. USA 2004, 101, 11141–11146. [Google Scholar] [CrossRef] [PubMed] [Green Version]
  24. Varterasian, M.L.; Mohammad, R.M.; Shurafa, M.S.; Hulburd, K.; Pemberton, P.A.; Rodriguez, D.H.; Spadoni, V.; Eilender, D.S.; Murgo, A.; Wall, N.; et al. Phase II Trial of Bryostatin 1 in Patients with Relapsed Low-Grade Non-Hodgkin’s Lymphoma and Chronic Lymphocytic Leukemia. Clin. Cancer Res. 2000, 6, 825–828. [Google Scholar] [PubMed]
  25. Kawano, T.; Inokuchi, J.; Eto, M.; Murata, M.; Kang, J.-H. Activators and Inhibitors of Protein Kinase C (PKC): Their Applications in Clinical Trials. Pharmaceutics 2021, 13, 1748. [Google Scholar] [CrossRef] [PubMed]
  26. Colón-González, F.; Kazanietz, M.G. C1 Domains Exposed: From Diacylglycerol Binding to Protein–Protein Interactions. Biochim. et Biophys. Acta (BBA) Mol. Cell Biol. Lipids 2006, 1761, 827–837. [Google Scholar] [CrossRef]
  27. Stahelin, R.v.; Digman, M.A.; Medkova, M.; Ananthanarayanan, B.; Rafter, J.D.; Melowic, H.R.; Cho, W. Mechanism of Diacylglycerol-Induced Membrane Targeting and Activation of Protein Kinase Cδ. J. Biol. Chem. 2004, 279, 29501–29512. [Google Scholar] [CrossRef] [Green Version]
  28. Stahelin, R.V.; Wang, J.; Blatner, N.R.; Rafter, J.D.; Murray, D.; Cho, W. The Origin of C1A-C2 Interdomain Interactions in Protein Kinase Cα. J. Biol. Chem. 2005, 280, 36452–36463. [Google Scholar] [CrossRef] [Green Version]
  29. Giorgione, J.R.; Lin, J.H.; McCammon, J.A.; Newton, A.C. Increased Membrane Affinity of the C1 Domain of Protein Kinase Cδ Compensates for the Lack of Involvement of Its C2 Domain in Membrane Recruitment. J. Biol. Chem. 2006, 281, 1660–1669. [Google Scholar] [CrossRef] [Green Version]
  30. Wang, Q.J.; Fang, T.; Nacro, K.; Marquez, V.E.; Wang, S.; Blumberg, P.M. Role of Hydrophobic Residues in the C1b Domain of Protein Kinase C δ on Ligand and Phospholipid Interactions. J. Biol. Chem. 2001, 276, 19580–19587. [Google Scholar] [CrossRef] [Green Version]
  31. Johnson, J.E.; Giorgione, J.; Newton, A.C. The C1 and C2 Domains of Protein Kinase C Are Independent Membrane Targeting Modules, with Specificity for Phosphatidylserine Conferred by the C1 Domain. Biochemistry 2000, 39, 11360–11369. [Google Scholar] [CrossRef] [PubMed]
  32. Marsden, M.D.; Loy, B.A.; Wu, X.; Ramirez, C.M.; Schrier, A.J.; Murray, D.; Shimizu, A.; Ryckbosch, S.M.; Near, K.E.; Chun, T.-W.; et al. In Vivo Activation of Latent HIV with a Synthetic Bryostatin Analog Effects Both Latent Cell “Kick” and “Kill” in Strategy for Virus Eradication. PLoS Pathog. 2017, 13, e1006575. [Google Scholar] [CrossRef] [PubMed] [Green Version]
  33. Darcis, G.; Kula, A.; Bouchat, S.; Fujinaga, K.; Corazza, F.; Ait-Ammar, A.; Delacourt, N.; Melard, A.; Kabeya, K.; Vanhulle, C.; et al. An In-Depth Comparison of Latency-Reversing Agent Combinations in Various In Vitro and Ex Vivo HIV-1 Latency Models Identified Bryostatin-1+JQ1 and Ingenol-B+JQ1 to Potently Reactivate Viral Gene Expression. PLoS Pathog. 2015, 11, e1005063. [Google Scholar] [CrossRef] [PubMed]
  34. Mehla, R.; Bivalkar-Mehla, S.; Zhang, R.; Handy, I.; Albrecht, H.; Giri, S.; Nagarkatti, P.; Nagarkatti, M.; Chauhan, A. Bryostatin Modulates Latent HIV-1 Infection via PKC and AMPK Signaling but Inhibits Acute Infection in a Receptor Independent Manner. PLoS ONE 2010, 5, e11160. [Google Scholar] [CrossRef] [Green Version]
  35. Albert, B.J.; Niu, A.; Ramani, R.; Marshall, G.R.; Wender, P.A.; Williams, R.M.; Ratner, L.; Barnes, A.B.; Kyei, G.B. Combinations of Isoform-Targeted Histone Deacetylase Inhibitors and Bryostatin Analogues Display Remarkable Potency to Activate Latent HIV without Global T-Cell Activation. Sci. Rep. 2017, 7, 7456. [Google Scholar] [CrossRef] [Green Version]
  36. Martínez-Bonet, M.; Clemente, M.I.; Serramía, M.J.; Muñoz, E.; Moreno, S.; Muñoz-Fernández, M.Á. Synergistic Activation of Latent HIV-1 Expression by Novel Histone Deacetylase Inhibitors and Bryostatin-1. Sci. Rep. 2015, 5, 16445. [Google Scholar] [CrossRef] [Green Version]
  37. Trushin, S.A.; Bren, G.D.; Asin, S.; Pennington, K.N.; Paya, C.v.; Badley, A.D. Human Immunodeficiency Virus Reactivation by Phorbol Esters or T-Cell Receptor Ligation Requires Both PKCalpha and PKCtheta. J. Virol. 2005, 79, 9821–9830. [Google Scholar] [CrossRef] [Green Version]
  38. Wender, P.A.; Baryza, J.L.; Brenner, S.E.; DeChristopher, B.A.; Loy, B.A.; Schrie, A.J.; Verma, V.A. Design, Synthesis, and Evaluation of Potent Bryostatin Analogs That Modulate PKC Translocation Selectivity. Proc. Natl. Acad. Sci. USA 2011, 108, 6721–6726. [Google Scholar] [CrossRef] [Green Version]
  39. Shindo, M.; Irie, K.; Nakahara, A.; Ohigashi, H.; Konishi, H.; Kikkawa, U.; Fukuda, H.; Wender, P.A. Toward the Identification of Selective Modulators of Protein Kinase C (PKC) Isozymes: Establishment of a Binding Assay for PKC Isozymes Using Synthetic C1 Peptide Receptors and Identification of the Critical Residues Involved in the Phorbol Ester Binding. Bioorg. Med. Chem. 2001, 9, 2073–2081. [Google Scholar] [CrossRef]
  40. Zhang, G.; Kazanietz, M.G.; Blumberg, P.M.; Hurley, J.H. Crystal Structure of the Cys2 Activator-Binding Domain of Protein Kinase C in Complex with Phorbol Ester. Cell 1995, 81, 917–924. [Google Scholar] [CrossRef] [Green Version]
  41. Katti, S.S.; Krieger, I.v.; Ann, J.; Lee, J.; Sacchettini, J.C.; Igumenova, T.I. Structural Anatomy of Protein Kinase C C1 Domain Interactions with Diacylglycerol and Other Agonists. Nat. Commun. 2022, 13, 2695. [Google Scholar] [CrossRef] [PubMed]
  42. Madani, S.; Hichami, A.; Legrand, A.; Belleville, J.; Khan, N.A. Implication of Acyl Chain of Diacylglycerols in Activation of Different Isoforms of Protein Kinase C. FASEB J. 2001, 15, 2595–2601. [Google Scholar] [CrossRef] [PubMed]
  43. Kamiya, Y.; Mizuno, S.; Komenoi, S.; Sakai, H.; Sakane, F. Activation of Conventional and Novel Protein Kinase C Isozymes by Different Diacylglycerol Molecular Species. Biochem. Biophys. Rep. 2016, 7, 361–366. [Google Scholar] [CrossRef] [PubMed] [Green Version]
  44. Alwarawrah, M.; Hussain, F.; Huang, J. Alteration of Lipid Membrane Structure and Dynamics by Diacylglycerols with Unsaturated Chains. Biochim. Biophys. Acta 2016, 1858, 253–263. [Google Scholar] [CrossRef]
  45. Lautala, S.; Provenzani, R.; Koivuniemi, A.; Kulig, W.; Talman, V.; Róg, T.; Tuominen, R.K.; Yli-Kauhaluoma, J.; Bunker, A. Rigorous Computational Study Reveals What Docking Overlooks: Double Trouble from Membrane Association in Protein Kinase C Modulators. J. Chem. Inf. Model. 2020, 60, 5624–5633. [Google Scholar] [CrossRef]
  46. Marignani, P.A.; Epand, R.M.; Sebaldt, R.J. Acyl Chain Dependence of Diacylglycerol Activation of Protein Kinase C Activity In Vitro. Biochem. Biophys. Res. Commun. 1996, 225, 469–473. [Google Scholar] [CrossRef]
  47. Schuhmacher, M.; Grasskamp, A.T.; Barahtjan, P.; Wagner, N.; Lombardot, B.; Schuhmacher, J.S.; Sala, P.; Lohmann, A.; Henry, I.; Shevchenko, A.; et al. Live-Cell Lipid Biochemistry Reveals a Role of Diacylglycerol Side-Chain Composition for Cellular Lipid Dynamics and Protein Affinities. Proc. Natl. Acad. Sci. USA 2020, 117, 7729–7738. [Google Scholar] [CrossRef] [Green Version]
  48. Huang, H.-W.; Goldberg, E.M.; Zidovetzki, R. Ceramides Modulate Protein Kinase C Activity and Perturb the Structure of Phosphatidylcholine/Phosphatidylserine Bilayers. Biophys. J. 1999, 77, 1489–1497. [Google Scholar] [CrossRef] [Green Version]
  49. Goldberg, E.M.; Zidovetzki, R. Effects of Dipalmitoylglycerol and Fatty Acids on Membrane Structure and Protein Kinase C Activity. Biophys. J. 1997, 73, 2603–2614. [Google Scholar] [CrossRef] [Green Version]
  50. Goldberg, E.M.; Lester, D.S.; Borchardt, D.B.; Zidovetzki, R. Effects of Diacylglycerols and Ca2+ on Structure of Phosphatidylcholine/Phosphatidylserine Bilayers. Biophys. J. 1994, 66, 382–393. [Google Scholar] [CrossRef] [Green Version]
  51. Alwarawrah, M.; Dai, J.; Huang, J. Modification of Lipid Bilayer Structure by Diacylglycerol: A Comparative Study of Diacylglycerol and Cholesterol. J. Chem. Theory Comput. 2012, 8, 749–758. [Google Scholar] [CrossRef] [PubMed] [Green Version]
  52. Armstrong, D.; Zidovetzki, R. Amplification of Diacylglycerol Activation of Protein Kinase C by Cholesterol. Biophys. J. 2008, 94, 4700–4710. [Google Scholar] [CrossRef] [PubMed] [Green Version]
  53. Bolen, E.J.; Sando, J.J. Effects of Phospholipid Unsaturation on Protein Kinase C Activation. Biochemistry 1992, 31, 5945–5951. [Google Scholar] [CrossRef] [PubMed]
  54. Ryckbosch, S.M.; Wender, P.A.; Pande, V.S. Molecular Dynamics Simulations Reveal Ligand Controlled Positioning of a Peripheral Protein Complex in Membranes. Nat. Commun. 2017, 8, 1–9. [Google Scholar] [CrossRef] [PubMed]
  55. Li, J.; Ziemba, B.P.; Falke, J.J.; Voth, G.A. Interactions of Protein Kinase C-α C1A and C1B Domains with Membranes: A Combined Computational and Experimental Study. J. Am. Chem. Soc. 2014, 136, 11757–11766. [Google Scholar] [CrossRef] [PubMed] [Green Version]
  56. Cole, T.R.; Igumenova, T.I. Reactivity of Thiol-Rich Zn Sites in Diacylglycerol-Sensing PKC C1 Domain Probed by NMR Spectroscopy. Front. Mol. Biosci. 2021, 8, 728711. [Google Scholar] [CrossRef]
  57. Ingólfsson, H.I.; Melo, M.N.; van Eerden, F.J.; Arnarez, C.; Lopez, C.A.; Wassenaar, T.A.; Periole, X.; de Vries, A.H.; Tieleman, D.P.; Marrink, S.J. Lipid Organization of the Plasma Membrane. J Am. Chem. Soc. 2014, 136, 14554–14559. [Google Scholar] [CrossRef]
  58. Rodríguez-Alfaro, J.A.; Gomez-Fernandez, J.C.; Corbalan-Garcia, S. Role of the Lysine-Rich Cluster of the C2 Domain in the Phosphatidylserine-Dependent Activation of PKCα. J. Mol. Biol. 2004, 335, 1117–1129. [Google Scholar] [CrossRef]
  59. Alwarawrah, M.; Wereszczynski, J. Investigation of the Effect of Bilayer Composition on PKCα-C2 Domain Docking Using Molecular Dynamics Simulations. J. Phys. Chem. B 2017, 121, 78–88. [Google Scholar] [CrossRef] [Green Version]
  60. Bittova, L.; Stahelin, R.v.; Cho, W. Roles of Ionic Residues of the C1 Domain in Protein Kinase C-α Activation and the Origin of Phosphatidylserine Specificity. J. Biol. Chem. 2001, 276, 4218–4226. [Google Scholar] [CrossRef] [Green Version]
  61. Keck, G.E.; Li, W.; Kraft, M.B.; Kedei, N.; Lewin, N.E.; Blumberg, P.M. The Bryostatin 1 A-Ring Acetate Is Not the Critical Determinant for Antagonism of Phorbol Ester-Induced Biological Responses. Org. Lett. 2009, 11, 2277–2280. [Google Scholar] [CrossRef] [Green Version]
  62. Stewart, M.D.; Cole, T.R.; Igumenova, T.I. Interfacial Partitioning of a Loop Hinge Residue Contributes to Diacylglycerol Affinity of Conserved Region 1 Domains. J. Biol. Chem. 2014, 289, 27653–27664. [Google Scholar] [CrossRef] [PubMed] [Green Version]
  63. Dries, D.R.; Gallegos, L.L.; Newton, A.C. A Single Residue in the C1 Domain Sensitizes Novel Protein Kinase C Isoforms to Cellular Diacylglycerol Production. J. Biol. Chem. 2007, 282, 826–830. [Google Scholar] [CrossRef] [PubMed] [Green Version]
  64. Chavent, M.; Duncan, A.L.; Sansom, M.S.P. Molecular Dynamics Simulations of Membrane Proteins and Their Interactions: From Nanoscale to Mesoscale. Curr. Opin. Struct. Biol. 2016, 40, 8–16. [Google Scholar] [CrossRef] [PubMed] [Green Version]
  65. Moqadam, M.; Tubiana, T.; Moutoussamy, E.E.; Reuter, N. Membrane Models for Molecular Simulations of Peripheral Membrane Proteins. Adv. Phys. X 2021, 6, 1932589. [Google Scholar] [CrossRef]
  66. Sánchez-Bautista, S.; Corbalán-García, S.; Pérez-Lara, A.; Gómez-Fernández, J.C. A Comparison of the Membrane Binding Properties of C1B Domains of PKCgamma, PKCδ, and PKCepsilon. Biophys. J. 2009, 96, 3638–3647. [Google Scholar] [CrossRef] [PubMed] [Green Version]
  67. Dries, D.R.; Newton, A.C. Kinetic Analysis of the Interaction of the C1 Domain of Protein Kinase C with Lipid Membranes by Stopped-Flow Spectroscopy. J. Biol. Chem. 2008, 283, 7885–7893. [Google Scholar] [CrossRef] [Green Version]
  68. Kazanietz, M.G.; Wang, S.; Milne, G.W.A.; Lewin, N.E.; Liu, H.L.; Blumberg, P.M. Residues in the Second Cysteine-Rich Region of Protein Kinase C δ Relevant to Phorbol Ester Binding as Revealed by Site-Directed Mutagenesis. J. Biol. Chem. 1995, 270, 21852–21859. [Google Scholar] [CrossRef] [Green Version]
  69. Barbera, N.; Ayee, M.A.A.; Akpa, B.S.; Levitan, I. Molecular Dynamics Simulations of Kir2.2 Interactions with an Ensemble of Cholesterol Molecules. Biophys. J. 2018, 115, 1264–1280. [Google Scholar] [CrossRef] [Green Version]
  70. Lee, S.-Y.; Choi, H.-K.; Kim, S.-T.; Chung, S.; Park, M.K.; Cho, J.-H.; Ho, W.-K.; Cho, H. Cholesterol Inhibits M-Type K+ Channels via Protein Kinase C-Dependent Phosphorylation in Sympathetic Neurons. J. Biol. Chem. 2010, 285, 10939–10950. [Google Scholar] [CrossRef] [Green Version]
  71. Slater, S.J.; Kelly, M.B.; Taddeo, F.J.; Ho, C.; Rubin, E.; Stubbs, C.D. The Modulation of Protein Kinase C Activity by Membrane Lipid Bilayer Structure. J. Biol. Chem. 1994, 269, 4866–4871. [Google Scholar] [CrossRef]
  72. Vamparys, L.; Gautier, R.; Vanni, S.; Bennett, W.F.D.; Tieleman, D.P.; Antonny, B.; Etchebest, C.; Fuchs, P.F.J. Conical Lipids in Flat Bilayers Induce Packing Defects Similar to That Induced by Positive Curvature. Biophys. J. 2013, 104, 585–593. [Google Scholar] [CrossRef] [Green Version]
  73. Heinonen, S.; Lautala, S.; Koivuniemi, A.; Bunker, A. Insights into the Behavior of Unsaturated Diacylglycerols in Mixed Lipid Bilayers in Relation to Protein Kinase C Activation—A Molecular Dynamics Simulation Study. Biochim. Et Biophys. Acta (BBA) Biomembr. 2022, 1864, 183961. [Google Scholar] [CrossRef] [PubMed]
  74. Lu, Z.; Liu, D.; Hornia, A.; Devonish, W.; Pagano, M.; Foster, D.A. Activation of Protein Kinase C Triggers Its Ubiquitination and Degradation. Mol. Cell. Biol. 1998, 18, 839–845. [Google Scholar] [CrossRef] [PubMed] [Green Version]
  75. Golub, T.; Wacha, S.; Caroni, P. Spatial and Temporal Control of Signaling through Lipid Rafts. Curr. Opin. Neurobiol. 2004, 14, 542–550. [Google Scholar] [CrossRef] [PubMed]
  76. Mollinedo, F.; Gajate, C. Lipid Rafts as Signaling Hubs in Cancer Cell Survival/Death and Invasion: Implications in Tumor Progression and Therapy: Thematic Review Series: Biology of Lipid Rafts. J. Lipid. Res. 2020, 61, 611–635. [Google Scholar] [CrossRef] [Green Version]
  77. Rybin, V.O.; Xu, X.; Steinberg, S.F. Activated Protein Kinase C Isoforms Target to Cardiomyocyte Caveolae. Circ. Res. 1999, 84, 980–988. [Google Scholar] [CrossRef] [Green Version]
  78. Szallasi, Z.; Denning, M.F.; Smith, C.B.; Dlugosz, A.A.; Yuspa, S.H.; Pettit, G.R.; Blumberg, P.M. Bryostatin 1 Protects Protein Kinase C-δ from down-Regulation in Mouse Keratinocytes in Parallel with Its Inhibition of Phorbol Ester-Induced Differentiation. Mol. Pharmacol. 1994, 46, 840–850. [Google Scholar] [PubMed]
  79. Kuehn, H.S.; Niemela, J.E.; Rangel-Santos, A.; Zhang, M.; Pittaluga, S.; Stoddard, J.L.; Hussey, A.A.; Evbuomwan, M.O.; Priel, D.A.L.; Kuhns, D.B.; et al. Loss-of-Function of the Protein Kinase C δ (PKCδ) Causes a B-Cell Lymphoproliferative Syndrome in Humans. Blood 2013, 121, 3117–3125. [Google Scholar] [CrossRef] [Green Version]
  80. Gorelik, G.; Sawalha, A.H.; Patel, D.; Johnson, K.; Richardson, B. T Cell PKCδ Kinase Inactivation Induces Lupus-like Autoimmunity in Mice. Clin. Immunol. 2015, 158, 193–203. [Google Scholar] [CrossRef] [Green Version]
  81. Mischak, H.; Goodnight, J.A.; Kolch, W.; Martiny-Baron, G.; Schaechtle, C.; Kazanietz, M.G.; Blumberg, P.M.; Pierce, J.H.; Mushinski, J.F. Overexpression of Protein Kinase C-δ and -Epsilon in NIH 3T3 Cells Induces Opposite Effects on Growth, Morphology, Anchorage Dependence, and Tumorigenicity. J. Biol. Chem. 1993, 268, 6090–6096. [Google Scholar] [CrossRef] [PubMed]
  82. Lu, Z.; Hornia, A.; Jiang, Y.W.; Zang, Q.; Ohno, S.; Foster, D.A. Tumor Promotion by Depleting Cells of Protein Kinase C δ. Mol. Cell. Biol. 1997, 17, 3418–3428. [Google Scholar] [CrossRef] [PubMed] [Green Version]
  83. Garcia, E.; Ismail, S. Spatiotemporal Regulation of Signaling: Focus on T Cell Activation and the Immunological Synapse. Int. J. Mol. Sci. 2020, 21, 3283. [Google Scholar] [CrossRef]
  84. Gallegos, L.L.; Newton, A.C. Spatiotemporal Dynamics of Lipid Signaling: Protein Kinase C as a Paradigm. IUBMB Life 2008, 60, 782–789. [Google Scholar] [CrossRef] [PubMed] [Green Version]
  85. Gallagher, M.P.; Conley, J.M.; Berg, L.J. Peptide Antigen Concentration Modulates Digital NFAT1 Activation in Primary Mouse Naive CD8(+) T Cells as Measured by Flow Cytometry of Isolated Cell Nuclei. Immunohorizons 2018, 2, 208–215. [Google Scholar] [CrossRef] [Green Version]
  86. Lomize, M.A.; Pogozheva, I.D.; Joo, H.; Mosberg, H.I.; Lomize, A.L. OPM Database and PPM Web Server: Resources for Positioning of Proteins in Membranes. Nucleic Acids Res. 2012, 40, 370–376. [Google Scholar] [CrossRef]
  87. Jo, S.; Kim, T.; Iyer, V.G.; Im, W. A Graphical User Interface for Computational Chemistry Softwares. J. Comput. Chem. 2008, 29, 1859–1865. [Google Scholar] [CrossRef]
  88. Brooks, B.R.; Brooks, C.L., III; Mackerell, A.D., Jr.; Nilsson, L.; Petrella, R.J.; Roux, B.; Won, Y.; Archontis, G.; Bartels, C.; Boresch, S.; et al. CHARMM: The Biomolecular Simulation Program B. J. Comput. Chem. 2009, 30, 1545–1614. [Google Scholar] [CrossRef] [Green Version]
  89. Lee, J.; Cheng, X.; Swails, J.M.; Yeom, M.S.; Eastman, P.K.; Lemkul, J.A.; Wei, S.; Buckner, J.; Jeong, J.C.; Qi, Y.; et al. CHARMM-GUI Input Generator for NAMD, GROMACS, AMBER, OpenMM, and CHARMM/OpenMM Simulations Using the CHARMM36 Additive Force Field. J. Chem. Theory Comput. 2016, 12, 405–413. [Google Scholar] [CrossRef]
  90. Sanner, M.F. Python: A Programming Language for Software Integration and Development. J. Mol. Graph. Model. 1999, 17, 57–61. [Google Scholar]
  91. Huang, J.; Rauscher, S.; Nawrocki, G.; Ran, T.; Feig, M.; de Groot, B.L.; Grubmüller, H.; MacKerell, A.D. CHARMM36m: An Improved Force Field for Folded and Intrinsically Disordered Proteins. Nat. Methods 2017, 14, 71–73. [Google Scholar] [CrossRef] [PubMed] [Green Version]
  92. McGibbon, R.T.; Beauchamp, K.A.; Harrigan, M.P.; Klein, C.; Swails, J.M.; Hernández, C.X.; Schwantes, C.R.; Wang, L.P.; Lane, T.J.; Pande, V.S. MDTraj: A Modern Open Library for the Analysis of Molecular Dynamics Trajectories. Biophys. J. 2015, 109, 1528–1532. [Google Scholar] [CrossRef] [PubMed] [Green Version]
  93. The {PyMOL} Molecular Graphics System, Version 1.8; Schrödinger, Inc.: New York, NY, USA, 2015.
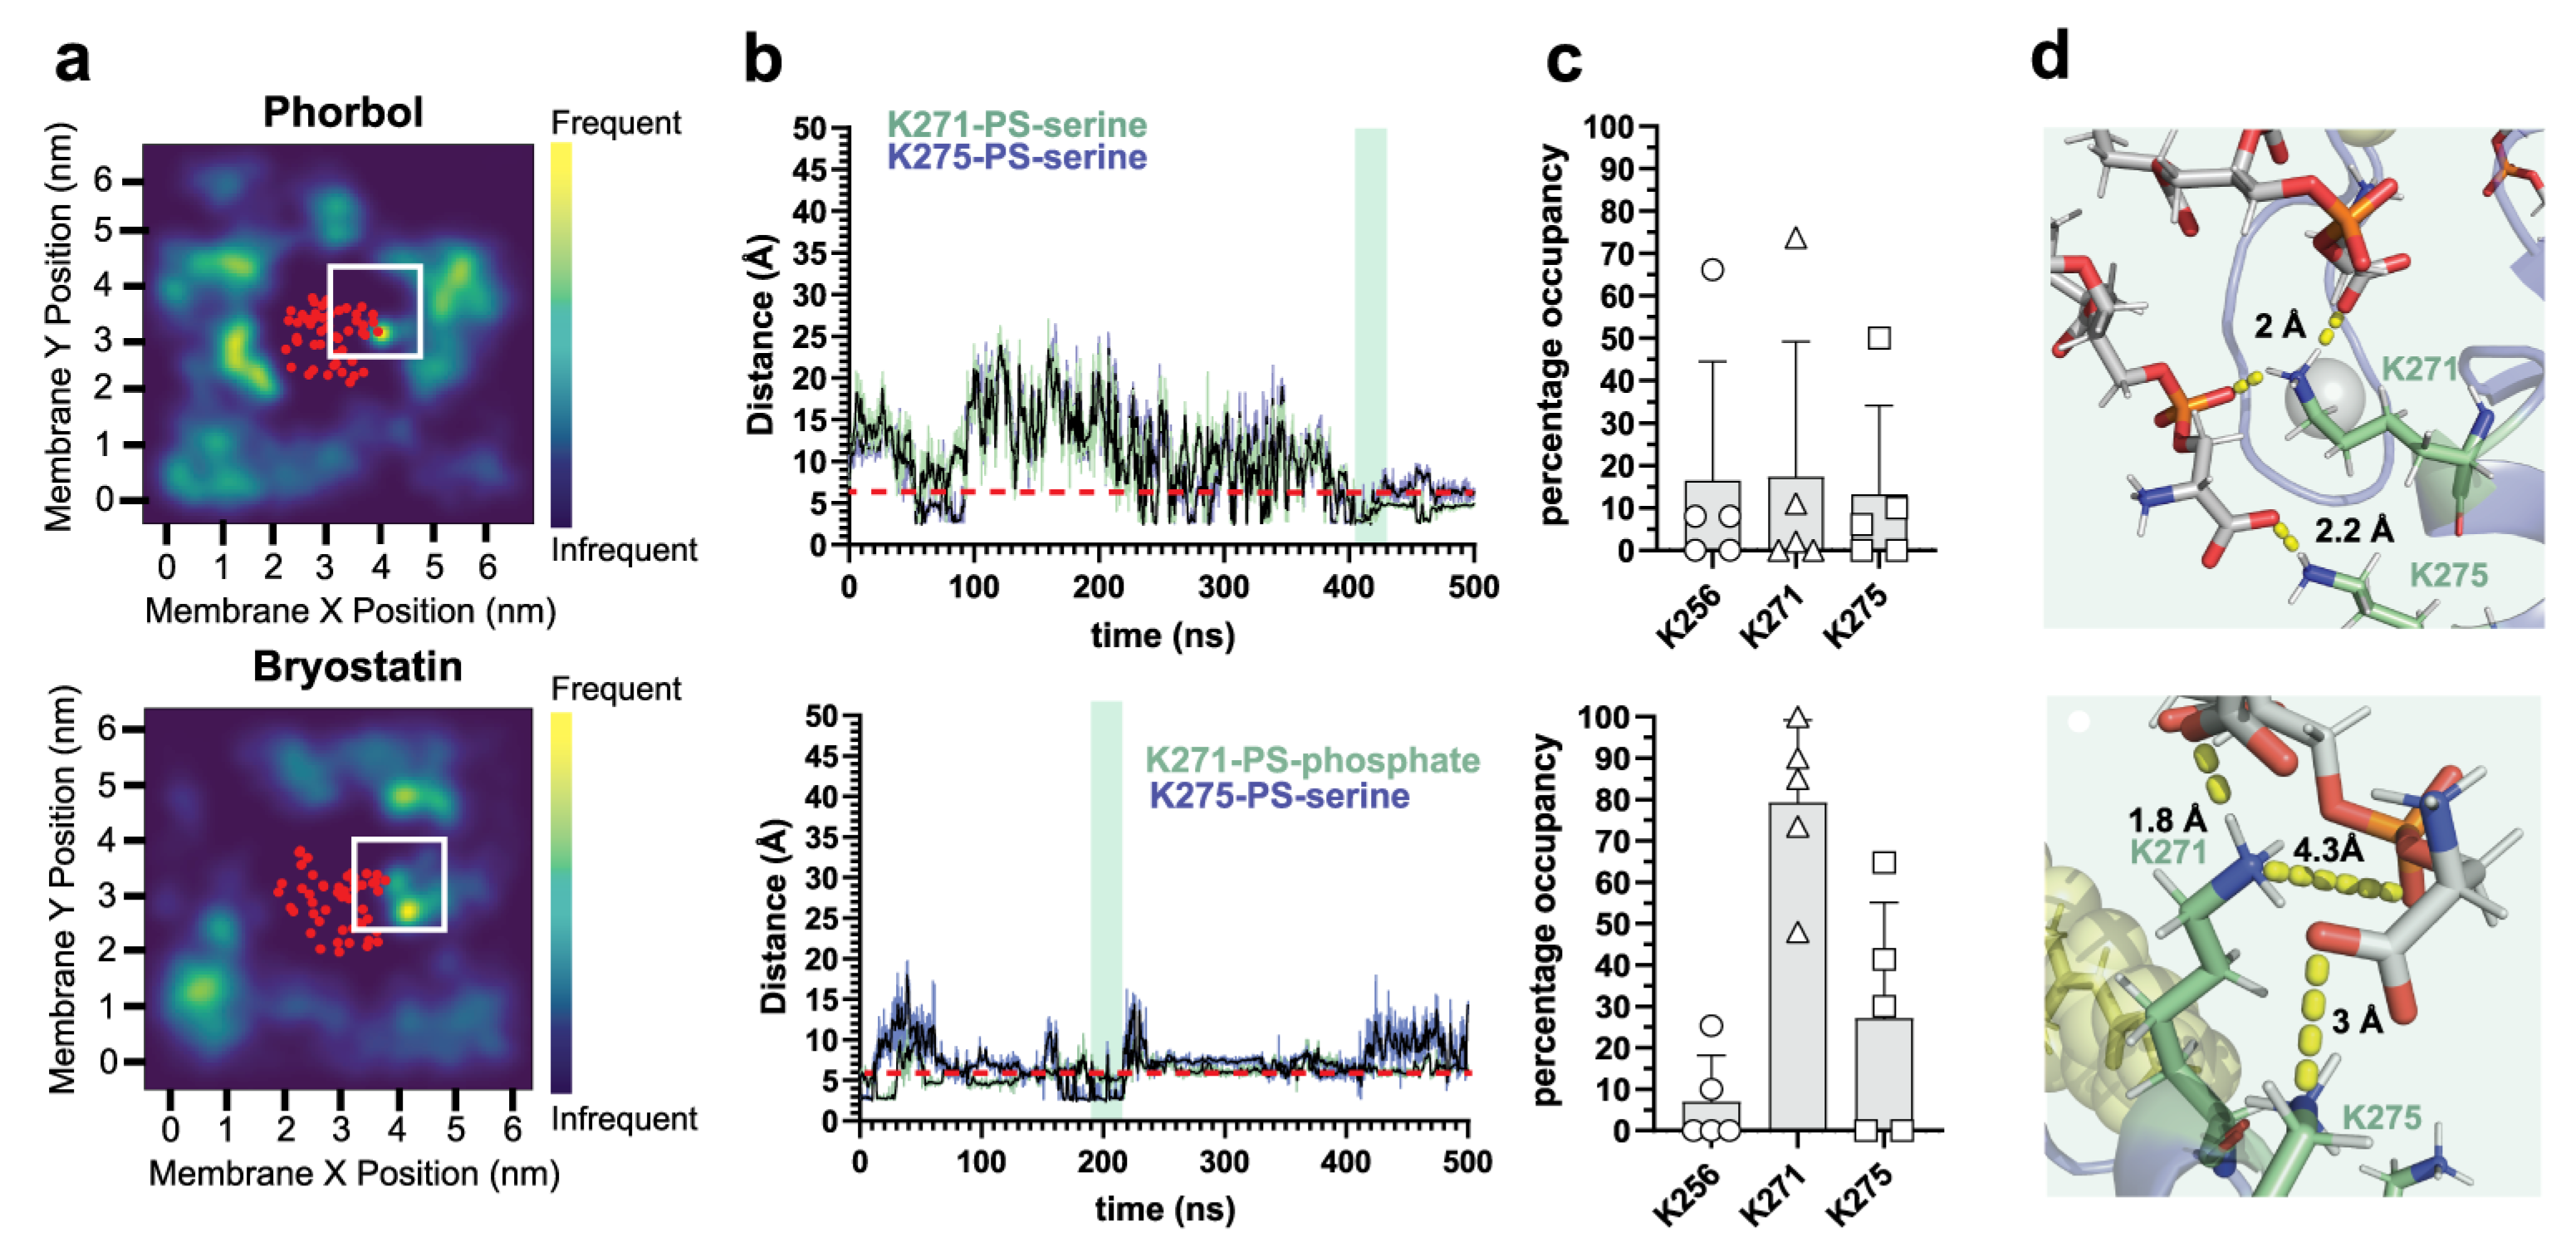
Figure 1. Interactions between PS and lysine side chains of δC1b. Top panels show δC1b-phorbol simulations. Bottom panels show δC1b-bryostatin simulations. (a) Heatmaps show the localization of PS lipids in the inner leaflet over a 500 ns simulation period and are representative of five simulations (see Figure S2 for full dataset). The red dots indicate the average position of the backbone Cα of δC1b. (b) Interaction lifetimes of PS-lysine interactions. The dotted line indicates the 6 Å cutoff used to determine occupancy in (c). The shaded area indicates the time frame in which the structures shown in (d) are obtained. (c) Total occupancy time of different lysine residues with PS over all five simulations. Bars indicate the mean, error bars represent the standard error of the mean and each point represents a single independent simulation. (d) Representative structural interactions from the shaded area in (b). PS lipid is colored grey sticks while δC1b-lysine residues are colored pale green sticks. Charge–charge interactions are indicated by the dashed yellow line and the interaction distance is indicated above the residue to which PS is interacting.
Ijms 24 04598 g001
Figure 2. Interactions between δC1b and heterogenous lipids. Interactions between δC1b-phorbol (a) and δC1b-bryostatin (b) with phosphatidylethanolamine (PE), phosphatidylcholine (PC), phosphatidylinositol (PIP), phosphatidic acid (PA) and ceramide (CER). Heatmaps show the localization frequency of each lipid in the inner leaflet over 500 ns and are representative of five simulations. The red dots indicate the average position of the backbone Cα of δC1b. Structural interactions shown are representative of interactions in the region indicated by the white box. Interaction distances are indicated by dashed yellow lines, ligands are shown as yellow spheres and lysine residues are shown as pale green sticks. (c) Quantitation of the occupancy of K256 (circles), K271 (triangles) and K275 (squares) with various lipids across five simulations covering 500 ns each (2.5 μs in total). Bars indicate the mean, error bars represent the standard error of the mean and each point represents a single independent simulation.
Ijms 24 04598 g002
Figure 3. Interactions between cholesterol and δC1b. Top panels show δC1b-phorbol simulations. Bottom panels show δC1b-bryostatin stimulations. (a) Heatmaps show the localization frequency of cholesterol in the inner leaflet over 500 ns. The red dots indicate the average position of the backbone Cα of δC1b. Plots are representative of five simulations (full dataset is shown in Figure S4). (b) Interaction lifetime of L250 (orange), S240 (pink), K256 (green) and P241 (purple) with cholesterol. The dashed line indicates the 6 Å cutoff used to quantify residue occupancy in (c). (c) Bar graphs show the mean occupancy of residues with cholesterol across all simulations. Bars indicate the mean, error bars represent the standard error of the mean and each point represents a single independent simulation. (d) Representative structural interactions extracted from the simulation time frame indicated by the shaded regions in (b). Ligands are shown as yellow spheres, L250 is shown as orange sticks, S240 as pink sticks, P241 as purple sticks and K256 as pale-green sticks.
Ijms 24 04598 g003
Figure 4. Topology of δC1b-ligand complexes. Topology of δC1b bound to (a) phorbol and (b) bryostatin. Each heatmap is an average for all five simulations for each complex over a total 2.5 μs simulation time. Areas of greater intensity represent topologies more frequently found in each simulation. Structural snapshots show the positioning of the L250 residue (orange spheres) relative to the cholesterol hydroxyl (shown as red spheres). The polar:apolar interface is indicated by the dashed red line and is positioned at the average position of the glycerol backbone of phospholipids.
Ijms 24 04598 g004
Figure 5. Lipid interactions with δC1b-Merle27. (a) Interactions between δC1b-Merle27 and PS. Representative heatmap indicates the frequency of PS in the lower leaflet over 500 ns (complete data set is shown in Figure S2). Interaction lifetimes are shown in the xy plot for the residues indicated. Example hydrogen bonding patterns are shown in the green box and are taken from the shaded region of the interaction lifetime plot. Quantification of PS-lysine interactions are shown in the grey bar graph. (b) Quantification of the interaction of δC1b-Merle27 with various lipids. (c) Heatmaps showing the frequency of lipid localization in the inner leaflet over the 500 ns simulation time. Heatmaps are representative of five simulations and the red dots indicate the average position of the Cα backbone of δC1b. Representative structures are shown below from regions indicated by the white box. Lysine residues are shown as pale-green sticks and the ligand is represented as yellow spheres. Bars indicate the mean, error bars represent the standard error of the mean and each point represents a single independent simulation.
Ijms 24 04598 g005
Figure 6. Topology of δC1b-Merle27 and its interaction with cholesterol. (a) Topology heatmap of δC1b-Merle27 showing the average insertion depth and tilt angle (averaged from five independent 500 ns simulations over a total of 2.5 μs). Representative snapshot showing the relative position of δC1b-Merle27 to cholesterol hydroxyl groups (red spheres) and the membrane interface. L250 is shown as orange spheres. The polar:apolar interface is indicated by the dashed red line. (b) Heatmap showing the localization of cholesterol in the inner leaflet across the 500 ns simulation time. Data shown are representative of five simulations (full dataset is shown in Figure S4). Residue occupancy with cholesterol is quantified in the bar graph across all five simulations. Bars indicate the mean with the standard error of the mean shown as the error bar and each point represents a single independent simulation. (c) The interaction lifetime between W252 (cyan), L250 (orange), S240 (pink) and K256 (green) with cholesterol-hydroxyls is plotted. Representative structures from the region indicated by the shaded area in the interaction lifetime plot are shown with the key residues indicated. Cholesterol molecules are shown as pale red sticks.
Ijms 24 04598 g006
Figure 7. Schematic representation of the lipid raft hypothesis of PKC-δ modulation by phorbol and bryostatin. (a) Binding of phorbol results in deeper insertion within the membrane and contacts between PKC-δ and cholesterol are established. These contacts result in translocation of PKC-δ to cholesterol-rich lipid rafts, where ubiquitination occurs and rapid proteasomal degradation of PKC-δ ensues after initial activation [74]. (b) Binding of phorbol on the other hand results in a shallower binding topology and precludes the interaction between PKC-δ and cholesterol, limiting the translocation of PKC-δ to lipid rafts. Disparate localization of PKC-δ from E3 ligases results in prolonged PKC-δ signaling and therefore an alteration to the downstream transcriptional profile.
Ijms 24 04598 g007
Table 1. Membrane composition for δC1b-phorbol simulations.
LipidUpper LeafletLower Leaflet
Cholesterol14 (21%)13 (22%)
POPC13 (20%)12 (20%)
POPE18 (27%)17 (29%)
SOPS8 (12%)7 (12%)
POPA2 (3%)1 (2%)
PLPIP354 (6%)3 (5%)
CER1607 (11%)6 (10%)
Total6659
Table 2. Membrane composition for δC1b-bryostatin and δC1b-Merle27 simulations.
LipidUpper LeafletLower Leaflet
Cholesterol16 (22%)16 (24%)
POPC15 (20%)13 (19%)
POPE19 (26%)18 (27%)
SOPS8 (11%)8 (12%)
POPA3 (4%)2 (3%)
PLPIP355 (7%)4 (6%)
CER1607 (10%)6 (9%)
Total7367
Disclaimer/Publisher’s Note: The statements, opinions and data contained in all publications are solely those of the individual author(s) and contributor(s) and not of MDPI and/or the editor(s). MDPI and/or the editor(s) disclaim responsibility for any injury to people or property resulting from any ideas, methods, instructions or products referred to in the content.