Article

Inhibition of Expression of the Circadian Clock Gene Cryptochrome 1 Causes Abnormal Glucometabolic and Cell Growth in Bombyx mori Cells

1
School of Biology and Basic Medical Sciences, Suzhou Medical College, Soochow University, Suzhou 215123, China
2
Institute of Agricultural Biotechnology & Ecology (IABE), Soochow University, Suzhou 215123, China
*
Author to whom correspondence should be addressed.
These authors contributed equally to this work.
Int. J. Mol. Sci. 2023, 24(6), 5435; https://doi.org/10.3390/ijms24065435
Submission received: 13 February 2023 / Revised: 8 March 2023 / Accepted: 10 March 2023 / Published: 12 March 2023
(This article belongs to the Special Issue Metabolic Oscillations Controlled by the Biological Clock)

Abstract

:
Cryptochrome is the earliest discovered photoreceptor protein in organisms. However, the effect of CRY (BmCRY), the clock protein in Bombyx mori, on the body or cell metabolism remains unclear. In this study, we continuously interfered with the expression of the BmCry1 gene (Cry1-KD) in the silkworm ovary cell line (BmN), and the BmN cells developed abnormally, with accelerated cell growth and a smaller nucleus. Metabolomics was used to identify the cause of the abnormal development of Cry1-KD cells based on gas chromatography/liquid chromatography-mass spectrometry. A total of 56 differential metabolites including sugars, acids, amino acids, and nucleotides were identified in wild-type and Cry1-KD cells. KEGG enrichment analysis showed that BmCry1 knockdown resulted in significantly upregulated glycometabolism in BmN cells, indicated by glucose-6-phosphate, fructose-6-phosphate, and pyruvic acid levels. The activities of key enzymes BmHK, BmPFK, and BmPK as well as their mRNA levels further confirmed that the glycometabolism level of Cry1-KD cells was significantly increased. Our results show that a possible mechanism of BmCry1 knockdown leading to abnormal cell development is the elevated level of glucose metabolism in cells.

1. Introduction

Cryptochrome (CRY), a photoreceptor protein, was first discovered in Arabidopsis thaliana [1]. CRY has been found in three kingdoms: plants, mammals, and prokaryotes (CRY-DASH). The insect Cry gene has two families: Cry1 and Cry2 [2]. Drosophila melanogaster has a single Cry1 (DmCry), Hymenoptera Apis mellifera and Coleoptera Tribolium castaneum have a single Cry2 (AmCry and TcCry), while in Lepidoptera insects such as Bombyx mori and Antheraea pernyi, both Cry1 and Cry2 genes (BmCry1/2 and ApCry1/2) were discovered [3,4,5,6].
Research has shown that DmCRY proteins in D. melanogaster initiate a similar response to blue light as CRY proteins do in A. thaliana (AtCRY). DmCRY proteins receive photo signals and directly guide the circadian reset. DmCry gene expression is also affected by light duration and intensity [3,7,8]. In lepidopteran Danaus plexippus, knockout of the DpCry2 gene resulted in the impairment of the molecular rhythm of core circadian clock members and the destruction of the emergence rhythm [9]. Using anti-DmCRY, a CRY-like protein appears in the cephalic nervous system of B. mori moths [10]. Wang et al. (2011) reported sequences of BmCry1 and BmCry2 in silkworms [4]. The results showed that under the induction of an oscillating rhythm of light and temperature, the transcriptional activity of BmCry1/2 in both adults and embryos showed similar oscillation patterns [11,12]. Our recent findings suggest that cyclical changes in temperature with differences from 2 °C to 10 °C reset and synchronized the circadian clock in silkworm B. mori ovary cell line (BmN) cells. Transcription BmCry2 and period (BmPer) showed a better reset and synchronization with cyclical temperature changes [13].
Metabolic pathways are important for the output of circadian clock signals, and their relationship with circadian clocks has been extensively investigated [14,15,16]. It is clear that circadian clocks and metabolic processes interact [17,18], and such interactions exist in various species ranging from yeast to humans [19]. In recent years, many studies have shown that several important metabolic processes are regulated by circadian clocks, including glucose metabolism and lipid metabolism [17,20,21]. Breaks in circadian rhythms, such as genetic disruption of the circadian clock, sleep abnormalities, and shift work can lead to metabolic disorders and diseases [22,23,24]. Therefore, it is believed that an understanding of the impact of circadian clocks on metabolism will aid in the development of new methods for circadian clock-based intervention treatments for specific metabolic disorders [25].
Metabolic function determines the rate of cell growth and proliferation. Studies have shown that cell proliferation is not merely a passive consequence of increased cell cycle activity, and must be regulated simultaneously with cell metabolism [26]. The metabolic cycles of yeast cells are synchronized with the cell cycle phases [27], and the production of acetyl-CoA affects cell cycle progression [28]. Even before cell division, extensive metabolic reprogramming has occurred to enable cells to obtain sufficient nutrients, such as glucose, amino acids, lipids, and nucleotides [29,30]. Mitochondrial dysfunction leads to cell cycle arrest through signaling to cyclin E and CDK inhibitor dacapo [31]. Conversely, cell proliferation also affects metabolic changes. Multiple signaling pathways that influence proliferation and differentiation are also involved in the control of cellular metabolism [32]. Glycolysis and glutaminolysis might be activated during the late G1 and S phases of cell division [33]. Thus, the metabolism interacts with processes of cell proliferation such as the cell cycle.
However, much is still unknown about the timing mechanism of Cry1 and Cry2 on lepidopterous circadian clocks and studies linking BmCry1/2 with metabolic regulation are scarce. Recent findings suggest that inhibition of BmPer expression causes glycometabolism repression in BmN cells [34]. Here, we continuously knocked down BmCry1 protein expression in BmN cells in vitro to eliminate any potential endocrine effects. We performed metabolomic analysis using gas chromatography/liquid chromatography-mass spectrometry (GC-MS and LC-MS/MS), and detected the key enzymes of the glycolytic pathway, the transcript levels of their coding genes, and levels of glycolytic metabolites to evaluate the impact of the peripheral circadian clock on the glycometabolism pathways of silkworm cells.

2. Results

2.1. BmCry1 Knockdown Results in Accelerated Cell Growth and a Smaller Nucleus

The mRNA and protein levels of BmCry1 were measured in Cry1-KD cells. The results showed that compared with WT cells, the mRNA level of BmCry1 in Cry1-KD cells was reduced by more than 73% (Figure 1A) and the protein level was reduced by 42% (Figure 1B). This suggests that shRNA effectively knocked down BmCry1 expression in the Cry1-KD cell line. We then further investigated the effect of BmCry1 knockdown on other major clock genes in the transcriptional-translation feedback loop. After cell development synchronization (dexamethasone treatment), the mRNA levels of BmCry2, BmPer, BmTim, BmClk, and BmCyc genes in Cry1-KD cells were significantly reduced compared with the WT cells (Figure 1C–G). Moreover, the amplitudes of these genes’ expression also appeared to be significantly reduced. The JTK_CYCLE method was used to determine the rhythmicity of clock gene expression, as well as the peak phase and amplitude. The results showed that the circadian rhythm of BmPer, BmClk, and BmCyc gene expression was lost (JTK p > 0.5), and the amplitudes of these clock genes were reduced (Figure 1C–G and Table S2). These results indicated that BmCry1 knockdown leads to the attenuation and destruction of the circadian clock system oscillations in BmN cells.
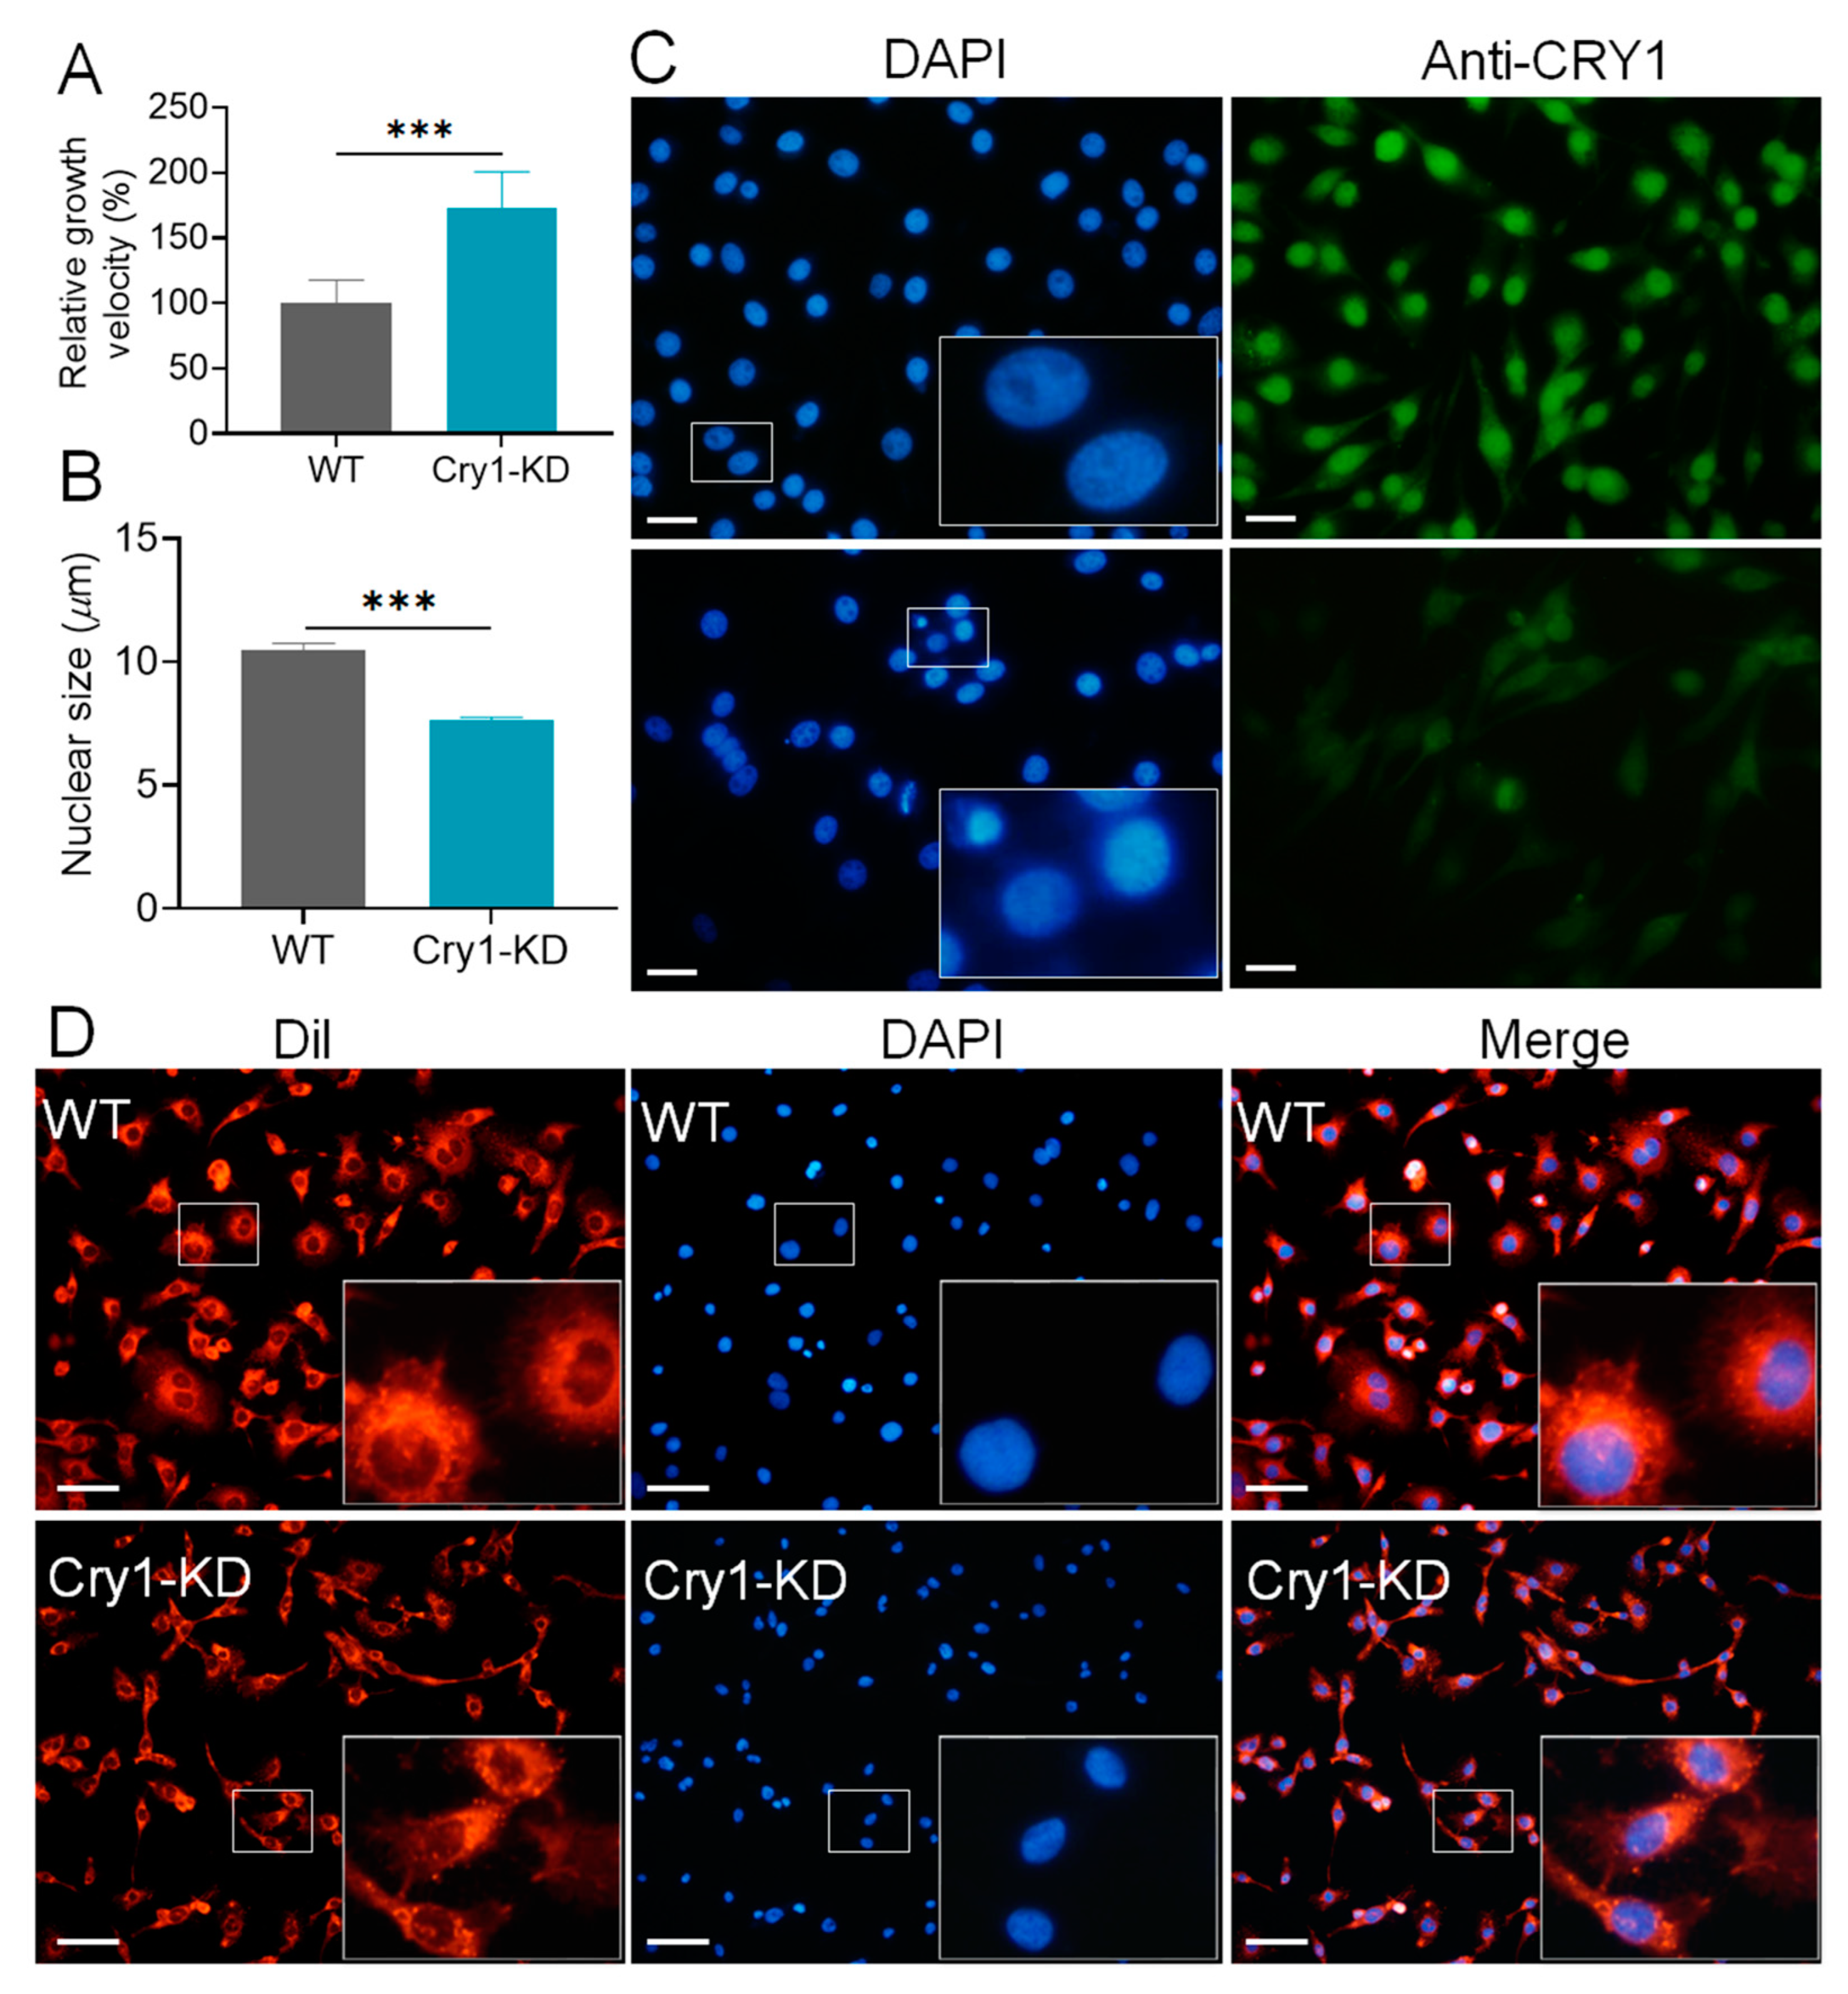
During the cell culture, we found that Cry1-KD cells grow faster than WT cells. The MTT assay showed that the growth rate of Cry-KD cells was significantly faster (72%) than that of WT cells (Figure 2A). Interestingly, the cell volume and nuclear size of Cry1-KD cells were smaller than those of WT cells. The average diameter of Cry1-KD cell nuclei (8 μm) was reduced by 3 μm compared with that of WT nuclei (11 μm; Figure 2B,C). BmCRY1 protein was remarkably reduced in Cry1-KD cells (Figure 2C). Staining patterns of cell membranes also clearly showed that Cry1-KD cells were significantly smaller than WT cells (Figure 2D).

2.2. GC-MS and LC-MS/MS Assay Showed That the Knockdown of BmCry1 Caused Changes in Cell Metabolites

To determine how BmCry1 knockdown resulted in faster BmN growth and smaller cell size, we used GC-MS and LC-MS/MS to determine and analyze the metabolic differences between Cry1-KD and WT cells. The ion chromatograms of GC-MS (Figure S1) and LC-MS (Figure S2) showed a clear difference in chromatographic peaks between the two samples, suggesting that BmCry1 knockdown may have led to variations in metabolites of BmN cells. The principal component analysis (PCA) of GC-MS showed that the automatic simulation obtained two principal components. The model fitting parameter R2X was 0.644, and parameter Q2 was 0.502, indicating that the two principal components of the model could explain 64.4% of the X variables (Figure S3A). Similarly, the PCA of LC-MS showed that the model fitting parameter R2X was 0.644, and Q2 was 0.278 for positive ion mode (Figure S3B), and model fitting parameter R2X was 0.648, and Q2 was 0.349 for negative ion mode (Figure S3C). These results indicated that the metabolome of WT and Cry1-KD samples have a clear separation trend. To eliminate the noise irrelevant to the classifications, a partial least-squares discriminant analysis (PLS-DA) was used to further confirm that there were significant differences in metabolites between WT and Cry1-KD (Figure S3D–F).
We analyzed the VIP ≥ 1 (first principal component variable importance projection value) from PLS-DA analysis with p ≤ 0.05 from t-test thresholds to screen differential metabolites in GC-MS measurement data. A total of 45 differential metabolites of Cry1-KD and WT cells were screened (Table S3). For LC-MS data, we used the first principal components of the PLS-DA model VIP ≥ 1, S-plot p (corr) value ≥ 0.8, and t-test with a p ≤ 0.05 as criteria for screening differential metabolites. The 11 metabolites with large differences were examined with secondary MS (Table S4). These results showed that glucose-6-phosphate, pyruvic acid, aconitic acid, and other glycometabolism-related substances were increased; lipid-metabolizing related substances including 4-hydroxybutanoic acid and cholesterol were also increased, as were nucleotide metabolites including guanosine, guanine, ADP, and FAD. However, amino acids including glutamic acid, ornithine, and aspartic acid were decreased. In addition, some secondary metabolites, including phosphatidylinositol, nicotinamide, ascorbic acid, and other vitamins showed significant decreases (Tables S3 and S4).
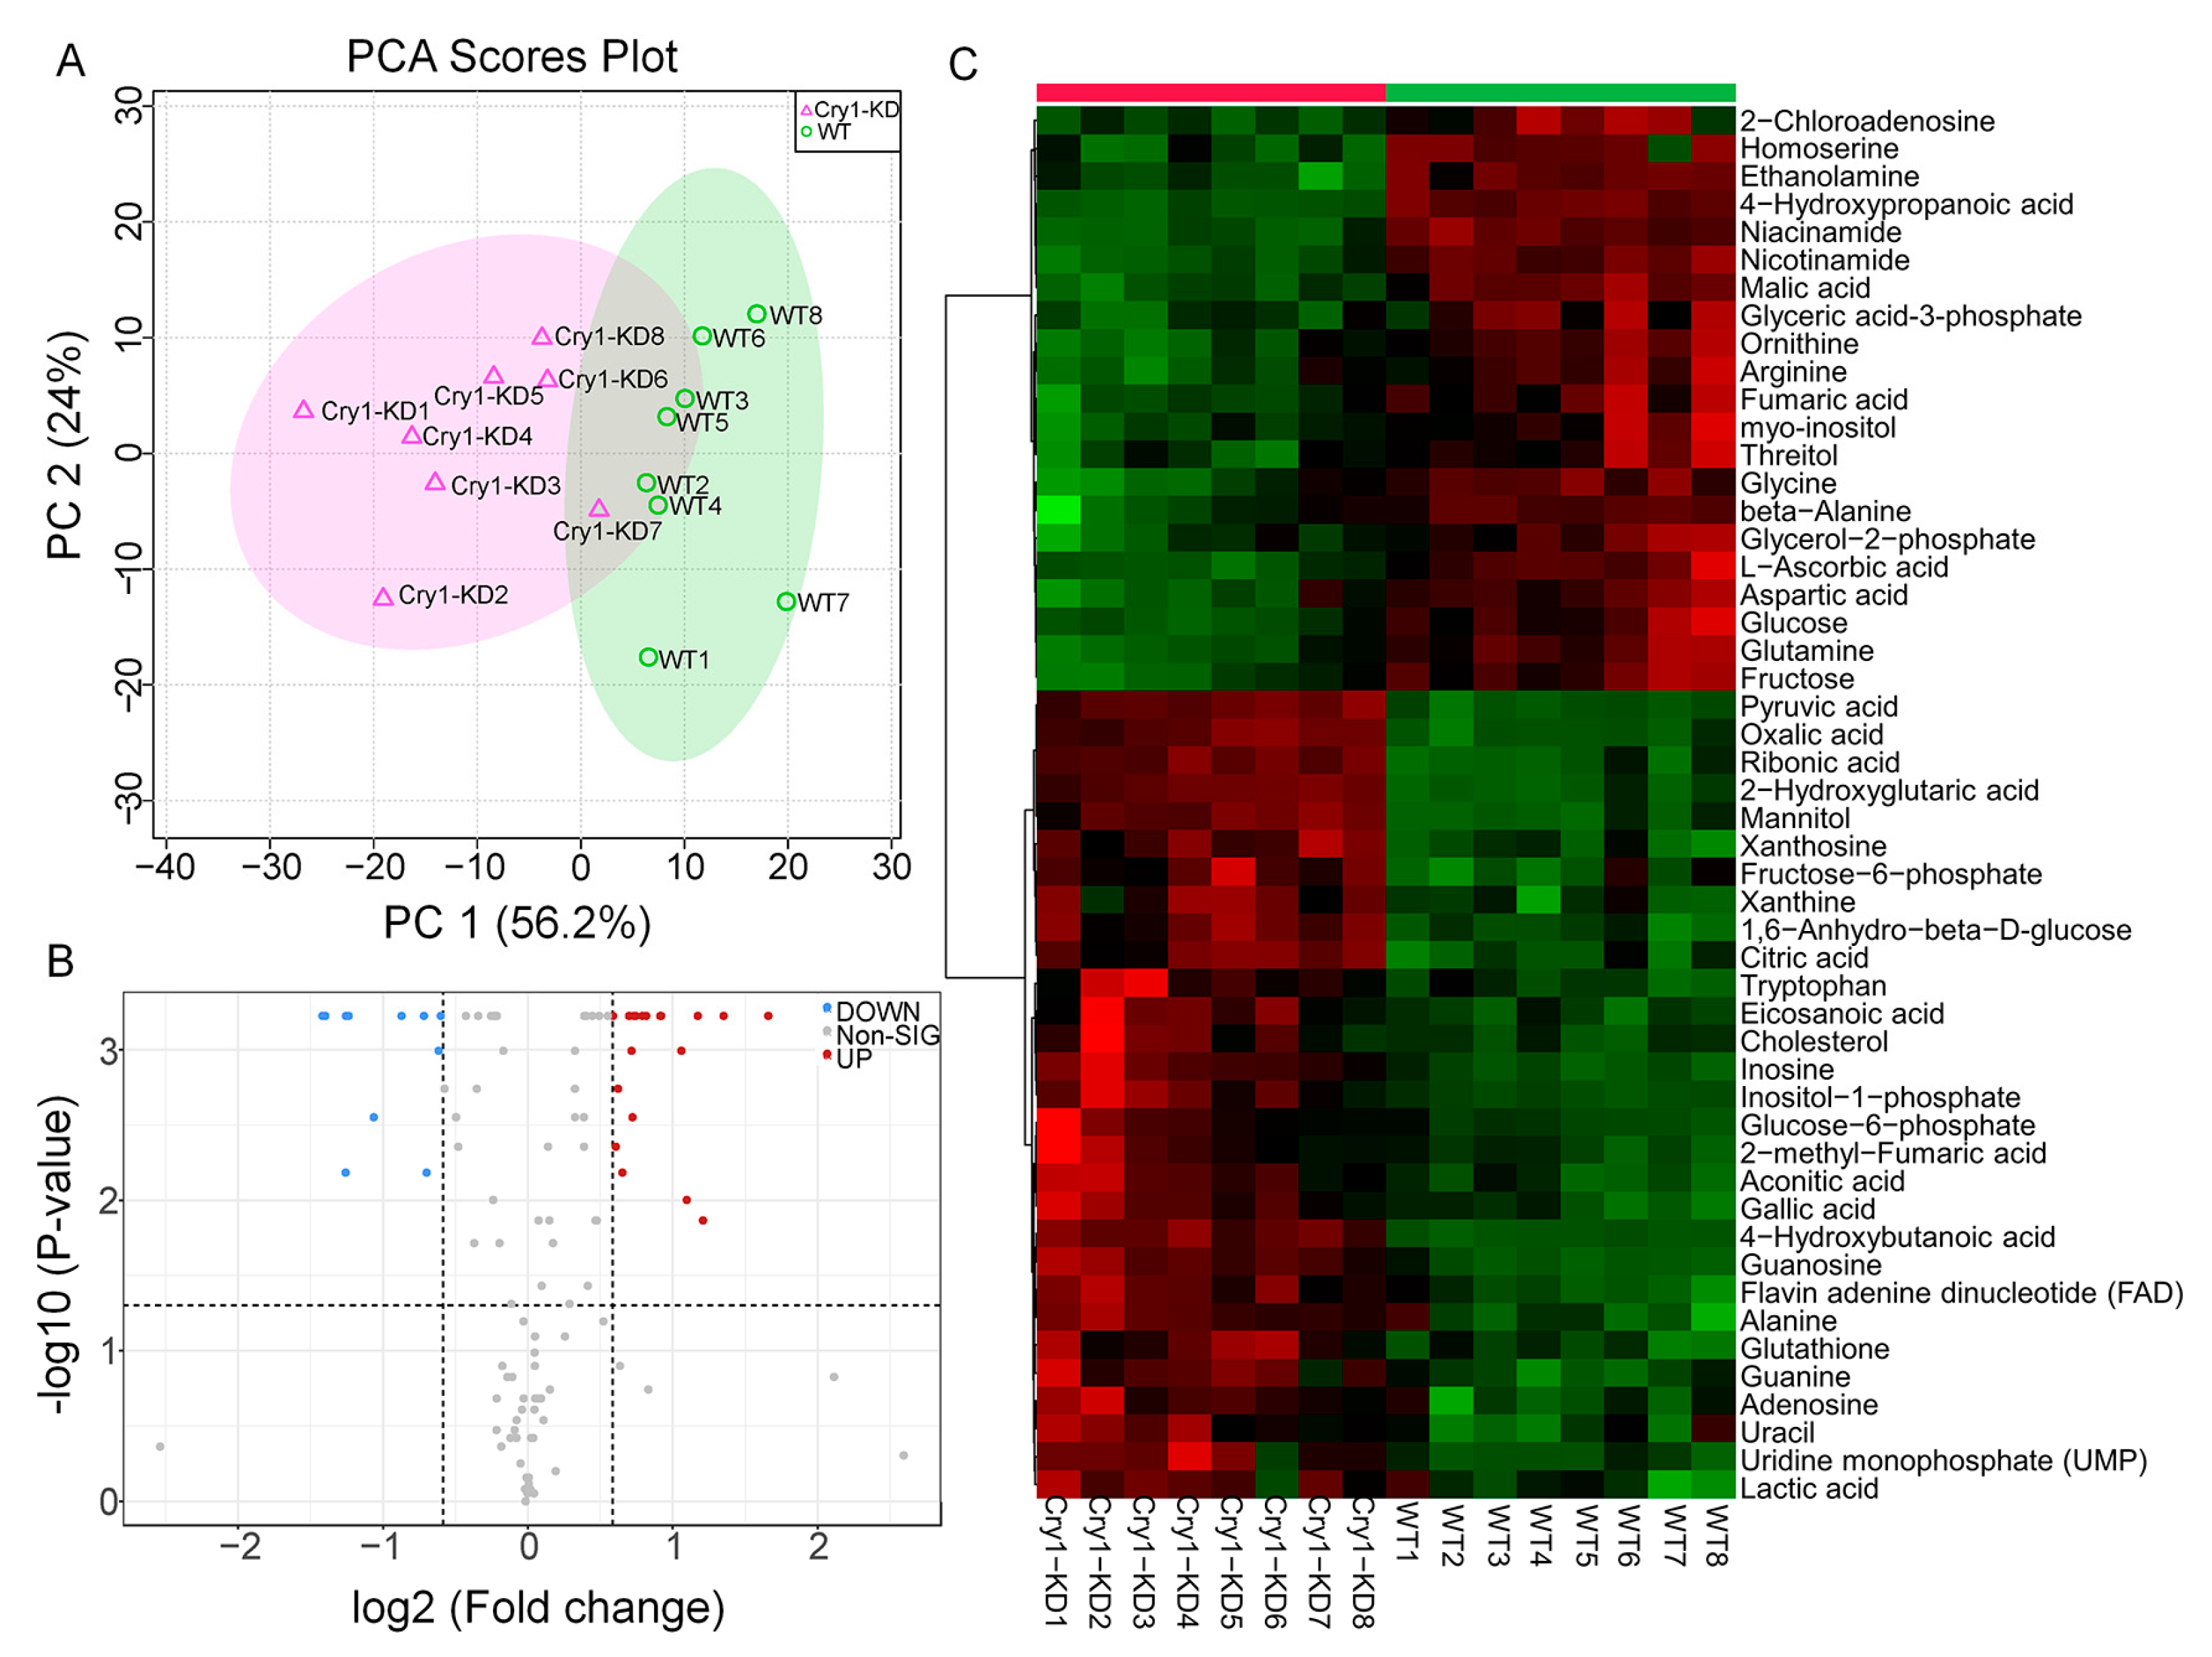
Combining the differential metabolites in LC-MS and GC-MS/MS, the eight replicates of the two samples were clustered in PCA, and the two principal components together explained more than 80% of the difference (Figure 3A). Differential genes were selected under more stringent conditions (fold change > 1.5 and FDR > 0.05). The volcano plots showed that 11 metabolites were significantly downregulated and 19 metabolites were significantly upregulated after BmCry1 knockdown (Figure 3B). Further comparison of the heatmap of the top 50 differential metabolites showed that the content of 21 metabolites significantly decreased and 29 metabolites significantly increased in the Cry1-KD cells (Figure 3C). Amino acids were the major metabolites that were significantly downregulated, and nucleotides, organic acids, and fats were the major metabolites that were significantly upregulated. All differential metabolites were used for subsequent analysis.
After the analysis of differential metabolites, we used metabolite network analysis to investigate the correlation among differential metabolites. Figure 4 shows that although the correlation threshold is set to a high level (0.8), there are 51 related metabolites. To verify the important regulatory role of circadian clocks in glucose metabolism, we selected pyruvate and glucose-6-phosphate acid, which had the most obvious metabolic changes, and clustered them with positively and negatively related substances, respectively. The results showed that substances that were positively related to pyruvate and glucose-6-phosphate acid were mainly organic acids and nucleotide metabolites, while negatively related substances were mainly amino acids, carbohydrates, and other metabolites that could not be classified. The results showed that after knockdown of BmCry1, the metabolic intermediates of glycolysis, pyruvate, and glucose-6-phosphate acid changed significantly, and were correlated with other differential substances.
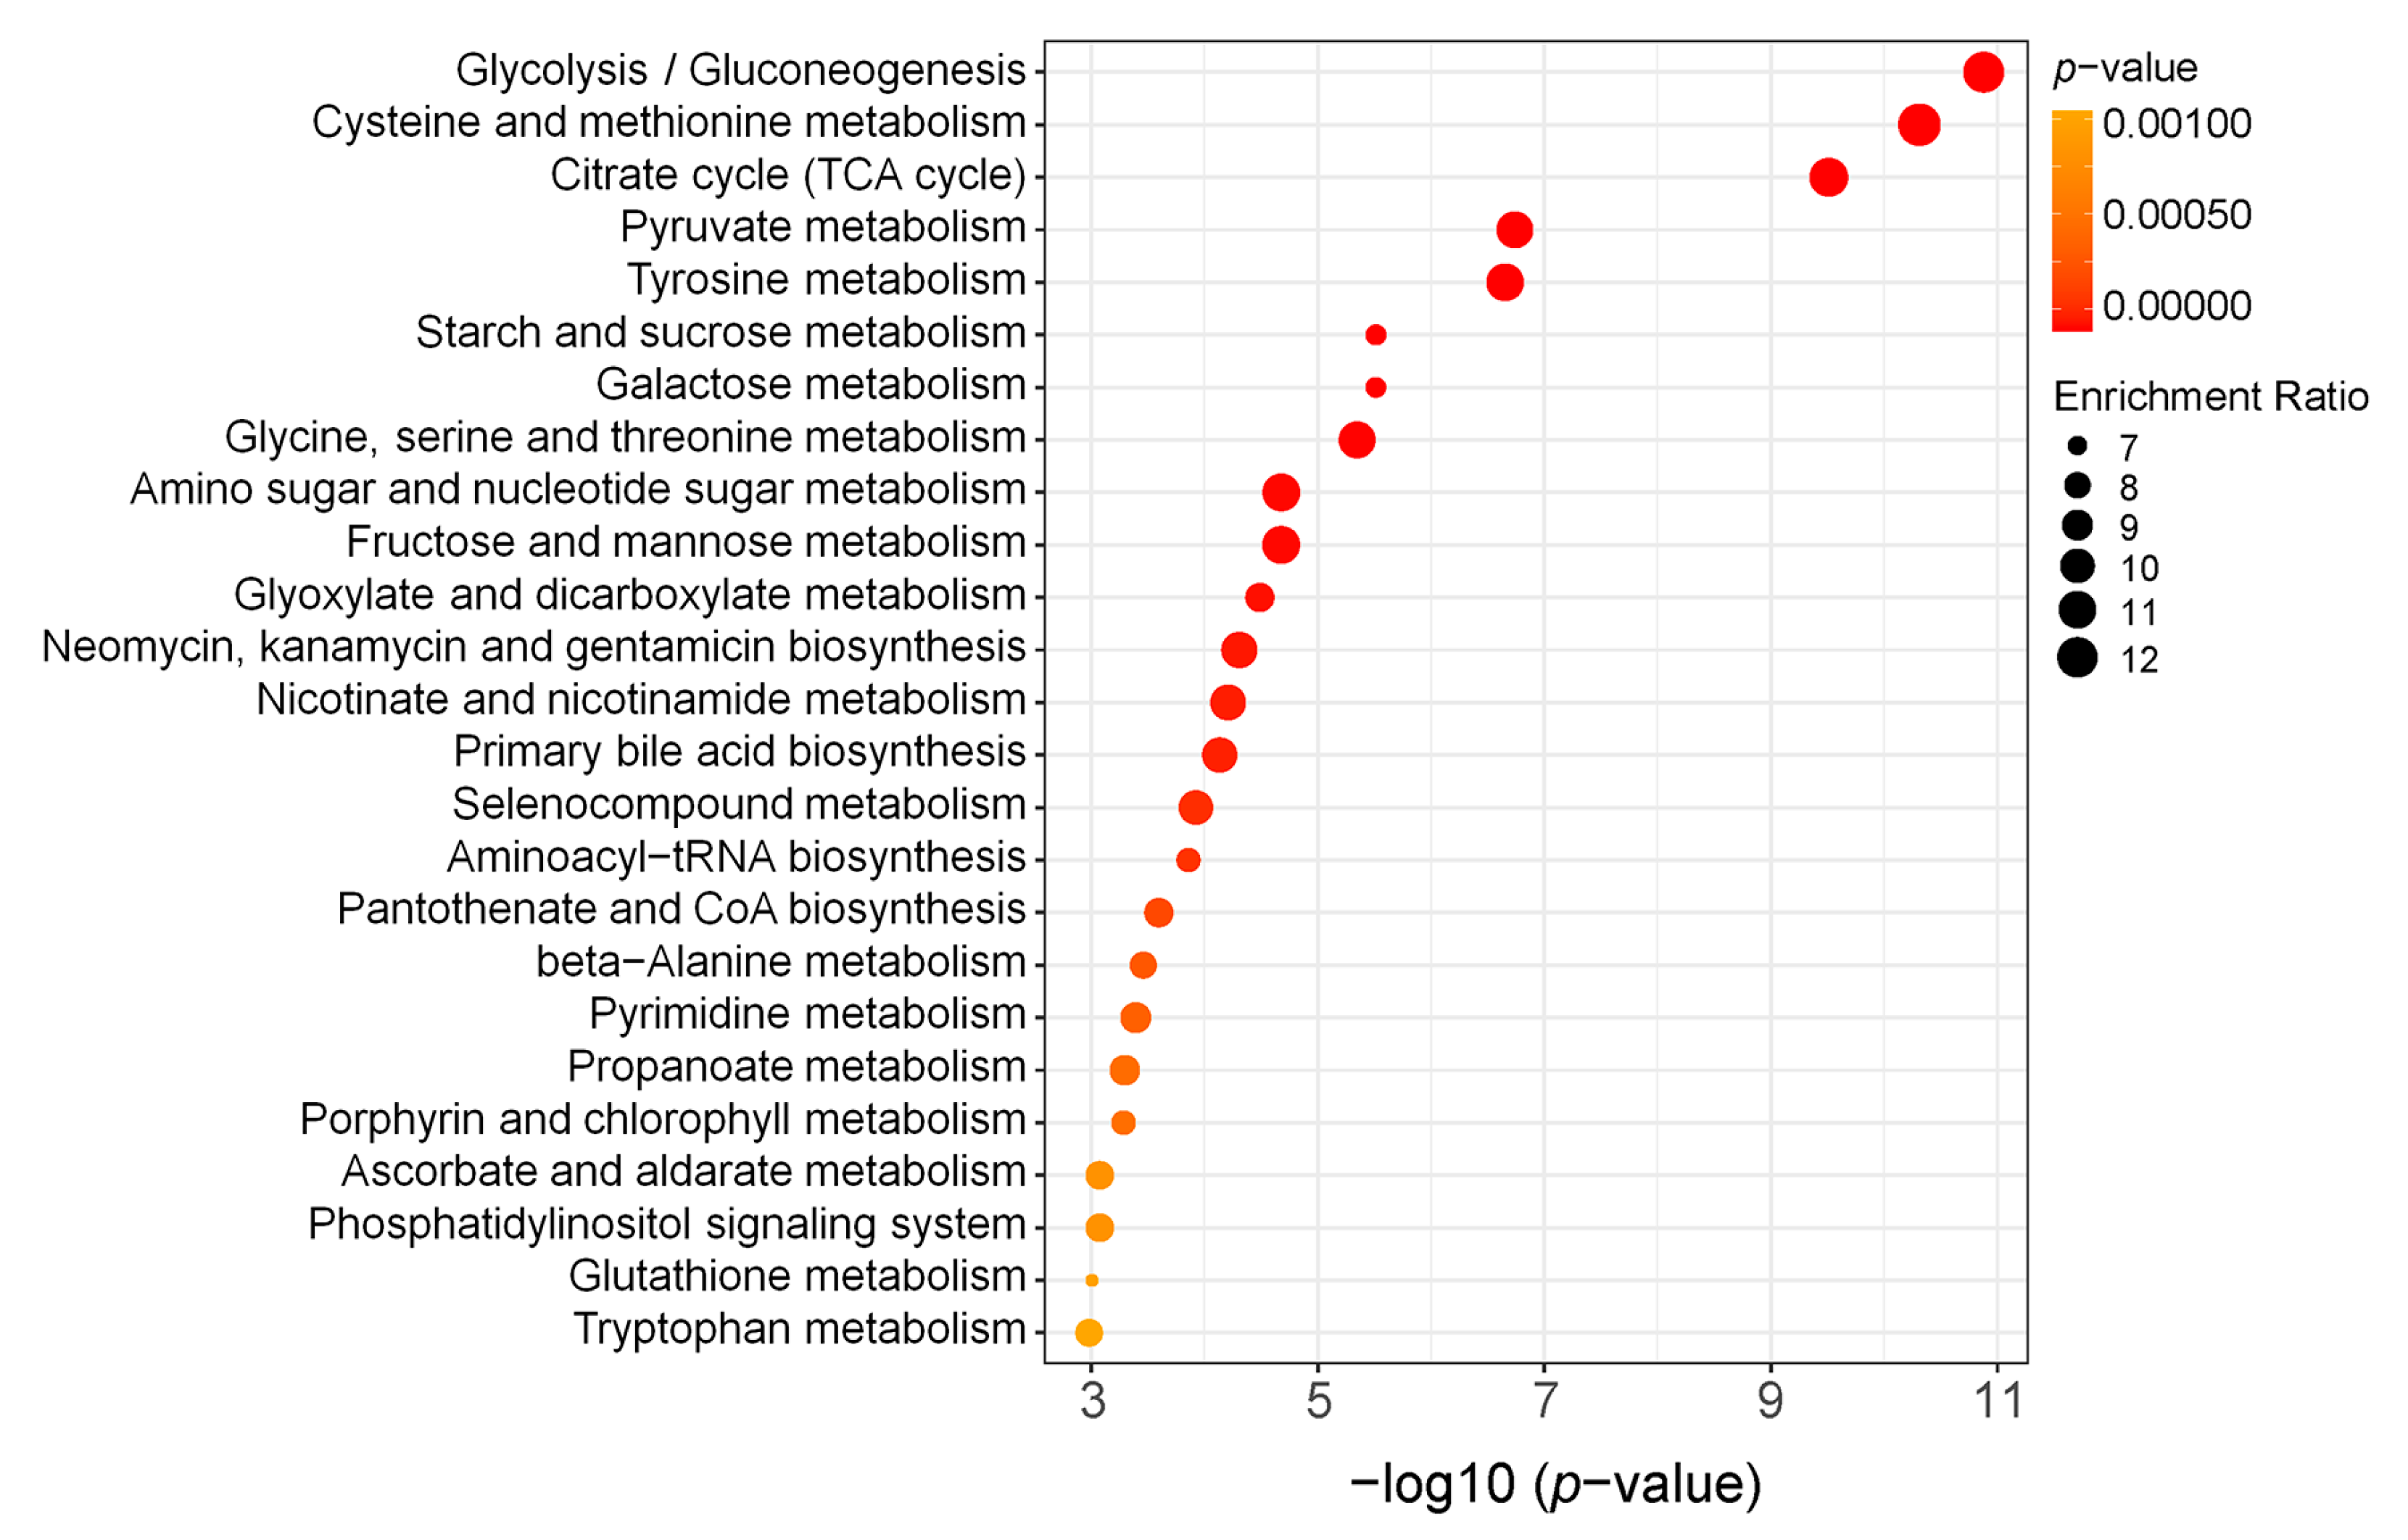
Furthermore, we performed KEGG analysis using all differential metabolites. Figure 5 shows the top 25 KEGG pathways with the greatest changes in cells after BmCry1 knockdown. Notably, there were changes in glycolysis/gluconeogenesis pathways, which are consistent with the overall upregulation of metabolites in the glucose metabolism pathway (Figure 3). In addition, energy metabolic pathways such as citrate cycle and pyruvate metabolism also produce significant changes. Specifically, the comprehensive analysis of KEGG pathways showed that BmCry1 knockdown resulted in extensive and comprehensive metabolic changes in BmN cells.

2.3. Glucose Metabolism Was Increased in BmCry1 Knockdown Cells

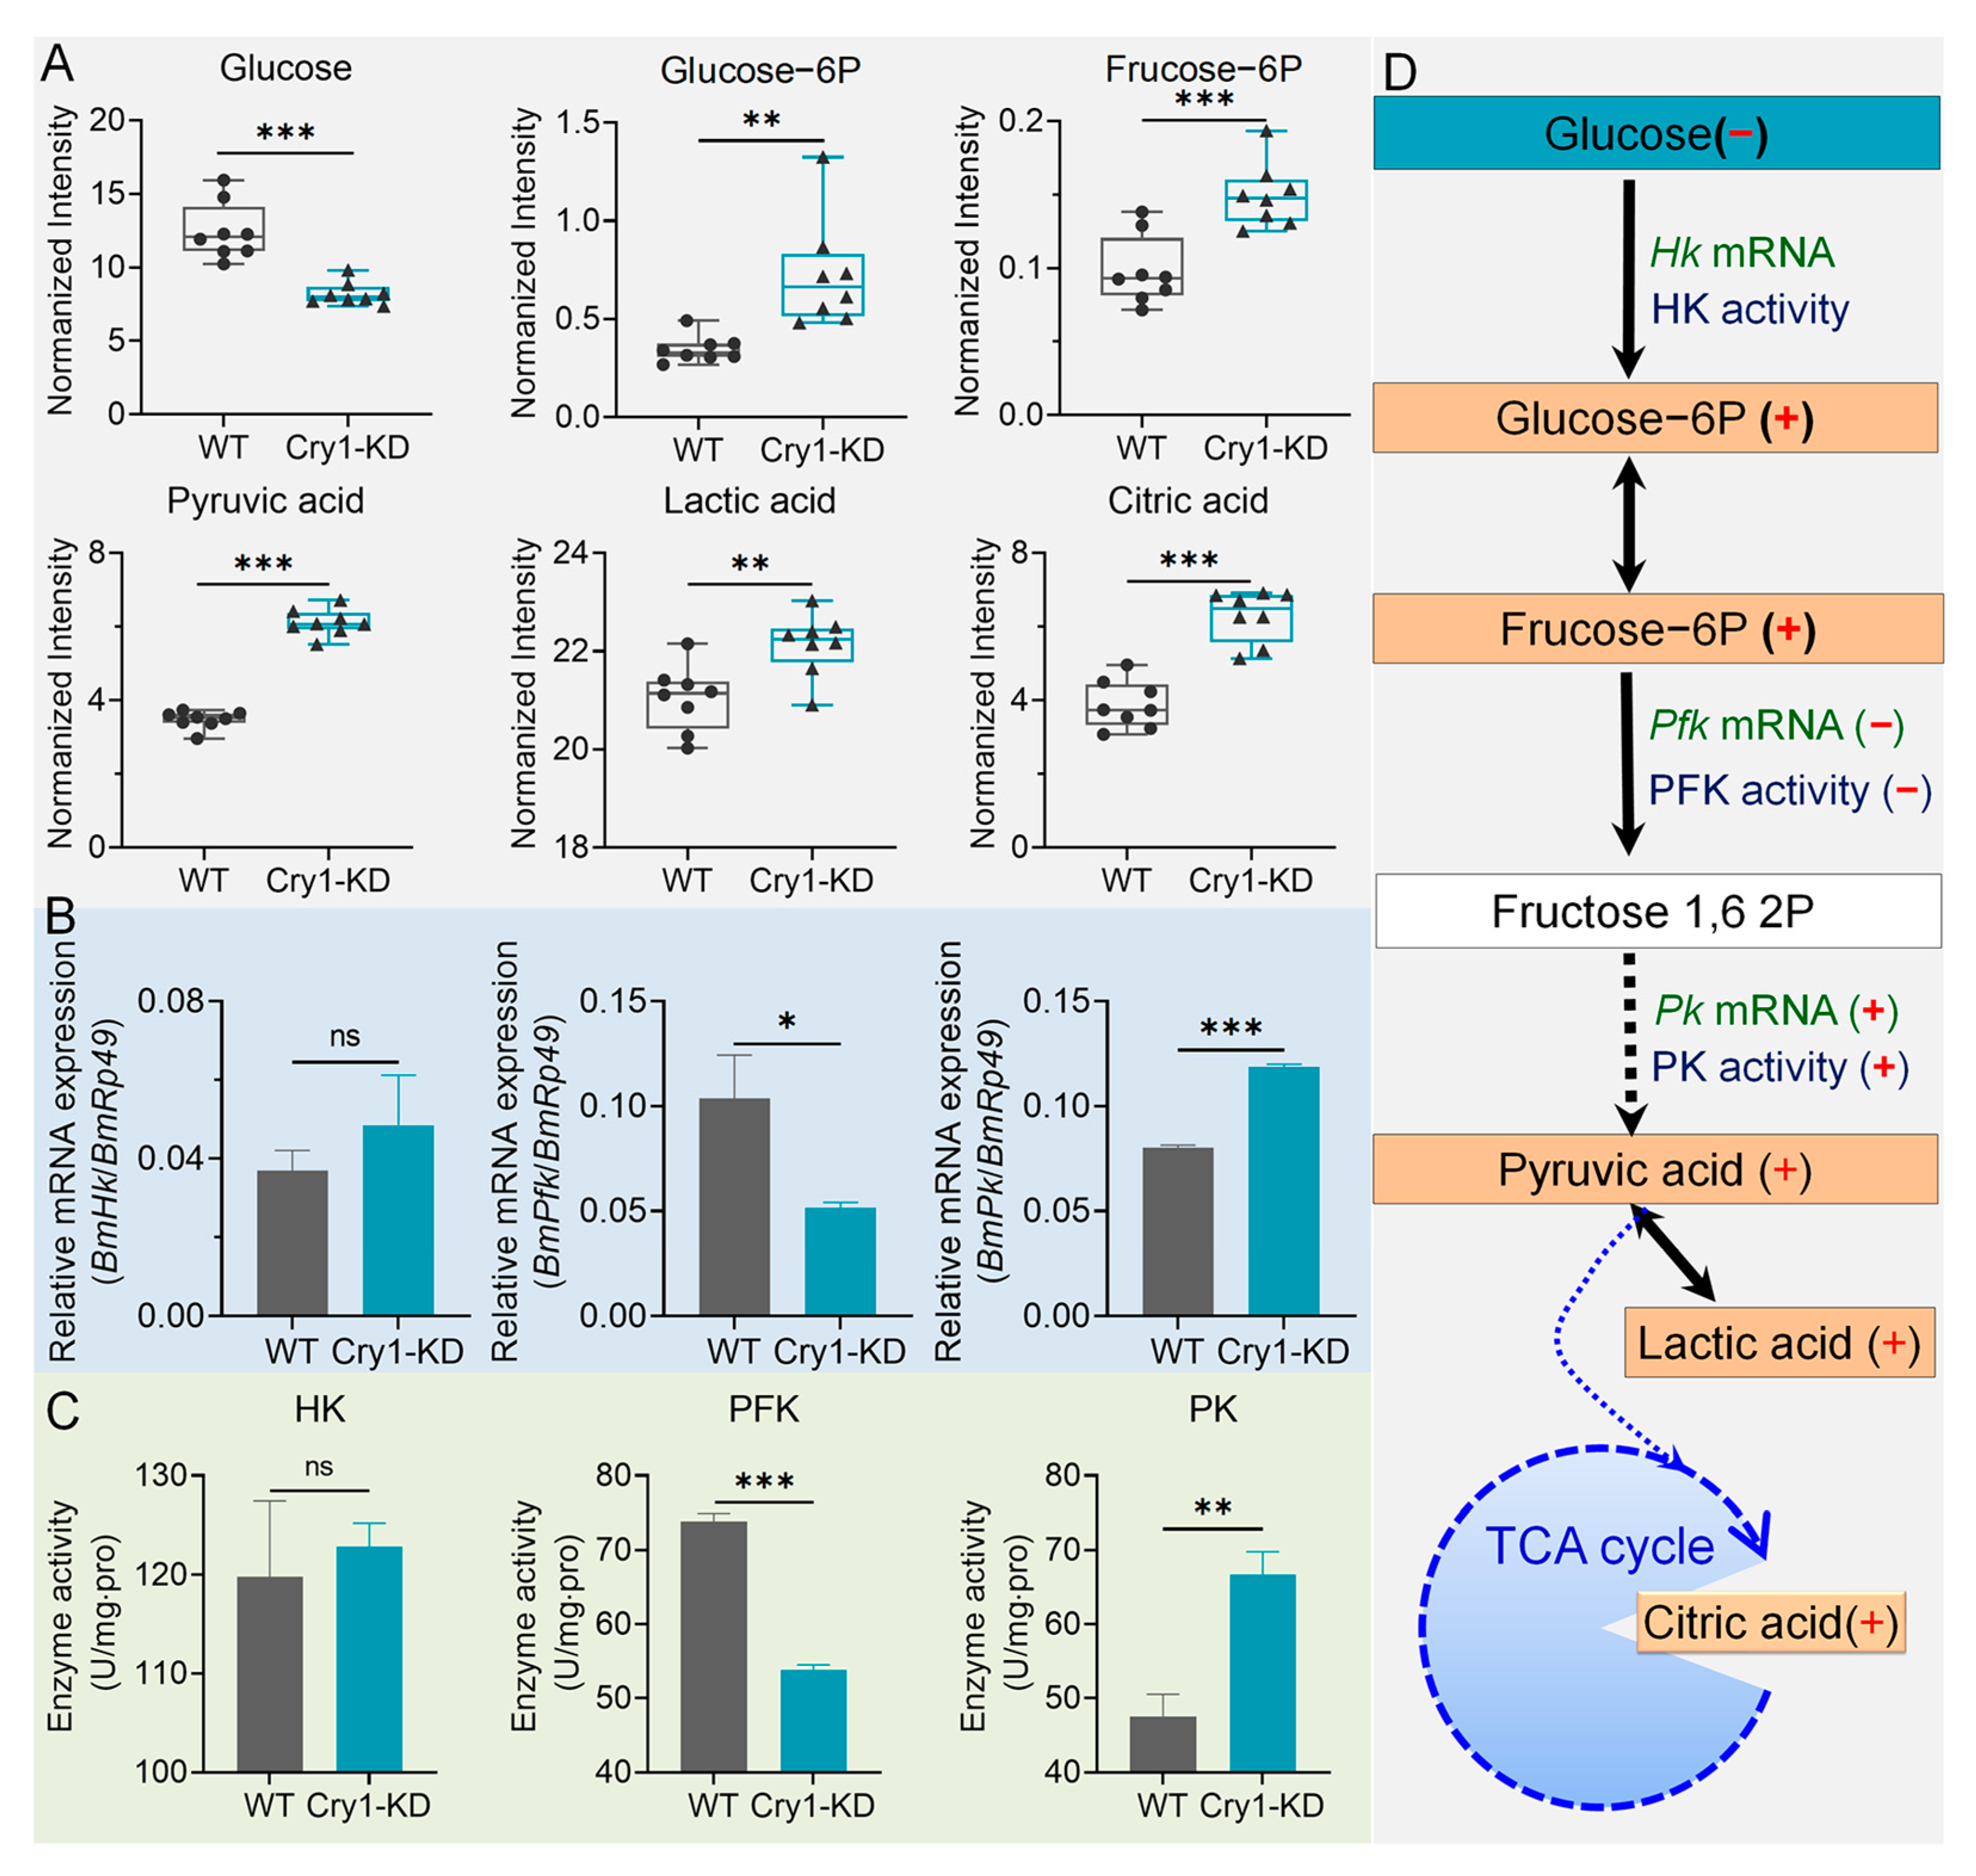
Figure 6A lists the results of metabolomic measurements of the main glycometabolism products. Results showed that BmCry1 knockdown initially resulted in decreased glucose levels in glycometabolism, but the levels of subsequent metabolites, including glucose-6-phosphate, fructose-6-phosphate, pyruvic acid, and citric acid (a metabolite necessary for the initial stages of the TCA cycle), as well as lactic acid (the final product of glycolytic anaerobic metabolism), were all significantly elevated. This indicated that after BmCry1 knockdown, cellular glycometabolism levels, especially glycolysis levels, were significantly altered.
To further demonstrate these changes, we measured the key enzyme activities of the glycolytic pathway and the mRNA levels of their coding genes. The results showed that among three rate-limiting steps of glycolysis, there were no significant changes in transcription levels of BmHk; transcription levels of BmPfk were significantly downregulated; and transcription levels of BmPk were significantly upregulated (Figure 6B). Similar results were found with regard to enzyme activity. There were no significant changes in the enzymatic activities of BmHK; enzymatic activities of BmPFK were significantly downregulated; and enzymatic activities of BmPK were significantly upregulated (Figure 6C). It is worth noting that the upregulation of the enzymatic activity of BmPK was greater than the upregulation of its gene expression. Due to the ubiquitous activity changes caused by kinase post-translational modifications, we suggest that metabolic pathways may also be impacted by these post-translational modifications. These results indicated that BmN cell glycolytic metabolism was changed through the regulation of both the expression and enzymatic activity of key enzymes associated with the glycolysis pathway after the knockdown of BmCry1 expression (Figure 6D).

3. Discussion

Numerous studies have shown that the destruction and interruption of circadian rhythms are associated with many diseases, such as sleep disorders, obesity, diabetes, depression, metabolic syndrome, and cancers [33,35,36,37]. Aging has also been shown to be related to the decline in circadian rhythm levels and the destruction of overall metabolic and energy homeostasis [38,39,40]. Desynchronization of the circadian rhythm of rats and the external environment caused the acceleration of cell proliferation [41]. At the cellular level, mClock gene knockout resulted in decreased proliferation and increased apoptosis of embryonic stem cells [42]. We previously knocked down the BmPer gene in BmN cells and found that cell proliferation slowed down and cell division was arrested in the G0/G1 phase [34,43]. In this study, BmN cells also showed phenotypic changes with a faster growth rate and smaller size upon BmCry1 knockdown, which may be related to cellular metabolic changes. Studies have shown that decreased Cry1 mRNA levels increase protein content through post-transcriptional regulation [44,45]. AU-rich element RNA binding protein 1 (AUF1) binds the Cry1 3′UTR to promote Cry1 translation [45,46]. Although the mRNA level of BmCry1 was reduced by 73% after shRNA interference, the knockdown efficiency at its protein level was insufficient. We speculate that it may be affected by post-transcriptional regulation, resulting in strong stability or high translational efficiency of BmCry1 mRNA. It is necessary to directly knock out BmCry1 at the cellular level in the future.

3.1. Possible Functions of Cryptochrome in Bombyx mori

Rhythmic expression is a characteristic of clock genes. The knockout or knockdown of silkworm clock genes mainly affected the expression level and oscillatory rhythm of other clock genes, leading to the disorder of circadian rhythm [34,47,48]. Knockdown of the BmCry1 gene led to decreased mRNA levels of BmClk and BmCyc genes, which inevitably reduced the expression levels of BmCry2, BmPer, and BmTim genes. The reason for this is that BmCLK/BmCYC heterodimers regulate the transcription of different clock genes, such as BmCry2, BmPer, and BmTim, via E-box in the gene promoter region. Similarly, the knockdown of BmCry1 resulted in a loss of rhythmic expression of clock genes (Figure 1C–G). Under the light cycle of LD 12:12, the mRNA levels of BmCry2, BmTim, and BmClk in Cry1-KD cells remained low, while the mRNA levels of BmPer and BmCyc recovered, and the amplitudes of clock genes increased (Figure S4). More importantly, the expression of BmCry2, BmPer, BmTim, and BmClk in Cry1-KD cells resumed oscillatory rhythm due to photoentrainment, which is consistent with the observations of several instances of clock gene knockout in silkworms [47,48,49,50,51]. We speculate that there are two possible reasons for this: (1) there is still a small amount of remaining BmCRY1 protein in Cry1-KD cells, which responds to photo signals and resets circadian rhythms; (2) other clock genes, such as BmCRY2, have the function of receiving photo signals.
DpCRY1 functions in Danaus plexippus (Lepidoptera) resemble that of CRY in Drosophila, whereby it can receive photo signals and thus direct the reset of circadian rhythms. Moreover, DpCRY1 can promote the degradation of the DpTIM protein [7]. DpCRY2 functions resemble mammalian CRY1/2. DpCRY2 and DpPER form a dimer, enter the nucleus and participate in feedback inhibition in the monarch butterfly [5,8,52]. Our results regarding molecular evolution analysis of silkworm CRY also showed that the evolutionary distance between BmCRY1 and DpCRY1, as well as between BmCRY2 and DpCRY2 were closely related (Figure S5). The function of BmCRY2 is unclear. Our experiments preliminarily showed that BmCRY1 could not enter the nucleus, and BmCRY2 in the cytoplasm bound BmPER to enter the nucleus (unpublished data). These results suggested that the function of BmCRY1 may be similar to that of DpCRY1 in the circadian clock. Therefore, we believe that the small amount of remaining BmCRY1 protein in Cry1-KD cells responds to photo signals under the LD cycle. Taken together, we speculate that the function of BmCRY1 is to receive photo signals and reset the circadian clock, and the function of BmCRY2 is involved in the inhibition of the feedback loop.

3.2. The Interaction of Circadian Clock, Cellular Glycometabolism and Cell Proliferation

Studies have shown that important metabolic processes such as glycometabolism are controlled by the circadian clock [20,53]. Indeed, the metabolic regulation of organisms is the most important function of circadian clock signals [16,54]. MmCry1 or MmCry2 knockdown also increased hepatic gluconeogenesis gene expression and glucose production [55]. Furthermore, these knockout mice also showed decreased glucose tolerance [56]. mCry1 knockout mice developed symptoms similar to those found in diabetes [57], while mCry2 knockout mice had alterations in their blood sugar levels [58]. Conversely, mCry1 overexpression reduced fasting blood sugar levels and increased insulin sensitivity in mice [55]. Mice lacking mCry1/2 showed continual increases in the activity of key enzymes controlled by mineralocorticoid aldosterone from the adrenal gland, which induced increased synthesis of aldosterone, thus leading to hypertension [59]. The above results indicated that CRY plays an important role in regulating glucose metabolism in mammals.
Interaction between CRY proteins and metabolic pathways has been reported previously [60,61]. AMPK can sense cellular metabolic signals in circadian clock systems, phosphorylate CRY proteins, stimulate the ubiquitination of FBXL to CRY proteins and further degrade CRY [62], thus impacting the homeostasis of glycometabolism [56,58,63,64]. We knocked down the BmCry1 gene of BmN, and the glucose metabolism of cells was affected. Glycolytic pathway metabolites glucose-6-phosphate, pyruvic acid, and aconitic acid were significantly increased, and rate-limiting enzymes BmPFK and BmPK mRNA levels and enzyme activities were also affected (Figure 6). Studies have shown that circadian clocks can regulate the conversion of glucose and lipids to energy by regulating the expression of key metabolic enzymes [53]. For example, knockout of Bmal1 results in lipid oxidation and downregulation of key enzymes associated with the TCA pathway and the oxidation respiratory chain in the liver [65]. Bmal1 is also known to control PBP4, a key hepatokine, and thus participates in regulating glucose homeostasis in the liver [66]. Mitochondrial proteomics also shows that rate-limiting enzymes for lipid and carbohydrate accumulation depend on PER1/2 [67]. However, there is no documented evidence showing that CRY1 regulates the metabolism through a similar pathway in insects. In this study, after BmCry1 knockdown, the mRNA levels of other circadian clock genes in cells were downregulated or lost rhythm (Figure 1). Therefore, the knockdown of BmCry1 may indirectly affect glucose metabolism by affecting the expression of other clock genes such as BmCycle, BmClock, or BmPer.
The mechanism of the circadian clock and the cell cycle system has been widely reported. In healthy cells, the coupling of the clock and cell cycle leads to timed mitosis and rhythmic DNA replication [68]. Disruption or disorder of biological rhythms leads to uncontrolled cell proliferation. Studies have shown that expression of downregulated mammalian clock genes Bmal1, Clock, or Tim arrests the cell cycle in G0/G1 or G2/M phase [69,70]. Similarly, interference with BmPer genes in BmN cells also led to cell cycle arrest in G0/G1 phase, and decreased BmC-myc and BmCdc2 expression [43]. The mClk knockout mutant changes the pattern of cell cycle gene expression and inhibits cell growth and proliferation [71,72]. Conversely, some studies have shown that Bmal1 deficiency or circadian photoperiod disruption increased tumor initiation [73]. Mice lacking the mPer2 gene had an increased incidence of lymphoma [42]. Downregulation of mammalian Per2 gene expression will promote the expression of cell cycle-related proteins Cyclin A, Mdm2, C-MYC, etc., thus promoting cell proliferation [42,74,75]. MYC/MIZ1 inversely regulated the expression of circadian clock genes and affected the cell cycle and proliferation [76]. These results indicated that the circadian clock mainly regulates cell proliferation by blocking the cell cycle process or affecting the expression of cell cycle activators/cell cycle suppressors. Overexpression of the cell cycle activator or inhibitor changes the cell number but also leads to reverse changes in cell size [77]. In the Xenopus nervous system, inhibition of progenitor proliferation results in fewer but bigger neurons [78]. Knockdown of the BmCry1 gene in BmN cells resulted in accelerated cell proliferation and a smaller nucleus, which may be related to cell cycle changes; however, we were more concerned about the metabolic changes of Cry1-KD.
Many cells, ranging from microbes to mammals, use aerobic glycolysis during rapid proliferation, suggesting that it may play a fundamental role in supporting cell growth [79]. In healthy cells, the PI3K/AKT/mTOR signaling pathway stimulates glucose input and glycolysis, promoting cell proliferation [80,81]. AMPK inhibits cell proliferation by inhibiting anabolic and catabolic pathways [82]. BmN cells with knockdown of the BmPer gene had inhibited glucose metabolism and slowed cell proliferation [34]. In the study of cancer cells, it is also found that the changes in glucose metabolism are always positively correlated with cell proliferation [83]. Cannabinoid receptor 2 (CB2R) inhibits glycolysis by downregulating HIF-1α, thereby inhibiting the proliferation of mouse liver macrophages [84]. Inhibition of genes related to glucose metabolism OIP5, SMC4, and NUP107 also inhibited cell cycle progression [85]. These studies indicated that glucose metabolism is an important target for regulating cell proliferation. The proliferation of Cry1-KD cells was accelerated, which may be related to the upregulation of glucose metabolism.

3.3. Metabolic Difference between Knockdown BmCry1 and BmPer in BmN Cells

Previously, we reported the impact of the knockdown of BmPer on the metabolism of BmN cells [34]. We also investigated the reason that BmN cell proliferation slowed down after the knockdown of the BmPer gene [43]. In contrast to slowed growth of Per-KD cells, BmCry1 knockdown significantly increased cell proliferation. We focused on metabolomics data and summarized the differences in the impacts of knockout of BmCry1 and BmPer on BmN cell growth and metabolism (Figure S6). The results showed that carbohydrates and most organic acids and amino acids involved in the metabolism of glucose and lipids showed opposite trends. The overall level of glycometabolism was upregulated in Cry1-KD, whereas they were upregulated in Per-KD cells.
Even though PER and CRY both play important roles in inhibiting expression in the feedback loop of circadian clocks, PER protein protects the phosphorylation of CLOCK proteins by preventing damage from CRY proteins [86]; this is closely related to the entire clock oscillation and transcriptional rhythm of the output system [87]. Previous studies also showed that PER proteins have an opposite mechanism to CRY proteins, which is different from the traditional model, wherein PER proteins are transcriptional repressors of Per and Cry [88,89,90]. In addition, studies also showed that PER2 may have a positive effect on transcription in a promoter-specific manner [88,91]. Moreover, at certain stages and tissues, PER may play an antagonistic role with CRY [92,93]. It is therefore reasonable to conclude that CRY and PER proteins may play an antagonistic role in affecting metabolism in BmN cells.
In zebrafish, computer simulations have demonstrated that many purine and pyrimidine metabolites exhibit the same rhythm phase, and de novo purine synthesis pathways have a great impact on the cell cycle [16]. In Danaus plexippus, the CRY1 protein transmits photo signals to PER and CRY2 proteins; these proteins then further regulate the transcription level genes by inhibiting CLK/CYC transcriptional activation, thereby implementing signal output [5]. Therefore, we conclude that the knockdown of BmCry1 and BmPer may partially relieve the transcriptional repression of clock-controlled genes. Our study found that both Cry-KD and Per-KD cell lines showed similar changes in regard to decreased cell nuclei diameters and decreased cell volume, as well as upregulation of nucleotide metabolism levels. We were unable to explain why the nuclei were smaller after the knockdown of BmPer and BmCry, or why the levels of nucleotide and purine metabolites were upregulated. We suppose that these changes may be related to changes in the transcriptional repression of clock-controlled genes.

4. Materials and Methods

4.1. Preparation of the BmCry1 Knockdown (Cry1-KD) Cells

The B. mori ovary cells (BmN) were cultured in Grace’s insect medium (Corning, NY, USA) with 10% FBS (Corning, NY, USA) at 26 °C in constant darkness (DD).
Pre-microRNA with mir-30 was used to construct transfection plasmid short hairpin RNAs (shRNAs). We designed three interference sites of BmCry1, and the mRNA levels of BmCry1 were detected by qRT-PCR after transfection. We found that the Cry1-shRNA3 had a knockdown efficiency of 73% for BmCry1 transcript levels, while Cry1-shRNA1, Cry1-shRNA2 or Cry1-shRNA1 + 3 had a lower knockdown efficiency (50%) (Figure S7A). The BmCry1 cDNA sequence 1856AAGAACGTGCCAACTGTATAA1876 was chosen for siRNA Cry1 and inserted into shRNA to obtain shRNA-Cry1 (GCGACTTATACAGTTGGCACGTTCTTCTGTGAAGCCACAGATGGGAAGAACGTGCCAACTGTATAAGCTGC), which was then inserted into the OpIE2 promotor driven pIZT/V5-His/Cat vector between SacI578 and SpeI651 to generate the shRNA-Cry1 expression vector (Figure S7B). The preparation of BmCry1 knockdown cells was performed as described previously [34]. Briefly, BmN cells were cultured in Grace’s Insect Medium with 10% FBS at 26 °C in DD. We diluted 2 μL of Lipofectamine LTX reagent and 0.5 mg DNA plus reagent vector in 25 μL of Grace’s Insect Medium and mixed after a 10 min incubation. The mixture was then used to transfect BmN cells in 24-well plates for 48 h, followed by the addition of 100 μg/mL bleomycin. The transfection efficiency was counted by fluorescence microscopy. The shRNA-Cry1 expression vector transfected BmN cells for 2 days, and the number of green-labeled cells was about 50% (Figure S8A). The medium was changed every 48 h and the bleomycin concentration in the medium was maintained at 100 μg/mL. The interference plasmid was continuously transfected, cells were screened with bleomycin for 2 weeks, and the number of green-labeled cells was about 90% or more (Figure S8B). The efficiency of shRNA-mediated BmCry1 knockdown was determined using qRT-PCR and Western blotting. Prior to qRT-PCR and Western blotting, both cell lines were synchronized using Dex (0.1 μM) for 2 h in darkness. The BmN cells were identified as BmCry1 knockdown cells (Cry1-KD) after stable interference of the BmCry1 gene, and cultured in the medium containing 100 μg/mL bleomycin at 26 °C in DD.

4.2. Cell Proliferation Assay

The 3–(4, 5)–dimethylthiazo (–z–y1) -3, 5-diphenytetrazoliumbromide (MTT) method was used to determine cell growth, according to the manufacturer’s instructions (C0009, Beyotime, Nantong, Jiangsu, China). Briefly, 100 μL of cell solution (~2 × 10³ cells) and 10 μL of MTT (5 mg/mL) solution were added to each well of a multi-well plate and incubated for 4 h at 37 °C. Formazan solution (100 μL) was then added and the mixture was incubated for a further 4 h at 37 °C. The absorbance at 570 nm was then measured using a microplate reader (Eon, Biotek, Winooski, VT, USA). All experiments were performed in triplicates.

4.3. Cell Staining

WT or Cry1-KD BmN cells were inoculated into culture plates for 12 h, washed with 1 mL PBS, and then fixed with 4% paraformaldehyde for 15 min. They were further treated with 0.1% Triton X-100 and stained with Dil staining solution (Beyotime, Nantong, Jiangsu, China) for 1 min. Finally, cells were stained with 4′–6-diamidino–2–phenylindole (DAPI; Beyotime) for 5 min at room temperature. It is important to ensure that PBST (PBS with 0.05% Tween-20) is used to fully wash after each fixation, permeabilization, and staining. After staining, the cell nuclear size (the average value of the longest and shortest diameters) was surveyed promptly using Image-Pro Plus software on a fluorescence microscope (Olympus BX51, Tokyo, Japan). Five independent fields were analyzed for each plate, and all experiments were performed in triplicate.

4.4. Determination of Metabolomics

According to the reported method [94], 1 × 10⁷ cells were counted, then obtained by quenching and centrifugation at 1000× g for 1 min. Based on the method reported by Tao et al. (2017), cell samples to be determined with GC/LC-MS were pretreated. Samples were resuspended in 500 μL of methanol, precooled to −80 °C and centrifuged twice (15,000× g for 1 min). The supernatant was further resuspended in ultrapure water, frozen in liquid nitrogen, and centrifuged (15,000× g, 1 min). The supernatant of the treated samples was vacuumed and dried at 30 °C to generate the specimen.
Spectroscopic parameters of GC-MS (Agilent 7890A/5975C, Agilent, Santa Clara, CA, USA) and LC-MS (Waters UPLC, Waters, Milford, MA, USA) are shown in Figures S1 and S2, respectively. An HP-5 MS capillary column (5% phenyl methyl silox: 30 μm × 250 μm internal diameter, 0.25 μm; Agilent J &W Scientific, Folsom, CA, USA) was used for GC-MS, and a C18 column (1.7 μm, 2.1 × 100 mm; (BEH, Waters, Milford, MA, USA) was used for LC-MS. Metabolites from LC-MS detection were further confirmed using secondary MS. We first confirmed and obtained the empirical formula of the metabolites based on the exact molecular weight (molecular weight error < 30 ppm). We further used the exact molecular weight according to MS/MS fragment patterns to search and confirm potential biomarkers in the Human Metabolome Database http://www.hmdb.ca website (accessed on 15 October 2022), Metlin http://metlin.scripps.edu/website (accessed on 27 October 2022), massbank http://www.massbank.jp/ (accessed on 5 November 2022) and LipidMaps http://www.lipidmaps.org (accessed on 8 December 2022) databases. A total of 20 μL of the sample was taken from all tested samples to correct errors that may have occurred during the tests. GC-MS and LC-MS assays were carried out at BioNovoGene Co., Ltd. (Suzhou, China).

4.5. qRT-PCR Analysis

WT and Cry1-KD cells were sampled every 4 h for 24 h for qRT-PCR. Total RNA was isolated with RNAiso™ Plus (TaKaRa, Dalian, China) from WT and Cry1-KD BmN cells, and cDNA was synthesized with the PrimeScript RT (Perfect Real Time) Reagent Kit with gDNA Eraser (TaKaRa), according to the manufacturer’s instructions. All reactions were carried out in a total reaction volume of 20 μL using an ABI StepOnePlus™ PCR system (Ambion, Foster City, CA, USA) and the fluorescent dye SYBR Premix Ex Taq (TaKaRa). Transcript levels of BmCry2, BmPer, BmTim, BmClk, and BmCyc were obtained under the following reaction conditions: 95 °C for 30 s, then 40 cycles at 95 °C for 5 s and 60 °C for 30 s. After PCR, we used a melting curve analysis to confirm the amplification of the specific products. The data were normalized with endogenous BmRp49. All the experiments were performed in triplicate. The gene-specific primers used in this study are shown in Table S1.

4.6. Determination of Enzyme Activity

Soluble proteins from WT and Cry1-KD cells were extracted for enzyme activity assay. As mentioned in Tao et al. (2017), enzyme activities of HK, PFK, and PK were determined with the corresponding enzyme activity assay kit (Jiancheng, Nanjing, China), with glucose, glucose-6-phosphate, and phosphoenolpyruvate as substrates, respectively, according to the manufacturer’s instructions. One unit of HK, PFK, and PK, respectively, was defined as the consumption of 1 nM nicotinamide adenine dinucleotide/min/mg of cell protein (U/mg protein). Protein concentrations were measured with a BCA kit (Beyotime).

4.7. Western Blotting

Proteins were extracted from WT and Cry1-KD cells, and concentrations were measured with a BCA kit (Beyotime). Western blotting was performed according to the method described by Tao et al. (2017). Resultant protein bands were quantified using a ChemiDoc Touch Imaging System (Bio-Rad, Hercules, CA, USA). The BmCRY1 protein amino acid sequence was acquired from the NCBI (GenBank accession number ADM86934). After peptide sequence design, synthesis, and purification, the peptide sequence of the CRY1 protein, NH2-RLDPSGEYVRRYVPECCONH2, was used as an antigen to immunize New Zealand rabbits. The antigenic epitopes used for raising the polyclonal antibodies for CRY1 were at the amino acid residues of 432–446. The NH2 at the N-terminal and the CCONH2 at the C-terminal were used to conjugate with the carrier protein KLH. An enzyme-linked immunosorbent assay (ELISA) was used to detect the antibody titer. The ELISA result was about 3 when they were diluted 1000 times. As the titers of the antisera were more than 1, we affirmed that they were efficient antibodies. The antibodies were purified using affinity purification. All of these procedures were completed by Abgent Biotechnology Co., Ltd. (Suzhou, China).

4.8. Immunohistochemistry

WT or Cry1-KD BmN cells were inoculated in culture plates for 12 h and washed with 1 mL phosphate-buffered saline (PBS). Cells were fixed with 4% paraformaldehyde solution for 15 min at room temperature and washed three times with PBS. Then, the cells were treated with permeabilization buffer (0.1% sodium deoxycholate and 2% Tween-20 in PBS solution) for 30 min at room temperature and washed three times with PBS. The blocking solution was added and shaken for 1 h at 37 °C. Cells were incubated with CRY1 polyclonal antibody for Bombyx mori, and diluted 1: 100 with TBS (PBS with 0.05% Tween-20) at 4 °C for 12 h. After further washing three times with TBS, cells were then added to 500 μL TBS and 0.5 μL goat anti-rat IgG(H + L) FITC (MultiSciences, Hangzhou, China) and incubated at 37 °C for 2 h in the dark. Cells were washed three times again with TBS and observed using a fluorescence microscope (Olympus BX51, Tokyo, Japan).

4.9. Statistical Analysis

Raw data from GC-MS and LC-MS were processed as described in Tao et al. (2017), using XCMS www.bioconductor.org/ (accessed on 27 October 2022). We used a partial least-squares discriminant analysis (PLS-DA), first principal component variable importance in projection (VIP) values (VIP ≥ 1), and Student’s t-test (p < 0.05) to screen the differential metabolites. Analysis of the above data as well as PCA and heat map functions were all implemented using R 3.0.3 www.r-project.org (accessed on 22 December 2022).
Metabolite association analysis and statistical tests using Pearson’s correlation coefficients with cor() and cor.test() functions were analyzed using the R package. The metabolite correlation threshold was set to 0.8, and a false discovery rate of p ≤ 0.05 was considered significant; the relationships among metabolites for constructing the metabolic pathways were based on the Kyoto Encyclopedia of Genes and Genomes (KEGG) database http://www.genome.jp/kegg/ (accessed on 27 December 2022). A univariate analysis of variance (ANOVA) was used to determine the significance of differences in relative contents between different groups. Pathway activity profiling (PAPi) was used to predict and compare the relative activity of different metabolic pathways during different comparisons. Throughout the analysis process, data normalization and related statistical analysis were carried out in MetaboAnalyst https://www.metaboanalyst.ca (accessed on 14 January 2023). Enzyme activity and gene expression levels were analyzed by a univariate ANOVA.

Supplementary Materials

The following supporting information can be downloaded at: https://www.mdpi.com/article/10.3390/ijms24065435/s1.

Author Contributions

Conceptualization, S.X., H.T. and J.Q.; methodology, J.Q., T.D., H.T. and X.L.; validation, J.Q., T.D. and H.T.; formal analysis, J.Q., T.D. and C.L.; investigation, H.T., X.L., J.Q., T.D. and C.L.; data curation, H.T., J.Q., T.D. and C.L.; writing—original draft preparation, H.T., S.X., J.Q., Y.S. and T.D.; writing—review and editing, S.X., Y.S. and J.Q.; supervision, S.X. and Y.S.; funding acquisition: S.X., J.Q. and T.D. All authors have read and agreed to the published version of the manuscript.

Funding

This research was funded by the National Natural Science Foundation of China, grant number 32172794; China Postdoctoral Science Foundation, grant number 2021M692343; Nantong science and technology, grant number JC2021073; the Priority Academic Program Development of Jiangsu Higher Education Institutions (PAPD), and the Postgraduate Research & Practice Innovation Program of Jiangsu Province, grant number KYCX22_3209.

Institutional Review Board Statement

Not applicable.

Informed Consent Statement

Not applicable.

Data Availability Statement

Data sharing not applicable.

Conflicts of Interest

The authors declare no conflict of interest.

References

  1. Ahmad, M.; Cashmore, A.R. HY4 gene of A. thaliana encodes a protein with characteristics of a blue-light photoreceptor. Nature 1993, 366, 162–166. [Google Scholar] [CrossRef]
  2. Yuan, Q.; Metterville, D.; Briscoe, A.D.; Reppert, S.M. Insect Cryptochromes: Gene Duplication and Loss Define Diverse Ways to Construct Insect Circadian Clocks. Mol. Biol. Evol. 2007, 24, 948–955. [Google Scholar] [CrossRef] [Green Version]
  3. Ozturk, N. Light-dependent reactions of animal circadian photoreceptor cryptochrome. FEBS J. 2022, 289, 6622–6639. [Google Scholar] [CrossRef] [PubMed]
  4. Wang, W.D.; Liang, H.; Zhu, X.S.; Tao, H.; Xu, L.; Sima, Y.H.; Xu, S.Q. Molecular cloning and bioinformatic analysis of circadian clock genes Bmcry1 and Bmcry2 in Bombyx mori. Acta Entomol. Sin. 2011, 54, 9–19. [Google Scholar]
  5. Zhu, H.; Sauman, I.; Yuan, Q.; Casselman, A.; Emery-Le, M.; Emery, P.; Reppert, S.M. Cryptochromes Define a Novel Circadian Clock Mechanism in Monarch Butterflies That May Underlie Sun Compass Navigation. PLoS Biol. 2008, 6, e4. [Google Scholar] [CrossRef] [Green Version]
  6. Rubin, E.B.; Shemesh, Y.; Cohen, M.; Elgavish, S.; Robertson, H.M.; Bloch, G. Molecular and phylogenetic analyses reveal mammalian-like clockwork in the honey bee (Apis mellifera) and shed new light on the molecular evolution of the circadian clock. Genome Res. 2006, 16, 1352–1365. [Google Scholar] [CrossRef] [PubMed] [Green Version]
  7. Wan, G.; Hayden, A.N.; Iiams, S.E.; Merlin, C. Cryptochrome 1 mediates light-dependent inclination magnetosensing in monarch butterflies. Nat. Commun. 2021, 12, 771. [Google Scholar] [CrossRef] [PubMed]
  8. Emery, P.; So, W.V.; Kaneko, M.; Hall, J.C.; Rosbash, M. CRY, a Drosophila Clock and Light-Regulated Cryptochrome, Is a Major Contributor to Circadian Rhythm Resetting and Photosensitivity. Cell 1998, 95, 669–679. [Google Scholar] [CrossRef] [Green Version]
  9. Merlin, C.; Beaver, L.E.; Taylor, O.R.; Wolfe, S.A.; Reppert, S.M. Efficient targeted mutagenesis in the monarch butterfly using zinc-finger nucleases. Genome Res. 2013, 23, 159–168. [Google Scholar] [CrossRef] [PubMed] [Green Version]
  10. Sehadova, H.; Markova, E.P.; Sehnal, F.; Takeda, M. Distribution of Circadian Clock-Related Proteins in the Cephalic Nervous System of the Silkworm, Bombyx Mori. J. Biol. Rhythm. 2004, 19, 466–482. [Google Scholar] [CrossRef]
  11. Zhang, D.Y.; Liang, H.; Sima, Y.H.; Xu, S.Q. Effects of temperature and light rhythm on expression of clock genes Cry1 and Cry2 in Bombyx mori adult. Sci. Seric. 2013, 39, 453–459. [Google Scholar]
  12. Liang, H.; Xu, S.Q. Effect of diapause-inducing temperature and photoperiod on expression of major circadian clock feedback loop genes in embryos of silkworm, Bombyx mori. Sci. Seric. 2010, 36, 771–779. [Google Scholar]
  13. Chu, F.; Qiu, J.F.; Tao, H.; Li, X.; Shu, M.Y.; Liu, H.J.; Sima, Y.; Xu, S. Impact of cyclical changes in temperature on circadian clock genes expression in Bombyx BmN cells. Arch. Insect Biochem. Physiol. 2016, 91, 175–1886. [Google Scholar] [CrossRef]
  14. Sato, T.; Sassone-Corsi, P. Nutrition, metabolism, and epigenetics: Pathways of circadian reprogramming. EMBO Rep. 2022, 23, e52412. [Google Scholar] [CrossRef] [PubMed]
  15. Panda, S. Circadian physiology of metabolism. Science 2016, 354, 1008–1015. [Google Scholar] [CrossRef] [Green Version]
  16. Li, Y.; Li, G.; Görling, B.; Luy, B.; Du, J.; Yan, J. Integrative Analysis of Circadian Transcriptome and Metabolic Network Reveals the Role of De Novo Purine Synthesis in Circadian Control of Cell Cycle. PLoS Comput. Biol. 2015, 11, e1004086. [Google Scholar] [CrossRef] [Green Version]
  17. Pan, X.; Mota, S.; Zhang, B. Circadian clock regulation on lipid metabolism and metabolic diseases. In Lipid Transfer in Lipoprotein Metabolism and Cardiovascular Disease; Springer: Gateway East, Singapore, 2020; pp. 53–66. [Google Scholar]
  18. Chaix, A.; Lin, T.; Le, H.D.; Chang, M.W.; Panda, S. Time-Restricted Feeding Prevents Obesity and Metabolic Syndrome in Mice Lacking a Circadian Clock. Cell Metab. 2019, 29, 303–319.e4. [Google Scholar] [CrossRef]
  19. Mellor, J. The molecular basis of metabolic cycles and their relationship to circadian rhythms. Nat. Struct. Mol. Biol. 2016, 23, 1035–1044. [Google Scholar] [CrossRef]
  20. Wada, T.; Yamamoto, Y.; Takasugi, Y.; Ishii, H.; Uchiyama, T.; Saitoh, K.; Suzuki, M.; Uchiyama, M.; Yoshitane, H.; Fukada, Y.; et al. Adiponectin regulates the circadian rhythm of glucose and lipid metabolism. J. Endocrinol. 2022, 254, 121–133. [Google Scholar] [CrossRef]
  21. Yuan, P.; Yang, T.; Mu, J.; Zhao, J.; Yang, Y.; Yan, Z.; Hou, Y.; Chen, C.; Xing, J.; Zhang, H.; et al. Circadian clock gene NPAS2 promotes reprogramming of glucose metabolism in hepatocellular carcinoma cells. Cancer Lett. 2020, 469, 498–509. [Google Scholar] [CrossRef]
  22. Hemmer, A.; Mareschal, J.; Dibner, C.; Pralong, J.A.; Dorribo, V.; Perrig, S.; Genton, L.; Pichard, C.; Collet, T.-H. The Effects of Shift Work on Cardio-Metabolic Diseases and Eating Patterns. Nutrients 2021, 13, 4178. [Google Scholar] [CrossRef]
  23. Marjot, T.; Ray, D.W.; Williams, F.R.; Tomlinson, J.W.; Armstrong, M.J. Sleep and liver disease: A bidirectional relationship. Lancet Gastroenterol. Hepatol. 2021, 6, 850–863. [Google Scholar] [CrossRef]
  24. McDonald, R.J.; Zelinski, E.L.; Keeley, R.J.; Sutherland, D.; Fehr, L.; Hong, N.S. Multiple effects of circadian dysfunction induced by photoperiod shifts: Alterations in context memory and food metabolism in the same subjects. Physiol. Behav. 2013, 118, 14–24. [Google Scholar] [CrossRef]
  25. Sahar, S.; Sassone-Corsi, P. Regulation of metabolism: The circadian clock dictates the time. Trends Endocrinol. Metab. 2012, 23, 1–8. [Google Scholar] [CrossRef] [Green Version]
  26. Jorgensen, P.; Tyers, M. How Cells Coordinate Growth and Division. Curr. Biol. 2004, 14, R1014–R1027. [Google Scholar] [CrossRef] [Green Version]
  27. Tu, B.P.; Kudlicki, A.; Rowicka, M.; McKnight, S.L. Logic of the Yeast Metabolic Cycle: Temporal Compartmentalization of Cellular Processes. Science 2005, 310, 1152–1158. [Google Scholar] [CrossRef] [PubMed] [Green Version]
  28. Cai, L.; Sutter, B.M.; Li, B.; Tu, B.P. Acetyl-CoA induces cell growth and proliferation by promoting the acetylation of histones at growth genes. Mol. Cell 2011, 42, 426–437. [Google Scholar] [CrossRef] [PubMed] [Green Version]
  29. Rigaud, V.O.C.; Hoy, R.; Mohsin, S.; Khan, M. Stem Cell Metabolism: Powering Cell-Based Therapeutics. Cells 2020, 9, 2490. [Google Scholar] [CrossRef] [PubMed]
  30. Zhu, J.; Thompson, C.B. Metabolic regulation of cell growth and proliferation. Nat. Rev. Mol. Cell Biol. 2019, 20, 436–450. [Google Scholar] [CrossRef]
  31. Owusu-Ansah, E.; Yavari, A.; Mandal, S.; Banerjee, U. Distinct mitochondrial retrograde signals control the G1-S cell cycle checkpoint. Nat. Genet. 2008, 40, 356–361. [Google Scholar] [CrossRef]
  32. Agathocleous, M.; Harris, W.A. Metabolism in physiological cell proliferation and differentiation. Trends Cell Biol. 2013, 23, 484–492. [Google Scholar] [CrossRef] [PubMed]
  33. Moncada, S.; Higgs, E.A.; Colombo, S.L. Fulfilling the metabolic requirements for cell proliferation. Biochem. J. 2012, 446, 1–7. [Google Scholar] [CrossRef] [Green Version]
  34. Tao, H.; Li, X.; Qiu, J.-F.; Cui, W.-Z.; Sima, Y.-H.; Xu, S.-Q. Inhibition of expression of the circadian clock gene Period causes metabolic abnormalities including repression of glycometabolism in Bombyx mori cells. Sci. Rep. 2017, 7, 46258. [Google Scholar] [CrossRef] [Green Version]
  35. Manoogian, E.N.C.; Chow, L.S.; Taub, P.R.; Laferrère, B.; Panda, S. Time-restricted Eating for the Prevention and Management of Metabolic Diseases. Endocr. Rev. 2022, 43, 405–436. [Google Scholar] [CrossRef] [PubMed]
  36. Neves, A.R.; Albuquerque, T.; Quintela, T.; Costa, D. Circadian rhythm and disease: Relationship, new insights, and future perspectives. J. Cell. Physiol. 2022, 237, 3239–3256. [Google Scholar] [CrossRef] [PubMed]
  37. Steele, T.A.; Louis, E.K.; Videnovic, A.; Auger, R.R. Circadian rhythm sleep-wake disorders: A contemporary review of neurobiology, treatment, and dysregulation in neurodegenerative disease. Neurotherapeutics 2021, 18, 53–74. [Google Scholar] [CrossRef]
  38. Yin, Z.; Klionsky, D.J. Intermittent time-restricted feeding promotes longevity through circadian autophagy. Autophagy 2022, 18, 471–472. [Google Scholar] [CrossRef] [PubMed]
  39. Froy, O. Circadian aspects of energy metabolism and aging. Ageing Res. Rev. 2013, 12, 931–940. [Google Scholar] [CrossRef]
  40. Tevy, M.F.; Giebultowicz, J.; Pincus, Z.; Mazzoccoli, G.; Vinciguerra, M. Aging signaling pathways and circadian clock-dependent metabolic derangements. Trends Endocrinol. Metab. 2013, 24, 229–237. [Google Scholar] [CrossRef] [Green Version]
  41. El Cheikh, R.; Bernard, S.; El Khatib, N. Modeling circadian clock–cell cycle interaction effects on cell population growth rates. J. Theor. Biol. 2014, 363, 318–331. [Google Scholar] [CrossRef] [Green Version]
  42. Lu, C.; Yang, Y.; Zhao, R.; Hua, B.; Bingxuan, H.; Xu, C.; Yan, Z.; Sun, N.; Qian, R. Role of circadian gene Clock during differentiation of mouse pluripotent stem cells. Protein Cell 2016, 7, 820–832. [Google Scholar] [CrossRef] [Green Version]
  43. Qiu, J.-F.; Li, X.; Cui, W.-Z.; Liu, X.-F.; Tao, H.; Yang, K.; Dai, T.-M.; Sima, Y.-H.; Xu, S.-Q. Inhibition of Period Gene Expression Causes Repression of Cell Cycle Progression and Cell Growth in the Bombyx mori Cells. Front. Physiol. 2019, 10, 537. [Google Scholar] [CrossRef] [PubMed]
  44. Crosby, P.; Partch, C.L. New insights into non-transcriptional regulation of mammalian core clock proteins. J. Cell Sci. 2020, 133, jcs241174. [Google Scholar] [CrossRef] [PubMed]
  45. Lee, K.-H.; Kim, S.-H.; Kim, H.-J.; Kim, W.; Lee, H.-R.; Jung, Y.; Choi, J.-H.; Hong, K.Y.; Jang, S.K.; Kim, K.-T. AUF1 contributes to Cryptochrome1 mRNA degradation and rhythmic translation. Nucleic Acids Res. 2014, 42, 3590–3606. [Google Scholar] [CrossRef]
  46. Lim, I.; Jung, Y.; Kim, D.-Y.; Kim, K.-T. HnRNP Q Has a Suppressive Role in the Translation of Mouse Cryptochrome1. PLoS ONE 2016, 11, e0159018. [Google Scholar] [CrossRef] [PubMed]
  47. Ikeda, K.; Daimon, T.; Sezutsu, H.; Udaka, H.; Numata, H. Involvement of the Clock Gene period in the Circadian Rhythm of the Silkmoth Bombyx mori. J. Biol. Rhythm. 2019, 34, 283–292. [Google Scholar] [CrossRef]
  48. Cui, W.-Z.; Qiu, J.-F.; Dai, T.-M.; Chen, Z.; Li, J.-L.; Liu, K.; Wang, Y.-J.; Sima, Y.-H.; Xu, S.-Q. Circadian Clock Gene Period Contributes to Diapause via GABAeric-Diapause Hormone Pathway in Bombyx mori. Biology 2021, 10, 842. [Google Scholar] [CrossRef]
  49. Nartey, M.A.; Sun, X.; Qin, S.; Hou, C.X.; Li, M.W. CRISPR/Cas9-based knockout reveals that the clock gene timeless is indispensable for regulating circadian behavioral rhythms in Bombyx mori. Insect Sci. 2021, 28, 1414–1425. [Google Scholar] [CrossRef]
  50. Qiu, J.-F.; Cui, W.-Z.; Zhang, Q.; Dai, T.-M.; Liu, K.; Li, J.-L.; Wang, Y.-J.; Sima, Y.-H.; Xu, S.-Q. Temporal transcriptome reveals that circadian clock is involved in the dynamic regulation of immune response to bacterial infection in Bombyx mori. Insect Sci. 2023, 30, 31–46. [Google Scholar] [CrossRef]
  51. Qiu, J.-F.; Dai, T.-M.; Luo, C.; Cui, W.-Z.; Liu, K.; Li, J.-L.; Sima, Y.-H.; Xu, S.-Q. Circadian clock regulates developmental time through ecdysone and juvenile hormones in Bombyx mori. Insect Mol. Biol. 2023. [Google Scholar] [CrossRef]
  52. Zhang, Y.; Markert, M.J.; Groves, S.C.; Hardin, P.E.; Merlin, C. Vertebrate-like CRYPTOCHROME 2 from monarch regulates circadian transcription via independent repression of CLOCK and BMAL1 activity. Proc. Natl. Acad. Sci. USA 2017, 114, E7516–E7525. [Google Scholar] [CrossRef] [PubMed] [Green Version]
  53. Kitazawa, M. Circadian Rhythms, Metabolism, and Insulin Sensitivity: Transcriptional Networks in Animal Models. Curr. Diabetes Rep. 2013, 13, 223–228. [Google Scholar] [CrossRef] [PubMed]
  54. Guan, D.; Lazar, M.A. Interconnections between circadian clocks and metabolism. J. Clin. Investig. 2021, 131, e148278. [Google Scholar] [CrossRef]
  55. Zhang, E.E.; Liu, Y.; Dentin, R.; Pongsawakul, P.Y.; Liu, A.C.; Hirota, T.; Nusinow, D.A.; Sun, X.; Landais, S.; Kodama, Y.; et al. Cryptochrome mediates circadian regulation of cAMP signaling and hepatic gluco-neogenesis. Nat. Med. 2010, 16, 1152–1156. [Google Scholar] [CrossRef]
  56. Lamia, K.A.; Papp, S.J.; Yu, R.T.; Barish, G.D.; Uhlenhaut, N.H.; Jonker, J.W.; Downes, M.; Evans, R.M. Cryptochromes mediate rhythmic repression of the glucocorticoid receptor. Nature 2011, 480, 552–556. [Google Scholar] [CrossRef] [Green Version]
  57. Okano, S.; Akashi, M.; Hayasaka, K.; Nakajima, O. Unusual circadian locomotor activity and pathophysiology in mutant CRY1 transgenic mice. Neurosci. Lett. 2009, 451, 246–251. [Google Scholar] [CrossRef]
  58. Dupuis, J.; Langenberg, C.; Prokopenko, I.; Saxena, R.; Soranzo, N.; Jackson, A.U.; Wheeler, E.; Glazer, N.L.; Bouatia-Naji, N.; Gloyn, A.L.; et al. New genetic loci implicated in fasting glucose homeostasis and their impact on type 2 diabetes risk. Nat. Genet. 2010, 42, 105–116. [Google Scholar] [CrossRef]
  59. Doi, M.; Takahashi, Y.; Komatsu, R.; Yamazaki, F.; Yamada, H.; Haraguchi, S.; Emoto, N.; Okuno, Y.; Tsujimoto, G.; Kanematsu, A.; et al. Salt-sensitive hypertension in circadian clock–deficient Cry-null mice involves dysregulated adrenal Hsd3b6. Nat. Med. 2010, 16, 67–74. [Google Scholar] [CrossRef]
  60. Cal-Kayitmazbatir, S.; Kulkoyluoglu-Cotul, E.; Growe, J.; Selby, C.P.; Rhoades, S.D.; Malik, D.; Oner, H.; Asimgil, H.; Francey, L.J.; Sancar, A.; et al. CRY1-CBS binding regulates circadian clock function and metabolism. FEBS J. 2021, 288, 614–639. [Google Scholar] [CrossRef]
  61. Peek, C.B.; Levine, D.C.; Cedernaes, J.; Taguchi, A.; Kobayashi, Y.; Tsai, S.J.; Bonar, N.A.; McNulty, M.R.; Ramsey, K.M.; Bass, J. Circadian Clock Interaction with HIF1α Mediates Oxygenic Metabolism and Anaerobic Glycolysis in Skeletal Muscle. Cell Metab. 2017, 25, 86–92. [Google Scholar] [CrossRef] [Green Version]
  62. Lamia, K.A.; Sachdeva, U.M.; Di Tacchio, L.; Williams, E.C.; Alvarez, J.G.; Egan, D.F.; Vasquez, D.S.; Juguilon, H.; Panda, S.; Shaw, R.J.; et al. AMPK regulates the circadian clock by cryptochrome phosphorylation and degradation. Science 2009, 326, 437–440. [Google Scholar] [CrossRef] [PubMed] [Green Version]
  63. Onuma, S.; Kinoshita, S.; Shimba, S.; Ozono, K.; Michigami, T.; Kawai, M. The Lack of Bmal1, a Core Clock Gene, in the Intestine Decreases Glucose Absorption in Mice. Endocrinology 2022, 163, bqac119. [Google Scholar] [CrossRef]
  64. Barca-Mayo, O.; López, M. Astrocyte Clocks and Glucose Homeostasis. Front. Endocrinol. 2021, 12, 662017. [Google Scholar] [CrossRef] [PubMed]
  65. Kohsaka, A.; Das, P.; Hashimoto, I.; Nakao, T.; Deguchi, Y.; Gouraud, S.S.; Waki, H.; Muragaki, Y.; Maeda, M. The Circadian Clock Maintains Cardiac Function by Regulating Mitochondrial Metabolism in Mice. PLoS ONE 2014, 9, e112811. [Google Scholar] [CrossRef] [PubMed] [Green Version]
  66. Ma, X.; Zhou, Z.; Chen, Y.; Wu, Y.; Liu, Y. RBP4 functions as a hepatokine in the regulation of glucose metabolism by the circadian clock in mice. Diabetologia 2016, 59, 354–362. [Google Scholar] [CrossRef] [Green Version]
  67. Neufeld-Cohen, A.; Robles, M.S.; Aviram, R.; Manella, G.; Adamovich, Y.; Ladeuix, B.; Nir, D.; Rousso-Noori, L.; Kuperman, Y.; Golik, M.; et al. Circadian control of oscillations in mitochondrial rate-limiting enzymes and nutrient utilization by PERIOD proteins. Proc. Natl. Acad. Sci. USA 2016, 113, E1673–E1682. [Google Scholar] [CrossRef] [PubMed] [Green Version]
  68. Farshadi, E.; van der Horst, G.T.J.; Chaves, I. Molecular Links between the Circadian Clock and the Cell Cycle. J. Mol. Biol. 2020, 432, 3515–3524. [Google Scholar] [CrossRef]
  69. Qu, M.; Zhang, G.; Qu, H.; Vu, A.; Wu, R.; Tsukamoto, H.; Jia, Z.; Huang, W.; Lenz, H.J.; Rich, J.N.; et al. Circadian regulator BMAL1::CLOCK promotes cell proliferation in hepatocellular carcinoma by controlling apoptosis and cell cycle. Proc. Natl. Acad. Sci. USA 2023, 120, e2214829120. [Google Scholar] [CrossRef]
  70. Wang, Z.; Su, G.; Dai, Z.; Meng, M.; Zhang, H.; Fan, F.; Liu, Z.; Zhang, L.; Weygant, N.; He, F.; et al. Circadian clock genes promote glioma progression by affecting tumour immune infiltration and tumour cell proliferation. Cell Prolif. 2021, 54, e12988. [Google Scholar] [CrossRef]
  71. Miller, B.H.; McDearmon, E.L.; Panda, S.; Hayes, K.R.; Zhang, J.; Andrews, J.L.; Antoch, M.P.; Walker, J.R.; Esser, K.A.; Hogenesch, J.B.; et al. Circadian and CLOCK-controlled regulation of the mouse transcriptome and cell proliferation. Proc. Natl. Acad. Sci. USA 2007, 104, 3342–3347. [Google Scholar] [CrossRef] [Green Version]
  72. Stokes, K.; Nunes, M.; Trombley, C.; Flôres, D.E.F.L.; Wu, G.; Taleb, Z.; Alkhateeb, A.; Banskota, S.; Harris, C.; Love, O.P.; et al. The Circadian Clock Gene, Bmal1, Regulates Intestinal Stem Cell Signaling and Represses Tumor Initiation. Cell. Mol. Gastroenterol. Hepatol. 2021, 12, 1847–1872.e0. [Google Scholar] [CrossRef]
  73. Fu, L.; Pelicano, H.; Liu, J.; Huang, P.; Lee, C.C. The circadian gene period2 plays an important role in tumor suppression and DNA damage response in vivo. Cell 2002, 111, 41–50. [Google Scholar] [CrossRef] [Green Version]
  74. Yang, W.S.; Stockwell, B.R. Inhibition of casein kinase 1-epsilon induces cancer-cell-selective, PERIOD2-dependent growth arrest. Genome Biol. 2008, 9, R92. [Google Scholar] [CrossRef] [Green Version]
  75. Rosbash, M.; Takahashi, J.S. Circadian rhythms: The cancer connection. Nature 2002, 420, 373–374. [Google Scholar] [CrossRef]
  76. Shostak, A.; Ruppert, B.; Ha, N.; Bruns, P.; Toprak, U.H.; Lawerenz, C.; Lichter, P.; Radlwimmer, B.; Eils, J.; Brors, B.; et al. MYC/MIZ1-dependent gene repression inversely coordinates the circadian clock with cell cycle and proliferation. Nat. Commun. 2016, 7, 11807. [Google Scholar] [CrossRef] [Green Version]
  77. Neufeld, T.P.; de la Cruz, A.F.A.; Johnston, L.A.; Edgar, B.A. Coordination of Growth and Cell Division in the Drosophila Wing. Cell 1998, 93, 1183–1193. [Google Scholar] [CrossRef] [Green Version]
  78. Harris, W.A.; Hartenstein, V. Neuronal determination without cell division in xenopus embryos. Neuron 1991, 6, 499–515. [Google Scholar] [CrossRef] [PubMed]
  79. Lunt, S.Y.; Vander Heiden, M.G. Aerobic Glycolysis: Meeting the Metabolic Requirements of Cell Proliferation. Annu. Rev. Cell Dev. Biol. 2011, 27, 441–464. [Google Scholar] [CrossRef] [PubMed] [Green Version]
  80. Ward, P.S.; Thompson, C.B. Metabolic Reprogramming: A Cancer Hallmark Even Warburg Did Not Anticipate. Cancer Cell 2012, 21, 297–308. [Google Scholar] [CrossRef] [Green Version]
  81. DeBerardinis, R.J.; Lum, J.J.; Hatzivassiliou, G.; Thompson, C.B. The Biology of Cancer: Metabolic Reprogramming Fuels Cell Growth and Proliferation. Cell Metab. 2008, 7, 11–20. [Google Scholar] [CrossRef] [PubMed] [Green Version]
  82. Mihaylova, M.M.; Shaw, R.J. The AMPK signalling pathway coordinates cell growth, autophagy and metabolism. Nat. Cell Biol. 2011, 13, 1016–1023. [Google Scholar] [CrossRef] [PubMed]
  83. Lin, G.; Lin, L.; Lin, H.; Chen, W.; Chen, L.; Chen, X.; Chen, S.; Lin, Q.; Xu, Y.; Zeng, Y. KCNK3 inhibits proliferation and glucose metabolism of lung adenocarcinoma via activation of AMPK-TXNIP pathway. Cell Death Discov. 2022, 8, 360. [Google Scholar] [CrossRef] [PubMed]
  84. Cai, S.L.; Fan, X.G.; Wu, J.; Wang, Y.; Hu, X.W.; Pei, S.Y.; Zheng, Y.X.; Chen, J.; Huang, Y.; Li, N.; et al. CB2R agonist GW405833 alleviates acute liver failure in mice via inhibiting HIF-1α-mediated reprogramming of glycometabolism and macrophage proliferation. Acta Pharmacol. Sin 2023. [Google Scholar] [CrossRef]
  85. Zhang, Y.; Mou, Y.; Liang, C.; Zhu, S.; Liu, S.; Shao, P.; Li, J.; Wang, Z. Promoting cell proliferation, cell cycle progression, and glycolysis: Glycometabolism-related genes act as prognostic signatures for prostate cancer. Prostate 2021, 81, 157–169. [Google Scholar] [CrossRef] [PubMed]
  86. Matsumura, R.; Tsuchiya, Y.; Tokuda, I.; Matsuo, T.; Sato, M.; Node, K.; Nishida, E.; Akashi, M. The Mammalian Circadian Clock Protein Period Counteracts Cryptochrome in Phosphorylation Dynamics of Circadian Locomotor Output Cycles Kaput (CLOCK). J. Biol. Chem. 2014, 289, 32064–32072. [Google Scholar] [CrossRef] [PubMed] [Green Version]
  87. Mahesh, G.; Jeong, E.; Ng, F.S.; Liu, Y.; Gunawardhana, K.; Houl, J.H.; Yildirim, E.; Amunugama, R.; Jones, R.; Allen, D.L.; et al. Phosphorylation of the Transcription Activator CLOCK Regulates Progression through a ~24-h Feedback Loop to Influence the Circadian Period in Drosophila. J. Biol. Chem. 2014, 289, 19681–19693. [Google Scholar] [CrossRef] [PubMed] [Green Version]
  88. Ye, R.; Selby, C.P.; Chiou, Y.-Y.; Ozkan-Dagliyan, I.; Gaddameedhi, S.; Sancar, A. Dual modes of CLOCK:BMAL1 inhibition mediated by Cryptochrome and Period proteins in the mammalian circadian clock. Genes Dev. 2014, 28, 1989–1998. [Google Scholar] [CrossRef] [PubMed] [Green Version]
  89. Bae, K.; Jin, X.; Maywood, E.S.; Hastings, M.H.; Reppert, S.M.; Weaver, D.R. Differential functions of mPer1, mPer2, and mPer3 in the SCN circadian clock. Neuron 2001, 30, 525–536. [Google Scholar] [CrossRef] [Green Version]
  90. Zheng, B.; Albrecht, U.; Kaasik, K.; Sage, M.; Lu, W.; Vaishnav, S.; Li, Q.; Sun, Z.S.; Eichele, G.; Bradley, A.; et al. Non-redundant roles of the mPer1 and mPer2 genes in the mammalian circadian clock. Cell 2001, 105, 683–694. [Google Scholar] [CrossRef] [PubMed] [Green Version]
  91. Kaasik, K.; Lee, C.C. Reciprocal regulation of haem biosynthesis and the circadian clock in mammals. Nature 2004, 430, 467–471. [Google Scholar] [CrossRef]
  92. Akashi, M.; Okamoto, A.; Tsuchiya, Y.; Todo, T.; Nishida, E.; Node, K. A Positive Role for PERIOD in Mammalian Circadian Gene Expression. Cell Rep. 2014, 7, 1056–1064. [Google Scholar] [CrossRef] [PubMed] [Green Version]
  93. Richards, J.; All, S.; Skopis, G.; Cheng, K.-Y.; Compton, B.; Srialluri, N.; Stow, L.; Jeffers, L.A.; Gumz, M.L. Opposing actions of Per1 and Cry2 in the regulation of Per1 target gene expression in the liver and kidney. Am. J. Physiol. Regul. Integr. Comp. Physiol. 2013, 305, R735–R747. [Google Scholar] [CrossRef] [PubMed] [Green Version]
  94. Sellick, C.A.; Hansen, R.; Stephens, G.M.; Goodacre, R.; Dickson, A.J. Metabolite extraction from suspension-cultured mammalian cells for global metabolite profiling. Nat. Protoc. 2011, 6, 1241–1249. [Google Scholar] [CrossRef] [PubMed]
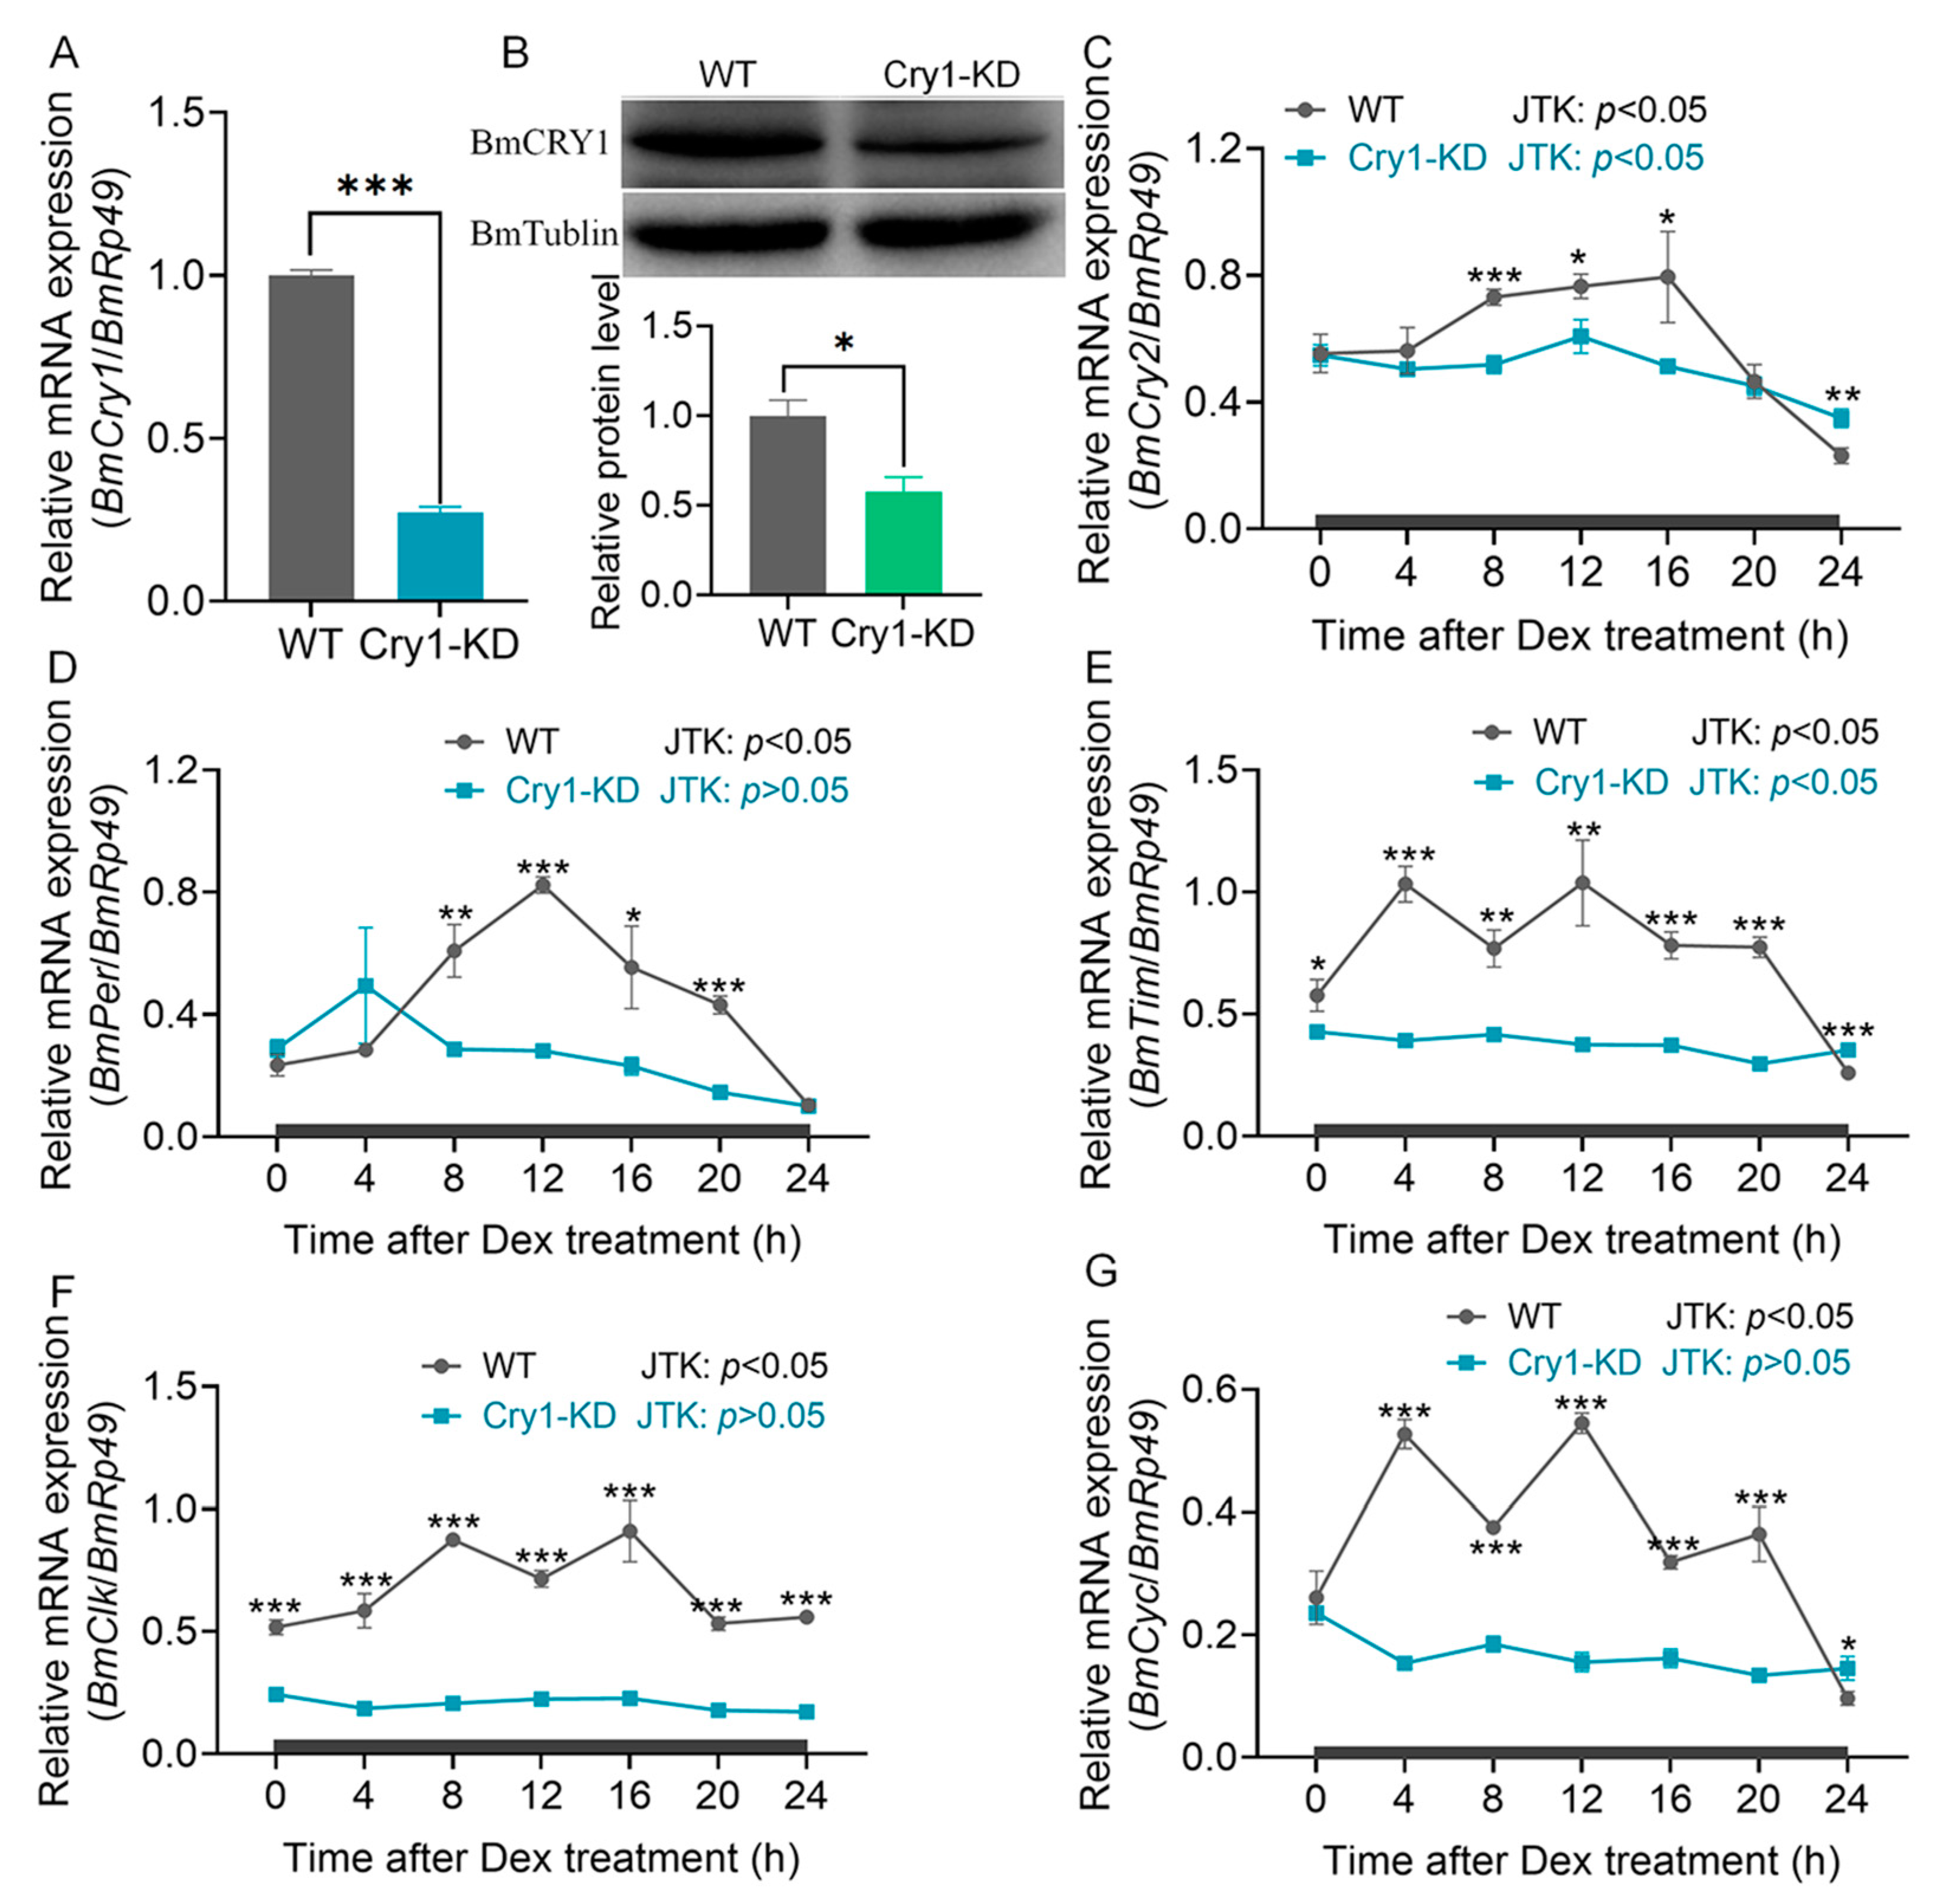
Figure 1. BmCry1 knockdown efficiency and clock gene expression. (A) BmCry1 transcripts were analyzed by qRT-PCR with BmRp49 as the internal control (n = 3). (B) BmCRY1 protein levels with BmTUBLIN protein as the internal control (n = 2). (CG) Transcripts of the five clock genes were analyzed with qRT-PCR using BmRp49 as the internal control (n = 3). Cry1-KD and WT cells were cultured at 26 °C in DD. The cells were treated with 100 μM dexamethasone (DEX) for 2 h, and the transcripts of these genes were investigated. Samples were analyzed at 4 h intervals for 24 h. JTK: p < 0.05 indicated that the gene expression had a 24- h circadian rhythm, JTK: p > 0.05 indicated no 24 h circadian rhythm in gene expression. The black lines indicate constant darkness. WT, wild-type cells; Cry1-KD, BmCry1 knockdown cells. *, p ≤ 0.05; **, p ≤ 0.01; ***, p ≤ 0.001.
Ijms 24 05435 g001
Figure 2. Effect of knockdown BmCry1 on cell growth. (A) Cell growth velocity was measured using the MTT method (n = 3). (B) Cell nuclei diameters differ between Cry1-KD cells and WT cells. When the cell fusion degree in cell vials reached 70%, cells were seeded on coverslips. DAPI staining was performed on the cells after adherence (at least 12 h) and the diameters of the nuclei were measured. cell nuclei diameters were quantified by analyzing cells in five randomly selected fields on a coverslip (n = 3). (C) BmCRY1 protein content in BmN and Cry1-KD cells was investigated by immunofluorescence. bar = 50 μm. (D) Cell nuclei stained with DAPI and cell membranes stained with Dil. bar = 50 μm. WT, wild-type cells; Cry1-KD, BmCry1 knockdown cells. ***, p ≤ 0.001.
Ijms 24 05435 g002
Figure 3. Differential metabolites based on LC-MS and GC-MS/MS metabolomics. (A) Principal component analysis; (B) volcano plot. The differential metabolites were screened out under the condition of fold change > 1.5 and FDR < 0.05; (C) heatmap of the top 50 differential metabolites. WT, wild-type cells; Cry1-KD, BmCry1 knockdown cells.
Ijms 24 05435 g003
Figure 4. The correlation network diagram of differential metabolites. The Pearson correlation coefficient was used for metabolite correlation analysis using the calculation method cor () function in the R language package www.r-project.org (accessed on 22 December 2022). The Pearson correlation coefficient threshold was set to 0.8. The red lines represent positive correlations between substances, and blue lines represent negative correlations between substances.
Ijms 24 05435 g004
Figure 5. KEGG-enrichment analysis of differential metabolites. The top 25 metabolic pathways with the most significant differences were selected. The size of the dot represents the number of enriched genes; the color of the dot represents the p value.
Ijms 24 05435 g005
Figure 6. Effect of BmCry1 knockdown on glucose metabolism in BmN cells. (A) Changes in the contents of main substrates and products associated with glucose metabolism are based on metabolomic measurements (n = 8). Black dots represent WT cells; black triangles represent BmCry1 knockdown cells. (B) Transcription levels of the main rate-limiting enzyme-encoding genes (n = 3). (C) Activities of the main rate-limiting enzymes (n = 3). (D) Glucose metabolic pathways were affected by BmCry1 knockdown. WT, wild-type cells; Cry1-KD, BmCry1 knockdown cells. HK, hexokinase; PFK, phosphofructokinase; PK, pyruvate kinase; +, increased content or enzymatic activity or downregulated transcription of coding gene; −, decreased content or enzyme activity or downregulated transcription of the coding gene. *, p ≤ 0.05; **, p ≤ 0.01; ***, p ≤ 0.001; ns, non-significant.
Ijms 24 05435 g006
Disclaimer/Publisher’s Note: The statements, opinions and data contained in all publications are solely those of the individual author(s) and contributor(s) and not of MDPI and/or the editor(s). MDPI and/or the editor(s) disclaim responsibility for any injury to people or property resulting from any ideas, methods, instructions or products referred to in the content.