Article

Systematic Selection Signature Analysis of Chinese Gamecocks Based on Genomic and Transcriptomic Data

National Engineering Laboratory for Animal Breeding, Department of Animal Genetics and Breeding, College of Animal Science and Technology, China Agricultural University, Beijing 100193, China
*
Author to whom correspondence should be addressed.
Int. J. Mol. Sci. 2023, 24(6), 5868; https://doi.org/10.3390/ijms24065868
Submission received: 15 December 2022 / Revised: 7 March 2023 / Accepted: 8 March 2023 / Published: 20 March 2023
(This article belongs to the Section Molecular Genetics and Genomics)

Abstract

:
Selection pressures driven by natural causes or human interference are key factors causing genome variants and signatures of selection in specific regions of the genome. Gamecocks were bred for cockfighting, presenting pea-combs, larger body sizes, stronger limbs, and higher levels of aggression than other chickens. In this study, we aimed to explore the genomic differences between Chinese gamecocks and commercial, indigenous, foreign, and cultivated breeds by detecting the regions or sites under natural or artificial selection using genome-wide association studies (GWAS), genome-wide selective sweeps based on the genetic differentiation index (FST), and transcriptome analyses. Ten genes were identified using GWAS and FST: gga-mir-6608-1, SOX5, DGKB, ISPD, IGF2BP1, AGMO, MEOX2, GIP, DLG5, and KCNMA1. The ten candidate genes were mainly associated with muscle and skeletal development, glucose metabolism, and the pea-comb phenotype. Enrichment analysis results showed that the differentially expressed genes between the Luxi (LX) gamecock and Rhode Island Red (RIR) chicken were mainly related to muscle development and neuroactive-related pathways. This study will help to understand the genetic basis and evolution of Chinese gamecocks and support the further use of gamecocks as an excellent breeding material from a genetic perspective.

1. Introduction

Human- or nature-driven selection during domestication and breed formation over time can leave signatures in specific regions of the genome, such as increased allele frequencies, extensive linkage disequilibrium, homozygous genotypes, and decreased local diversity [1,2,3,4] Chinese gamecocks were artificially selected owing to the popularity of ancient Chinese cockfighting around 2500 BC [5]. This practice resulted in some unique morphological, physiological, and behavioural signatures that differentiate Chinese gamecocks from other chickens, such as different shaped combs, a larger body size, stronger limbs, and more aggression [6]. Besides being used for entertainment, foreign gamecocks have also been used as genetic material for the breeding of commercial breeds such as the Cornish, a famous modern broiler breed. Chinese gamecocks have similar characteristics to foreign gamecocks; however, few studies have reported on the genetic basis of Chinese gamecocks, such as systematic selection signature analysis during evolution and breeding.
Identifying selection signatures associated with a phenotype will help reveal the processes that cause diversity among breeds. With the development of sequencing and genotyping technologies, different statistical tests have been conceptualised to detect selection signatures based on allele counts or allele frequencies. Genome-wide selective sweep analyses, including genome-wide association studies (GWAS) [7,8] and approaches based on the genetic differentiation index (FST) [7,9], have been widely utilised to identify variants and genomic regions under selection. High-throughput transcriptomic analysis, which involves RNA sequencing (RNA-seq), has also been widely used to discover transcriptomic differences in a variety of tissues related to important traits of chickens [10,11]. It is generally believed that most complex traits are regulated by a network of genes, each associated with minor effects and environmental factors. A combination of genome-wide and RNA-seq data would help elucidate the pathways associated with complex traits and underlying genetic determinants [12,13,14].
There are currently five Chinese gamecock breeds according to the geographical location, the Henan, Luxi, Turpan, Xishuangbanna, and Zhangzhou. Signature selection based on Xishuangbanna gamecocks showed that 413 candidate genes were found to be putatively under selection, and these genes were related to traits, such as growth, disease resistance, aggressive behaviour and energy metabolism, as well as the morphogenesis and homeostasis of many tissues and orggans [15]. Reports on signature selection of Luxi and Turpan gamecocks suggested that some candidate genes associated with the nervous system, aggressive behaviour, and muscular development, including AGMO, MEOX2, ISPD, BDNF, could be detected [9]. More comprehensive research on Chinese gamecocks is needed.
In the present study, 603 chickens, including 54 Chinese gamecocks, were genotyped using the 600 K SNP Affymetrix Axiom Chicken Genotyping Array. Transcriptome data from muscle, hypothalamus, and testis samples from four adult male Luxi (LX) gamecocks and three adult male Rhode Island Red (RIR) chickens were analysed. Differentially expressed genes (DEGs) were identified and were used for gene ontology (GO) and Kyoto Encyclopaedia of Genes and Genomes (KEGG) analyses. The elucidation of the selection signature will enhance our understanding of the evolution and genetic basis of Chinese gamecocks and may support the further use of Chinese gamecocks as excellent native breeding material from a genetic perspective.

2. Results

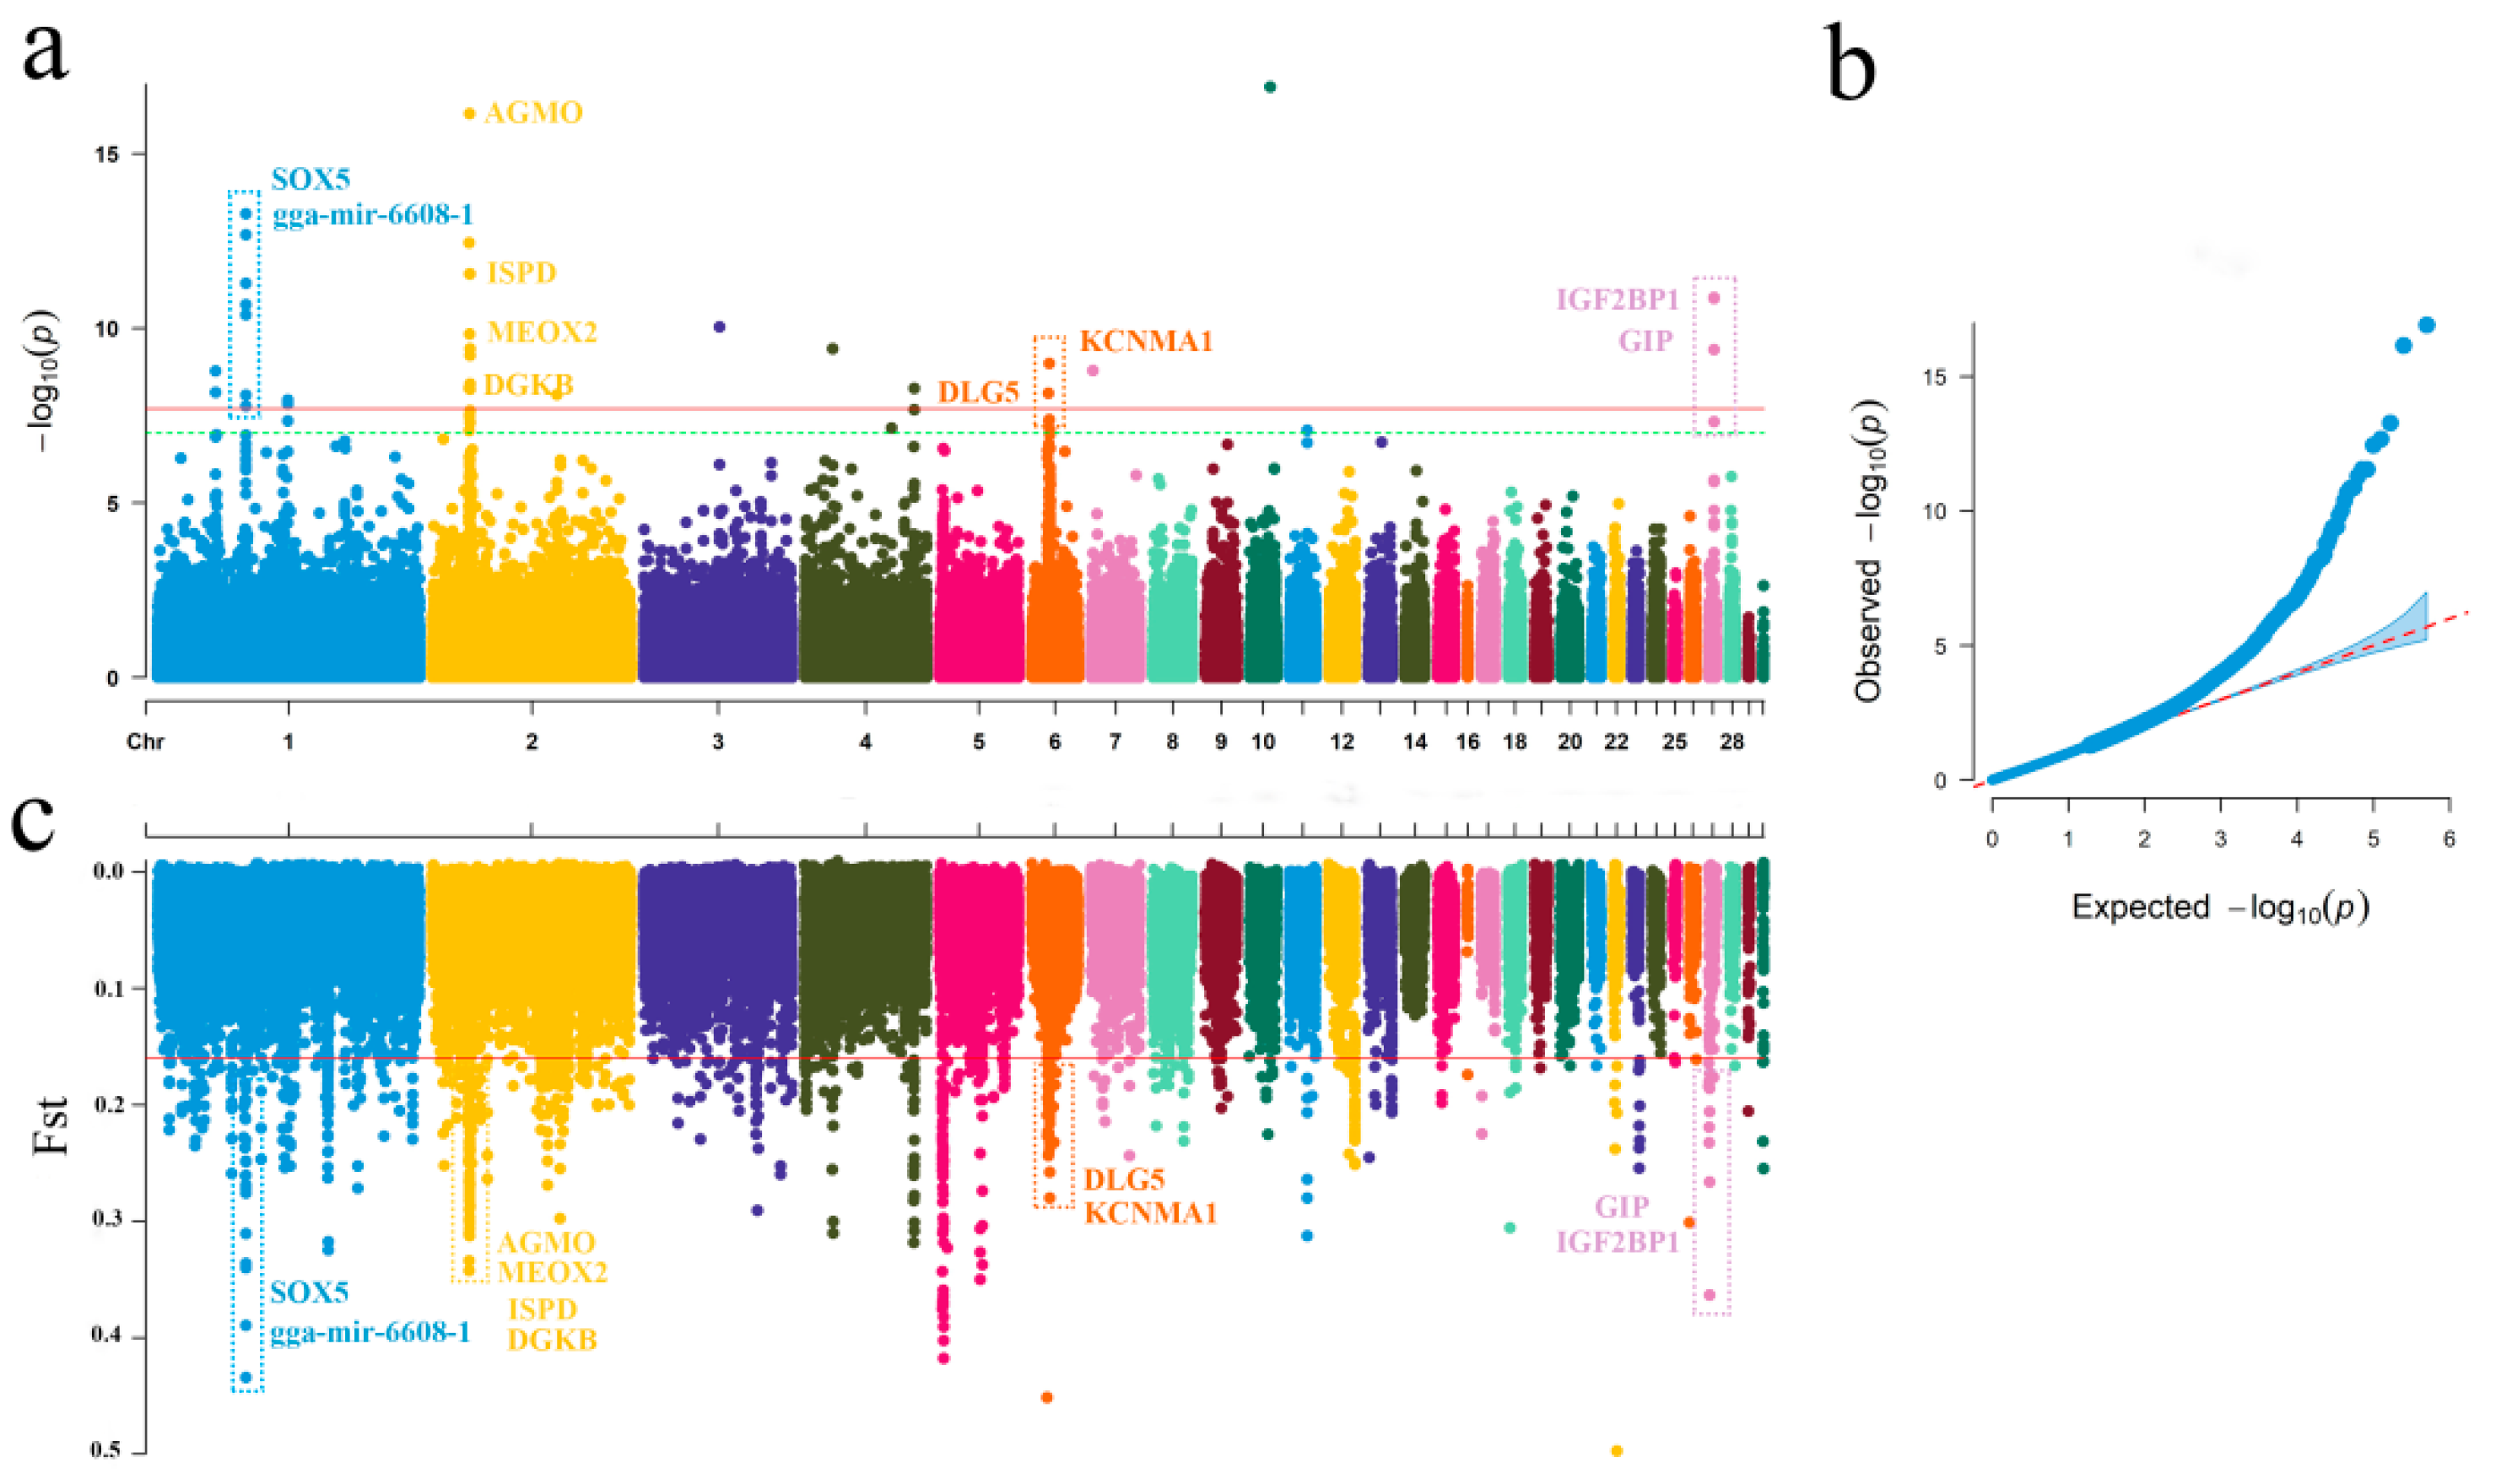
2.1. Genome-Wide Putatively Selective Signatures in Gamecocks

We performed GWAS analysis between five gamecock breeds and commercial, indigenous, foreign, and cultivated breeds. A total of 45 significant SNPs located on nine different chromosomes (1, 2, 3, 4, 6, 7, 10, 11, and 27) were identified, and 14 protein-coding candidate genes (gga-mir-6608-1, SOX5, DGKB, AGMO, MEOX2, ISPD, IGF2BP1, GIP, SNF8, UBE2Z, EYA4, DLC1, DLG5, and KCNMA1) were found in the regions 10 kb upstream and downstream of these SNPs (Table S1). The Manhattan and quantile-quantile (Q-Q) plots are shown in Figure 1a,b.
Using the top 1% Weir-FST value as the limit, signatures of selection were screened, and 126 genes were included (Table S2). Among these genes, ten genes (gga-mir-6608-1, SOX5, DGKB, ISPD, IGF2BP1, AGMO, MEOX2, GIP, DLG5, and KCNMA1) were selected using both approaches (Figure 1c).

2.2. Overview of the RNA Sequencing Data

After filtering, the percentage of clean reads for each duplicate was over 96%. More than 90% of the bases were accurately identified with an error rate of 0.1%. The mapped ratios were greater than 87.5% for each library when the data were aligned with the reference genome (GRCg6a). These results confirmed that the RNA sequencing data qualified for subsequent analyses.

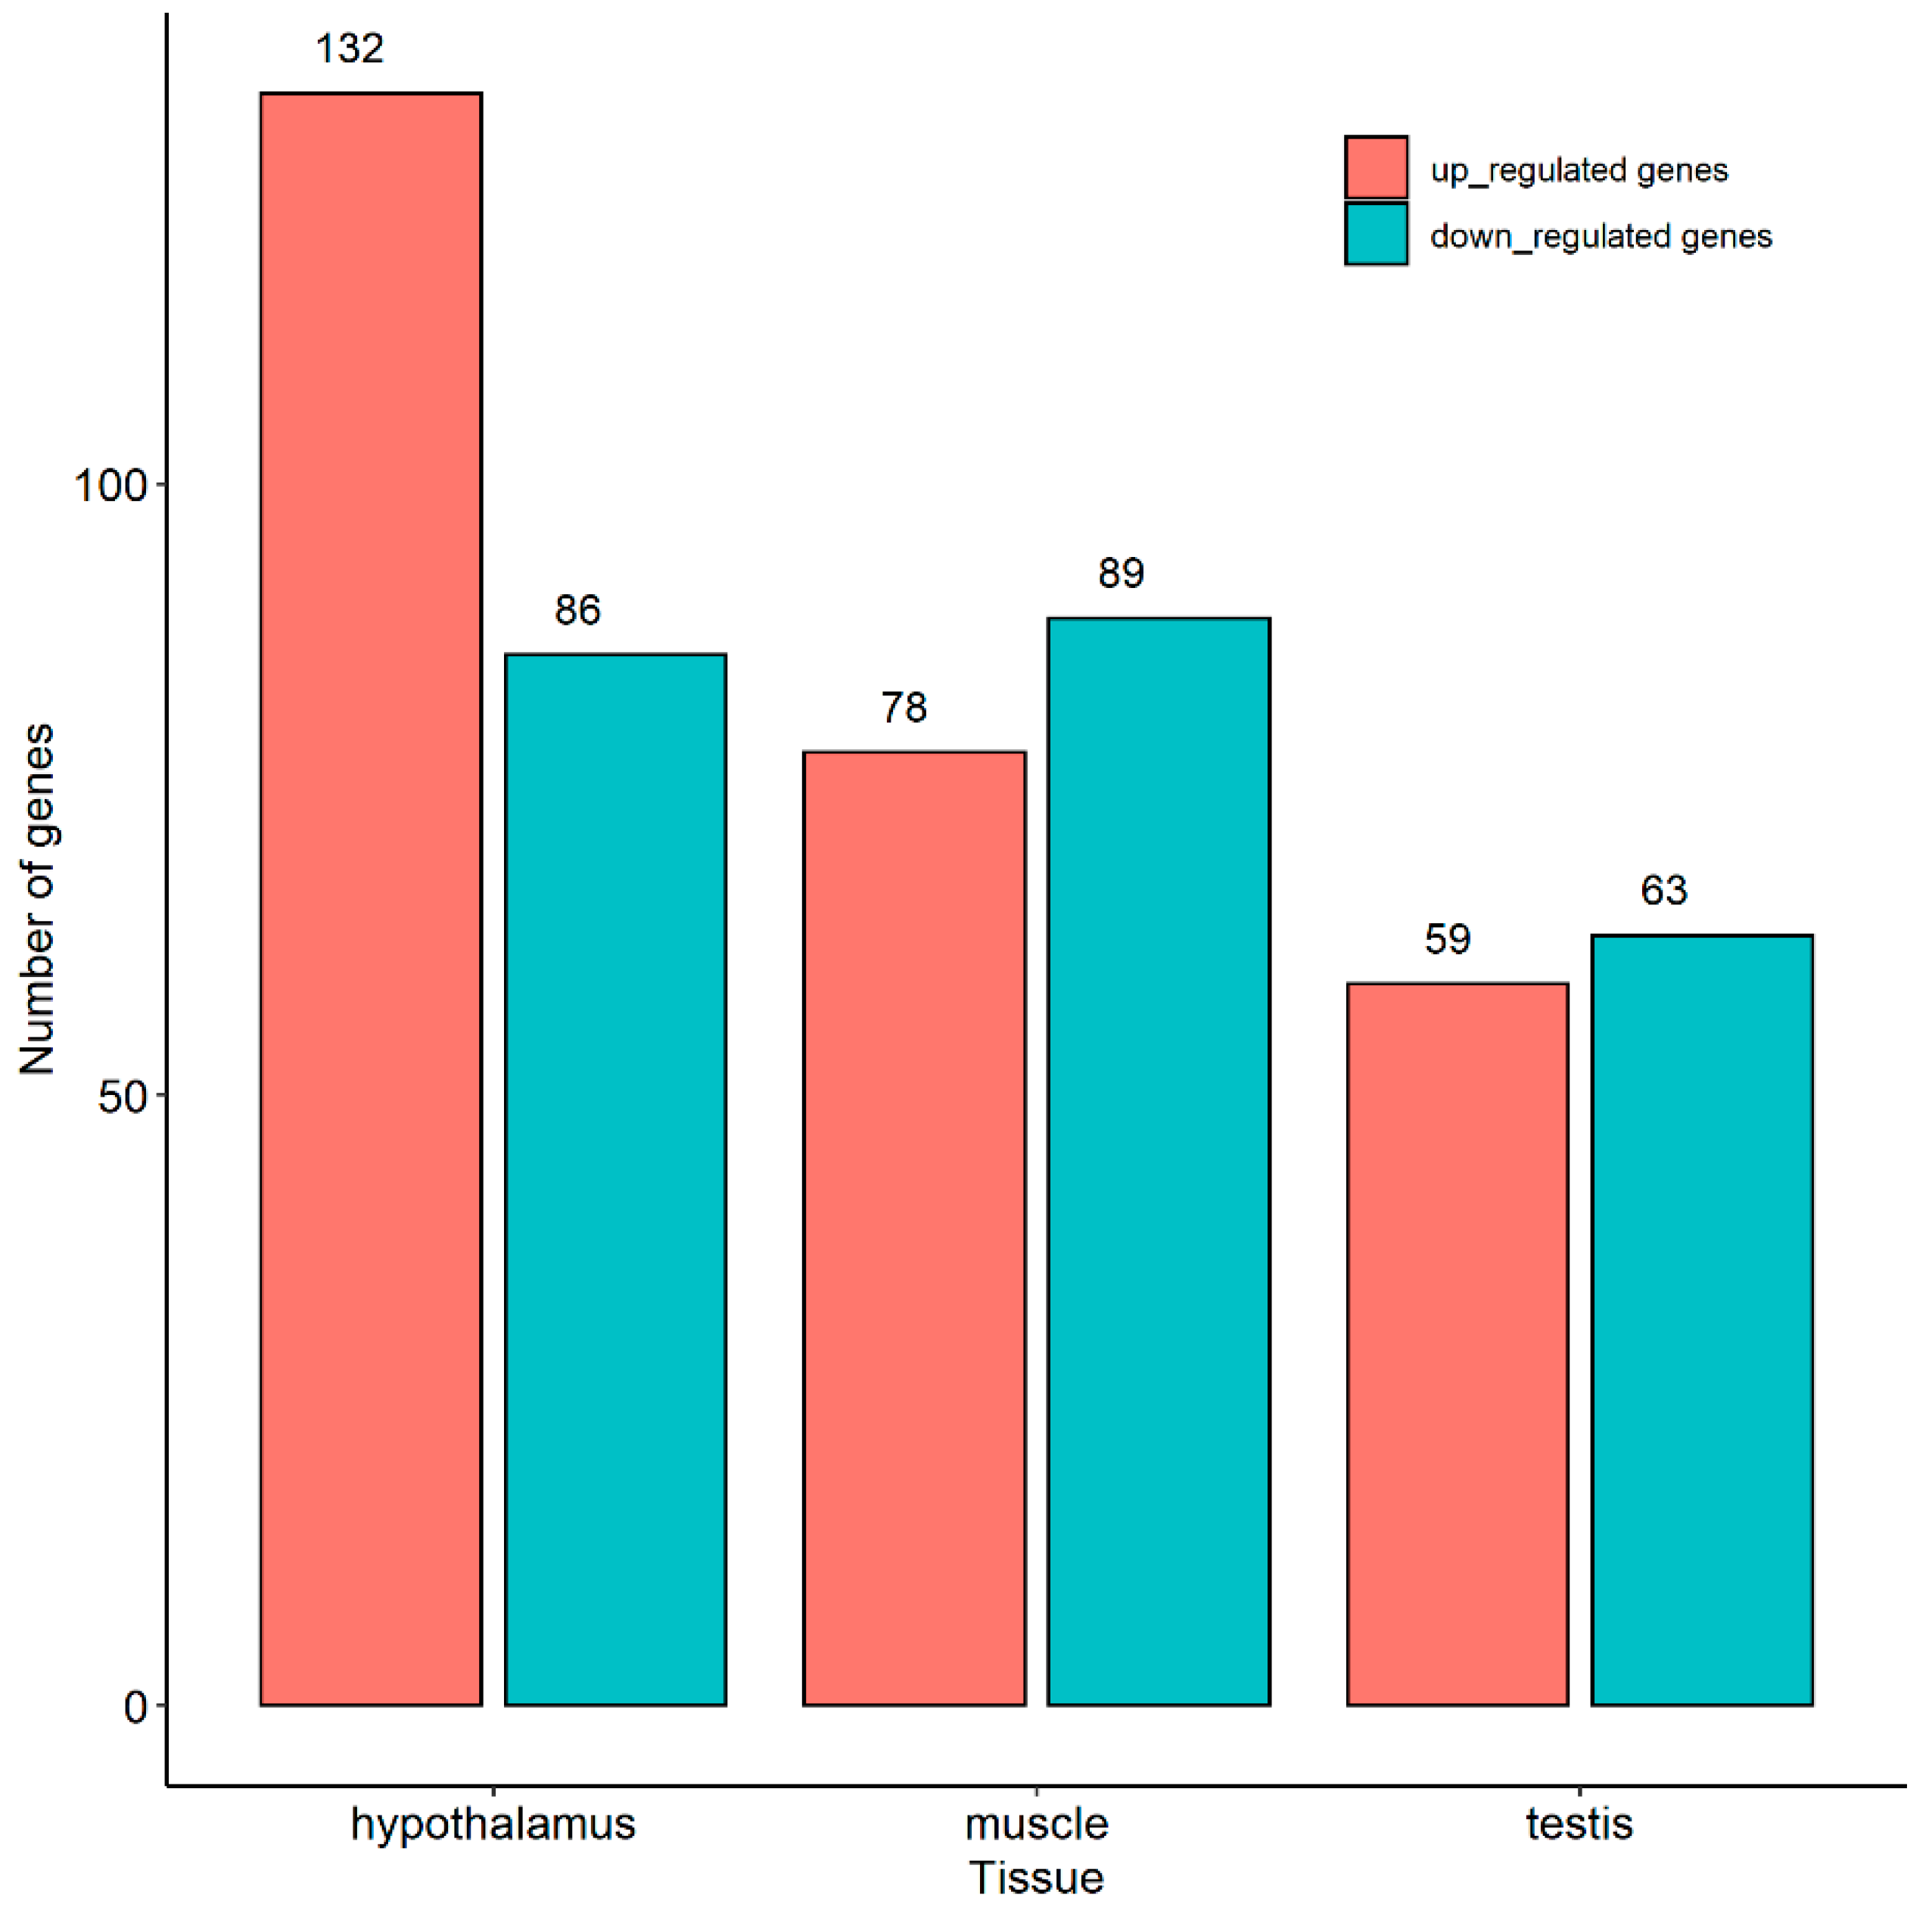
2.3. Identification of Differentially Expressed Genes

In total, 218, 167, and 122 DEGs were identified in the hypothalamus, muscle, and testis, respectively (Figure 2). Among these DEGs (Table S3), only DGKB and KCNMA1 in the testis overlapped with candidate genes detected via GWAS and FST analyses. To some extent, this reflected the correction of the selection signature analysis.

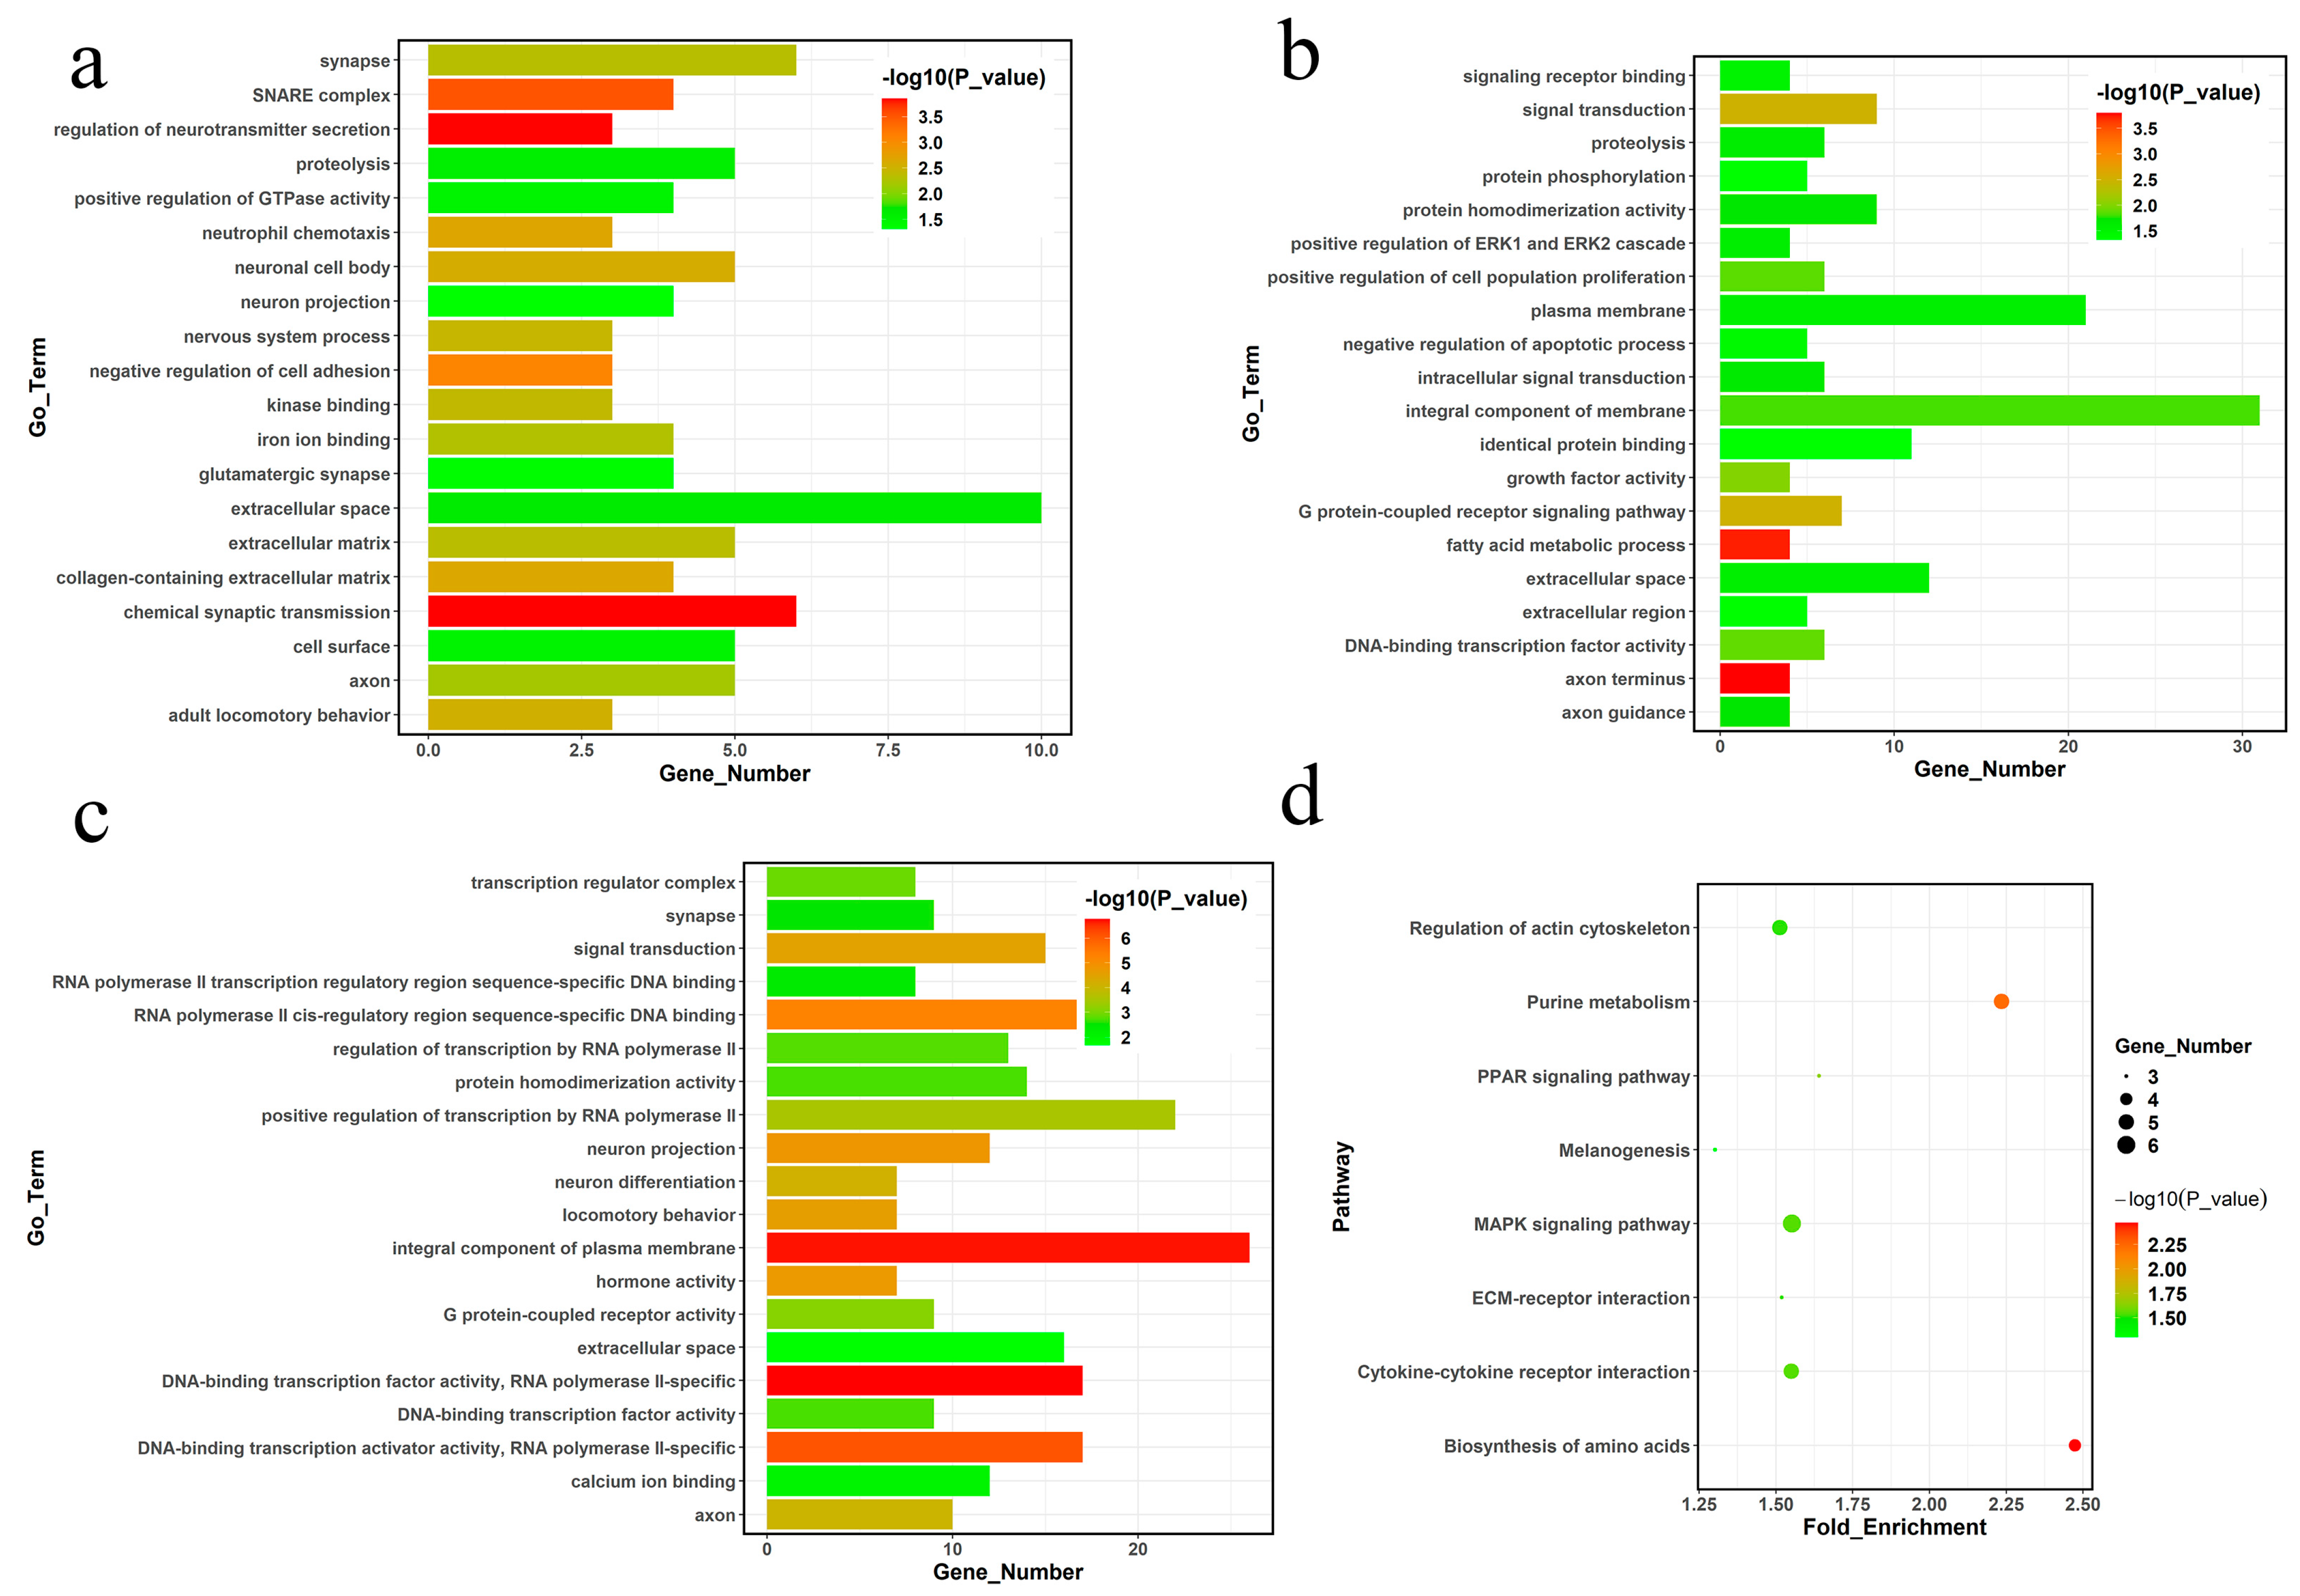
2.4. Functional Annotation of Differentially Expressed Genes

GO enrichment analysis was performed to explore the functions of DEGs. The top 20 significant (p < 0.05) GO terms of the three tissues are shown in Figure 3a–c. In total, 166 significant GO terms were retrieved from the hypothalamus, including the integral component of the plasma membrane term (GO:0005887) and RNA polymerase II-related terms (GO:0045944, GO:0000978, GO:0000981, GO:0001228, and GO:0006357). Ninety GO terms were enriched in the testis, particularly the extracellular space term (GO:0005615), chemical synaptic transmission (GO:0007268), and some neuro-related terms (GO:0043025, GO:0030424, GO:0043005, and GO:0050877). Seventy-four significant terms related to cellular components (GO:0016021, GO:0005886, and GO:0005615) and signal transduction (GO:0007165) were retrieved from muscle. Detailed information is shown in Table S4.
Twelve significant pathways (p < 0.05) were enriched in the muscles. Two significant (p < 0.05) pathways (neuroactive ligand-receptor interaction and taurine and hypotaurine metabolism) were enriched in the hypothalamus, and only the steroid hormone biosynthesis pathway was significantly (p < 0.05) enriched in the testis (Table S5). The top eight significant pathways of the DEGs in muscle are shown in Figure 3d. These significant pathways revealed that Chinese gamecocks are different from other chicken types, especially regarding muscle development and neuroactive-related perspectives.

3. Discussion

The influence of genome selection can be detected by identifying variants and selection signatures. GWASs have mainly been used to detect genetic variants associated with various traits and diseases [16,17], and the FST statistic has been widely applied for the detection of signatures of selection [18,19]. In this study, we used a GWAS and FST to identify variants and selection signatures between Chinese gamecocks and commercial, indigenous, and foreign chicken breeds. Ten genes were identified using two approaches. Among the 10 genes, except DLG5, which has been proposed to play a role in cell signalling and cytoskeleton maintenance [20], the other nine genes were directly or indirectly related to some characteristics of the Chinese gamecock.
A pea-comb is an adaptive trait that exists in almost all gamecocks. The small size of the comb reduces the chance of it being damaged or hurt during cockfighting. Copy number variation in intron 1 of SOX5 is thought to be the cause of the pea-comb phenotype in chickens [21].
Gamecocks were bred for cockfighting and thus possess stronger muscles and skeletons to support the running and jumping necessary for fighting. KCNMA1, MEOX2, ISPD, and MEOX2 are good candidates for muscle and skeletal development. KCNMA1 encodes large-conductance voltage and Ca2+-activated K+ channels that are fundamental to the control of smooth muscle tone and neuronal excitability [22,23,24]. MEOX2 and ISPD also play crucial roles in muscle and skeletal development [25,26,27]. IGF2BP1 is a well-known gene that plays an important role in the body size and weight of chickens and ducks [28,29]. In addition, the major regulators of skeletal muscle development [30] the mitogen-activated protein kinase (MAPK) signalling pathway, were enriched in the gamecock muscle.
Compared to other types of chickens, gamecocks suffer more damage due to their use in cockfighting. We, therefore, speculated that some immune-related genes remained in the gamecocks over time to help them recover quickly. The detection of AGMO, which has been reported to be associated with inflammation, proved our speculation in some way [31].
Large amounts of energy are essential for cockfighting, and glucose provides instantaneous and efficient energy for cellular metabolism. To this point, two genes identified in our study are thought to be associated with glucose metabolism, DGKB [32] and GIP, which maintain glucose homeostasis by encoding proteins [33].
In the hypothalamus, several terms were associated with RNA polymerase II-related functions. This suggests that additional mRNA was synthesised to provide sufficient protein for gamecocks, including different hormones, such as thyrotropin-releasing hormone and gonadotropin-releasing hormone. KEGG annotation suggested that neuroactive ligand-receptor interactions, as well as taurine and hypotaurine metabolism pathways, were enriched. The neuroactive ligand receptor interaction pathway includes all ligand receptors on the plasma membrane that are associated with intracellular and extracellular pathways, and previous research has shown its important role in stress responses [34,35,36,37]. The taurine and hypotaurine metabolic pathways are considered the major pathways of cysteine metabolism in astroglial cells [38]. Taurine is involved in the regulation of intracellular calcium concentrations [39] and plays cytoprotective and developmental roles, especially in neurological and ocular tissues [40]. Thus, we propose that the taurine and hypotaurine metabolism pathways contribute to the vision and sharper reflexes of the gamecock during cockfighting.
GO terms in the testis were mainly enriched for neuroactive-related functions. The KEGG analysis suggested that only the steroid hormone biosynthesis pathway was enriched. Testosterone is an important androgen that is produced via the steroid hormone biosynthesis pathway. The role of testosterone is mainly manifested in cognitive functions [41], muscle mass and power [42], and mood adjustments [43]. Therefore, these aspects may be closely related to the aggressive behaviour of gamecocks.

4. Materials and Methods

4.1. Sample Collection and SNP Genotyping

A total of 603 adult chickens, including gamecocks, were randomly selected from 20 chicken breeds. Detailed information on these samples is presented in Table 1.
A total of 86 blood samples were collected from the Big Bone, Chahua, Turpan Game, Zhangzhou Game, Xishuangbanna Game, Henan Game, Luxi Game, and Wenchang breeds and sent to Neogene Biotechnology Co., Ltd. (Shanghai, China) for 600 K microarray genotyping sequencing. Microarray data for the other 517 samples were collected in our laboratory. Genotyping was performed using the 600 K Affymetrix Axiom Chicken Genotyping Array (Affymetrix, Inc., Santa Clara, CA, USA), which included 580,961 SNPs across the entire chicken genome. After genotyping, a ped-and-map file was obtained. SNP filtering for each individual was performed using PLINK (version 1.90) [44]. After removing SNPs from the sex chromosome, autosomal SNPs were filtered if an individual’s SNP deletion rate was greater than 0.1 (using the “--mind” command), the SNP deletion rate of a single locus was greater than 0.1 (using the “--geno” command), and the minor allele frequency of SNP loci was less than 0.05 (using the “--maf” command). After quality control, information on 498,363 high-quality SNPs and 593 individuals, including 52 gamecocks, remained in binary files (bed, bim, and fam) for GWAS and FST analyses.

4.2. Genome-Wide Association Studies

In this study, on one hand, the comb shape of five gamecock breeds is pea-comb, the comb shape of Dongtao chicken and Taihe Silky chicken is strawberry comb, and the comb shape of the remaining thirteen breeds is single comb. On the other hand, gamecocks were domesticated for the special use of cockfighting activity and finally formed the independent breeds; thus, the aggression of gamecocks is generally agreed to be stronger than that of other chickens. Considering the differences between Chinese gamecocks and other chicken breeds are mainly reflected by qualitative characteristics, such as shape of the comb and aggression, we performed a case-control GWAS analysis. Five gamecock breeds were used as the experimental group, and all other individuals were used as the control group. Association analyses were performed using GEMMA software (version 0.98.1) [45,46] based on the linear mixed model (LMM) association algorithm. Considering that the validity of a GWAS can be affected by population stratification [47], a principal component analysis (PCA) was performed, and different numbers of principal components (PCs) were added as covariates to correct the results of the association analysis; however, the original inflation factor (λ = 0.952) was the best value compared with the added PCs. This might be because the linear mixed model effectively controlled population stratification. Thus, the original result that did not include PCs as covariates remained. The Manhattan and Q-Q plots for GWAS were generated using the CMplot package (https://github.com/YinLiLin/CMplot, accessed on 4 October 2022) in R. All p-values were adjusted for multiple testing using the Bonferroni method with alpha levels of 1.00 × 10⁻⁷ and 2.00 × 10⁻⁸. Combined with the chicken reference genome (Gallus_gallus-5.0) released by Ensemble, upstream and downstream 10 kb sequences of the SNPs with p-values less than 1.00 × 10⁻⁷ were aligned to the corresponding genes using the Ensemble Biomart online tool (http://oct2018.archive.ensembl.org/biomart/martview/2170f2f8151a7ba30481e705052baee0, accessed on 19 September 2022).

4.3. Genome-Wide Selective Sweep Analysis

Binary files were converted to vcf format using PLINK software (version 1.90). FST was then used to identify the genomic regions under selection in the gamecocks. The window size and step size were set to 20 kb and 10 kb, respectively, to calculate the Weir-FST value using the vcftools software (version 0.1.13). Weir-FST values in the top 1% were regarded as putative genomic regions that were under selection. Annotation of the regions of interest was implemented using the Ensemble Biomart online tool (http://oct2018.archive.ensembl.org/biomart/martview/2170f2f8151a7ba30481e705052baee0, accessed on 19 September 2022). The results were visualised using the CMplot package in R.

4.4. RNA Sequencing

Considering that aggression in chickens is mainly reflected in male individuals, we collected muscle, hypothalamus, and testis samples from four adult male LX gamecocks and three adult male RIR chickens. Tissue samples were placed in RNA preservation solution, stored at −20 °C and sent to ANOROAD (Beijing, China) for further use. Total RNA was extracted from tissue samples using TRIzol reagent. The RNA purity was measured using a NanoDrop spectrophotometer. Concentration and integrity were measured using an Agilent 2100 Bioanalyzer and Agilent RNA 6000 Nano Kit, respectively. Pair-end sequencing (150 bp) was performed using an Illumina Novaseq 6000 platform by a commercial service company. High-quality reads were obtained from the company after removing low-quality base ratios (Q ≤ 19) greater than 50%, raw reads with adapter pollution, and N ratios greater than 5%, with Q30 as the evaluating indicator.

4.5. Analysis of Differentially Expressed Genes

Clean reads were aligned against the chicken reference genome (GRCg6a) using HISAT2 software (version 2.2.0). FeaturesCounts software (version 1.5.2) was used to construct the expression matrix. After the results of FeaturesCounts were returned, differential expression analysis was performed using DESeq2 (Version 1.36.0) in R [48]. The criteria for identifying DEGs were |log2FoldChange| > 1 and padj < 0.05. The DEGs were annotated using the Ensemble Biomart online tool (http://oct2018.archive.ensembl.org/biomart/martview/2170f2f8151a7ba30481e705052baee0, accessed on 20 September 2022). With the name of DEGs as input and p < 0.05 as the significance level, GO analysis of the differentially expressed target genes and KEGG pathway analysis for these genes were conducted using KOBAS (http://kobas.cbi.pku.edu.cn/kobas3, accessed on 23 September 2022) and visualised in R.

5. Conclusions

We identified 10 genes (gga-mir-6608-1, SOX5, DGKB, ISPD, IGF2BP1, AGMO, MEOX2, GIP, DLG5, and KCNMA1) in the Chinese gamecock using a combination of GWAS and the FST-based approaches. These genes are mainly associated with muscle and skeletal development, glucose metabolism, and the pea-comb phenotype. The enrichment results of DEGs showed that differences between the LX gamecock and RIR chickens were reflected by muscle development and neuroactive-related pathways. This study has been helpful in understanding the evolution and genetic basis of Chinese gamecocks for chicken breeders at home and abroad and may support the further use of gamecocks as excellent native breeding material from a genetic perspective. However, further study on the roles of these candidate genes during the evolution and breeding of Chinese gamecocks is still required.

Supplementary Materials

The supporting information can be downloaded at: https://www.mdpi.com/article/10.3390/ijms24065868/s1.

Author Contributions

Conceptualisation, Z.N., L.Q.; formal analysis, X.R., Z.G. and X.Z. (Xiurong Zhao); methodology, X.R. and L.Q.; software, X.R. and Z.G.; visualisation, Y.Z., X.C. and Y.L.; writing—original draft, X.R. and Z.G.; Writing—review & editing, X.R. and X.Z. (Xinye Zhang), J.W. and H.C. All authors have read and agreed to the published version of the manuscript.

Funding

This study was funded by the Beijing Innovation Team of the Modern Agro-Industry Technology Research System for Poultry (BAIC06-2022-G01).

Institutional Review Board Statement

The animal study protocol was reviewed and approved by the Animal Welfare Committee of the China Agricultural University.

Informed Consent Statement

Not applicable.

Data Availability Statement

The datasets used in this study are available from the corresponding author upon reasonable request.

Acknowledgments

Not applicable.

Conflicts of Interest

The research was conducted in the absence of any commercial or financial relationships that could be construed as potential conflict of interest.

References

  1. Qanbari, S.; Seidel, M.; Strom, T.M.; Mayer, K.F.; Preisinger, R.; Simianer, H. Parallel Selection Revealed by Population Sequencing in Chicken. Genome Biol. Evol. 2015, 7, 3299–3306. [Google Scholar] [CrossRef] [PubMed] [Green Version]
  2. Rostamzadeh Mahdabi, E.; Esmailizadeh, A.; Ayatollahi Mehrgardi, A.; Asadi Fozi, M. A genome-wide scan to identify signatures of selection in two Iranian indigenous chicken ecotypes. Genet. Sel. Evol. 2021, 53, 72. [Google Scholar] [CrossRef] [PubMed]
  3. Nielsen, R. Molecular signatures of natural selection. Annu. Rev. Genet. 2005, 39, 197–218. [Google Scholar] [CrossRef] [PubMed] [Green Version]
  4. Qanbari, S.; Simianer, H. Mapping signatures of positive selection in the genome of livestock. Livest. Sci. 2014, 166, 133–143. [Google Scholar] [CrossRef]
  5. Liu, Y.-P.; Zhu, Q.; Yao, Y.-G. Genetic relationship of Chinese and Japanese gamecocks revealed by mtDNA sequence variation. Biochem. Genet. 2006, 44, 19–29. [Google Scholar] [CrossRef]
  6. Endo, H.; Mori, K.; Hosojima, M.; Mekwichai, W.; Ogawa, H.; Tsunekawa, N.; Yamasaki, T.; Hayashi, Y.; Akishinonomiya, F. Functional-morphological characteristics in the musculoskeletal system of standing-type cocks including some game breeds. Jpn. J. Zoo Wildl. Med. 2012, 17, 131–138. [Google Scholar] [CrossRef] [Green Version]
  7. Amos, W.; Driscoll, E.; Hoffman, J.I. Candidate genes versus genome-wide associations: Which are better for detecting genetic susceptibility to infectious disease? Proc. Biol. Sci. 2011, 278, 1183–1188. [Google Scholar] [CrossRef] [Green Version]
  8. Yang, Z.; Zou, L.; Sun, T.; Xu, W.; Zeng, L.; Jia, Y.; Jiang, J.; Deng, J.; Yang, X. Genome-Wide Association Study Using Whole-Genome Sequencing Identifies a Genomic Region on Chromosome 6 Associated With Comb Traits in Nandan-Yao Chicken. Front. Genet. 2021, 12, 682501. [Google Scholar] [CrossRef] [PubMed]
  9. Luo, W.; Luo, C.; Wang, M.; Guo, L.; Chen, X.; Li, Z.; Zheng, M.; Folaniyi, B.S.; Luo, W.; Shu, D.; et al. Genome diversity of Chinese indigenous chicken and the selective signatures in Chinese gamecock chicken. Sci. Rep. 2020, 10, 14532. [Google Scholar] [CrossRef] [PubMed]
  10. Liu, Y.; Tu, Y.; Zhang, M.; Ji, G.; Wang, K.; Shan, Y.; Ju, X.; Zhang, D.; Shu, J.; Zou, J. Identification of molecular pathways and candidate genes associated with cocks’ comb size trait by genome-wide transcriptome analysis. Sci. Rep. 2018, 8, 2015. [Google Scholar] [CrossRef] [PubMed] [Green Version]
  11. Ren, L.; Liu, A.; Wang, Q.; Wang, H.; Dong, D.; Liu, L. Transcriptome analysis of embryonic muscle development in Chengkou Mountain Chicken. BMC Genom. 2021, 22, 431. [Google Scholar] [CrossRef] [PubMed]
  12. Cao, X.; Wang, Y.; Shu, D.; Qu, H.; Luo, C.; Hu, X. Food intake-related genes in chicken determined through combinatorial genome-wide association study and transcriptome analysis. Anim. Genet. 2020, 51, 741–751. [Google Scholar] [CrossRef] [PubMed]
  13. Guo, X.; Wang, J.; Ma, C.; Wang, Z.; Chen, H.; Su, H.; Wan, Y.; Jiang, R. Genome-wide re-sequencing and transcriptome analysis reveal candidate genes associated with the pendulous comb phenotype in domestic chickens. Anim. Sci. J. 2020, 91, e13308. [Google Scholar] [CrossRef]
  14. Liu, X.; Wu, Z.; Li, J.; Bao, H.; Wu, C. Genome-Wide Association Study and Transcriptome Differential Expression Analysis of the Feather Rate in Shouguang Chickens. Front. Genet. 2020, 11, 613078. [Google Scholar] [CrossRef]
  15. Guo, X.; Fang, Q.; Ma, C.; Zhou, B.; Wan, Y.; Jiang, R. Whole-genome resequencing of Xishuangbanna fighting chicken to identify signatures of selection. Genet. Sel. Evol. 2016, 48, 62. [Google Scholar] [CrossRef] [Green Version]
  16. Rietveld, C.A.; Medland, S.E.; Derringer, J.; Yang, J.; Esko, T.; Martin, N.W.; Westra, H.J.; Shakhbazov, K.; Abdellaoui, A.; Agrawal, A.; et al. GWAS of 126,559 individuals identifies genetic variants associated with educational attainment. Science 2013, 340, 1467–1471. [Google Scholar] [CrossRef] [Green Version]
  17. Hormozdiari, F.; van de Bunt, M.; Segrè, A.V.; Li, X.; Joo, J.W.J.; Bilow, M.; Sul, J.H.; Sankararaman, S.; Pasaniuc, B.; Eskin, E. Colocalization of GWAS and eQTL Signals Detects Target Genes. Am. J. Hum. Genet. 2016, 99, 1245–1260. [Google Scholar] [CrossRef] [Green Version]
  18. Ghoreishifar, S.M.; Eriksson, S. Signatures of selection reveal candidate genes involved in economic traits and cold acclimation in five Swedish cattle breeds. Genet Sel Evol. 2020, 521, 52. [Google Scholar] [CrossRef]
  19. González-Rodríguez, A.; Munilla, S.; Mouresan, E.F.; Cañas-Álvarez, J.J.; Díaz, C.; Piedrafita, J. On the performance of tests for the detection of signatures of selection: A case study with the Spanish autochthonous beef cattle populations. Genet. Sel. Evol. 2016, 481, 81. [Google Scholar] [CrossRef] [PubMed] [Green Version]
  20. Kundu, S.; Nandhu, M.S.; Longo, S.L.; Longo, J.A.; Rai, S.; Chin, L.S.; Richardson, T.E.; Viapiano, M.S. The scaffolding protein DLG5 promotes glioblastoma growth by controlling Sonic Hedgehog signaling in tumor stem cells. Neuro. Oncol. 2022, 24, 1230–1242. [Google Scholar] [CrossRef]
  21. Wright, D.; Boije, H.; Meadows, J.R.S.; Bed’hom, B.; Gourichon, D.; Vieaud, A.; Tixier-Boichard, M.; Rubin, C.-J.; Imsland, F.; Hallböök, F.; et al. Copy number variation in intron 1 of SOX5 causes the Pea-comb phenotype in chickens. PLoS Genet. 2009, 5, e1000512. [Google Scholar] [CrossRef] [PubMed]
  22. Pallotta, B.S.; Magleby, K.L.; Barrett, J.N. Single channel recordings of Ca2+-activated K+ currents in rat muscle cell culture. Nature 1981, 293, 471–474. [Google Scholar] [CrossRef] [PubMed]
  23. Squire, L.G.; Petersen, O.H. Modulation of Ca2+- and voltage-activated K+ channels by internal Mg2+ in salivary acinar cells. Biochim. Biophys Acta 1987, 899, 171–175. [Google Scholar] [CrossRef]
  24. Schubert, R.; Krien, U.; Gagov, H. Protons inhibit the BK(Ca) channel of rat small artery smooth muscle cells. J. Vasc. Res. 2001, 38, 30–38. [Google Scholar] [CrossRef]
  25. Reijntjes, S.; Stricker, S.; Mankoo, B.S. A comparative analysis of Meox1 and Meox2 in the developing somites and limbs of the chick embryo. Int. J. Dev. Biol. 2007, 51, 753–759. [Google Scholar] [CrossRef] [PubMed]
  26. Wu, B.; Zhang, L.; Zhu, Y.-H.; Zhang, Y.-E.; Zheng, F.; Yang, J.-Y.; Guo, L.-Y.; Li, X.-Y.; Wang, L.; Tang, J.-M.; et al. Mesoderm/mesenchyme homeobox gene l promotes vascular smooth muscle cell phenotypic modulation and vascular remodeling. Int. J. Cardiol. 2018, 251, 82–89. [Google Scholar] [CrossRef]
  27. Cirak, S.; Foley, A.R.; Herrmann, R.; Willer, T.; Yau, S.; Stevens, E.; Torelli, S.; Brodd, L.; Kamynina, A.; Vondracek, P.; et al. ISPD gene mutations are a common cause of congenital and limb-girdle muscular dystrophies. Brain 2013, 136, 269–281. [Google Scholar] [CrossRef] [PubMed]
  28. Wang, K.; Hu, H.; Tian, Y.; Li, J.; Scheben, A.; Zhang, C.; Li, Y.; Wu, J.; Yang, L.; Fan, X.; et al. The Chicken Pan-Genome Reveals Gene Content Variation and a Promoter Region Deletion in IGF2BP1 Affecting Body Size. Mol. Biol. Evol. 2021, 38, 5066–5081. [Google Scholar] [CrossRef]
  29. Zhou, Z.; Li, M.; Cheng, H.; Fan, W.; Yuan, Z.; Gao, Q.; Xu, Y.; Guo, Z.; Zhang, Y.; Hu, J.; et al. An intercross population study reveals genes associated with body size and plumage color in ducks. Nat. Commun. 2018, 9, 2648. [Google Scholar] [CrossRef] [Green Version]
  30. Keren, A.; Tamir, Y.; Bengal, E. The p38 MAPK signaling pathway: A major regulator of skeletal muscle development. Mol. Cell. Endocrinol. 2006, 252, 224–230. [Google Scholar] [CrossRef] [PubMed]
  31. Watschinger, K.; Keller, M.A.; McNeill, E.; Alam, M.T.; Lai, S.; Sailer, S.; Rauch, V.; Patel, J.; Hermetter, A.; Golderer, G.; et al. Tetrahydrobiopterin and alkylglycerol monooxygenase substantially alter the murine macrophage lipidome. Proc. Natl. Acad. Sci. USA 2015, 112, 2431–2436. [Google Scholar] [CrossRef] [PubMed] [Green Version]
  32. Hu, C.; Zhang, R.; Wang, C.; Wang, J.; Ma, X.; Hou, X.; Lu, J.; Yu, W.; Jiang, F.; Bao, Y.; et al. Variants from GIPR, TCF7L2, DGKB, MADD, CRY2, GLIS3, PROX1, SLC30A8 and IGF1 are associated with glucose metabolism in the Chinese. PLoS ONE 2010, 5, e15542. [Google Scholar] [CrossRef]
  33. Nauck, M.A.; Quast, D.R.; Wefers, J.; Pfeiffer, A.F.H. The evolving story of incretins (GIP and GLP-1) in metabolic and cardiovascular disease: A pathophysiological update. Diabetes Obes. Metab. 2021, 23 (Suppl. S3), 5–29. [Google Scholar] [CrossRef]
  34. Cheng, L.; Yang, J.; Rao, Q.; Liu, Z.; Song, W.; Guan, S.; Zhao, Z.; Song, W. Toxic effects of Decabromodiphenyl ether (BDE-209) on thyroid of broiler chicks by transcriptome profile analysis. Ecotoxicol. Environ. Saf. 2021, 219, 112305. [Google Scholar] [CrossRef]
  35. Adkins, D.E.; Khachane, A.N.; McClay, J.L.; Aberg, K.; Bukszár, J.; Sullivan, P.F.; van den Oord, E.J. SNP-based analysis of neuroactive ligand-receptor interaction pathways implicates PGE2 as a novel mediator of antipsychotic treatment response: Data from the CATIE study. Schizophr. Res. 2012, 135, 200–201. [Google Scholar] [CrossRef] [Green Version]
  36. Kong, Y.; Liang, X.; Liu, L.; Zhang, D.; Wan, C.; Gan, Z.; Yuan, L. High Throughput Sequencing Identifies MicroRNAs Mediating α-Synuclein Toxicity by Targeting Neuroactive-Ligand Receptor Interaction Pathway in Early Stage of Drosophila Parkinson’s Disease Model. PLoS ONE 2015, 10, e0137432. [Google Scholar] [CrossRef] [PubMed] [Green Version]
  37. Wei, J.; Liu, J.; Liang, S.; Sun, M.; Duan, J. Low-Dose Exposure of Silica Nanoparticles Induces Neurotoxicity via Neuroactive Ligand-Receptor Interaction Signaling Pathway in Zebrafish Embryos. Int. J. Nanomed. 2020, 15, 4407–4415. [Google Scholar] [CrossRef]
  38. Brand, A.; Leibfritz, D.; Hamprecht, B.; Dringen, R. Metabolism of cysteine in astroglial cells: Synthesis of hypotaurine and taurine. J. Neurochem. 1998, 71, 827–832. [Google Scholar] [CrossRef]
  39. Lombardini, J.B. Effects of ATP and taurine on calcium uptake by membrane preparations of the rat retina. J. Neurochem. 1983, 40, 402–406. [Google Scholar] [CrossRef] [PubMed]
  40. Ripps, H.; Shen, W. Review: Taurine: A “very essential” amino acid. Mol. Vis. 2012, 18, 2673–2686. [Google Scholar]
  41. Beauchet, O. Testosterone and cognitive function: Current clinical evidence of a relationship. Eur. J. Endocrinol. 2006, 155, 773–781. [Google Scholar] [CrossRef] [Green Version]
  42. Storer, T.W.; Basaria, S.; Traustadottir, T.; Harman, S.M.; Pencina, K.; Li, Z.; Travison, T.G.; Miciek, R.; Tsitouras, P.; Hally, K.; et al. Effects of Testosterone Supplementation for 3 Years on Muscle Performance and Physical Function in Older Men. J. Clin. Endocrinol. Metab. 2017, 102, 583–593. [Google Scholar] [CrossRef] [PubMed] [Green Version]
  43. McHenry, J.; Carrier, N.; Hull, E.; Kabbaj, M. Sex differences in anxiety and depression: Role of testosterone. Front. Neuroendocrinol. 2014, 35, 42–57. [Google Scholar] [CrossRef] [PubMed] [Green Version]
  44. Purcell, S.; Neale, B.; Todd-Brown, K.; Thomas, L.; Ferreira, M.A.R.; Bender, D.; Maller, J.; Sklar, P.; de Bakker, P.I.W.; Daly, M.J.; et al. PLINK: A tool set for whole-genome association and population-based linkage analyses. Am. J. Hum. Genet. 2007, 81, 559–575. [Google Scholar] [CrossRef] [Green Version]
  45. Zhou, X.; Stephens, M. Efficient multivariate linear mixed model algorithms for genome-wide association studies. Nat. Methods 2014, 11, 407–409. [Google Scholar] [CrossRef] [PubMed]
  46. Zhou, X.; Stephens, M. Genome-wide efficient mixed-model analysis for association studies. Nat. Genet. 2012, 44, 821–824. [Google Scholar] [CrossRef] [Green Version]
  47. Pearson, T.A.; Manolio, T.A. How to interpret a genome-wide association study. JAMA 2008, 299, 1335–1344. [Google Scholar] [CrossRef]
  48. Love, M.I.; Huber, W.; Anders, S. Moderated estimation of fold change and dispersion for RNA-seq data with DESeq2. Genome Biol. 2014, 15, 550. [Google Scholar] [CrossRef] [Green Version]
Figure 1. Selective signatures identified via GWAS and FST. (a) Manhattan plot of GWAS values. The greenand red lines in the Manhattan plot represent genome-wide alpha level 1.00 × 10⁻⁷ and 2.00 × 10⁻⁸ adjusted based on the Bonferroni method with 498,363 SNPs after quality control, respectively. (b) Q-Q plot of GWAS values. Sudden separation of observed p values from expected p values indicate that traits are indeed affected by SNPs. (c) Distributionof Weir-FST values.
Ijms 24 05868 g001
Figure 2. Differentially expressed genes in different tissues.
Ijms 24 05868 g002
Figure 3. Functional analysis of DEGs. Significant GO terms of the (a) testis, (b) muscle, and (c) hypothalamus. (d) Top eight significant KEGG pathways of muscle.
Ijms 24 05868 g003
Table 1. Detailed information of the chicken samples used in our study.
Population/BreedGeographic OriginClassificationNumber
Henan GameHenan Province, ChinaFight breed13 F
Luxi Game Shandong Province, ChinaFight breed2 M/8 F
Turpan Game Xinjiang Province, ChinaFight breed6 M/5 F
Xishuangbanna GameYunnan Province, ChinaFight breed10
Zhangzhou GameFujian Province, ChinaFight breed10
Big BoneLiaoning Province, ChinaIndigenous breed5 M/5 F
Beijing YouBeijing, ChinaIndigenous breed50
ChahuaYunnan Province, ChinaIndigenous breed5 M/6 F
Hongshan Hubei Province, ChinaIndigenous breed24 M/24 F
Piaoji Yunnan Province, ChinaIndigenous breed9F
Shouguang Shandong Province, ChinaIndigenous breed50
Taihe Silky Jiangxi Province, ChinaIndigenous breed50
Tibetan Tibet, ChinaIndigenous breed40
WenchangHainan Province ChinaIndigenous breed11
RIRRhode Island, AmericaCommercial breed50
WhiteLeghornTuscany, ItalyCommercial breed40
Dwarf LayerGuizhou Province ChinaCultivated breed50
Dwarf Yellow BroilerGuizhou Province ChinaCultivated breed50
DongtaoVietnamForeign breed20 M/10 F
HoudanFranceForeign breed50
Total 603
Note: F means female. M means male. Individuals with neither F nor M have missing sex information.
Disclaimer/Publisher’s Note: The statements, opinions and data contained in all publications are solely those of the individual author(s) and contributor(s) and not of MDPI and/or the editor(s). MDPI and/or the editor(s) disclaim responsibility for any injury to people or property resulting from any ideas, methods, instructions or products referred to in the content.

