
Reference Values on Children’s Hair for 28 Elements (Heavy Metals and Essential Elements) Based on a Pilot Study in a Representative Non-Contaminated Local Area
 and
and
Abstract
:1. Introduction
2. Results
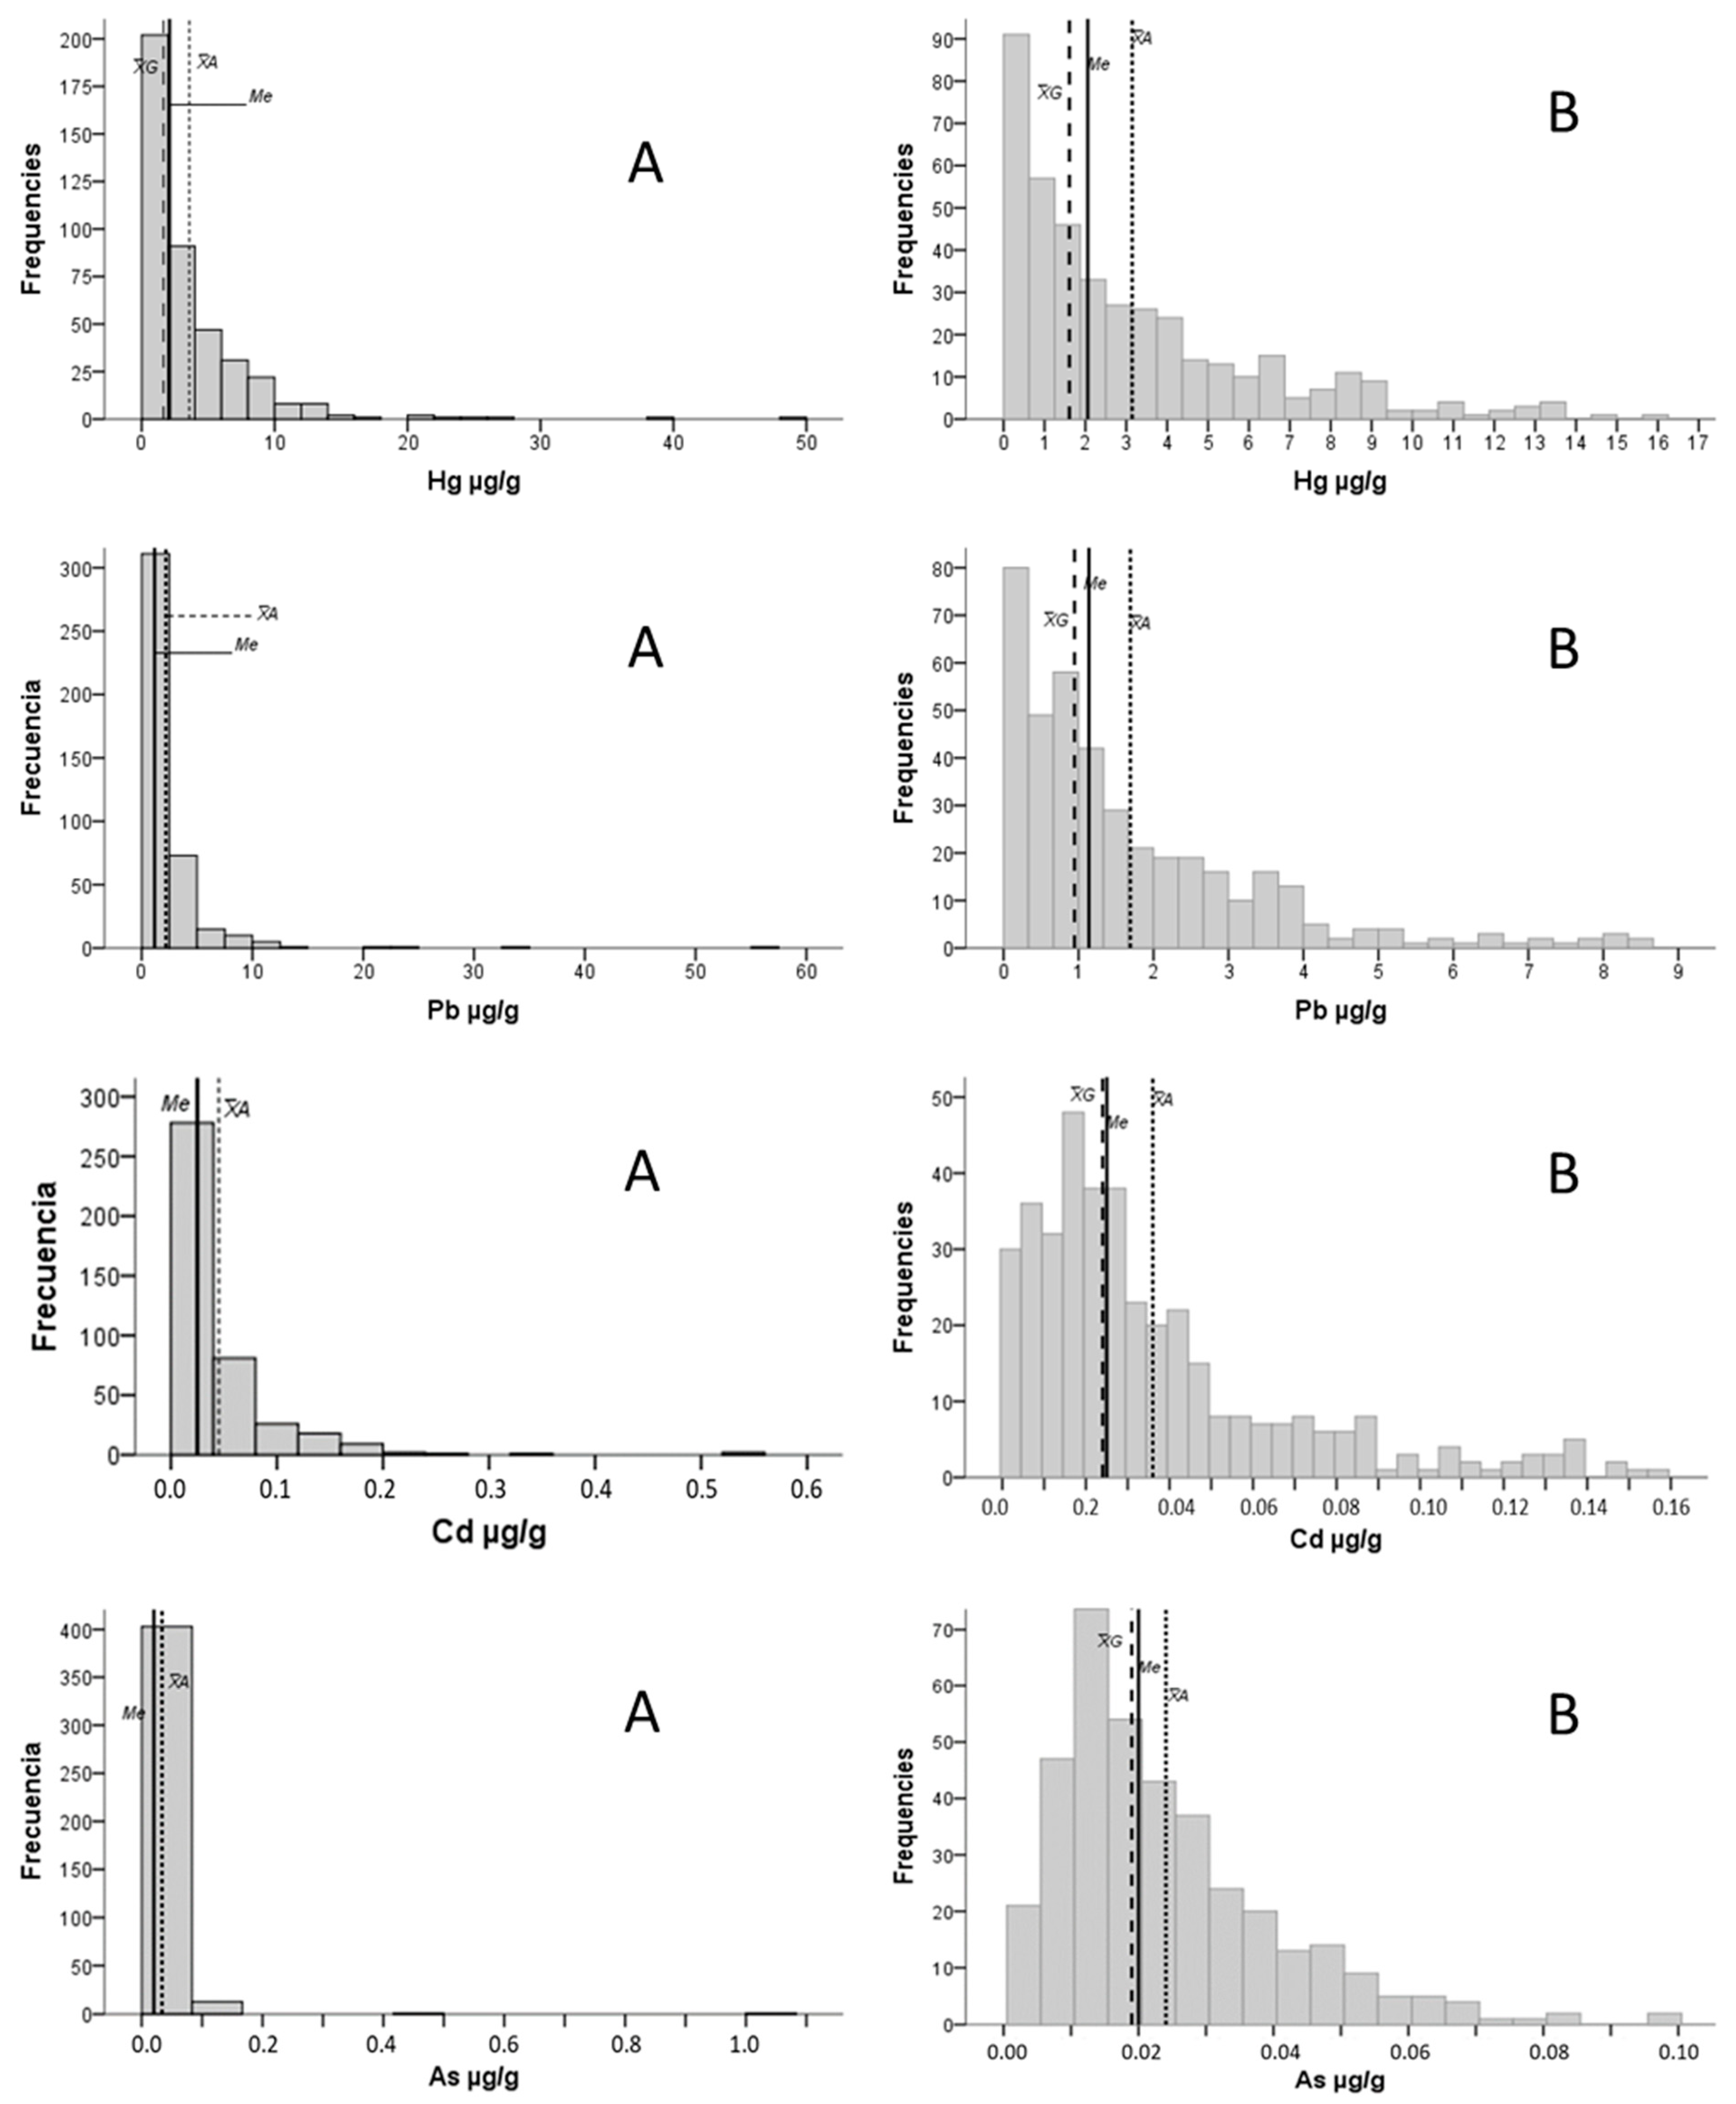
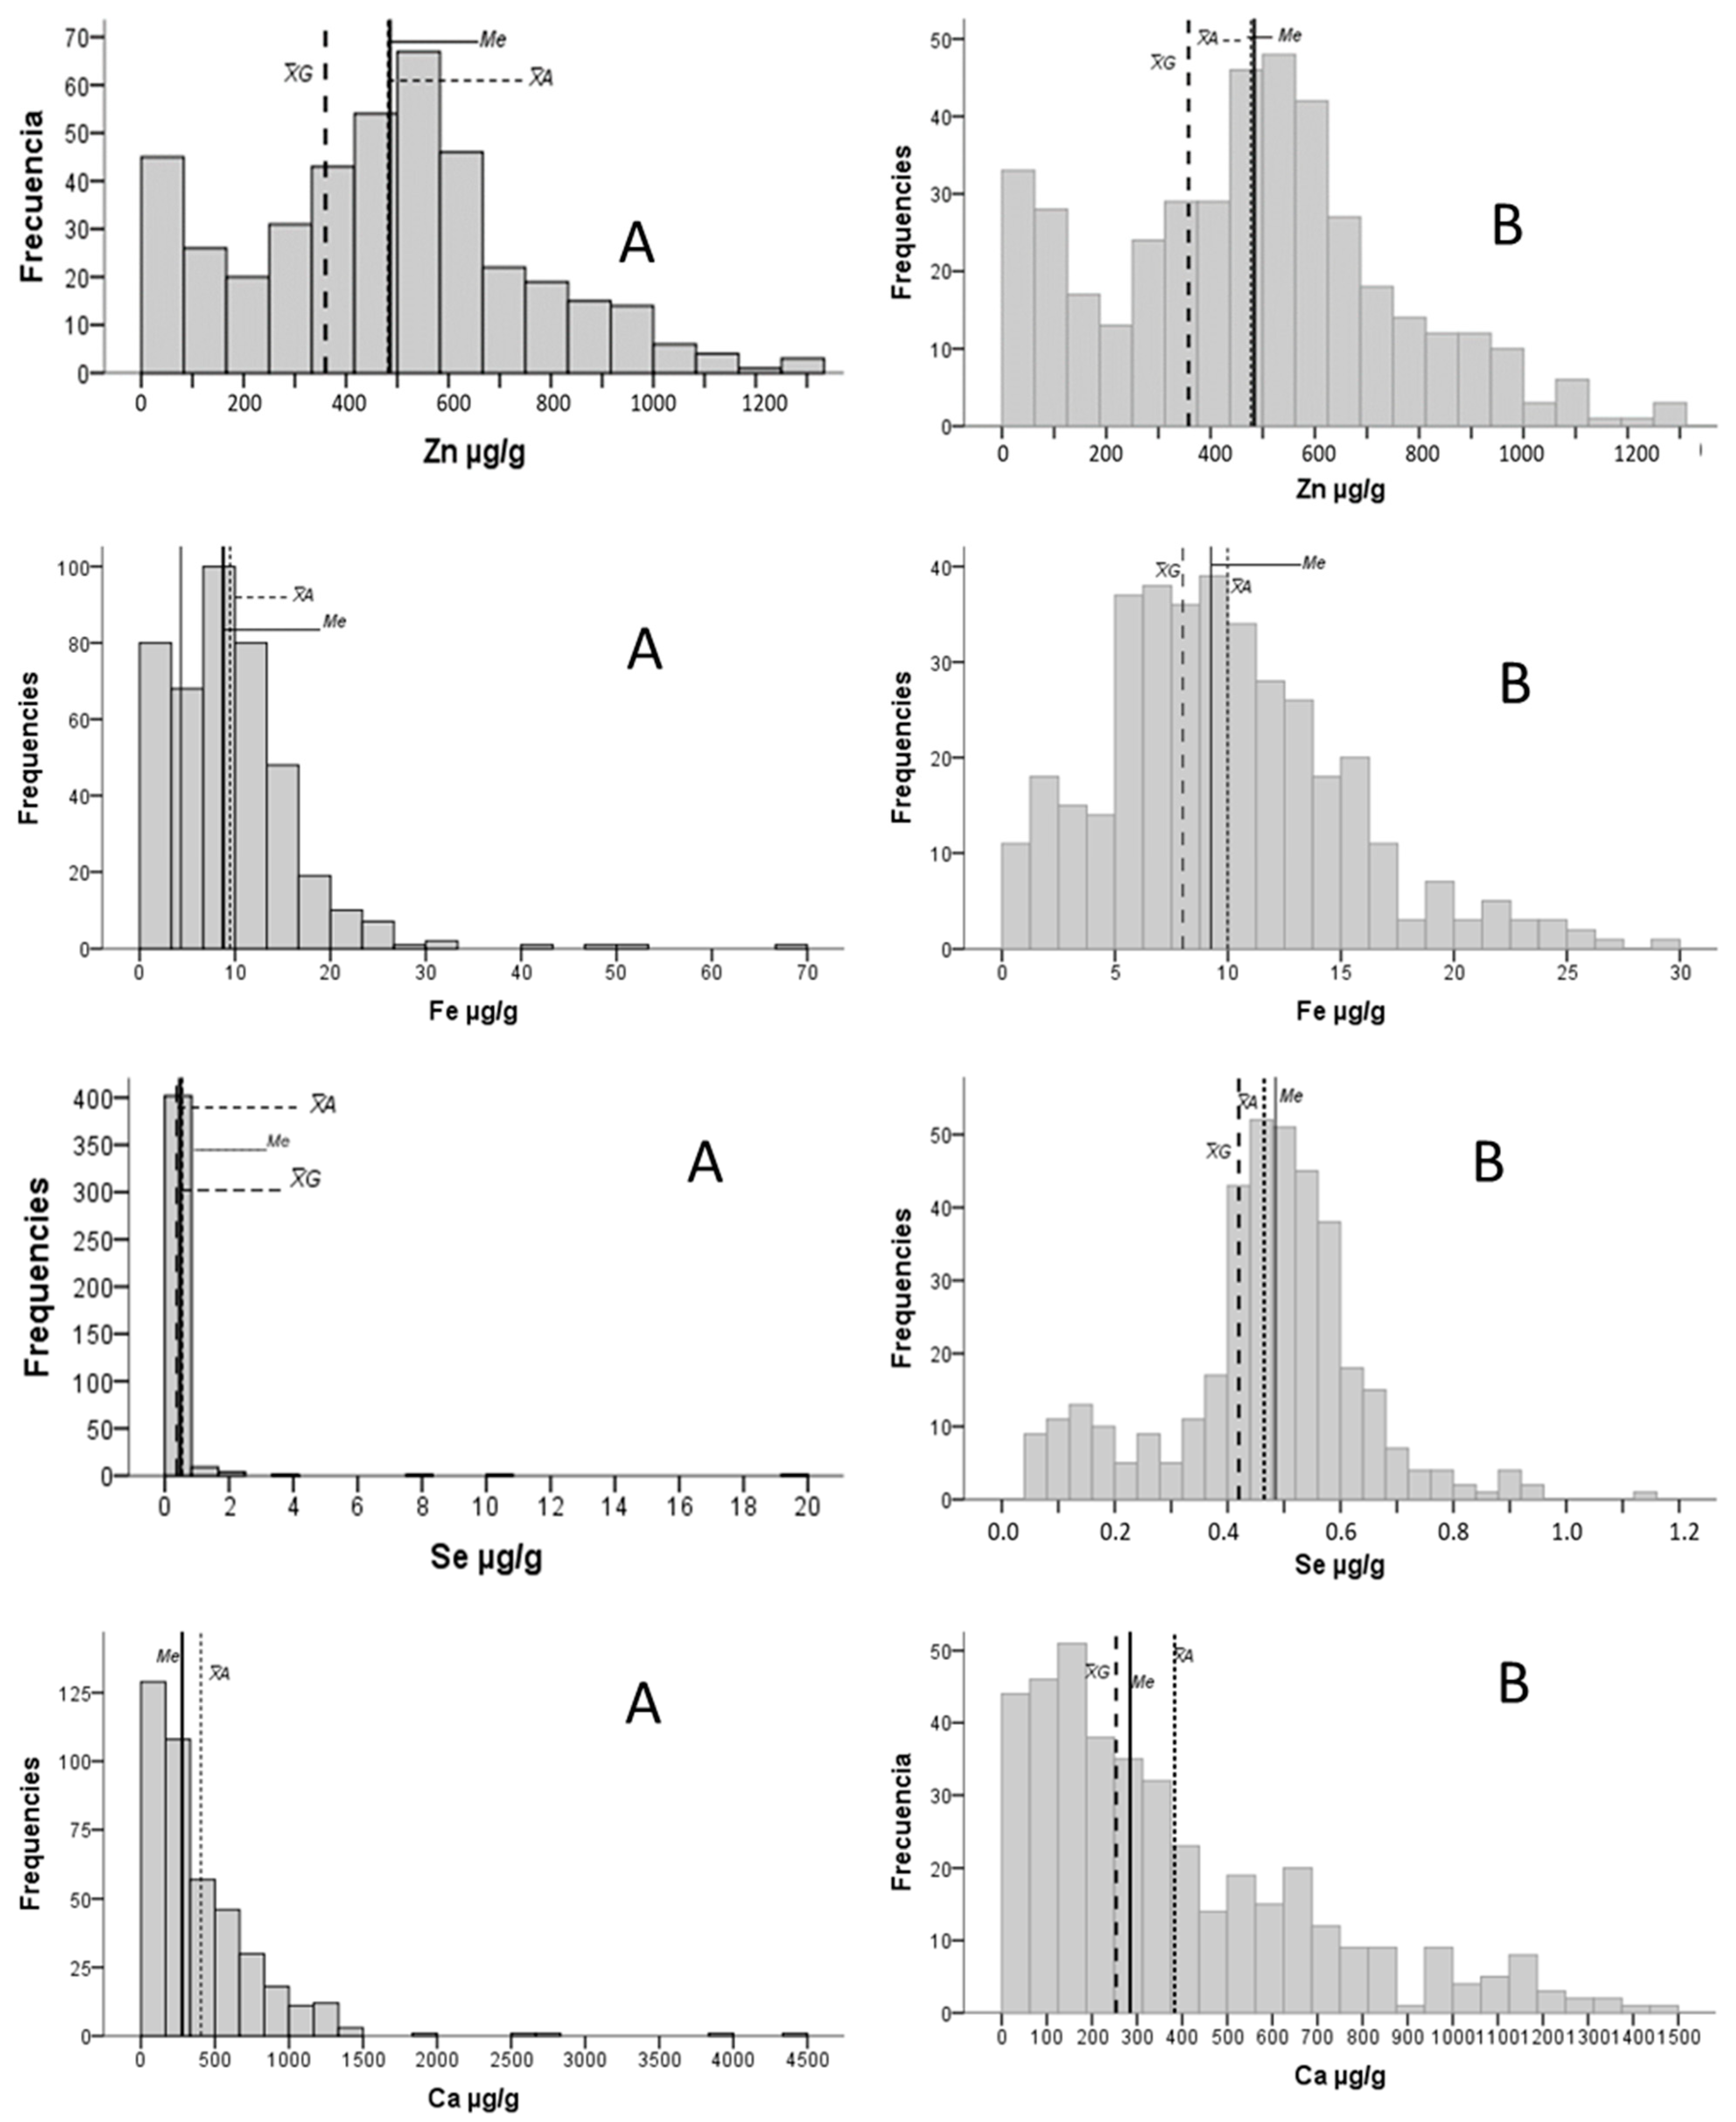
2.1. General Statistics and Distribution
2.2. Analysis by Eliminating Extreme Values
2.3. Crossing of Age and Sex Variables
2.3.1. Age and Study Elements
2.3.2. Sex and Study Elements
3. Discussion
3.1. Statistical Considerations
3.2. Sex and Age Variables
3.3. Criteria to Propose Reference Values for Elements in Hair of Children: Criteria
- (1)
- First proposal: Based on the statistics of the data presented herein, mainly using 5–95th percentiles after eliminating outliers (Table S4) or in some cases from the percentile table considering the total population of study (Table 3). The distribution curves of all the studied elements were completely asymmetric, and none fitted theoretical normality. Hence, the means and standard deviations had a low statistical value, and the percentiles were considered more suitable. Although the 5–95% range of percentiles might be the recommendable criteria, professionals can use other ranges that they consider to be more suitable in each case.
- (2)
- Second proposal: Setting values for the specific analysis of each element by considering, additionally to the percentile table, other data as follows: (i) the characteristics of the statistical distribution shown with and without eliminating extreme outliers and (ii) comparing our results in published works with a similar population in a case-by-case approach. The intention here was for them to be of general potential use. A descriptive analysis of the criteria applied for each element is shown in Supplementary Table S5. The main bibliographic references used to apply such criteria are shown inside that table.
4. Materials and Methods
4.1. Design of Study
4.1.1. Type of Study, Place and Time
4.1.2. The Total Study Population and Population Sample
4.1.3. Study Variables
4.2. Analytical Procedures
4.2.1. Hair Sample Processing
4.2.2. ICP MS Measures
4.2.3. ICP-MS Certified Standards and Calibration
4.3. Statistical Approaches
5. Conclusions
Supplementary Materials
Author Contributions
Funding
Institutional Review Board Statement
Informed Consent Statement
Data Availability Statement
Conflicts of Interest
References
- Otim, E.O.; Kasozi, K.I.; Zirintunda, G.; Matama, K. Investigating vegetable contamination in indigent communities by heavy metals: A case of food safety in Bushenyi, Uganda. Environ. Bioavailab. 2021, 33, 292–300. [Google Scholar] [CrossRef]
- Otim, E.O.; Chen, R.; Otim, O. Applying multivariate analysis to characterize waragi spirits from Acoli, Uganda, by their metal contents. Heliyon 2019, 5, e01417. [Google Scholar] [CrossRef] [PubMed]
- Kumari, S.; Jain, M.K.; Elumalai, S.P. Assessment of Pollution and Health Risks of Heavy Metals in Particulate Matter and Road Dust Along the Road Network of Dhanbad, India. J. Health Pollut. 2021, 11, 210305. [Google Scholar] [CrossRef] [PubMed]
- Zoroddu, M.A.; Aashet, J.; Crisponi, G.; Medici, S.; Peana, M.; Nurchi, V.M. The essential metals for humans: A brief overview. J. Inorg. Biochem. 2019, 195, 120–129. [Google Scholar] [CrossRef]
- Kazi, T.G.; Afridi, H.; Kazi, G.H.; Jamali, M.K.; Arain, M.B.; Jalbani, N. Evaluation of essential and toxic metals by ultrasound-assisted acid leaching from scalp hair samples of children with macular degeneration patients. Clin. Chim. Acta 2006, 369, 52–60. [Google Scholar] [CrossRef]
- Scheinberg, I.H.; Sternlieb, I. Wilson disease and idiopathic copper toxicosis. Am. J. Clin. Nutr. 1996, 63, 842S–845S. [Google Scholar] [CrossRef]
- Legrand, M.; Sousa Passos, C.J.; Mergler, D.; Chan, H.M. Biomonitoring of Mercury Expositure with Single Hair. Environ. Sci. Technol. 2005, 39, 4594–4598. [Google Scholar] [CrossRef]
- Cernichiari, E.; Myers, G.J.; Ballatori, N.; Zareba, G.; Vyas, J.; Clarkson, T. The biological monitoring of prenatal exposure to methylmercury. Neurotoxicology 2007, 28, 1015–1022. [Google Scholar] [CrossRef]
- Cernichiari, E.; Toribara, T.Y.; Liang, L.; Marsh, D.O.; Berlin, M.W.; Myers, G.J.; Cox, C.; Shamlaye, C.F.; Choisy, O.; Davidson, P. The biological monitoring of mercury in the Seychelles study. Neurotoxicology 1995, 16, 613–628. [Google Scholar]
- Davidson, P.W.; Palumbo, D.; Myers, G.J.; Cox, C.; Shamlaye, C.F.; Sloane-Reeves, J.; Cernichiari, E.; Wilding, G.E.; Clarkson, T. Neurovelopmental Outcomes of Seychellois Children from the Pilot Cohort al 108 Month Following Prenatal Exposure to Methylmercury from a Maternal Fish Diet. Environ. Res. Sect. A 2000, 84, 1–11. [Google Scholar] [CrossRef]
- Debes, F.; Bultz-Jorgensen, E.; Weihe, P.; White, F.R.; Grandjean, P. Impact of prenatal methylmercury esposure on neuribehavioral funtion at age 14 year. Neurotoxicol. Teratol. 2006, 28, 363–375. [Google Scholar] [CrossRef] [PubMed]
- Debes, F.; Weihe, P.; Grandjean, P. Cognitive deficits at age 22 years associated with prenatal exposure to methylmercury. Cortex 2016, 74, 358–369. [Google Scholar] [CrossRef] [PubMed]
- Grandjean, P.; Weihe, P.; White, R.; Bebes, F.; Araki, S.; Yokoyama, K.; Murata, K.; Sorensen, N.; Dahl, R.; Jorgensen, P. Cognitive déficit in 7 year-old children with prenatal exposure to methylmercury. Neurotoxicol. Teratol. 1997, 19, 417–428. [Google Scholar] [CrossRef] [PubMed]
- Myers, G.J.; Davidson, P.W.; Palumbo, D.; Shamlaye, C.; Cox, C.; Cernichiari, E.; Clarkson, T.W. Secondary Analisis from the Seycheles Child Developmente Study: The Chile Behavior Ckecklist. Environ. Res. 2000, 84, 12–19. [Google Scholar] [CrossRef]
- Myers, G.J.; Marsh, D.O.; Davidson, P.W.; Cox, C.; Shamlaye, C.F.; Tanner, M.; Choi, A.; Cernichiari, E.; Choisy, O.; Clarkson, T.W. Main neurodevelopmental study of Seychellois children following in utero exposure to methylmercury from a maternal fish diet: Outcome at six months. Neurotoxicology 1995, 16, 653–664. [Google Scholar]
- Myers, G.J.; Thurston, S.W.; Pearson, A.T.; Davidson, P.W.; Cox, C.; Shamlaye, C.F.; Cernichiari, E.; Clarkson, T.W. Postnatal exposure to methyl mercury from fish consumption: A review and new data from the Seychelles Child Development Study. Neurotoxicology 2009, 30, 338–349. [Google Scholar] [CrossRef]
- Weihe, P.; Grandjean, P.; Debes, F.; White, R. Health implications for Faroe Islander of heavy metal and PCBs from pilot whales. Sci. Total Environ. 1996, 186, 141–148. [Google Scholar] [CrossRef]
- Weihe, P.; Grandjean, P.; Jørgensen, P.J. Application of hair-mercury analysis to determine the impact of a seafood advisory. Environ. Res. 2005, 97, 201–208. [Google Scholar] [CrossRef]
- Nadal, M.; Bocio, A.; Schuhmacher, M.; Domingo, J.L. Monitoring metals in the population living in the vicinity of a hazardous waste incinerator: Levels in hair of school children. Biol. Trace Elem. Res. 2005, 104, 203–213. [Google Scholar] [CrossRef]
- Torrente, M.; Colomina, M.-T.; Domingo, J. Metal Concentrations in Hair and Cognitive Assessment in an Adolescent Population. Biol. Trace Elem. Res. 2005, 104, 215. [Google Scholar] [CrossRef]
- Schwedler, G.; Seiwert, M.; Fiddicke, U.; Ißleb, S.; Hölzer, J.; Nendza, J.; Wilhelm, M.; Wittsiepe, J.; Koch, H.M.; Schindler, B.K.; et al. Human biomonitoring pilot study DEMOCOPHES in Germany: Contribution to a harmonized European approach. Int. J. Hyg. Environ. Health 2017, 220, 686–696. [Google Scholar] [CrossRef] [PubMed]
- Barbone, F.; Rosolen, V.; Mariuz, M.; Parpinel, M.; Casetta, A.; Sammartano, F.; Ronfani, L.; Vecchi Brumatti, L.; Bin, M.; Castriotta, L.; et al. Prenatal mercury exposure and child neurodevelopment outcomes at 18 months: Results from the Mediterranean PHIME cohort. Int. J. Hyg. Environ. Health 2018. [Google Scholar] [CrossRef] [PubMed]
- Matsumoto, H.; Koya, G.; Takeuchi, T. Fetal Minamata disease: A neuropathological study of two cases of intrauterine intoxication by a methyl mercury compound. J. Neuropathol. Exp. Neurol. 1965, 24, 563–574. [Google Scholar] [CrossRef] [PubMed]
- Ohba, T.; Kurokawa, N.; Nakai, K.; Shimada, M.; Suzuki, K.; Sugawara, N.; Kameo, S.; Satoh, C.; Satoh, H. Permanent waving does not change mercury concentration in the proximal segment of hair close to scalp. Tohoku J. Exp. Med. 2008, 214, 69–78. [Google Scholar] [CrossRef]
- Kusanagi, E.; Takamura, H.; Chen, S.J.; Adachi, M.; Hoshi, N. Children’s Hair Mercury Concentrations and Seafood Consumption in Five Regions of Japan. Arch. Environ. Contam. Toxicol. 2018, 74, 259–272. [Google Scholar] [CrossRef]
- Tatsuta, N.; Nakai, K.; Iwai-Shimada, M.; Suzuki, T.; Satoh, H.; Murata, K. Total mercury levels in hair of children aged 7years before and after the Great East Japan Earthquake. Sci. Total Environ. 2017, 596, 207–211. [Google Scholar] [CrossRef]
- Rodriguez-Villamizar, L.A.; Medina, O.M.; Flórez-Vargas, O.; Vilanova, E.; Idrovo, A.J.; Araque-Rodriguez, S.A.; Henao, J.A.; Sánchez-Rodríguez, L.H. Chemical Element Mixtures and Kidney Function in Mining and Non-Mining Settings in Northern Colombia. Int. J. Environ. Res. Public Health 2023, 20, 2321. [Google Scholar] [CrossRef]
- Abdul Samad, N.I.; Md Isa, Z.; Hod, R. Mercury Hair Concentration among Primary School Children in Malaysia. Children 2017, 4, 109. [Google Scholar] [CrossRef]
- Li, Z.; Su, H.; Wang, L.; Hu, D.; Zhang, L.; Fang, J.; Jin, M.; Fiati Kenston, S.S.; Song, X.; Shi, H.; et al. Epidemiological Study on Metal Pollution of Ningbo in China. Int. J. Environ. Res. Public Health 2018, 15, 424. [Google Scholar] [CrossRef]
- Jia, Q.; Zhu, X.; Hao, Y.; Yang, Z.; Wang, Q.; Fu, H.; Yu, H. Mercury in soil, vegetable and human hair in a typical mining area in China: Implication for human exposure. J. Environ. Sci. 2018, 68, 73–82. [Google Scholar] [CrossRef]
- Dos Santos Freitas, J.; da Costa Brito Lacerda, E.M.; da Silva Martins, I.C.V.; Rodrigues, D., Jr.; Bonci, D.M.O.; Cortes, M.I.T.; Corvelo, T.C.O.; Ventura, D.F.; de Lima Silveira, L.C.; da Conceição Nascimento Pinheiro, M.; et al. Cross-sectional study to assess the association of color vision with mercury hair concentration in children from Brazilian Amazonian riverine communities. Neurotoxicology 2018, 65, 60–67. [Google Scholar] [CrossRef] [PubMed]
- Barbosa, A.C.; Silva, S.R.; Dórea, J.G. Concentration of mercury in hair of indigenous mothers and infants from the Amazon basin. Arch. Environ. Contamitation Toxicol. 1998, 34, 100–105. [Google Scholar] [CrossRef] [PubMed]
- Marcinek-Jacel, M.; Albińska, J.; Pawlaczyk, A.; Szynkowska, M.I. The impact of demographic factors, behaviors and environmental exposure to mercury content in the hair of the population living in the region of Lodz (central Poland). Environ. Toxicol. Pharm. 2017, 55, 196–201. [Google Scholar] [CrossRef]
- Forysová, K.; Pinkr-Grafnetterová, A.; Malý, M.; Krsková, A.; Mráz, J.; Kašparová, L.; Čejchanová, M.; Sochorová, L.; Rödlová, S.; Černá, M. Urinary Cadmium and Cotinine Levels and Hair Mercury Levels in Czech Children and Their Mothers Within the Framework of the COPHES/DEMOCOPHES Projects. Arch. Environ. Contam. Toxicol. 2017, 73, 421–430. [Google Scholar] [CrossRef]
- Kobal, A.B.; Snoj Tratnik, J.; Mazej, D.; Fajon, V.; Gibičar, D.; Miklavčič, A.; Kocman, D.; Kotnik, J.; Sešek Briški, A.; Osredkar, J.; et al. Exposure to mercury in susceptible population groups living in the former mercury mining town of Idrija, Slovenia. Environ. Res. 2017, 152, 434–445. [Google Scholar] [CrossRef] [PubMed]
- Barenys, M.; Boix, N.; Farran-Codina, A.; Palma-Linares, I.; Montserrat, R.; Curto, A.; Gomez-Catalan, J.; Ortiz, P.; Deza, N.; Llobet, J.M. Heavy metal and metalloids intake risk assessment in the diet of a rural population living near a gold mine in the Peruvian Andes (Cajamarca). Food Chem. Toxicol. 2014, 71, 254–263. [Google Scholar] [CrossRef] [PubMed]
- Weinhouse, C.; Ortiz, E.J.; Berky, A.J.; Bullins, P.; Hare-Grogg, J.; Rogers, L.; Morales, A.M.; Hsu-Kim, H.; Pan, W.K. Hair Mercury Level is Associated with Anemia and Micronutrient Status in Children Living Near Artisanal and Small-Scale Gold Mining in the Peruvian Amazon. Am. J. Trop. Med. Hyg. 2017, 97, 1886–1897. [Google Scholar] [CrossRef]
- Skalny, A.V.; Simashkova, N.V.; Skalnaya, A.A.; Klyushnik, T.P.; Bjørklund, G.; Skalnaya, M.G.; Tinkov, A.A. Assessment of gender and age effects on serum and hair trace element levels in children with autism spectrum disorder. Metab. Brain Dis. 2017, 32, 1675–1684. [Google Scholar] [CrossRef]
- Gustin, K.; Tofail, F.; Mehrin, F.; Levi, M.; Vahter, M.; Kippler, M. Methylmercury exposure and cognitive abilities and behavior at 10years of age. Environ. Int. 2017, 102, 97–105. [Google Scholar] [CrossRef]
- Wahlberg, K.; Love, T.M.; Pineda, D.; Engström, K.; Watson, G.E.; Thurston, S.W.; Yeates, A.J.; Mulhern, M.S.; McSorley, E.M.; Strain, J.J.; et al. Maternal polymorphisms in glutathione-related genes are associated with maternal mercury concentrations and early child neurodevelopment in a population with a fish-rich diet. Environ. Int. 2018, 115, 142–149. [Google Scholar] [CrossRef]
- Domingo, J.L.; García, F.; Nadal, M.; Schuhmacher, M. Autopsy tissues as biological monitors of human exposure to environmental pollutants. A case study: Concentrations of metals and PCDD/Fs in subjects living near a hazardous waste incinerator. Environ. Res. 2017, 154, 269–274. [Google Scholar] [CrossRef] [PubMed]
- Park, H.-S.; Shin, K.-O.; Kim, J.-S. Assessment of Reference Values for Hair Minerals of Korean Preschool Children. Biol. Trace Elem. Res. 2007, 116, 119–130. [Google Scholar] [CrossRef]
- Senafonte, O.; Violante, N. Caroli S Assessement of refereence values of elements in human hair of urban schoolboys. J. Trace Elem. Med. Biol. 2000, 14, 6–13. [Google Scholar] [CrossRef] [PubMed]
- Rodrigues, J.L.G.; Araújo, C.F.S.; Dos Santos, N.R.; Bandeira, M.J.; Anjos, A.L.S.; Carvalho, C.F.; Lima, C.S.; Abreu, J.N.S.; Mergler, D.; Menezes-Filho, J.A. Airborne manganese exposure and neurobehavior in school-aged children living near a ferro-manganese alloy plant. Environ. Res. 2018, 167, 66–77. [Google Scholar] [CrossRef]
- Jursa, T.; Stein, C.R.; Smith, D.R. Determinants of Hair Manganese, Lead, Cadmium and Arsenic Levels in Environmentally Exposed Children. Toxics 2017, 22, 19. [Google Scholar] [CrossRef]
- Zhu, Y.; Li, Z.; Pang, Y.; Huo, W.; Li, N.; Li, Z.; Zhang, J.; Ye, R.; Wang, B. Association Between Chronic Exposure to Tobacco Smoke and Accumulation of Toxic Metals in Hair Among Pregnant Women. Biol. Trace Elem. Res. 2018, 185, 302–310. [Google Scholar] [CrossRef] [PubMed]
- Zhou, J.; Liang, J.; Hu, Y.; Zhang, W.; Liu, H.; You, L.; Zhang, W.; Gao, M.; Zhou, J. Exposure risk of local residents to copper near the largest flash copper smelter in China. Sci. Total Environ. 2018, 630, 453–461. [Google Scholar] [CrossRef] [PubMed]
- Xie, W.; Peng, C.; Wang, H.; Chen, W. Health Risk Assessment of Trace Metals in Various Environmental Media, Crops and Human Hair from a Mining Affected Area. Int. J. Environ. Res. Public Health 2017, 14, 1595. [Google Scholar] [CrossRef]
- Vigeh, M.; Yokoyama, K.; Matsukawa, T.; Shinohara, A.; Shariat, M.; Ohtani, K. Effects of Hair Metals on Body Weight in Iranian Children Aged 20 to 36 Months. Iran. J. Public Health 2017, 46, 1018–1027. [Google Scholar]
- Manduca, P.; Diab, S.Y.; Qouta, S.R.; Albarqouni, N.M.; Punamaki, R.L. A cross sectional study of the relationship between the exposure of pregnant women to military attacks in 2014 in Gaza and the load of heavy metal contaminants in the hair of mothers and newborns. BMJ Open 2017, 7, e014035. [Google Scholar] [CrossRef]
- Eqani, S.A.M.A.S.; Khuram, F.; Alamdar, A.; Tahir, A.; Shah, S.T.A.; Nasir, A.; Javed, S.; Bibi, N.; Hussain, A.; Rasheed, H.; et al. Environmental exposure pathway analysis of trace elements and autism risk in Pakistani children population. Sci. Total Environ. 2020, 712, 136471. [Google Scholar] [CrossRef]
- Amadi, C.N.; Orish, C.N.; Frazzoli, C.; Orisakwe, O.E. Association of autism with toxic metals: A systematic review of case-control studies. Pharm. Biochem. Behav. 2022, 212, 173313. [Google Scholar] [CrossRef] [PubMed]
- Yasuda, H.; Tsutsui, T. Metallomics analysis for early assessment and individualized intervention of neurodevelopmental disorders. Metallomics 2022, 14, mfac067. [Google Scholar] [CrossRef] [PubMed]
- Ballbè, M.; Fu, M.; Masana, G.; Pérez-Ortuño, R.; Gual, A.; Gil, F.; Olmedo, P.; García-Algar, Ó.; Pascual, J.A.; Fernández, E. Passive exposure to electronic cigarette aerosol in pregnancy: A case study of a family. Environ. Res. 2023, 216 Pt 1, 114490. [Google Scholar] [CrossRef]
- Astolfi, M.L.; Pietris, G.; Mazzei, C.; Marconi, E.; Canepari, S. Element Levels and Predictors of Exposure in the Hair of Ethiopian Children. Int. J. Environ. Res. Public Health. 2020, 17, 8652. [Google Scholar] [CrossRef]
- Chojnacka, K.; Zielińska, A.; Gorecka, H.; Dobrzański, Z.; Gorecki, H. Reference values for hair minerals of Polish students. Environ. Toxicol. Pharmacol. 2010, 29, 314–319. [Google Scholar] [CrossRef]
- Mikulewicz, M.; Chojnacka, K.; Gedrange, T.; Górecki, H. Reference values of elements in human hair: A systematic review. Environ. Toxicol. Pharmacol. 2013, 36, 1077–1086. [Google Scholar] [CrossRef]
- Fido, A.; Al-Saad, S. Toxic trace elements in the hair of children with autism. Autism 2005, 9, 290–298. [Google Scholar] [CrossRef]
- Blaurock-Busch, E.; Amin, O.R.; Rabah, T. Heavy metals and trace elements in hair and urine of a sample of arab children with autistic spectrum disorder. Maedica 2011, 6, 247–257. [Google Scholar]
- Elenge, M.M.; Aubry, J.C.; Jacob, L.; De Brouwer, C. Heavy metal in hair samples of 109 non-industrial (miners) population in Katanga. Sante 2011, 21, 41–46. [Google Scholar] [CrossRef]
- Ferré-Huguet, N.; Nadal, M.; Schuhmacher, M.; Domingo, J.L. Monitoring Metals in Blood and Hair of the Population Living Near a Hazardous Waste Incinerator: Temporal Trend. Biol. Trace Elem. Res. 2009, 128, 191–199. [Google Scholar] [CrossRef] [PubMed]
- Gil, F.; Hernández, A.F.; Márquez, C.; Femia, P.; Olmedo, P.; López-Guarnido, O.; Pla, A. Biomonitorization of cadmium, chromium, manganese, nickel and lead in whole blood, urine, axillary hair and saliva in an occupationally exposed population. Sci. Total Environ. 2011, 409, 1172–1180. [Google Scholar] [CrossRef] [PubMed]
- Carneiro, M.F.; Moresco, M.B.; Chagas, G.R.; de Oliveira Souza, V.C.; Rhoden, C.R.; Barbosa, F., Jr. Assessment of Trace Elements in Scalp Hair of a Young Urban Population in Brazil. Biol. Trace Elem. Res. 2011, 143, 815–824. [Google Scholar] [CrossRef] [PubMed]
- Blaurock-Busch, E.; Amin, O.R.; Dessoki, H.H.; Rabah, T. Toxic Metals and Essential Elements in Hair and Severity of Symptoms among Children with Autism. Maedica 2012, 7, 38–48. [Google Scholar] [PubMed]
- Priya, L.; Geetha, A. Level of Trace Elements (Copper, Zinc, Magnesium and Selenium) and Toxic Elements (Lead and Mercury) in the Hair and Nail of Children with Autism. Biol. Trace Elem. Res. 2011, 142, 148–158. [Google Scholar] [CrossRef] [PubMed]
- Doğan-Sağlamtimur, N.; Kumbur, H. Metals (Hg, Pb, Cu, and Zn) Bioaccumulation in Sediment, Fish, and Human Scalp Hair: A Case Study from the City of Mersin Along the Southern Coast of Turkey. Biol. Trace Elem. Res. 2010, 136, 55–70. [Google Scholar] [CrossRef]
- Garí, M.; Grimalt, J.O.; Torrent, M.; Sunyer, J. Influence of socio-demographic and diet determinants on the levels of mercury in preschool children from a Mediterranean island. Environ. Pollut. 2013, 182, 291–298. [Google Scholar] [CrossRef]
- Díez, S.; Delgado, S.; Aguilera, I.; Astray, J.; Pérez-Gómez, B.; Torrent, M.; Sunyer, J.; Bayona, J. Prenatal and Early Childhood Exposure to Mercury and Methylmercury in Spain, a High-Fish-Consumer Country. Arch. Environ. Contam. Toxicol. 2009, 56, 615–622. [Google Scholar] [CrossRef]
- Freire, C.; Ramos, R.; Lopez-Espinosa, M.J.; Díez, S.; Vioque, J.; Ballester, F.; Fernández, M.F. Hair mercury levels, fish consumption, and cognitive development in preschool children from Granada, Spain. Environ. Res. 2010, 110, 96–104. [Google Scholar] [CrossRef]
- Batista, J.; Schuhmacher, M.; Domingo, J.L.; Corbella, J. Mercury in hair for a child population from Tarragona Province, Spain. Sci. Total Environ. 1996, 193, 143–148. [Google Scholar] [CrossRef]
- Croes, K.; De Coster, S.; De Galan, S.; Morrens, B.; Loots, I.; Van de Mieroop, E.; Nelen, V.; Isabelle Sioen, I.; Bruckers, L.; Nawrot, T.; et al. Health effects in the Flemish population in relation to low levels ofmercury exposure: From organ to transcriptome level. Int. J. Hyg. Environ. Health 2014, 217, 239–247. [Google Scholar] [CrossRef] [PubMed]
- Pesch, A.; Wilhelm, M.; Rostek, U.; Schmitz, N.; Weishoff-Houben, M.; Ranft, U.; Idel, H. Mercury concentrations in urine, scalp hair, and saliva in children from Germany. J. Expo. Anal. Environ. Epidemiol. 2002, 12, 252–258. [Google Scholar] [CrossRef]
- McDowell, M.; Dillon, C.; Osterloh, J.; Bolger, P.M.; Pellizzari, E.; Fernando, R.; Montes de Oca, R.; Schober, S.; Sinks, T.; Jones, R.; et al. Hair Mercury Levels in U.S. Children and Women of Childbearing Age: Reference Range Data from NHANES 1999–2000. Environ. Health Perspect. 2004, 112, 1165–1171. [Google Scholar] [CrossRef] [PubMed]
- Tian, W.; Egeland, G.; Sobol, I.; Chan, H. Mercury hair concentrations and dietary exposure among Inuit preschool children in Nunavut, Canada. Environ. Int. 2011, 37, 42–48. [Google Scholar] [CrossRef]
- Murata, K.; Budtz-Jørgensen, E.; Grandjean, P. Benchmark Dose Calculations for Methylmercury- Associated Delays on Evoked Potential Latencies in Two Cohorts of Children. Risk Anal. 2002, 22, 465–474. [Google Scholar] [CrossRef] [PubMed]
- Cordier, S.; Garel, M.; Mandereau, L.; Morcel, H.; Doineau, P.; Gosme-Seguret, S.; Josse, D.; White, R.; and Amiel-Tison, C. Neurodevelopmental Investigations among Methylmercury-Exposed Children in French Guiana. Environ. Res. Sect. A 2002, 89, 1–11. [Google Scholar] [CrossRef]
- Drasch, G.; Böse-O’Reilly, S.; Beinhoff, C.; Roider, G.; Maydl, S. The Mt. Diwata study on the Philippines 1999 - assessing mercury intoxication of the population by small scale gold mining. Sci. Total Environ. 2001, 267, 151–168. [Google Scholar] [CrossRef]
- 78. Agah, H.; Leermakers, M.; Gao, Y.; Fatemi, S.M.R.; Katal, M.M.; Baeyens, W.; Elskens, M. Mercury accumulation in fish species from the Persian Gulf and in human hair from fishermen. Environ. Monit. Assess. 2010, 169, 203–216. [Google Scholar] [CrossRef]
- Barbosa, A.C.; Jardim, W.; Dórea, J.G.; Fosberg, B.; Souza, J. Hair mercury speciation as a function of gender, age, and body mass index in inhabitants of the Negro River basin, Amazon, Brazil. Arch. Environ. Contam. Toxicol. 2001, 40, 439–444. [Google Scholar]
- (*) UNE (2019) Global Mercury Assessment Technical Background Report 2018. Published 2019. UN Environment. Programme (Geneva, Switzerland). 2023. Available online: https://www.unep.org/resources/publication/global-mercury-assessment-technical-background-report (accessed on 28 April 2023).
- Sanna, E.; De Micco, A.; Vallascas, E. Evaluation of Association between Biomarkers of Lead Exposure in Sardinian Children (Italy). Biol. Trace Elem. Res. 2011, 143, 1383–1392. [Google Scholar] [CrossRef]
- Seifert, B.; Becker, K.; Helm, D.; Krause, C.; Schulz, C.; Seiwert, M. The German Environmental Survey 1990/1992 (GerES II): Reference concentrations of selected environmental pollutants in blood, urine, hair, house dust, drinking water and indoor air. J. Expo. Anal. Environ. Epidemiol. 2000, 10, 552–565. [Google Scholar] [CrossRef] [PubMed]

| 0–4 | 05–09 | 10–14 | Total | |
|---|---|---|---|---|
| Male | 6175 | 5463 | 5848 | 17,486 |
| Female | 5859 | 5247 | 5517 | 16,623 |
| 34,109 |
| Elem. | m/z | LOD | Min–Max | A ± SD | CI 95% | Me | ϒ1 | ϒ2 | K-S (p) |
|---|---|---|---|---|---|---|---|---|---|
| Be | 9 | 0.0003 | 0.000–0.013 | 0.001 ± 0.002 | 0.001–0.001 | 0.000 | 4 | 18 | <0.01 |
| B | 11 | 0.08 | 0.00–15.80 | 2.51 ± 2.03 | 2.31–2.70 | 2.33 | 2 | 8 | <0.01 |
| Na | 23 | 2.8 | 0.0–1077 | 142.7 ± 148.7 | 128–157 | 97.7 | 2 | 8 | <0.01 |
| Mg | 24 | 0.13 | 0.70–355.2 | 28.7 ± 29.8 | 25.9–31.6 | 18.7 | 4 | 34 | <0.01 |
| Al | 27 | 0.39 | 0.00–43.39 | 7.68 ± 7.80 | 6.93–8.43 | 5.98 | 1 | 2 | <0.01 |
| K | 39 | 0.56 | 0.00–315.1 | 34.5 ± 40.9 | 30.6–38.5 | 21 | 3 | 9 | <0.01 |
| Ca | 43 | 0.8 | 0.000–4366 | 406 ± 446 | 363–449 | 278.9 | 4 | 25 | <0.01 |
| V | 51 | 0.0004 | 0.000–6.054 | 0.13 ± 0.346 | 0.097–0.163 | 0.077 | 14 | 219 | <0.01 |
| Cr | 53 | 0.005 | 0.000–17.56 | 0.215 ± 0.978 | 0.121–0.309 | 0.135 | 15 | 248 | <0.01 |
| Mn | 55 | 0.004 | 0.000–1.139 | 0.159 ± 0.145 | 0.15–0.17 | 0.119 | 2 | 8 | <0.01 |
| Fe | 56 | 1.22 | 0.000–69.114 | 9.48 ± 7.34 | 8.7–10.2 | 8.78 | 3 | 14 | <0.01 |
| Co | 59 | 0.001 | 0.000–0.754 | 0.016 ± 0.054 | 0.011–0.022 | 0.006 | 10 | 118 | <0.01 |
| Ni | 60 | 0.005 | 0.000–3.4 | 0.278 ± 0.345 | 0.245–0.311 | 0.216 | 5 | 31 | <0.01 |
| Cu | 63 | 0.05 | 0.700–863.6 | 105.7 ± 126.5 | 94–118 | 67.2 | 3 | 9 | <0.01 |
| Zn | 66 | 0.13 | 10.400–1882 | 483.4 ± 291.8 | 455–511 | 485.5 | 1 | 2 | <0.01 |
| As | 75 | 0.003 | 0.000–2.142 | 0.034 ± 0.118 | 0.022–0.045 | 0.02 | 15 | 254 | <0.01 |
| Se | 82 | 0.05 | 0.020–19.51 | 0.55 ± 1.16 | 0.43–0.66 | 0.48 | 13 | 189 | <0.01 |
| Sr | 88 | 0.02 | 0.000–50.198 | 4.68 ± 4.73 | 4.23–5.14 | 3.14 | 3 | 20 | <0.01 |
| Mo | 95 | 0.001 | 0.000–1.174 | 0.051 ± 0.09 | 0.043–0.060 | 0.039 | 10 | 111 | <0.01 |
| Cd | 107 | 0.002 | 0.000–1.064 | 0.045 ± 0.075 | 0.038–0.052 | 0.025 | 8 | 90 | <0.01 |
| Ba | 111 | 0.002 | 0.000–3.257 | 0.355 ± 0.328 | 0.32–0.39 | 0.289 | 3 | 17 | <0.01 |
| Hg | 137 | 0.003 | 0.014–48.122 | 3.58 ± 4.77 | 3.13–4.04 | 2.09 | 4 | 27 | <0.01 |
| Tl | 205 | 0.0001 | 0.000–0.006 | 0.0003 ± 0.001 | 0.0002–0.0003 | 0.000 | 4 | 25 | <0.01 |
| Pb | 202 | 0.03 | 0.000–55.313 | 2.19 ± 4 | 1.81–2.58 | 1.17 | 8 | 87 | <0.01 |
| Bi | 205 | 0.0001 | 0.000–1.994 | 0.032 ± 0.152 | 0.017–0.046 | 0.005 | 9 | 101 | <0.01 |
| Ag | 208 | 0.003 | 0.000–0.038 | 0.001 ± 0.003 | 0.001–0.001 | 0 | 8 | 76 | <0.01 |
| Au | 209 | 0.0002 | 0.000–1.27 | 0.029 ± 0.118 | 0.018–0.040 | 0 | 7 | 58 | <0.01 |
| U | 238 | --- | --- | --- | --- | -- | -- | -- | --- |
| 5 | 10 | 15 | 25 | 50 | 65 | 75 | 85 | 90 | 95 | |
|---|---|---|---|---|---|---|---|---|---|---|
| Be | 0.000 | 0.000 | 0.000 | 0.000 | 0.000 | 0.000 | 0.001 | 0.002 | 0.002 | 0.004 |
| B | 0.00 | 0.08 | 0.19 | 1.17 | 2.33 | 2.86 | 3.59 | 4.31 | 4.89 | 6.11 |
| Na | 6.0 | 12.1 | 22.3 | 44.2 | 97.7 | 146.3 | 189.3 | 249.1 | 334.7 | 439.6 |
| Mg | 2.5 | 4.2 | 5.9 | 8.6 | 18.7 | 31.2 | 39.9 | 56.3 | 67.8 | 81.9 |
| Al | 0.00 | 0.00 | 0.22 | 0.9 | 5.98 | 8.81 | 11.94 | 14.5 | 18.83 | 24.78 |
| K | 0.2 | 1.8 | 3.6 | 7.3 | 21 | 33.2 | 45.3 | 66 | 82.3 | 114.4 |
| Ca | 23.8 | 42.3 | 71.3 | 127.4 | 278.9 | 422 | 567 | 723.1 | 863.6 | 1133.8 |
| V | 0.007 | 0.014 | 0.02 | 0.032 | 0.077 | 0.118 | 0.151 | 0.196 | 0.237 | 0.314 |
| Cr | 0.00 | 0.00 | 0.00 | 0.024 | 0.135 | 0.177 | 0.199 | 0.242 | 0.279 | 0.357 |
| Mn | 0.006 | 0.017 | 0.032 | 0.067 | 0.119 | 0.163 | 0.211 | 0.292 | 0.345 | 0.45 |
| Fe | 0.42 | 1.08 | 1.97 | 5.4 | 8.78 | 10.85 | 12.72 | 15.1 | 16.9 | 21.27 |
| Co | 0.00 | 0.00 | 0.00 | 0.00 | 0.006 | 0.012 | 0.016 | 0.023 | 0.028 | 0.041 |
| Ni | 0.000 | 0.015 | 0.023 | 0.062 | 0.216 | 0.286 | 0.365 | 0.468 | 0.559 | 0.714 |
| Cu | 3.4 | 5.4 | 7.6 | 16.2 | 67.2 | 98.8 | 142.2 | 201.7 | 266 | 371.1 |
| Zn | 39.5 | 77.5 | 131.9 | 285.9 | 485.5 | 568.5 | 634.6 | 759.9 | 851.1 | 978.3 |
| As | 0.002 | 0.004 | 0.007 | 0.011 | 0.02 | 0.026 | 0.033 | 0.043 | 0.052 | 0.068 |
| Se | 0.04 | 0.08 | 0.14 | 0.36 | 0.48 | 0.53 | 0.56 | 0.61 | 0.65 | 0.79 |
| Sr | 0.3 | 0.5 | 0.69 | 1.24 | 3.14 | 5.31 | 7 | 9.13 | 10.99 | 13.37 |
| Mo | 0.002 | 0.005 | 0.007 | 0.02 | 0.039 | 0.052 | 0.063 | 0.077 | 0.09 | 0.111 |
| Cd | 0.002 | 0.004 | 0.007 | 0.013 | 0.025 | 0.038 | 0.049 | 0.078 | 0.1 | 0.146 |
| Ba | 0.021 | 0.036 | 0.056 | 0.12 | 0.289 | 0.407 | 0.499 | 0.645 | 0.713 | 0.901 |
| Hg | 0.08 | 0.19 | 0.32 | 0.74 | 2.09 | 3.41 | 4.67 | 6.76 | 8.58 | 10.98 |
| Tl | 0.000 | 0.000 | 0.000 | 0.000 | 0.000 | 0.000 | 0.000 | 0.001 | 0.001 | 0.001 |
| Pb | 0.08 | 0.15 | 0.21 | 0.50 | 1.17 | 1.92 | 2.54 | 3.60 | 4.33 | 7.39 |
| Bi | 0.000 | 0.001 | 0.001 | 0.002 | 0.005 | 0.008 | 0.012 | 0.02 | 0.038 | 0.088 |
| Ag | 0.000 | 0.000 | 0.000 | 0.000 | 0.000 | 0.000 | 0.001 | 0.001 | 0.002 | 0.003 |
| Au | 0.000 | 0.000 | 0.000 | 0.000 | 0.000 | 0.000 | 0.000 | 0.006 | 0.066 | 0.171 |
| U | 0.000 | 0.000 | 0.000 | 0.000 | 0.000 | 0.000 | 0.000 | 0.000 | 0.000 | 0.000 |
| Rank Average (Median/Arithmetic Mean in µg/g) | Bivariant Correlation | |||||
|---|---|---|---|---|---|---|
| Elem. | Age 3–6 (n=156) | Age 7–9 (n=162) | Age 10–12 (n=101) | p Value * | Rho Spearman | p * |
| Be | 194 (0.00/0.00) | 213 (0.00/0.001) | 231 (0.00/0.001) | 0.014 | 0.123 | 0.012 |
| B | 197 (2.27/2.32) | 223 (2.42/2.75) | 210 (2.25/2.42) | 0.150 | 0.062 | 0.207 |
| Na | 209 (92/148) | 204 (95/136) | 221 (102/146) | 0.549 | 0.032 | 0.519 |
| Mg | 178 (14/21) | 213 (21/28) | 255 (32/41) | 0.000 | 0.284 | 0.000 |
| Al | 234 (8/10) | 189 (5/6) | 207 (5/7) | 0.004 | −0.143 | 0.003 |
| K | 231 (29/45) | 199 (20/30) | 195 (19/26) | 0.020 | −0.166 | 0.001 |
| Ca | 183 (227/291) | 213 (305/430) | 247 (409/546) | 0.000 | 0.247 | 0.000 |
| V | 217 (0.08/0.11) | 200 (0.07/0.16) | 215 (0.09/0.11) | 0.391 | −0.009 | 0.849 |
| Cr | 211 (0.15/0.24) | 205 (0.13/0.24) | 216 (0.14/0.14) | 0.774 | −0.016 | 0.737 |
| Mn | 245 (0.15/0.21) | 183 (0.11/0.13) | 199 (0.11/0.14) | 0.000 | −0.209 | 0.000 |
| Fe | 226 (9.7/10) | 195 (8.2/9) | 210 (8.2/10) | 0.083 | −0.089 | 0.069 |
| Co | 215 (0.008/0.019) | 193 (0.005/0.016) | 231 (0.008/0.014) | 0.036 | 0.018 | 0.720 |
| Ni | 196 (0.19/0.25) | 210 (0.22/0.30) | 232 (0.25/0.28) | 0.063 | 0.109 | 0.026 |
| Cu | 180 (52/74) | 210 (65/114) | 256 (126/142) | 0.000 | 0.239 | 0.000 |
| Zn | 168 (389/391) | 227 (529/524) | 248 (567/561) | 0.000 | 0.275 | 0.000 |
| As | 246 (0.024/0.035) | 200 (0.019/0.042) | 171 (0.015/0.018) | 0.000 | −0.266 | 0.000 |
| Se | 184 (0.45/0.52) | 221 (0.49/0.60) | 233 (0.51/0.50) | 0.002 | 0.173 | 0.000 |
| Sr | 175 (2.32/3.41) | 214 (3.82/4.72) | 257 (5.44/6.59) | 0.000 | 0.311 | 0.000 |
| Mo | 225 (0.04/0.06) | 204 (0.04/0.05) | 196 (0.04/0.04) | 0.128 | −0.086 | 0.079 |
| Cd | 218 (0.03/0.04) | 203 (0.02/0.04) | 210 (0.03/0.06) | 0.542 | −0.048 | 0.330 |
| Ba | 190 (0.24/0.31) | 209 (0.29/035) | 243 (0.36/0.44) | 0.003 | 0.197 | 0.000 |
| Hg | 212 (2.10/3.70) | 199 (1.79/2.98) | 225 (2.46/4.36) | 0.219 | 0.034 | 0.489 |
| Pb | 223 (1.36/2.54) | 194 (1.08/1.56) | 215 (1.21/2.67) | 0.101 | −0.061 | 0.215 |
| Bi | 244 (0.007/0.037) | 193 (0.004/0.035) | 185 (0.003/0.018) | 0.000 | −0.245 | 0.000 |
| Tl | 203 (0.0002/0.000) | 218 (0.0003/0.000) | 207 (0.0002/0.000) | 0.30 | 0.024 | 0.629 |
| Ag | 225 (0.001/0.000) | 202 (0.001/0.000) | 200 (0.001/0.000) | 0.04 | −0.135 | 0.006 |
| Au | 201 (0.0160.000) | 227 (0.00330.000) | 196 (0.00420.000) | 0.01 | 0.083 | 0.090 |
| U | 210 (0.000/0.000) | 210 (0.000/0.000) | 209 (0.000/0.000) | 0.73 | −0.038 | 0.442 |
| Elem. | Male (n = 202) | Female (n = 217) | p * |
|---|---|---|---|
| Be | 202 (0.001/0.000) | 214 (0.001/0.000) | 0.440 |
| B | 230 (2.5/2.8) | 191 (2.0/2.3) | 0.001 |
| Na | 230 (110/165) | 191 (82/122) | 0.001 |
| Mg | 186 (16/24) | 232 (26/33) | 0.000 |
| Al | 199 (5.5/7.1) | 221 (6.4/8.2) | 0.062 |
| K | 237 (28/41) | 185 (17/29) | 0.000 |
| Ca | 186 (243/326) | 232 (345/481) | 0.000 |
| V | 181 (0.05/0.09) | 237 (0.11/0.17) | 0.000 |
| Cr | 212 (0.14/0.29) | 208 (0.13/0.14) | 0.727 |
| Mn | 218 (0.13/0.17) | 203 (0.12/0.15) | 0.204 |
| Fe | 214 (8.8/9.7) | 206 (8.8/9.9) | 0.534 |
| Co | 185 (0.004/0.014) | 234 (0.010/0.018) | 0.000 |
| Ni | 196 (0.18/0.24) | 223 (0.24/0.31) | 0.026 |
| Cu | 192 (57/87) | 227 (89/123) | 0.003 |
| Zn | 227 (528/527) | 194 (462/443) | 0.005 |
| As | 240 (0.024/0.030) | 182 (0.015/0.037) | 0.000 |
| Se | 213 (0.47/0.48) | 207 (0.48/0.60) | 0.595 |
| Sr | 184 (2.4/3.8) | 234 (4.4/5.5) | 0.000 |
| Mo | 199 (0.04/0.05) | 220 (0.04/0.06) | 0.068 |
| Cd | 209 (0.025/0.046) | 211 (0.026/0.044) | 0.823 |
| Ba | 194 (0.24/0.32) | 225 (0.33/0.39) | 0.007 |
| Hg | 215 (2.1/3.8) | 205 (2.1/3.4) | 0.392 |
| Pb | 210 (1.15/2.42) | 210 (1.17/1.98) | 0.959 |
| Bi | 213 (0.005/0.024) | 207 (0.005/0.038) | 0.609 |
| Tl | 220 (0.000/0.000) | 201 (0.000/0.000) | 0.021 |
| Ag | 193 (0.001/0.000) | 226 (0.001/0.000) | 0.000 |
| Au | 211 (0.031/2.094) | 209 (0.027/0.000) | 0.857 |
| U | 209 (0.000/0.000) | 211 (0.000/0.000) | 0.172 |
| Based on 5–95 PC (µg/g) | Proposal Considering Other Data (µg/g) | |
|---|---|---|
| Be | 0–0.004 | <0.01 |
| B | 0.2–6.1 | <6 |
| Na | 8–440 | 3–600 |
| Mg | 0.4–26 | 4–100 |
| Al | 0.6–26 | <20 |
| K | 2–92 | 2–200 |
| Ca | 35–1100 | 20–1000 |
| V | 0.01–0.28 | <0.4 |
| Cr | 0.01–0.35 | <0.4 |
| Mn | 0.01–0.4 | 0.03–1.1 |
| Fe | 2–21 | 2–20 |
| Co | 0.001–0.04 | <0.04 |
| Ni | 0.02–0.7 | <0.70 |
| Cu | 3–330 | 5–100 |
| Zn | 39–970 | 40–850 |
| As | 0.01–0.06 | <0.1 |
| Se | 0.1–0.8 | 0.1–1 |
| Sr | 0.3–13 | <5 |
| Mo | 0.01–0.1 | <0.1 |
| Cd | 0.003–0.11 | <0.1 |
| Ba | 0.02–0.9 | <0.9 |
| Hg | 0.08–9 | <3 |
| Tl | 0–0.001 | <0.001 |
| Pb | 0.09–5.2 | <2 |
| Bi | 0.001–0.02 | <0.03 |
| Ag | 0–0.01 | <0.01 |
| Au | 0–0.2 | <0.2 |
| U | <0.001 | <0.001 |
Disclaimer/Publisher’s Note: The statements, opinions and data contained in all publications are solely those of the individual author(s) and contributor(s) and not of MDPI and/or the editor(s). MDPI and/or the editor(s) disclaim responsibility for any injury to people or property resulting from any ideas, methods, instructions or products referred to in the content. |
© 2023 by the authors. Licensee MDPI, Basel, Switzerland. This article is an open access article distributed under the terms and conditions of the Creative Commons Attribution (CC BY) license (https://creativecommons.org/licenses/by/4.0/).
Share and Cite
Ruiz, R.; Estevan, C.; Estévez, J.; Alcaide, C.; Sogorb, M.A.; Vilanova, E. Reference Values on Children’s Hair for 28 Elements (Heavy Metals and Essential Elements) Based on a Pilot Study in a Representative Non-Contaminated Local Area. Int. J. Mol. Sci. 2023, 24, 8127. https://doi.org/10.3390/ijms24098127
Ruiz R, Estevan C, Estévez J, Alcaide C, Sogorb MA, Vilanova E. Reference Values on Children’s Hair for 28 Elements (Heavy Metals and Essential Elements) Based on a Pilot Study in a Representative Non-Contaminated Local Area. International Journal of Molecular Sciences. 2023; 24(9):8127. https://doi.org/10.3390/ijms24098127
Chicago/Turabian StyleRuiz, Roberto, Carmen Estevan, Jorge Estévez, Carolina Alcaide, Miguel A. Sogorb, and Eugenio Vilanova. 2023. "Reference Values on Children’s Hair for 28 Elements (Heavy Metals and Essential Elements) Based on a Pilot Study in a Representative Non-Contaminated Local Area" International Journal of Molecular Sciences 24, no. 9: 8127. https://doi.org/10.3390/ijms24098127