
Genome-Wide Association Study Identifies Genetic Polymorphisms Associated with Estimated Minimum Effective Concentration of Fentanyl in Patients Undergoing Laparoscopic-Assisted Colectomy

 , , , and
Abstract
1. Introduction
2. Results
2.1. Impact of Clinical Variables on Estimated MEC of Fentanyl in Subjects Who Underwent LAC
2.2. Identification of Genetic Polymorphisms Associated with Estimated MEC of Fentanyl in Patients Who Underwent LAC by GWAS
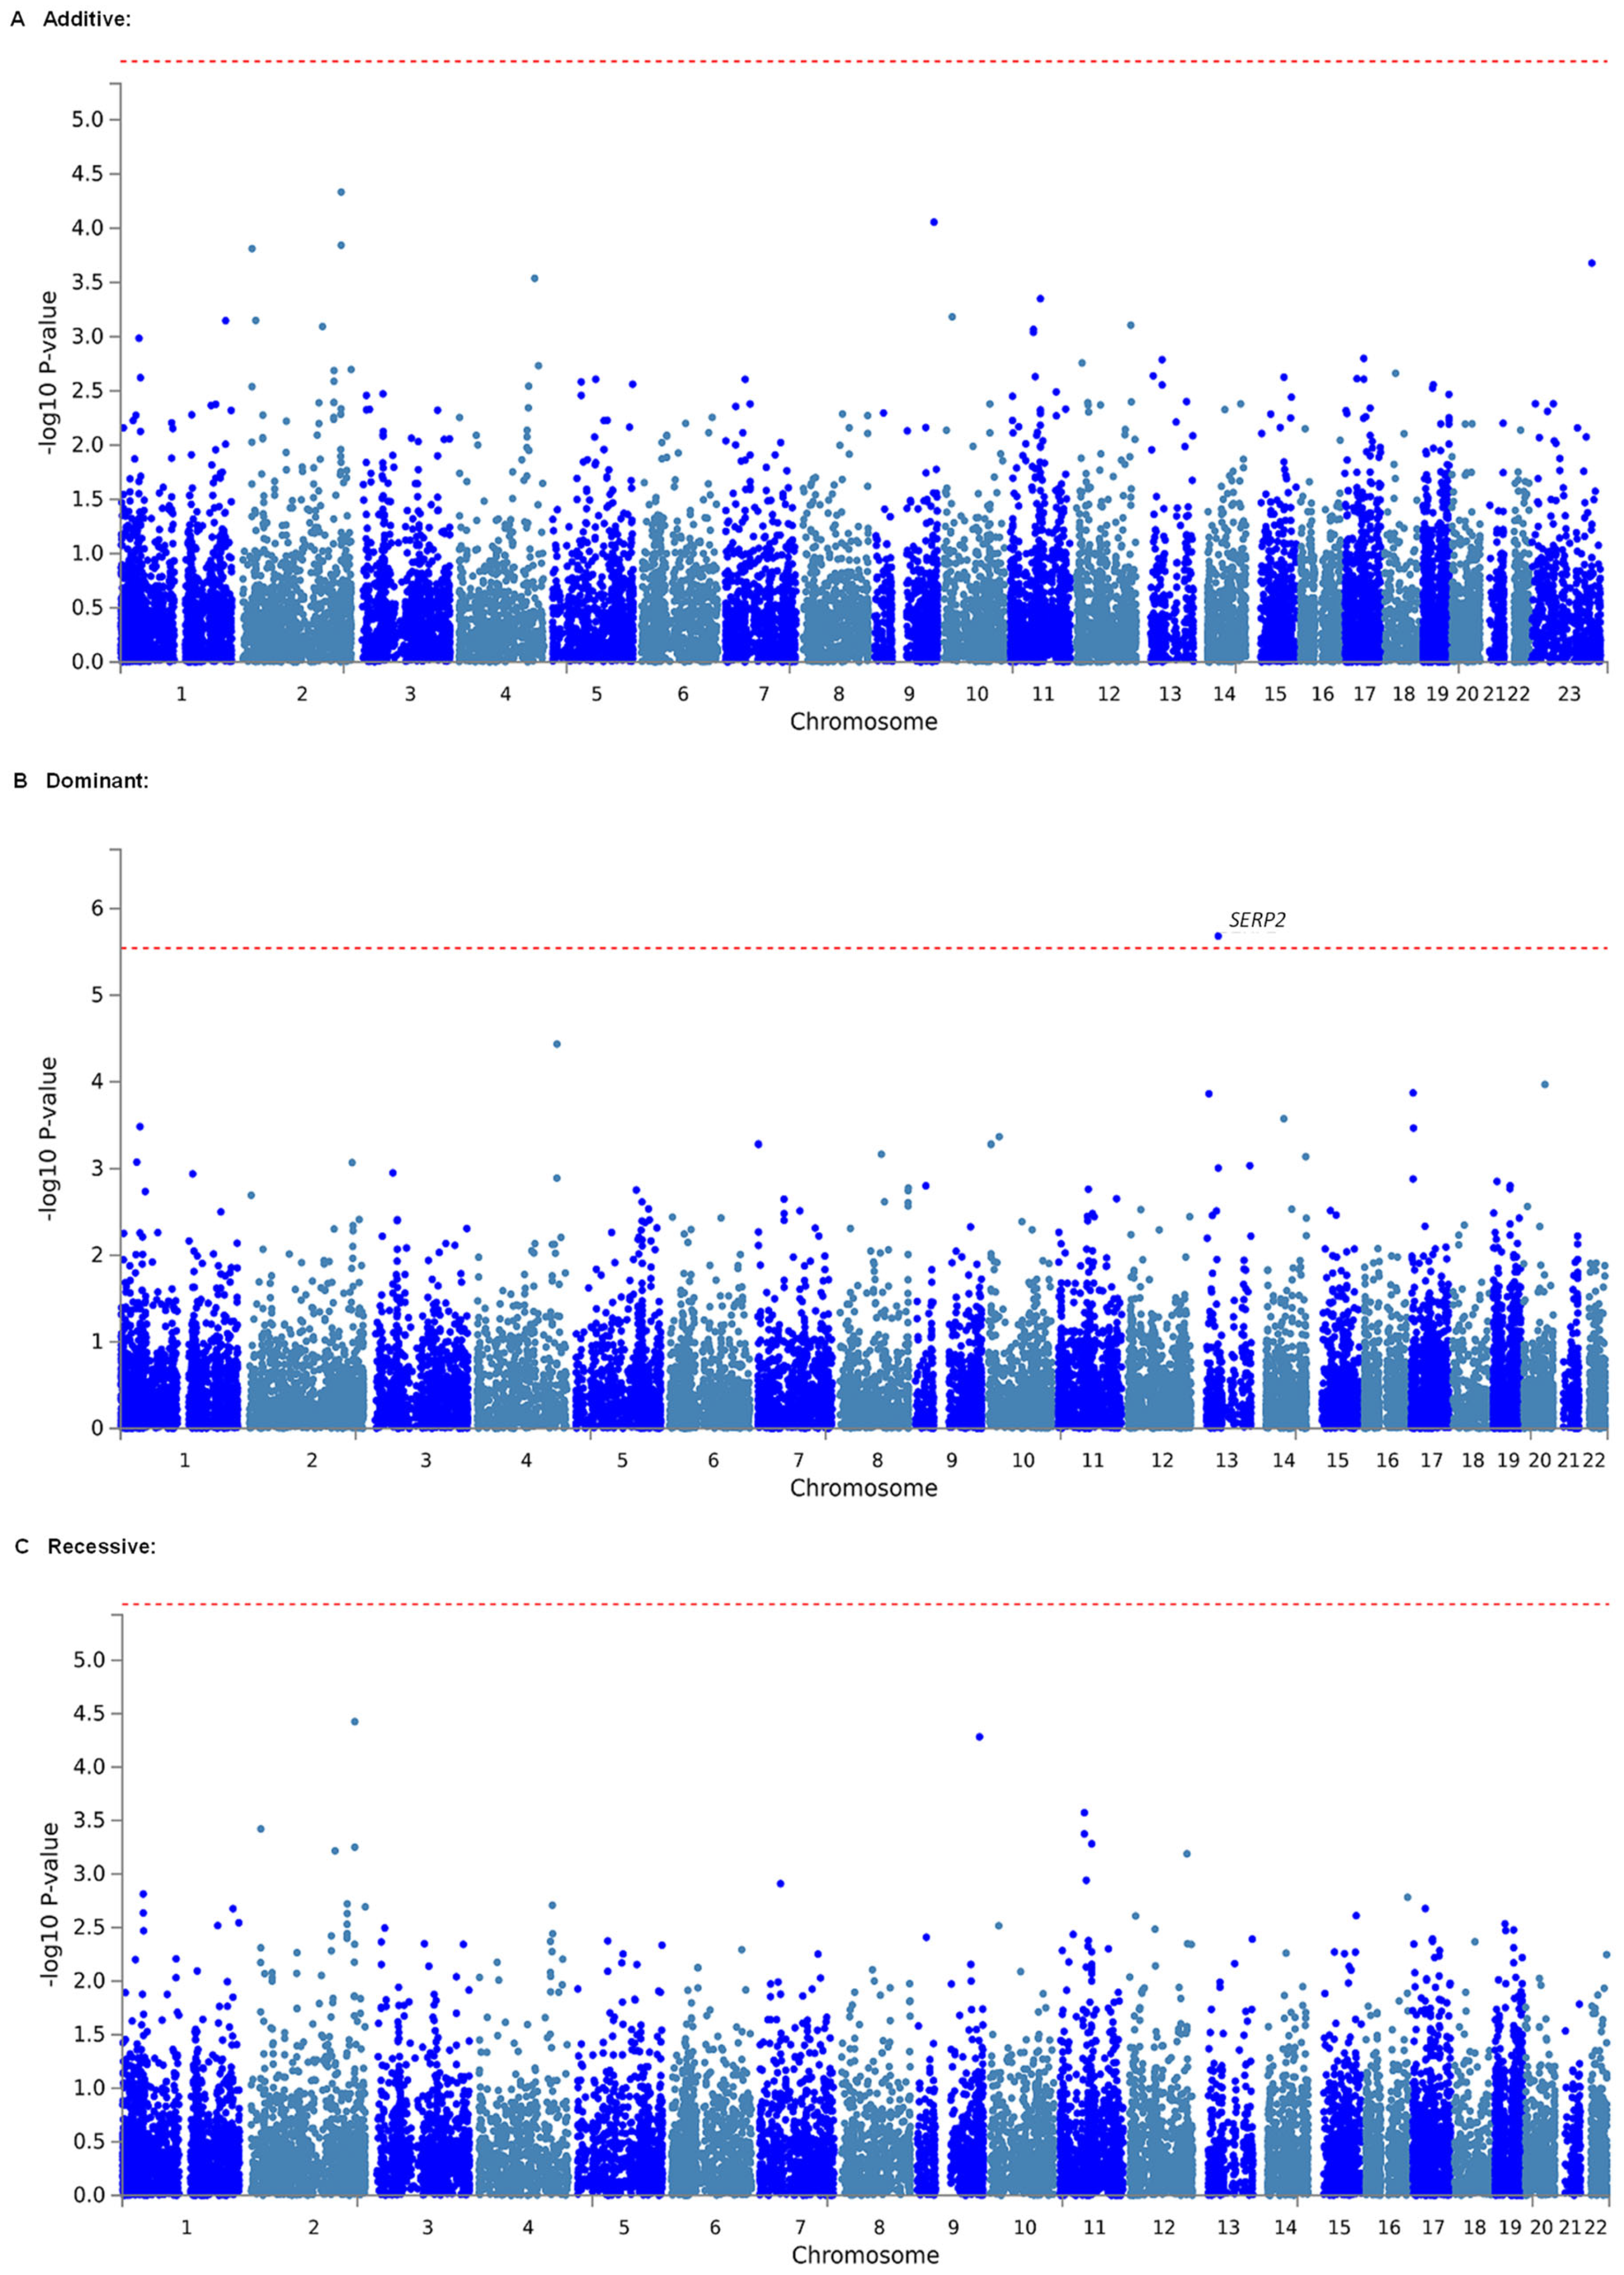
2.3. Identification of Genes and Gene Sets Associated with Estimated MEC of Fentanyl in Patients Who Underwent LAC by Gene-Based and Gene-Set Analyses
3. Discussion
4. Materials and Methods
4.1. Patients
4.1.1. Patients Who Underwent LAC
4.1.2. Surgical Protocol and Clinical Data
4.2. Whole-Genome Genotyping, Quality Control, and Gene-Based and Gene-Set Analyses
4.2.1. Whole-Genome Genotyping and Quality Control
4.2.2. Gene-Based and Gene-Set Analyses
4.3. Statistical Analysis
4.4. Additional in Silico Analysis
4.4.1. Power Analysis
4.4.2. Linkage Disequilibrium Analysis
4.4.3. Reference of Databases
5. Conclusions
Supplementary Materials
Author Contributions
Funding
Institutional Review Board Statement
Informed Consent Statement
Data Availability Statement
Acknowledgments
Conflicts of Interest
References
- Ikeda, K.; Ide, S.; Han, W.; Hayashida, M.; Uhl, G.R.; Sora, I. How individual sensitivity to opiates can be predicted by gene analyses. Trends Pharmacol. Sci. 2005, 26, 311–317. [Google Scholar] [CrossRef] [PubMed]
- Nishizawa, D.; Ikeda, K. Genome-wide association studies and human opioid sensitivity. In The Neuropathology of Drug Addictions and Substance Misuse: Volume 1; Preedy, V.R., Ed.; Foundations of Understanding, Tobacco, Alcohol, Cannabinoids and Opioids; Academic Press: London, UK, 2016; pp. 909–921. [Google Scholar]
- Woodhouse, A.; Mather, L.E. The minimum effective concentration of opioids: A revisitation with patient controlled analgesia fentanyl. Reg. Anesth. Pain Med. 2000, 25, 259–267. [Google Scholar] [CrossRef] [PubMed]
- Gourlay, G.K.; Kowalski, S.R.; Plummer, J.L.; Cousins, M.J.; Armstrong, P.J. Fentanyl blood concentration-analgesic response relationship in the treatment of postoperative pain. Anesth. Analg. 1988, 67, 329–337. [Google Scholar] [CrossRef]
- Bae, J.; Kwon, M.; Lee, Y.H.; Lee, E.K.; Choi, B.M.; Noh, G.J. An allometric pharmacokinetic model and minimum effective analgesic concentration of fentanyl in patients undergoing major abdominal surgery. Br. J. Anaesth. 2020, 125, 976–985. [Google Scholar] [CrossRef] [PubMed]
- Lehmann, K.A.; Heinrich, C.; van Heiss, R. Balanced anesthesia and patient-controlled postoperative analgesia with fentanyl: Minimum effective concentrations, accumulation and acute tolerance. Acta Anaesthesiol. Belg. 1988, 39, 11–23. [Google Scholar]
- Yoshida, K.; Nishizawa, D.; Ide, S.; Ichinohe, T.; Fukuda, K.I.; Ikeda, K. A pharmacogenetics approach to pain management. Neuropsychopharmacol. Rep. 2018, 38, 2–8. [Google Scholar] [CrossRef]
- Angst, M.S.; Phillips, N.G.; Drover, D.R.; Tingle, M.; Galinkin, J.L.; Christians, U.; Swan, G.E.; Lazzeroni, L.C.; Clark, J.D. Opioid pharmacogenomics using a twin study paradigm: Methods and procedures for determining familial aggregation and heritability. Twin Res. Hum. Genet. 2010, 13, 412–425. [Google Scholar] [CrossRef]
- Angst, M.S.; Phillips, N.G.; Drover, D.R.; Tingle, M.; Ray, A.; Swan, G.E.; Lazzeroni, L.C.; Clark, J.D. Pain sensitivity and opioid analgesia: A pharmacogenomic twin study. Pain 2012, 153, 1397–1409. [Google Scholar] [CrossRef]
- Branford, R.; Droney, J.; Ross, J.R. Opioid genetics: The key to personalized pain control? Clin. Genet. 2012, 82, 301–310. [Google Scholar] [CrossRef]
- Droney, J.; Riley, J.; Ross, J. Opioid genetics in the context of opioid switching. Curr. Opin. Support Palliat. Care 2012, 6, 10–16. [Google Scholar] [CrossRef]
- Vuilleumier, P.H.; Stamer, U.M.; Landau, R. Pharmacogenomic considerations in opioid analgesia. Pharmgenom. Pers. Med. 2012, 5, 73–87. [Google Scholar] [CrossRef]
- Kurita, G.P.; Sjogren, P.; Ekholm, O.; Kaasa, S.; Loge, J.H.; Poviloniene, I.; Klepstad, P. Prevalence and predictors of cognitive dysfunction in opioid-treated patients with cancer: A multinational study. J. Clin. Oncol. 2011, 29, 1297–1303. [Google Scholar] [CrossRef]
- Galvan, A.; Fladvad, T.; Skorpen, F.; Gao, X.; Klepstad, P.; Kaasa, S.; Dragani, T.A. Genetic clustering of European cancer patients indicates that opioid-mediated pain relief is independent of ancestry. Pharm. J. 2012, 12, 412–416. [Google Scholar] [CrossRef]
- Hayashida, M.; Nagashima, M.; Satoh, Y.; Katoh, R.; Tagami, M.; Ide, S.; Kasai, S.; Nishizawa, D.; Ogai, Y.; Hasegawa, J.; et al. Analgesic requirements after major abdominal surgery are associated with OPRM1 gene polymorphism genotype and haplotype. Pharmacogenomics 2008, 9, 1605–1616. [Google Scholar] [CrossRef]
- Fukuda, K.; Hayashida, M.; Ide, S.; Saita, N.; Kokita, Y.; Kasai, S.; Nishizawa, D.; Ogai, Y.; Hasegawa, J.; Nagashima, M.; et al. Association between OPRM1 gene polymorphisms and fentanyl sensitivity in patients undergoing painful cosmetic surgery. Pain 2009, 147, 194–201. [Google Scholar] [CrossRef]
- Nishizawa, D.; Nagashima, M.; Katoh, R.; Satoh, Y.; Tagami, M.; Kasai, S.; Ogai, Y.; Han, W.; Hasegawa, J.; Shimoyama, N.; et al. Association between KCNJ6 (GIRK2) gene polymorphisms and postoperative analgesic requirements after major abdominal surgery. PLoS ONE 2009, 4, e7060. [Google Scholar] [CrossRef]
- Nishizawa, D.; Fukuda, K.; Kasai, S.; Hasegawa, J.; Aoki, Y.; Nishi, A.; Saita, N.; Koukita, Y.; Nagashima, M.; Katoh, R.; et al. Genome-wide association study identifies a potent locus associated with human opioid sensitivity. Mol. Psychiatry 2014, 19, 55–62. [Google Scholar] [CrossRef]
- Nishizawa, D.; Fukuda, K.I.; Kasai, S.; Ogai, Y.; Hasegawa, J.; Sato, N.; Yamada, H.; Tanioka, F.; Sugimura, H.; Hayashida, M.; et al. Association between KCNJ6 (GIRK2) gene polymorphism rs2835859 and post-operative analgesia, pain sensitivity, and nicotine dependence. J. Pharmacol. Sci. 2014, 126, 253–263. [Google Scholar] [CrossRef]
- Ide, S.; Nishizawa, D.; Fukuda, K.; Kasai, S.; Hasegawa, J.; Hayashida, M.; Minami, M.; Ikeda, K. Haplotypes of P2RX7 gene polymorphisms are associated with both cold pain sensitivity and analgesic effect of fentanyl. Mol. Pain 2014, 10, 75. [Google Scholar] [CrossRef]
- Aoki, Y.; Nishizawa, D.; Hasegawa, J.; Kasai, S.; Yoshida, K.; Koukita, Y.; Ichinohe, T.; Nagashima, M.; Katoh, R.; Satoh, Y.; et al. Association between the rs1465040 single-nucleotide polymorphism close to the transient receptor potential subfamily C member 3 (TRPC3) gene and postoperative analgesic requirements. J. Pharmacol. Sci. 2015, 127, 391–393. [Google Scholar] [CrossRef]
- Mieda, T.; Nishizawa, D.; Nakagawa, H.; Tsujita, M.; Imanishi, H.; Terao, K.; Yoshikawa, H.; Itoh, K.; Amano, K.; Tashiro, J.; et al. Genome-wide association study identifies candidate loci associated with postoperative fentanyl requirements after laparoscopic-assisted colectomy. Pharmacogenomics 2016, 17, 133–145. [Google Scholar] [CrossRef] [PubMed]
- Amano, K.; Nishizawa, D.; Mieda, T.; Tsujita, M.; Kitamura, A.; Hasegawa, J.; Inada, E.; Hayashida, M.; Ikeda, K. Opposite associations between the rs3845446 single-nucleotide polymorphism of the CACNA1E gene and postoperative pain-related phenotypes in gastrointestinal surgery versus previously reported orthognathic surgery. J. Pain 2016, 17, 1126–1134. [Google Scholar] [CrossRef] [PubMed]
- Muraoka, W.; Nishizawa, D.; Fukuda, K.; Kasai, S.; Hasegawa, J.; Wajima, K.; Nakagawa, T.; Ikeda, K. Association between UGT2B7 gene polymorphisms and fentanyl sensitivity in patients undergoing painful orthognathic surgery. Mol. Pain 2016, 12, 1744806916683182. [Google Scholar] [CrossRef] [PubMed]
- Nishizawa, D.; Mieda, T.; Tsujita, M.; Nakagawa, H.; Yamaguchi, S.; Kasai, S.; Hasegawa, J.; Fukuda, K.I.; Kitamura, A.; Hayashida, M.; et al. Genome-wide scan identifies candidate loci related to remifentanil requirements during laparoscopic-assisted colectomy. Pharmacogenomics 2018, 19, 113–127. [Google Scholar] [CrossRef]
- Takahashi, K.; Nishizawa, D.; Kasai, S.; Koukita, Y.; Fukuda, K.I.; Ichinohe, T.; Ikeda, K. Genome-wide association study identifies polymorphisms associated with the analgesic effect of fentanyl in the preoperative cold pressor-induced pain test. J. Pharmacol. Sci. 2018, 136, 107–113. [Google Scholar] [CrossRef]
- Ohka, S.; Nishizawa, D.; Hasegawa, J.; Takahashi, K.; Nakayama, K.; Ebata, Y.; Fukuda, K.I.; Ikeda, K. Association between rs2275913 single-nucleotide polymorphism of the interleukin-17A gene and perioperative analgesic use in cosmetic orthognathic surgery. Neuropsychopharmacol. Rep. 2018, 38, 67–74. [Google Scholar] [CrossRef]
- Aoki, Y.; Nishizawa, D.; Yoshida, K.; Hasegawa, J.; Kasai, S.; Takahashi, K.; Koukita, Y.; Ichinohe, T.; Hayashida, M.; Fukuda, K.I.; et al. Association between the rs7583431 single nucleotide polymorphism close to the activating transcription factor 2 gene and the analgesic effect of fentanyl in the cold pain test. Neuropsychopharmacol. Rep. 2018, 38, 86–91. [Google Scholar] [CrossRef]
- Inoue, R.; Nishizawa, D.; Hasegawa, J.; Nakayama, K.; Fukuda, K.I.; Ichinohe, T.; Mieda, T.; Tsujita, M.; Nakagawa, H.; Kitamura, A.; et al. Effects of rs958804 and rs7858836 single-nucleotide polymorphisms of the ASTN2 gene on pain-related phenotypes in patients who underwent laparoscopic colectomy and mandibular sagittal split ramus osteotomy. Neuropsychopharmacol. Rep. 2021, 41, 82–90. [Google Scholar] [CrossRef]
- Nishizawa, D.; Iseki, M.; Arita, H.; Hanaoka, K.; Yajima, C.; Kato, J.; Ogawa, S.; Hiranuma, A.; Kasai, S.; Hasegawa, J.; et al. Genome-wide association study identifies candidate loci associated with chronic pain and postherpetic neuralgia. Mol. Pain 2021, 17, 1744806921999924. [Google Scholar] [CrossRef]
- Kasai, S.; Nishizawa, D.; Hasegawa, J.; Fukuda, K.I.; Ichinohe, T.; Nagashima, M.; Hayashida, M.; Ikeda, K. Short tandem repeat variation in the CNR1 gene associated with analgesic requirements of opioids in postoperative pain management. Front. Genet. 2022, 13, 815089. [Google Scholar] [CrossRef]
- Nishizawa, D.; Nagashima, M.; Kasai, S.; Hasegawa, J.; Nakayama, K.; Ebata, Y.; Fukuda, K.I.; Ichinohe, T.; Hayashida, M.; Ikeda, K. Associations between the C3orf20 rs12496846 polymorphism and both postoperative analgesia after orthognathic and abdominal surgeries and C3orf20 gene expression in the brain. Pharmaceutics 2022, 14, 727. [Google Scholar] [CrossRef]
- Nishizawa, D.; Terui, T.; Ishitani, K.; Kasai, S.; Hasegawa, J.; Nakayama, K.; Ebata, Y.; Ikeda, K. Genome-wide association study identifies candidate loci associated with opioid analgesic requirements in the treatment of cancer pain. Cancers 2022, 14, 4692. [Google Scholar] [CrossRef]
- Shafer, S.L.; Gregg, K.M. Algorithms to rapidly achieve and maintain stable drug concentrations at the site of drug effect with a computer-controlled infusion pump. J. Pharmacokinet. Biopharm. 1992, 20, 147–169. [Google Scholar] [CrossRef]
- Slepchenko, G.; Simon, N.; Goubaux, B.; Levron, J.C.; Le Moing, J.P.; Raucoules-Aimé, M. Performance of target-controlled sufentanil infusion in obese patients. Anesthesiology 2003, 98, 65–73. [Google Scholar] [CrossRef]
- Iwakiri, H.; Nagata, O.; Matsukawa, T.; Ozaki, M.; Sessler, D.I. Effect-site concentration of propofol for recovery of consciousness is virtually independent of fentanyl effect-site concentration. Anesth. Analg. 2003, 96, 1651–1655. [Google Scholar] [CrossRef]
- Johnson, K.B.; Syroid, N.D.; Gupta, D.K.; Manyam, S.C.; Egan, T.D.; Huntington, J.; White, J.L.; Tyler, D.; Westenskow, D.R. An evaluation of remifentanil propofol response surfaces for loss of responsiveness, loss of response to surrogates of painful stimuli and laryngoscopy in patients undergoing elective surgery. Anesth. Analg. 2008, 106, 471–479. [Google Scholar] [CrossRef]
- Kodaka, M.; Tsukakoshi, M.; Miyao, H.; Tsuzaki, K.; Ichikawa, J.; Komori, M. The fentanyl concentration required for immobility under propofol anesthesia is reduced by pre-treatment with flurbiprofen axetil. Can. J. Anaesth. 2013, 60, 1204–1211. [Google Scholar] [CrossRef]
- Chiou, Y.W.; Ting, C.K.; Wang, H.Y.; Tsou, M.Y.; Chang, W.K. Enhanced recovery after surgery: Prediction for early extubation in video-assisted thoracic surgery using a response surface model in anesthesia. J. Formos. Med. Assoc. 2019, 118, 1450–1457. [Google Scholar] [CrossRef]
- Masui, K.; Kazama, T. Pharmacokinetic simulation and pharmacokinetic model. J. Clin. Anesth. 2010, 34, 445–455. [Google Scholar]
- Hayashi, K.; Tsuchida, K.; Masui, K.; Sawa, T. The management of intravenous patient-controlled analgesia with simulations based on the pharmacokinetics and pharmacodynamics of fentanyl. J. Jpn. Soc. Clin. Anesth. 2012, 32, 814–820. [Google Scholar] [CrossRef]
- Shiota, T.; Kawanishi, H.; Inoue, S.; Egawa, J.; Kawaguchi, M. Risk factors for bradypnea in a historical cohort of surgical patients receiving fentanyl-based intravenous analgesia. JA Clin. Rep. 2018, 4, 46. [Google Scholar] [CrossRef] [PubMed]
- de Leeuw, C.A.; Mooij, J.M.; Heskes, T.; Posthuma, D. MAGMA: Generalized gene-set analysis of GWAS data. PLoS Comput. Biol. 2015, 11, e1004219. [Google Scholar] [CrossRef] [PubMed]
- Watanabe, K.; Taskesen, E.; van Bochoven, A.; Posthuma, D. Functional mapping and annotation of genetic associations with FUMA. Nat. Commun. 2017, 8, 1826. [Google Scholar] [CrossRef] [PubMed]
- Shibutani, K.; Inchiosa, M.A., Jr.; Sawada, K.; Bairamian, M. Accuracy of pharmacokinetic models for predicting plasma fentanyl concentrations in lean and obese surgical patients: Derivation of dosing weight (“pharmacokinetic mass”). Anesthesiology 2004, 101, 603–613. [Google Scholar] [CrossRef]
- Fujita, Y.; Yoshizawa, S.; Hoshika, M.; Inoue, K.; Matsushita, S.; Oka, H.; Sobue, K. Effect of different surgical procedures on the accuracy of prediction of the plasma concentration of fentanyl: Comparison between mastectomy and laparoscopic prostatectomy. JA Clin. Rep. 2017, 3, 30. [Google Scholar] [CrossRef]
- Flores, J.A.; El Banoua, F.; Galan-Rodriguez, B.; Fernandez-Espejo, E. Opiate anti-nociception is attenuated following lesion of large dopamine neurons of the periaqueductal grey: Critical role for D1 (not D2) dopamine receptors. Pain 2004, 110, 205–214. [Google Scholar] [CrossRef]
- Kiritsy-Roy, J.A.; Standish, S.M.; Terry, L.C. Dopamine D-1 and D-2 receptor antagonists potentiate analgesic and motor effects of morphine. Pharmacol. Biochem. Behav. 1989, 32, 717–721. [Google Scholar] [CrossRef]
- Rodgers, H.M.; Yow, J.; Evans, E.; Clemens, S.; Brewer, K.L. Dopamine D1 and D3 receptor modulators restore morphine analgesia and prevent opioid preference in a model of neuropathic pain. Neuroscience 2019, 406, 376–388. [Google Scholar] [CrossRef]
- Morgan, M.J.; Franklin, K.B. Dopamine receptor subtypes and formalin test analgesia. Pharmacol. Biochem. Behav. 1991, 40, 317–322. [Google Scholar] [CrossRef]
- Ward, L.D.; Kellis, M. HaploReg: A resource for exploring chromatin states, conservation, and regulatory motif alterations within sets of genetically linked variants. Nucleic Acids Res. 2012, 40, D930–D934. [Google Scholar] [CrossRef]
- Xu, Z.; Taylor, J.A. SNPinfo: Integrating GWAS and candidate gene information into functional SNP selection for genetic association studies. Nucleic Acids Res. 2009, 37, W600–W605. [Google Scholar] [CrossRef]
- GTEx Consortium. The Genotype-Tissue Expression (GTEx) project. Nat. Genet. 2013, 45, 580–585. [Google Scholar] [CrossRef]
- Man, M.; Close, S.L.; Shaw, A.D.; Bernard, G.R.; Douglas, I.S.; Kaner, R.J.; Payen, D.; Vincent, J.L.; Fossceco, S.; Janes, J.M.; et al. Beyond single-marker analyses: Mining whole genome scans for insights into treatment responses in severe sepsis. Pharm. J. 2013, 13, 218–226. [Google Scholar] [CrossRef]
- Lundin, C.; Hjorth, L.; Behrendtz, M.; Nordgren, A.; Palmqvist, L.; Andersen, M.K.; Biloglav, A.; Forestier, E.; Paulsson, K.; Johansson, B. High frequency of BTG1 deletions in acute lymphoblastic leukemia in children with down syndrome. Genes Chromosomes Cancer 2012, 51, 196–206. [Google Scholar] [CrossRef]
- Safavi, S.; Hansson, M.; Karlsson, K.; Biloglav, A.; Johansson, B.; Paulsson, K. Novel gene targets detected by genomic profiling in a consecutive series of 126 adults with acute lymphoblastic leukemia. Haematologica 2015, 100, 55–61. [Google Scholar] [CrossRef]
- Shi, N.; Feng, D.; Gu, Y.; Zheng, C.; Miao, M. TUSC8 enhances cisplatin sensitivity of NSCLC cells through regulating VEGFA. J. BUON 2021, 26, 336–344. [Google Scholar]
- Mahbuba, W.; Lambert, D.G. Opioids and neovascularization: Pro or anti? Br. J. Anaesth. 2015, 115, 821–824. [Google Scholar] [CrossRef]
- Gupta, K.; Kshirsagar, S.; Chang, L.; Schwartz, R.; Law, P.Y.; Yee, D.; Hebbel, R.P. Morphine stimulates angiogenesis by activating proangiogenic and survival-promoting signaling and promotes breast tumor growth. Cancer Res. 2002, 62, 4491–4498. [Google Scholar]
- Suri, C.; Jones, P.F.; Patan, S.; Bartunkova, S.; Maisonpierre, P.C.; Davis, S.; Sato, T.N.; Yancopoulos, G.D. Requisite role of angiopoietin-1, a ligand for the TIE2 receptor, during embryonic angiogenesis. Cell 1996, 87, 1171–1180. [Google Scholar] [CrossRef]
- Shafer, S.L.; Varvel, J.R.; Aziz, N.; Scott, J.C. Pharmacokinetics of fentanyl administered by computer-controlled infusion pump. Anesthesiology 1990, 73, 1091–1102. [Google Scholar] [CrossRef]
- Subramanian, A.; Tamayo, P.; Mootha, V.K.; Mukherjee, S.; Ebert, B.L.; Gillette, M.A.; Paulovich, A.; Pomeroy, S.L.; Golub, T.R.; Lander, E.S.; et al. Gene set enrichment analysis: A knowledge-based approach for interpreting genome-wide expression profiles. Proc. Natl. Acad. Sci. USA 2005, 102, 15545–15550. [Google Scholar] [CrossRef] [PubMed]
- Nishizawa, D.; Kasai, S.; Hasegawa, J.; Sato, N.; Yamada, H.; Tanioka, F.; Nagashima, M.; Katoh, R.; Satoh, Y.; Tagami, M.; et al. Associations between the orexin (hypocretin) receptor 2 gene polymorphism Val308Ile and nicotine dependence in genome-wide and subsequent association studies. Mol. Brain 2015, 8, 50. [Google Scholar] [CrossRef] [PubMed]
- Benjamini, Y.; Hochberg, Y. Controlling the false discovery rate: A practical and powerful approach to multiple testing. J. R. Stat. Soc. B 1995, 57, 289–300. [Google Scholar] [CrossRef]
- Storey, J. The positive False Discovery Rate: A Bayesian interpretation and the q-value. Ann. Statist. 2001, 31, 2013–2035. [Google Scholar] [CrossRef]
- Sun, L.; Craiu, R.V.; Paterson, A.D.; Bull, S.B. Stratified false discovery control for large-scale hypothesis testing with application to genome-wide association studies. Genet. Epidemiol. 2006, 30, 519–530. [Google Scholar] [CrossRef]
- Purcell, S.; Neale, B.; Todd-Brown, K.; Thomas, L.; Ferreira, M.A.; Bender, D.; Maller, J.; Sklar, P.; de Bakker, P.I.; Daly, M.J.; et al. PLINK: A tool set for whole-genome association and population-based linkage analyses. Am. J. Hum. Genet. 2007, 81, 559–575. [Google Scholar] [CrossRef]
- Barrett, J.C.; Fry, B.; Maller, J.; Daly, M.J. Haploview: Analysis and visualization of LD and haplotype maps. Bioinformatics 2005, 21, 263–265. [Google Scholar] [CrossRef]
- Faul, F.; Erdfelder, E.; Lang, A.G.; Buchner, A. G*Power 3: A flexible statistical power analysis program for the social, behavioral, and biomedical sciences. Behav. Res. Methods 2007, 39, 175–191. [Google Scholar] [CrossRef]
- Cohen, J. Statistical Power Analysis for the Behavioral Sciences (Revised Edition); Academic Press: New York, NY, USA, 1977. [Google Scholar]
- Gabriel, S.B.; Schaffner, S.F.; Nguyen, H.; Moore, J.M.; Roy, J.; Blumenstiel, B.; Higgins, J.; DeFelice, M.; Lochner, A.; Faggart, M.; et al. The structure of haplotype blocks in the human genome. Science 2002, 296, 2225–2229. [Google Scholar] [CrossRef]


| Model | Rank | SNP | CHR | Position | 1st Stage | 2nd Stage | Final Stage | Combined | Related Gene | ||||||||||
|---|---|---|---|---|---|---|---|---|---|---|---|---|---|---|---|---|---|---|---|
| β | p | β | p | β | p | q | β | p | |||||||||||
| Additive | 1 | rs966775 | 5 | 174,763,322 | 0.09569 | 0.004531 | 0.07693 | 0.03027 | 0.09776 | 0.0001217 | 0.0487 * | 0.09157 | 0.0000001027 | (DRD1) | |||||
| Additive | 2 | rs6041532 | 20 | 12,652,435 | 0.2314 | 0.00159 | 0.1561 | 0.0334 | 0.2568 | 0.01035 | 0.4232 | 0.2003 | 0.000009788 | - | |||||
| Additive | 3 | rs9354118 | 6 | 95,147,902 | 0.05395 | 0.02689 | 0.06611 | 0.01174 | 0.06085 | 0.02056 | 0.5427 | 0.06091 | 0.00002527 | - | |||||
| Additive | 4 | rs9342409 | 6 | 95,098,682 | 0.05264 | 0.02903 | 0.06602 | 0.01574 | 0.05802 | 0.02816 | - | 0.06005 | 0.00004037 | - | |||||
| Additive | 5 | rs4806716 | 19 | 54,639,868 | −0.05613 | 0.02562 | −0.06506 | 0.02383 | −0.06482 | 0.01373 | 0.4577 | −0.06019 | 0.00006081 | - | |||||
| Additive | 6 | rs43211 | 19 | 54,652,203 | −0.05488 | 0.02417 | −0.08097 | 0.005927 | −0.05655 | 0.03242 | 0.6175 | −0.05957 | 0.00006086 | CNOT3 | |||||
| Additive | 7 | rs9363197 | 6 | 95,104,559 | 0.05395 | 0.02689 | 0.05782 | 0.03145 | 0.05802 | 0.02816 | - | 0.05795 | 0.00006976 | - | |||||
| Additive | 8 | rs4764074 | 12 | 14,428,118 | −0.08212 | 0.01157 | −0.05914 | 0.04189 | −0.05778 | 0.04175 | 0.7207 | −0.06609 | 0.0000889 | - | |||||
| Additive | 9 | rs2676289 | 17 | 62,705,738 | −0.1448 | 0.04901 | −0.08609 | 0.03379 | −0.1407 | 0.005126 | 0.4232 | −0.1114 | 0.00008892 | - | |||||
| Additive | 10 | rs2759632 | 10 | 10,218,843 | −0.09777 | 0.02416 | −0.09776 | 0.04 | −0.09442 | 0.01637 | 0.4926 | −0.09548 | 0.00009947 | - | |||||
| Additive | 11 | rs1016214 | 20 | 16,992,615 | 0.1305 | 0.02942 | 0.2103 | 0.04618 | 0.1138 | 0.006869 | 0.4232 | 0.124 | 0.0001183 | - | |||||
| Additive | 12 | rs452325 | 8 | 88,505,366 | 0.06272 | 0.01896 | 0.06914 | 0.02194 | 0.05307 | 0.04622 | - | 0.05799 | 0.0001731 | - | |||||
| Additive | 13 | rs936229 | 15 | 75,132,319 | 0.07303 | 0.02838 | 0.06454 | 0.02857 | 0.06169 | 0.04701 | 0.7207 | 0.06311 | 0.0003549 | ULK3 | |||||
| Additive | 14 | rs652930 | 1 | 201,628,577 | 0.091 | 0.03362 | 0.1072 | 0.02579 | 0.183 | 0.009896 | 0.4232 | 0.1015 | 0.0003897 | NAV1 | |||||
| Dominant | 1 | rs6502266 | 17 | 13,395,720 | 0.1232 | 0.001448 | 0.1076 | 0.005443 | 0.08215 | 0.02588 | 0.4925 | 0.1004 | 0.000002452 | - | |||||
| Dominant | 2 | rs9889837 | 17 | 13,392,473 | 0.1232 | 0.001448 | 0.1076 | 0.005443 | 0.07843 | 0.03363 | - | 0.09947 | 0.000003073 | - | |||||
| Dominant | 3 | rs6481157 | 10 | 57,099,471 | −0.1346 | 0.0009998 | −0.0775 | 0.04471 | −0.08874 | 0.01887 | 0.4925 | −0.0947 | 0.00001424 | - | |||||
| Dominant | 4 | rs17738087 | 15 | 26,905,021 | −0.1148 | 0.009143 | −0.1091 | 0.01244 | −0.09608 | 0.01112 | 0.4925 | −0.1004 | 0.00002 | GABRB3 | |||||
| Dominant | 5 | rs17081058 | 13 | 25,267,734 | −0.09808 | 0.01557 | −0.09338 | 0.02287 | −0.08478 | 0.03985 | 0.4925 | −0.0972 | 0.0000271 | ATP12A | |||||
| Dominant | 6 | rs1195916 | 12 | 131,503,109 | 0.08309 | 0.04349 | 0.07868 | 0.04677 | 0.1225 | 0.003758 | 0.4925 | 0.09485 | 0.00003543 | GPR133 | |||||
| Dominant | 7 | rs172399 | 7 | 9,154,302 | 0.1075 | 0.007509 | 0.08153 | 0.0404 | 0.08112 | 0.0266 | 0.4925 | 0.08836 | 0.00005485 | - | |||||
| Dominant | 8 | rs13278423 | 8 | 87,720,419 | −0.1184 | 0.00618 | −0.09612 | 0.02496 | −0.08617 | 0.03348 | 0.4925 | −0.09586 | 0.00006912 | CNGB3 | |||||
| Dominant | 9 | rs1160226 | 13 | 25,271,434 | −0.08072 | 0.04288 | −0.09013 | 0.02275 | −0.07819 | 0.03853 | 0.4925 | −0.08602 | 0.00009199 | ATP12A | |||||
| Dominant | 10 | rs3133206 | 18 | 57,237,478 | 0.08225 | 0.04547 | 0.09069 | 0.02442 | 0.09395 | 0.01793 | 0.4925 | 0.08851 | 0.00009607 | CCBE1 | |||||
| Dominant | 11 | rs4963573 | 12 | 24,662,116 | −0.09225 | 0.01659 | −0.07917 | 0.03853 | −0.0841 | 0.02294 | 0.4925 | −0.0828 | 0.0001084 | SOX5 | |||||
| Dominant | 12 | rs28350 | 3 | 42,418,446 | 0.1126 | 0.04845 | 0.129 | 0.02853 | 0.1208 | 0.01785 | 0.4925 | 0.1212 | 0.0001187 | - | |||||
| Dominant | 13 | rs10956972 | 8 | 87,768,331 | 0.1033 | 0.01486 | 0.08581 | 0.03306 | 0.1052 | 0.01004 | - | 0.08923 | 0.0001351 | - | |||||
| Dominant | 14 | rs1982563 | 8 | 87,776,019 | 0.1033 | 0.01486 | 0.08581 | 0.03306 | 0.1052 | 0.01004 | 0.4925 | 0.08923 | 0.0001351 | - | |||||
| Dominant | 15 | rs4940475 | 18 | 57,311,314 | 0.08404 | 0.04074 | 0.09424 | 0.02218 | 0.08181 | 0.03923 | - | 0.08696 | 0.0001466 | CCBE1 | |||||
| Dominant | 16 | rs5766289 | 22 | 45,408,177 | −0.08004 | 0.03874 | −0.08407 | 0.02975 | −0.0916 | 0.01366 | 0.4925 | −0.08221 | 0.0001498 | - | |||||
| Dominant | 17 | rs1864309 | 18 | 57,309,059 | 0.08404 | 0.04074 | 0.09367 | 0.02112 | 0.08181 | 0.03923 | - | 0.08604 | 0.0001602 | CCBE1 | |||||
| Dominant | 18 | rs1027804 | 8 | 18,919,857 | −0.08584 | 0.03366 | −0.07961 | 0.04826 | −0.1072 | 0.005536 | 0.4925 | −0.0851 | 0.0001687 | - | |||||
| Dominant | 19 | rs7592517 | 2 | 76,777,279 | 0.1278 | 0.002637 | 0.08475 | 0.03565 | 0.07594 | 0.04886 | - | 0.08143 | 0.0002555 | - | |||||
| Dominant | 20 | rs2139502 | 2 | 76,786,845 | 0.1278 | 0.002637 | 0.08475 | 0.03565 | 0.07594 | 0.04886 | 0.4925 | 0.08143 | 0.0002555 | - | |||||
| Dominant | 21 | exm−rs10873636 | 15 | 26,888,978 | −0.09977 | 0.02877 | −0.09658 | 0.03058 | −0.07793 | 0.04325 | - | −0.08463 | 0.0003904 | GABRB3 | |||||
| Dominant | 22 | rs10873636 | 15 | 26,888,978 | −0.09977 | 0.02877 | −0.09658 | 0.03058 | −0.07793 | 0.04325 | - | −0.08463 | 0.0003904 | GABRB3 | |||||
| Dominant | 23 | rs1863459 | 15 | 26,892,676 | −0.09977 | 0.02877 | −0.09658 | 0.03058 | −0.07793 | 0.04325 | 0.4925 | −0.08463 | 0.0003904 | GABRB3 | |||||
| Dominant | 24 | rs6667463 | 1 | 175,518,442 | −0.08513 | 0.03978 | −0.115 | 0.01136 | −0.08208 | 0.04367 | 0.4925 | −0.0833 | 0.0004116 | TNR | |||||
| Dominant | 25 | rs12580224 | 12 | 71,086,426 | 0.1011 | 0.01189 | 0.08249 | 0.04176 | 0.07857 | 0.04728 | 0.4925 | 0.07887 | 0.0004391 | PTPRR | |||||
| Dominant | 26 | rs11945758 | 4 | 118,667,234 | 0.09923 | 0.0248 | 0.09422 | 0.02897 | 0.088 | 0.02815 | 0.4925 | 0.08344 | 0.0004876 | - | |||||
| Recessive | 1 | rs966775 | 5 | 174,763,322 | 0.1704 | 0.008618 | 0.1598 | 0.01971 | 0.1655 | 0.0005068 | 0.2027 | 0.1657 | 0.0000004313 | (DRD1) | |||||
| Recessive | 2 | rs6041532 | 20 | 12,652,435 | 0.4645 | 0.001396 | 0.3096 | 0.03374 | 0.5211 | 0.008986 | 0.3114 | 0.4019 | 0.000008521 | - | |||||
| Recessive | 3 | rs9354118 | 6 | 95,147,902 | 0.09027 | 0.03077 | 0.09682 | 0.03613 | 0.1358 | 0.001557 | 0.3116 | 0.1064 | 0.0000166 | - | |||||
| Recessive | 4 | rs9342409 | 6 | 95,098,682 | 0.08627 | 0.03752 | 0.09933 | 0.04201 | 0.1358 | 0.001557 | 0.3865 | 0.1067 | 0.00002053 | - | |||||
| Recessive | 5 | rs43211 | 19 | 54,652,203 | −0.08789 | 0.04048 | −0.1426 | 0.009216 | −0.1305 | 0.005266 | 0.3116 | −0.1106 | 0.00003108 | CNOT3 | |||||
| Recessive | 6 | rs4764074 | 12 | 14,428,118 | −0.149 | 0.01646 | −0.1074 | 0.04912 | −0.1277 | 0.01546 | 0.3116 | −0.1258 | 0.00007724 | - | |||||
| Recessive | 7 | rs2759632 | 10 | 10,218,843 | −0.1855 | 0.03017 | −0.1941 | 0.03807 | −0.2034 | 0.009063 | 0.693 | −0.1905 | 0.00008301 | - | |||||
| Recessive | 8 | rs2146423 | 9 | 4,657,040 | 0.1379 | 0.01801 | 0.1222 | 0.03914 | 0.1779 | 0.004626 | 0.3116 | 0.1307 | 0.0001066 | C9orf68 | |||||
| Recessive | 9 | rs12714409 | 2 | 596,532 | 0.09831 | 0.03269 | 0.1058 | 0.03244 | 0.1182 | 0.01311 | 0.3746 | 0.1038 | 0.0001265 | - | |||||
| Recessive | 10 | rs2642589 | 10 | 71,513,647 | 0.2137 | 0.0422 | 0.1943 | 0.03691 | 0.2436 | 0.03985 | - | 0.2132 | 0.000292 | - | |||||
| Model | Rank | SNP | CHR | Position | 1st Stage | 2nd Stage | Final Stage | Combined | Related Gene | ||||||||||
|---|---|---|---|---|---|---|---|---|---|---|---|---|---|---|---|---|---|---|---|
| β | p | β | p | β | p | q | β | p | |||||||||||
| Additive | 1 | rs966775 | 5 | 174,763,322 | 0.1089 | 0.004956 | 0.09541 | 0.02628 | 0.1153 | 0.0001176 | 0.0487 * | 0.1071 | 0.0000001299 | (DRD1) | |||||
| Additive | 2 | rs6041532 | 20 | 12,652,435 | 0.2568 | 0.002112 | 0.1767 | 0.04689 | 0.2887 | 0.01417 | 0.5852 | 0.2257 | 0.00002233 | - | |||||
| Additive | 3 | rs9354118 | 6 | 95,147,902 | 0.05787 | 0.03746 | 0.07979 | 0.01181 | 0.07682 | 0.01282 | 0.5852 | 0.07173 | 0.00002448 | - | |||||
| Additive | 4 | rs9342409 | 6 | 95,098,682 | 0.05643 | 0.04045 | 0.08091 | 0.01476 | 0.07346 | 0.01801 | - | 0.0711 | 0.00003707 | - | |||||
| Additive | 5 | rs452325 | 8 | 88,505,366 | 0.08469 | 0.005179 | 0.07778 | 0.03335 | 0.06598 | 0.03512 | - | 0.07321 | 0.00005313 | - | |||||
| Additive | 6 | rs391916 | 8 | 88,512,286 | 0.08987 | 0.003892 | 0.07335 | 0.04768 | 0.07024 | 0.03155 | - | 0.07531 | 0.00005547 | - | |||||
| Additive | 7 | rs9363197 | 6 | 95,104,559 | 0.05787 | 0.03746 | 0.07095 | 0.02872 | 0.07346 | 0.01801 | - | 0.06866 | 0.00006093 | - | |||||
| Additive | 8 | rs4764074 | 12 | 14,428,118 | −0.08937 | 0.01592 | −0.07677 | 0.02874 | −0.06911 | 0.0377 | 0.62 | −0.07886 | 0.00006821 | - | |||||
| Additive | 9 | rs4806716 | 19 | 54,639,868 | −0.06474 | 0.02339 | −0.07928 | 0.02267 | −0.07113 | 0.02095 | 0.5852 | −0.06999 | 0.00007154 | - | |||||
| Additive | 10 | rs375481 | 8 | 88,490,938 | 0.0844 | 0.005855 | 0.08185 | 0.02178 | 0.06467 | 0.03894 | 0.62 | 0.07169 | 0.00007405 | - | |||||
| Additive | 11 | rs463809 | 8 | 88,513,842 | 0.0884 | 0.004368 | 0.07265 | 0.04837 | 0.06353 | 0.04896 | - | 0.07236 | 0.00009161 | - | |||||
| Additive | 12 | rs12035559 | 1 | 34,499,921 | −0.09324 | 0.04609 | −0.08629 | 0.01417 | −0.0688 | 0.03792 | 0.62 | −0.08029 | 0.0001101 | CSMD2 | |||||
| Additive | 13 | rs2759632 | 10 | 10,218,843 | −0.1166 | 0.01793 | −0.1207 | 0.03614 | −0.09306 | 0.04611 | 0.6725 | −0.1076 | 0.0001932 | - | |||||
| Additive | 14 | rs4759709 | 12 | 131,001,468 | 0.07097 | 0.04568 | 0.08022 | 0.02878 | 0.08548 | 0.0188 | 0.5852 | 0.07568 | 0.000232 | RIMBP2 | |||||
| Additive | 15 | rs2013536 | 8 | 87,669,792 | 0.06629 | 0.03569 | 0.07622 | 0.02542 | 0.05973 | 0.04567 | 0.6725 | 0.06185 | 0.0005526 | CNGB3 | |||||
| Additive | 16 | rs2160974 | 12 | 108,883,621 | 0.06169 | 0.04197 | 0.07592 | 0.02893 | 0.06844 | 0.03283 | 0.62 | 0.06312 | 0.0005903 | - | |||||
| Additive | 17 | rs2368473 | 17 | 32,534,215 | 0.172 | 0.04925 | 0.09229 | 0.04477 | 0.1336 | 0.04801 | 0.6725 | 0.09914 | 0.003209 | - | |||||
| Dominant | 1 | rs6502266 | 17 | 13,395,720 | 0.1431 | 0.001155 | 0.1187 | 0.01152 | 0.08856 | 0.04179 | - | 0.1128 | 0.000006864 | - | |||||
| Dominant | 2 | rs17081058 | 13 | 25,267,734 | −0.1161 | 0.01188 | −0.1097 | 0.02728 | −0.1085 | 0.02525 | 0.7497 | −0.1163 | 0.00001918 | ATP12A | |||||
| Dominant | 3 | rs10836454 | 11 | 4,696,875 | −0.1235 | 0.03386 | −0.1135 | 0.03507 | −0.1552 | 0.002679 | 0.7497 | −0.1302 | 0.00002082 | - | |||||
| Dominant | 4 | rs17738087 | 15 | 26,905,021 | −0.1233 | 0.01412 | −0.1238 | 0.01927 | −0.1158 | 0.009327 | 0.7497 | −0.1162 | 0.00002685 | GABRB3 | |||||
| Dominant | 5 | rs751687 | 8 | 15,608,896 | 0.1227 | 0.004706 | 0.1077 | 0.02049 | 0.09564 | 0.02716 | 0.7497 | 0.1054 | 0.00002937 | TUSC3 | |||||
| Dominant | 6 | rs9968875 | 6 | 151,313,367 | 0.2127 | 0.03445 | 0.2375 | 0.002204 | 0.2158 | 0.04357 | 0.7497 | 0.2128 | 0.00003786 | MTHFD1L | |||||
| Dominant | 7 | rs4131101 | 5 | 119,195,837 | 0.1201 | 0.01361 | 0.1293 | 0.01648 | 0.1006 | 0.03878 | 0.7497 | 0.1165 | 0.00004616 | - | |||||
| Dominant | 8 | rs746427 | 20 | 48,939,076 | −0.1004 | 0.02234 | −0.106 | 0.04067 | −0.1111 | 0.01493 | - | −0.1057 | 0.00004884 | - | |||||
| Dominant | 9 | rs4580854 | 6 | 15,025,298 | −0.09948 | 0.02485 | −0.1086 | 0.0188 | −0.1015 | 0.0201 | 0.7497 | −0.1021 | 0.00005343 | - | |||||
| Dominant | 10 | rs1431210 | 6 | 103,229,346 | 0.1369 | 0.01037 | 0.1107 | 0.02506 | 0.103 | 0.02836 | - | 0.1129 | 0.00005784 | - | |||||
| Dominant | 11 | rs2143500 | 20 | 45,253,237 | 0.08748 | 0.04958 | 0.1251 | 0.009653 | 0.103 | 0.02006 | 0.7497 | 0.1019 | 0.00008058 | SLC13A3 | |||||
| Dominant | 12 | exm2270377 | 6 | 103,225,137 | 0.1369 | 0.01037 | 0.103 | 0.03793 | 0.103 | 0.02836 | - | 0.1101 | 0.00008819 | - | |||||
| Dominant | 13 | rs6020445 | 20 | 48,939,863 | −0.1004 | 0.02234 | −0.1111 | 0.03323 | −0.09611 | 0.03785 | 0.7497 | −0.102 | 0.00009374 | - | |||||
| Dominant | 14 | rs3935993 | 5 | 119,196,820 | 0.1066 | 0.02517 | 0.1293 | 0.01648 | 0.1006 | 0.03878 | - | 0.1107 | 0.00009776 | - | |||||
| Dominant | 15 | rs13195313 | 6 | 103,175,290 | 0.1276 | 0.0143 | 0.103 | 0.03793 | 0.1063 | 0.02584 | - | 0.1094 | 0.00009796 | - | |||||
| Dominant | 16 | rs12817917 | 12 | 5,321,651 | 0.1188 | 0.02369 | 0.1311 | 0.02116 | 0.116 | 0.04445 | 0.7497 | 0.1212 | 0.0001064 | - | |||||
| Dominant | 17 | rs1160226 | 13 | 25,271,434 | −0.09663 | 0.03322 | −0.1051 | 0.02826 | −0.09048 | 0.04211 | 0.7497 | −0.09989 | 0.0001114 | ATP12A | |||||
| Dominant | 18 | rs13278423 | 8 | 87,720,419 | −0.1293 | 0.008762 | −0.1109 | 0.03276 | −0.1019 | 0.03276 | 0.7497 | −0.1093 | 0.0001131 | CNGB3 | |||||
| Dominant | 19 | rs7592517 | 2 | 76,777,279 | 0.1386 | 0.004283 | 0.1108 | 0.02292 | 0.1029 | 0.02308 | - | 0.1004 | 0.0001222 | - | |||||
| Dominant | 19 | rs2139502 | 2 | 76,786,845 | 0.1386 | 0.004283 | 0.1108 | 0.02292 | 0.1029 | 0.02308 | 0.7497 | 0.1004 | 0.0001222 | - | |||||
| Dominant | 21 | rs10956972 | 8 | 87,768,331 | 0.1137 | 0.01871 | 0.1022 | 0.03598 | 0.1251 | 0.009372 | - | 0.1041 | 0.0001519 | - | |||||
| Dominant | 21 | rs1982563 | 8 | 87,776,019 | 0.1137 | 0.01871 | 0.1022 | 0.03598 | 0.1251 | 0.009372 | 0.7497 | 0.1041 | 0.0001519 | - | |||||
| Dominant | 23 | rs4963573 | 12 | 24,662,116 | −0.0974 | 0.02673 | −0.09413 | 0.04208 | −0.09436 | 0.03043 | 0.7497 | −0.09361 | 0.0001979 | SOX5 | |||||
| Dominant | 24 | rs12580224 | 12 | 71,086,426 | 0.1173 | 0.01037 | 0.1015 | 0.0382 | 0.0941 | 0.0436 | 0.7497 | 0.09522 | 0.0003004 | PTPRR | |||||
| Dominant | 25 | rs6792514 | 3 | 42,429,817 | 0.1291 | 0.04677 | 0.156 | 0.03299 | 0.1051 | 0.04156 | 0.7497 | 0.1183 | 0.0006295 | - | |||||
| Recessive | 1 | rs966775 | 5 | 174,763,322 | 0.1908 | 0.01057 | 0.1977 | 0.01704 | 0.1931 | 0.0005773 | 0.1068 | 0.1919 | 0.0000006958 | (DRD1) | |||||
| Recessive | 2 | rs6041532 | 20 | 12,652,435 | 0.5168 | 0.001824 | 0.3513 | 0.04671 | 0.5921 | 0.0118 | 0.3928 | 0.455 | 0.00001802 | - | |||||
| Recessive | 3 | rs43211 | 19 | 54,652,203 | −0.1046 | 0.03218 | −0.1699 | 0.01039 | −0.1444 | 0.008904 | 0.3928 | −0.1278 | 0.00004229 | CNOT3 | |||||
| Recessive | 4 | rs4764074 | 12 | 14,428,118 | −0.154 | 0.02998 | −0.1442 | 0.02867 | −0.1595 | 0.01012 | 0.3928 | −0.1515 | 0.00005068 | - | |||||
| Recessive | 5 | rs2146423 | 9 | 4,657,040 | 0.1363 | 0.04086 | 0.1478 | 0.0392 | 0.2007 | 0.006745 | 0.3928 | 0.1479 | 0.0001913 | C9orf68 | |||||
| Recessive | 6 | rs12714409 | 2 | 596,532 | 0.1057 | 0.04401 | 0.1324 | 0.02693 | 0.1247 | 0.02672 | 0.5038 | 0.1185 | 0.0001978 | - | |||||
| Recessive | 7 | rs2759632 | 10 | 10,218,843 | −0.2173 | 0.02572 | −0.237 | 0.03636 | −0.2005 | 0.02973 | 0.5089 | −0.2112 | 0.0002074 | - | |||||
| Recessive | 8 | rs2199503 | 3 | 119,778,489 | 0.1374 | 0.04339 | 0.1528 | 0.02812 | 0.1276 | 0.04407 | 0.5889 | 0.1352 | 0.0003717 | GSK3B | |||||
| Recessive | 9 | rs10486791 | 7 | 16,284,326 | 0.1441 | 0.04552 | 0.1725 | 0.04761 | 0.2051 | 0.02432 | 0.5038 | 0.1639 | 0.0003742 | ISPD, LOC100506025 | |||||
| Recessive | 10 | rs2368473 | 17 | 32,534,215 | 0.3506 | 0.04403 | 0.1788 | 0.04874 | 0.2906 | 0.03274 | 0.5267 | 0.2039 | 0.002313 | - | |||||
| Model | Rank | CHR | Gene Start Position | Gene Stop Position | Gene | nSNPs | Z Statistic | p | pa |
|---|---|---|---|---|---|---|---|---|---|
| Additive | 1 | 2 | 220,378,892 | 220,403,494 | ASIC4 | 6 | 3.8796 | 0.00005232 | 0.90440352 |
| Additive | 2 | 9 | 132,500,610 | 132,515,326 | PTGES | 6 | 3.7421 | 0.000091253 | 1 |
| Additive | 3 | 2 | 220,299,568 | 220,363,009 | SPEG | 15 | 3.7182 | 0.00010034 | 1 |
| Additive | 4 | 2 | 20,448,452 | 20,551,995 | PUM2 | 6 | 3.678 | 0.00011753 | 1 |
| Additive | 5 | X | 135,295,381 | 135,338,641 | MAP7D3 | 6 | 3.6653 | 0.00012353 | 1 |
| Additive | 6 | 11 | 67,195,931 | 67,202,872 | RPS6KB2 | 2 | 3.5064 | 0.00022708 | 1 |
| Additive | 7 | 11 | 51,515,282 | 51,516,211 | OR4C46 | 1 | 3.3757 | 0.0003682 | 1 |
| Additive | 8 | 12 | 122,089,024 | 122,110,537 | MORN3 | 3 | 3.3375 | 0.00042262 | 1 |
| Additive | 9 | 11 | 51,411,378 | 51,412,448 | OR4A5 | 2 | 3.296 | 0.00049041 | 1 |
| Additive | 10 | 17 | 56,597,611 | 56,618,179 | 45173 | 5 | 3.2112 | 0.00066098 | 1 |
| Additive | 11 | 2 | 28,680,012 | 28,866,654 | PLB1 | 66 | 3.2041 | 0.00067735 | 1 |
| Additive | 12 | 12 | 12,813,825 | 12,849,141 | GPR19 | 11 | 3.1993 | 0.00068891 | 1 |
| Additive | 13 | 4 | 169,418,217 | 169,849,608 | PALLD | 119 | 3.1987 | 0.00069036 | 1 |
| Additive | 14 | 15 | 66,679,155 | 66,784,650 | MAP2K1 | 6 | 3.1084 | 0.00094037 | 1 |
| Additive | 15 | 1 | 235,490,665 | 235,507,847 | GGPS1 | 4 | 3.0385 | 0.0011887 | 1 |
| Additive | 16 | 1 | 41,157,320 | 41,237,275 | NFYC | 5 | 3.0258 | 0.0012398 | 1 |
| Additive | 17 | 18 | 24,432,002 | 24,445,782 | AQP4 | 2 | 3.0094 | 0.001309 | 1 |
| Additive | 18 | 17 | 42,325,753 | 42,345,509 | SLC4A1 | 10 | 2.9943 | 0.0013754 | 1 |
| Additive | 19 | 18 | 43,405,477 | 43,424,045 | SIGLEC15 | 6 | 2.9848 | 0.0014187 | 1 |
| Additive | 20 | 11 | 67,202,981 | 67,205,538 | PTPRCAP | 1 | 2.9592 | 0.001542 | 1 |
| Dominant | 1 | 13 | 44,947,801 | 44,971,850 | SERP2 | 5 | 4.6871 | 0.0000013857 | 0.02424975 * |
| Dominant | 2 | 4 | 169,418,217 | 169,849,608 | PALLD | 134 | 3.7987 | 0.000072725 | 1 |
| Dominant | 3 | 20 | 45,186,463 | 45,304,714 | SLC13A3 | 79 | 3.7129 | 0.00010247 | 1 |
| Dominant | 4 | 13 | 25,254,549 | 25,285,921 | ATP12A | 14 | 3.6666 | 0.00012288 | 1 |
| Dominant | 5 | 17 | 4,574,679 | 4,607,632 | PELP1 | 4 | 3.5425 | 0.0001982 | 1 |
| Dominant | 6 | 14 | 57,936,019 | 57,960,585 | C14orf105 | 7 | 3.5263 | 0.00021073 | 1 |
| Dominant | 7 | 17 | 5,402,747 | 5,522,744 | NLRP1 | 37 | 3.5107 | 0.00022346 | 1 |
| Dominant | 8 | 1 | 41,157,320 | 41,237,275 | NFYC | 5 | 3.3447 | 0.00041192 | 1 |
| Dominant | 9 | 10 | 5,435,061 | 5,446,793 | TUBAL3 | 7 | 3.3324 | 0.00043043 | 1 |
| Dominant | 10 | 2 | 218,148,742 | 218,621,316 | DIRC3 | 104 | 3.3216 | 0.00044747 | 1 |
| Dominant | 11 | 13 | 45,007,655 | 45,151,283 | TSC22D1 | 13 | 3.2597 | 0.00055764 | 1 |
| Dominant | 12 | 14 | 104,552,016 | 104,579,098 | ASPG | 6 | 3.254 | 0.00056887 | 1 |
| Dominant | 13 | 7 | 1,509,913 | 1,545,489 | INTS1 | 5 | 3.2398 | 0.00059799 | 1 |
| Dominant | 14 | 10 | 22,823,778 | 23,003,484 | PIP4K2A | 47 | 3.1764 | 0.00074551 | 1 |
| Dominant | 15 | 1 | 153,389,000 | 153,395,701 | S100A7A | 1 | 3.1454 | 0.0008292 | 1 |
| Dominant | 16 | 9 | 22,002,902 | 22,009,362 | CDKN2B | 3 | 3.1361 | 0.00085605 | 1 |
| Dominant | 17 | 11 | 63,580,860 | 63,595,190 | C11orf84 | 5 | 3.1307 | 0.0008719 | 1 |
| Dominant | 18 | 13 | 41,129,804 | 41,240,734 | FOXO1 | 16 | 3.0931 | 0.00099042 | 1 |
| Dominant | 19 | 11 | 123,676,043 | 123,677,095 | OR6M1 | 3 | 3.0782 | 0.0010414 | 1 |
| Dominant | 20 | 17 | 4,613,784 | 4,624,794 | ARRB2 | 1 | 3.0692 | 0.001073 | 1 |
| Recessive | 1 | 2 | 220,378,892 | 220,403,494 | ASIC4 | 6 | 3.8643 | 0.000055694 | 0.930702434 |
| Recessive | 2 | 9 | 132,500,610 | 132,515,326 | PTGES | 6 | 3.8064 | 0.000070511 | 1 |
| Recessive | 3 | 11 | 51,515,282 | 51,516,211 | OR4C46 | 1 | 3.6687 | 0.0001219 | 1 |
| Recessive | 4 | 11 | 67,195,931 | 67,202,872 | RPS6KB2 | 2 | 3.4441 | 0.00028648 | 1 |
| Recessive | 5 | 11 | 51,411,378 | 51,412,448 | OR4A5 | 2 | 3.4435 | 0.00028713 | 1 |
| Recessive | 6 | 12 | 122,089,024 | 122,110,537 | MORN3 | 3 | 3.3926 | 0.00034621 | 1 |
| Recessive | 7 | 2 | 220,299,568 | 220,363,009 | SPEG | 15 | 3.3645 | 0.0003834 | 1 |
| Recessive | 8 | 2 | 20,448,452 | 20,551,995 | PUM2 | 6 | 3.3366 | 0.00042402 | 1 |
| Recessive | 9 | 18 | 43,405,477 | 43,424,045 | SIGLEC15 | 6 | 3.202 | 0.00068241 | 1 |
| Recessive | 10 | 11 | 55,563,032 | 55,563,976 | OR5D14 | 2 | 3.177 | 0.00074398 | 1 |
| Recessive | 11 | 17 | 56,597,611 | 56,618,179 | 44808 | 5 | 3.1273 | 0.00088212 | 1 |
| Recessive | 12 | 15 | 66,679,155 | 66,784,650 | MAP2K1 | 6 | 3.1118 | 0.00092985 | 1 |
| Recessive | 13 | 1 | 45,240,923 | 45,244,451 | RPS8 | 1 | 3.1037 | 0.0009556 | 1 |
| Recessive | 14 | 11 | 60,197,062 | 60,222,687 | MS4A5 | 8 | 3.004 | 0.0013323 | 1 |
| Recessive | 15 | 17 | 41,717,756 | 41,739,322 | MEOX1 | 5 | 2.9757 | 0.0014618 | 1 |
| Recessive | 16 | 1 | 44,398,992 | 44,402,913 | ARTN | 2 | 2.9727 | 0.0014762 | 1 |
| Recessive | 17 | 9 | 19,408,925 | 19,452,018 | ACER2 | 9 | 2.9601 | 0.0015377 | 1 |
| Recessive | 18 | 12 | 12,813,825 | 12,849,141 | GPR19 | 11 | 2.9597 | 0.0015395 | 1 |
| Recessive | 19 | 12 | 54,104,903 | 54,121,529 | CALCOCO1 | 9 | 2.9198 | 0.0017513 | 1 |
| Recessive | 20 | 11 | 27,676,440 | 27,743,605 | BDNF | 10 | 2.9176 | 0.0017634 | 1 |
| Model | Rank | CHR | Gene Start Position | Gene Stop Position | Gene | nSNPs | Z Statistic | p | pa |
|---|---|---|---|---|---|---|---|---|---|
| Additive | 1 | 2 | 220,378,892 | 220,403,494 | ASIC4 | 6 | 3.9085 | 0.000046429 | 0.802571694 |
| Additive | 2 | 9 | 132,500,610 | 132,515,326 | PTGES | 6 | 3.7514 | 0.000087928 | 1 |
| Additive | 3 | 2 | 220,299,568 | 220,363,009 | SPEG | 15 | 3.6267 | 0.00014354 | 1 |
| Additive | 4 | 2 | 20,448,452 | 20,551,995 | PUM2 | 6 | 3.608 | 0.00015431 | 1 |
| Additive | 5 | X | 135,295,381 | 135,338,641 | MAP7D3 | 6 | 3.5274 | 0.00020985 | 1 |
| Additive | 6 | 4 | 169,418,217 | 169,849,608 | PALLD | 119 | 3.4411 | 0.00028971 | 1 |
| Additive | 7 | 11 | 67,195,931 | 67,202,872 | RPS6KB2 | 2 | 3.3222 | 0.0004466 | 1 |
| Additive | 8 | 10 | 18,240,768 | 18,332,221 | SLC39A12 | 37 | 3.2132 | 0.00065641 | 1 |
| Additive | 9 | 2 | 28,680,012 | 28,866,654 | PLB1 | 66 | 3.1911 | 0.00070872 | 1 |
| Additive | 10 | 1 | 235,490,665 | 235,507,847 | GGPS1 | 4 | 3.1896 | 0.00071235 | 1 |
| Additive | 11 | 12 | 122,089,024 | 122,110,537 | MORN3 | 3 | 3.162 | 0.00078353 | 1 |
| Additive | 12 | 2 | 178,477,720 | 178,483,694 | TTC30A | 6 | 3.1536 | 0.00080626 | 1 |
| Additive | 13 | 11 | 51,515,282 | 51,516,211 | OR4C46 | 1 | 3.1356 | 0.0008575 | 1 |
| Additive | 14 | 11 | 51,411,378 | 51,412,448 | OR4A5 | 2 | 3.118 | 0.00091033 | 1 |
| Additive | 15 | 1 | 41,157,320 | 41,237,275 | NFYC | 5 | 3.0802 | 0.0010343 | 1 |
| Additive | 16 | 17 | 42,325,753 | 42,345,509 | SLC4A1 | 10 | 2.9505 | 0.0015861 | 1 |
| Additive | 17 | 13 | 44,947,801 | 44,971,850 | SERP2 | 3 | 2.942 | 0.0016303 | 1 |
| Additive | 18 | 12 | 12,813,825 | 12,849,141 | GPR19 | 11 | 2.9204 | 0.0017477 | 1 |
| Additive | 19 | 4 | 178,163,693 | 178,169,927 | RP11-487E13.1 | 3 | 2.9023 | 0.0018523 | 1 |
| Additive | 20 | 2 | 242,673,994 | 242,708,231 | D2HGDH | 2 | 2.8772 | 0.0020061 | 1 |
| Dominant | 1 | 13 | 44,947,801 | 44,971,850 | SERP2 | 5 | 4.6035 | 0.0000020769 | 0.03634575 * |
| Dominant | 2 | 4 | 169,418,217 | 169,849,608 | PALLD | 134 | 3.9649 | 0.000036709 | 0.6424075 |
| Dominant | 3 | 20 | 45,186,463 | 45,304,714 | SLC13A3 | 79 | 3.7005 | 0.00010758 | 1 |
| Dominant | 4 | 17 | 4,574,679 | 4,607,632 | PELP1 | 4 | 3.6432 | 0.00013461 | 1 |
| Dominant | 5 | 13 | 25,254,549 | 25,285,921 | ATP12A | 14 | 3.6374 | 0.0001377 | 1 |
| Dominant | 6 | 14 | 57,936,019 | 57,960,585 | C14orf105 | 7 | 3.4622 | 0.00026792 | 1 |
| Dominant | 7 | 1 | 41,157,320 | 41,237,275 | NFYC | 5 | 3.4055 | 0.00033018 | 1 |
| Dominant | 8 | 17 | 5,402,747 | 5,522,744 | NLRP1 | 37 | 3.3951 | 0.00034301 | 1 |
| Dominant | 9 | 10 | 22,823,778 | 23,003,484 | PIP4K2A | 47 | 3.3317 | 0.00043156 | 1 |
| Dominant | 10 | 7 | 1,509,913 | 1,545,489 | INTS1 | 5 | 3.2775 | 0.00052371 | 1 |
| Dominant | 11 | 10 | 5,435,061 | 5,446,793 | TUBAL3 | 7 | 3.2772 | 0.00052424 | 1 |
| Dominant | 12 | 8 | 87,878,670 | 88,627,447 | CNBD1 | 106 | 3.2034 | 0.00067909 | 1 |
| Dominant | 13 | 14 | 104,552,016 | 104,579,098 | ASPG | 6 | 3.1844 | 0.00072522 | 1 |
| Dominant | 14 | 1 | 33,979,609 | 34,631,443 | CSMD2 | 246 | 3.1422 | 0.00083837 | 1 |
| Dominant | 15 | 2 | 218,148,742 | 218,621,316 | DIRC3 | 104 | 3.1384 | 0.00084928 | 1 |
| Dominant | 16 | 13 | 112,240,548 | 112,324,955 | RP11-65D24.2 | 22 | 3.1144 | 0.00092144 | 1 |
| Dominant | 17 | 13 | 45,007,655 | 45,151,283 | TSC22D1 | 13 | 3.096 | 0.00098065 | 1 |
| Dominant | 18 | 3 | 38,029,550 | 38,048,679 | VILL | 6 | 3.0576 | 0.0011155 | 1 |
| Dominant | 19 | 1 | 153,389,000 | 153,395,701 | S100A7A | 1 | 3.0495 | 0.001146 | 1 |
| Dominant | 20 | 4 | 169,277,886 | 169,458,937 | DDX60L | 75 | 3.0157 | 0.0012818 | 1 |
| Recessive | 1 | 2 | 220,378,892 | 220,403,494 | ASIC4 | 6 | 3.9596 | 0.000037539 | 0.627314229 |
| Recessive | 2 | 9 | 132,500,610 | 132,515,326 | PTGES | 6 | 3.8807 | 0.000052076 | 0.870242036 |
| Recessive | 3 | 11 | 51,515,282 | 51,516,211 | OR4C46 | 1 | 3.4626 | 0.0002675 | 1 |
| Recessive | 4 | 2 | 20,448,452 | 20,551,995 | PUM2 | 6 | 3.3671 | 0.00037976 | 1 |
| Recessive | 5 | 11 | 51,411,378 | 51,412,448 | OR4A5 | 2 | 3.3374 | 0.00042284 | 1 |
| Recessive | 6 | 11 | 67,195,931 | 67,202,872 | RPS6KB2 | 2 | 3.2775 | 0.00052365 | 1 |
| Recessive | 7 | 2 | 220,299,568 | 220,363,009 | SPEG | 15 | 3.2573 | 0.00056237 | 1 |
| Recessive | 8 | 2 | 178,477,720 | 178,483,694 | TTC30A | 6 | 3.235 | 0.00060813 | 1 |
| Recessive | 9 | 12 | 122,089,024 | 122,110,537 | MORN3 | 3 | 3.2166 | 0.00064853 | 1 |
| Recessive | 10 | 11 | 55,563,032 | 55,563,976 | OR5D14 | 2 | 3.0495 | 0.0011462 | 1 |
| Recessive | 11 | 7 | 44,836,279 | 44,864,163 | PPIA | 3 | 3.0277 | 0.0012321 | 1 |
| Recessive | 12 | 1 | 44,398,992 | 44,402,913 | ARTN | 2 | 2.9601 | 0.0015375 | 1 |
| Recessive | 13 | 16 | 88,519,725 | 88,603,424 | ZFPM1 | 10 | 2.9384 | 0.0016497 | 1 |
| Recessive | 14 | 2 | 204,259,068 | 204,400,133 | RAPH1 | 9 | 2.894 | 0.001902 | 1 |
| Recessive | 15 | 4 | 156,129,781 | 156,138,230 | NPY2R | 2 | 2.8848 | 0.0019584 | 1 |
| Recessive | 16 | 2 | 242,673,994 | 242,708,231 | D2HGDH | 2 | 2.874 | 0.0020268 | 1 |
| Recessive | 17 | 17 | 26,975,374 | 26,989,207 | SDF2 | 1 | 2.8623 | 0.002103 | 1 |
| Recessive | 18 | 1 | 235,490,665 | 235,507,847 | GGPS1 | 4 | 2.8614 | 0.0021089 | 1 |
| Recessive | 19 | 1 | 44,440,159 | 44,443,967 | ATP6V0B | 3 | 2.8318 | 0.002314 | 1 |
| Recessive | 20 | 2 | 204,192,942 | 204,312,446 | ABI2 | 6 | 2.8279 | 0.0023427 | 1 |
Disclaimer/Publisher’s Note: The statements, opinions and data contained in all publications are solely those of the individual author(s) and contributor(s) and not of MDPI and/or the editor(s). MDPI and/or the editor(s) disclaim responsibility for any injury to people or property resulting from any ideas, methods, instructions or products referred to in the content. |
© 2023 by the authors. Licensee MDPI, Basel, Switzerland. This article is an open access article distributed under the terms and conditions of the Creative Commons Attribution (CC BY) license (https://creativecommons.org/licenses/by/4.0/).
Share and Cite
Nishizawa, D.; Mieda, T.; Tsujita, M.; Nakagawa, H.; Yamaguchi, S.; Kasai, S.; Hasegawa, J.; Nakayama, K.; Ebata, Y.; Kitamura, A.; et al. Genome-Wide Association Study Identifies Genetic Polymorphisms Associated with Estimated Minimum Effective Concentration of Fentanyl in Patients Undergoing Laparoscopic-Assisted Colectomy. Int. J. Mol. Sci. 2023, 24, 8421. https://doi.org/10.3390/ijms24098421
Nishizawa D, Mieda T, Tsujita M, Nakagawa H, Yamaguchi S, Kasai S, Hasegawa J, Nakayama K, Ebata Y, Kitamura A, et al. Genome-Wide Association Study Identifies Genetic Polymorphisms Associated with Estimated Minimum Effective Concentration of Fentanyl in Patients Undergoing Laparoscopic-Assisted Colectomy. International Journal of Molecular Sciences. 2023; 24(9):8421. https://doi.org/10.3390/ijms24098421
Chicago/Turabian StyleNishizawa, Daisuke, Tsutomu Mieda, Miki Tsujita, Hideyuki Nakagawa, Shigeki Yamaguchi, Shinya Kasai, Junko Hasegawa, Kyoko Nakayama, Yuko Ebata, Akira Kitamura, and et al. 2023. "Genome-Wide Association Study Identifies Genetic Polymorphisms Associated with Estimated Minimum Effective Concentration of Fentanyl in Patients Undergoing Laparoscopic-Assisted Colectomy" International Journal of Molecular Sciences 24, no. 9: 8421. https://doi.org/10.3390/ijms24098421
APA StyleNishizawa, D., Mieda, T., Tsujita, M., Nakagawa, H., Yamaguchi, S., Kasai, S., Hasegawa, J., Nakayama, K., Ebata, Y., Kitamura, A., Shimizu, H., Takashima, T., Hayashida, M., & Ikeda, K. (2023). Genome-Wide Association Study Identifies Genetic Polymorphisms Associated with Estimated Minimum Effective Concentration of Fentanyl in Patients Undergoing Laparoscopic-Assisted Colectomy. International Journal of Molecular Sciences, 24(9), 8421. https://doi.org/10.3390/ijms24098421