Article

Genome-Wide Identification and Multi-Stress Response Analysis of the DABB-Type Protein-Encoding Genes in Brassica napus

Hunan Provincial Key Laboratory of Phytohormones and Growth Development, College of Bioscience and Biotechnology, Hunan Agricultural University, Changsha 410128, China
*
Author to whom correspondence should be addressed.
These authors contributed equally to this work.
Int. J. Mol. Sci. 2024, 25(11), 5721; https://doi.org/10.3390/ijms25115721
Submission received: 16 April 2024 / Revised: 17 May 2024 / Accepted: 18 May 2024 / Published: 24 May 2024
(This article belongs to the Special Issue Advances in Plant–Pathogen Interactions: 3rd Edition)

Abstract

:
The DABB proteins, which are characterized by stress-responsive dimeric A/B barrel domains, have multiple functions in plant biology. In Arabidopsis thaliana, these proteins play a crucial role in defending against various pathogenic fungi. However, the specific roles of DABB proteins in Brassica napus remain elusive. In this study, 16 DABB encoding genes were identified, distributed across 10 chromosomes of the B. napus genome, which were classified into 5 branches based on phylogenetic analysis. Genes within the same branch exhibited similar structural domains, conserved motifs, and three-dimensional structures, indicative of the conservation of BnaDABB genes (BnaDABBs). Furthermore, the enrichment of numerous cis-acting elements in hormone induction and light response were revealed in the promoters of BnaDABBs. Expression pattern analysis demonstrated the involvement of BnaDABBs, not only in the organ development of B. napus but also in response to abiotic stresses and Sclerotinia sclerotiorum infection. Altogether, these findings imply the significant impacts of BnaDABBs on plant growth and development, as well as stress responses.

1. Introduction

B. napus, an important cultivated oilseed crop, not only provides edible vegetable oil resources for humans [1] but also serves as protein source for the animal feed industry [2]. However, the production of B. napus is frequently threatened by fungal diseases, among which Sclerotinia stem rot, caused by S. sclerotiorum [3], is particularly detrimental, impacting both yield and economic costs [4]. In the United States, economic losses exceeding $200 million annually have been attributed to S. sclerotiorum disease [5]. Similarly, annual economic losses linked to S. sclerotiorum disease have amount to 8.4 billion yuan in China [6]. Consequently, enhancing B. napus resistance to S. sclerotiorum is of paramount importance. In A. thaliana, AtDabb1 is predominantly located in the cytoplasm. Its expression is rapidly induced by salicylic acid (SA) and declines after 3 h, while jasmonic acid (JA) treatment leads to sustained high transcription levels for up to 24 h. Upon exposure to Fusarium oxysporum, the transcription of AtDabb1 also increases and remains stable for between 6–12 h, possibly due to SA and JA accumulation post-fungal infection. Additionally, AtDabb1 exhibits significant antifungal effects, likely through interacting with fungal cell membrane components, and resulting in death of the fungal pathogen [7]. Another A. thaliana DABB protein, AtHS1, possesses ribonuclease activity and notable antifungal properties. It effectively combats multiple pathogenic bacteria and fungi but does not hinder the growth of Phytophthora infestans and Phytophthora nicotianae lacking chitin in their cell walls, suggesting that AtHS1 may disrupt microbial cell growth by interacting with cytoplasmic compounds [8]. Further studies indicate that the Olivetolic acid cyclase (OAC) in cannabis plays a crucial role in the biosynthesis of cannabinoids. This enzyme shares characteristics with DABB proteins and catalyzes the C2–C7 hydroxyaldehyde cyclization reaction of linear pentyl tetra-beta-ketide CoA as a substrate, leading to the production of olivetolic acid (OA) [9,10]. However, little is known currently about DABB proteins in B. napus.
Here, through whole-genome screening, 16 BnaDABBs were successfully identified, belonging to five putative groups (A–E). Detailed analyses were conducted on the conserved protein domains, motifs, and tertiary structure models of the BnaDABBs-encoded proteins, confirming the rational grouping of these genes, which are predominantly located on scaffold A01 and scaffold C01 chromosomes. Subcellular localization predictions indicated that these BnaDABBs function in multiple cellular regions, including chloroplasts, cytoplasm and nuclei. Additionally, the cis-elements, genomic collinearity, and physicochemical properties of these encoded proteins were investigated to further understand the roles of BnaDABBs in the growth, development, and stress responses of B. napus.

2. Results

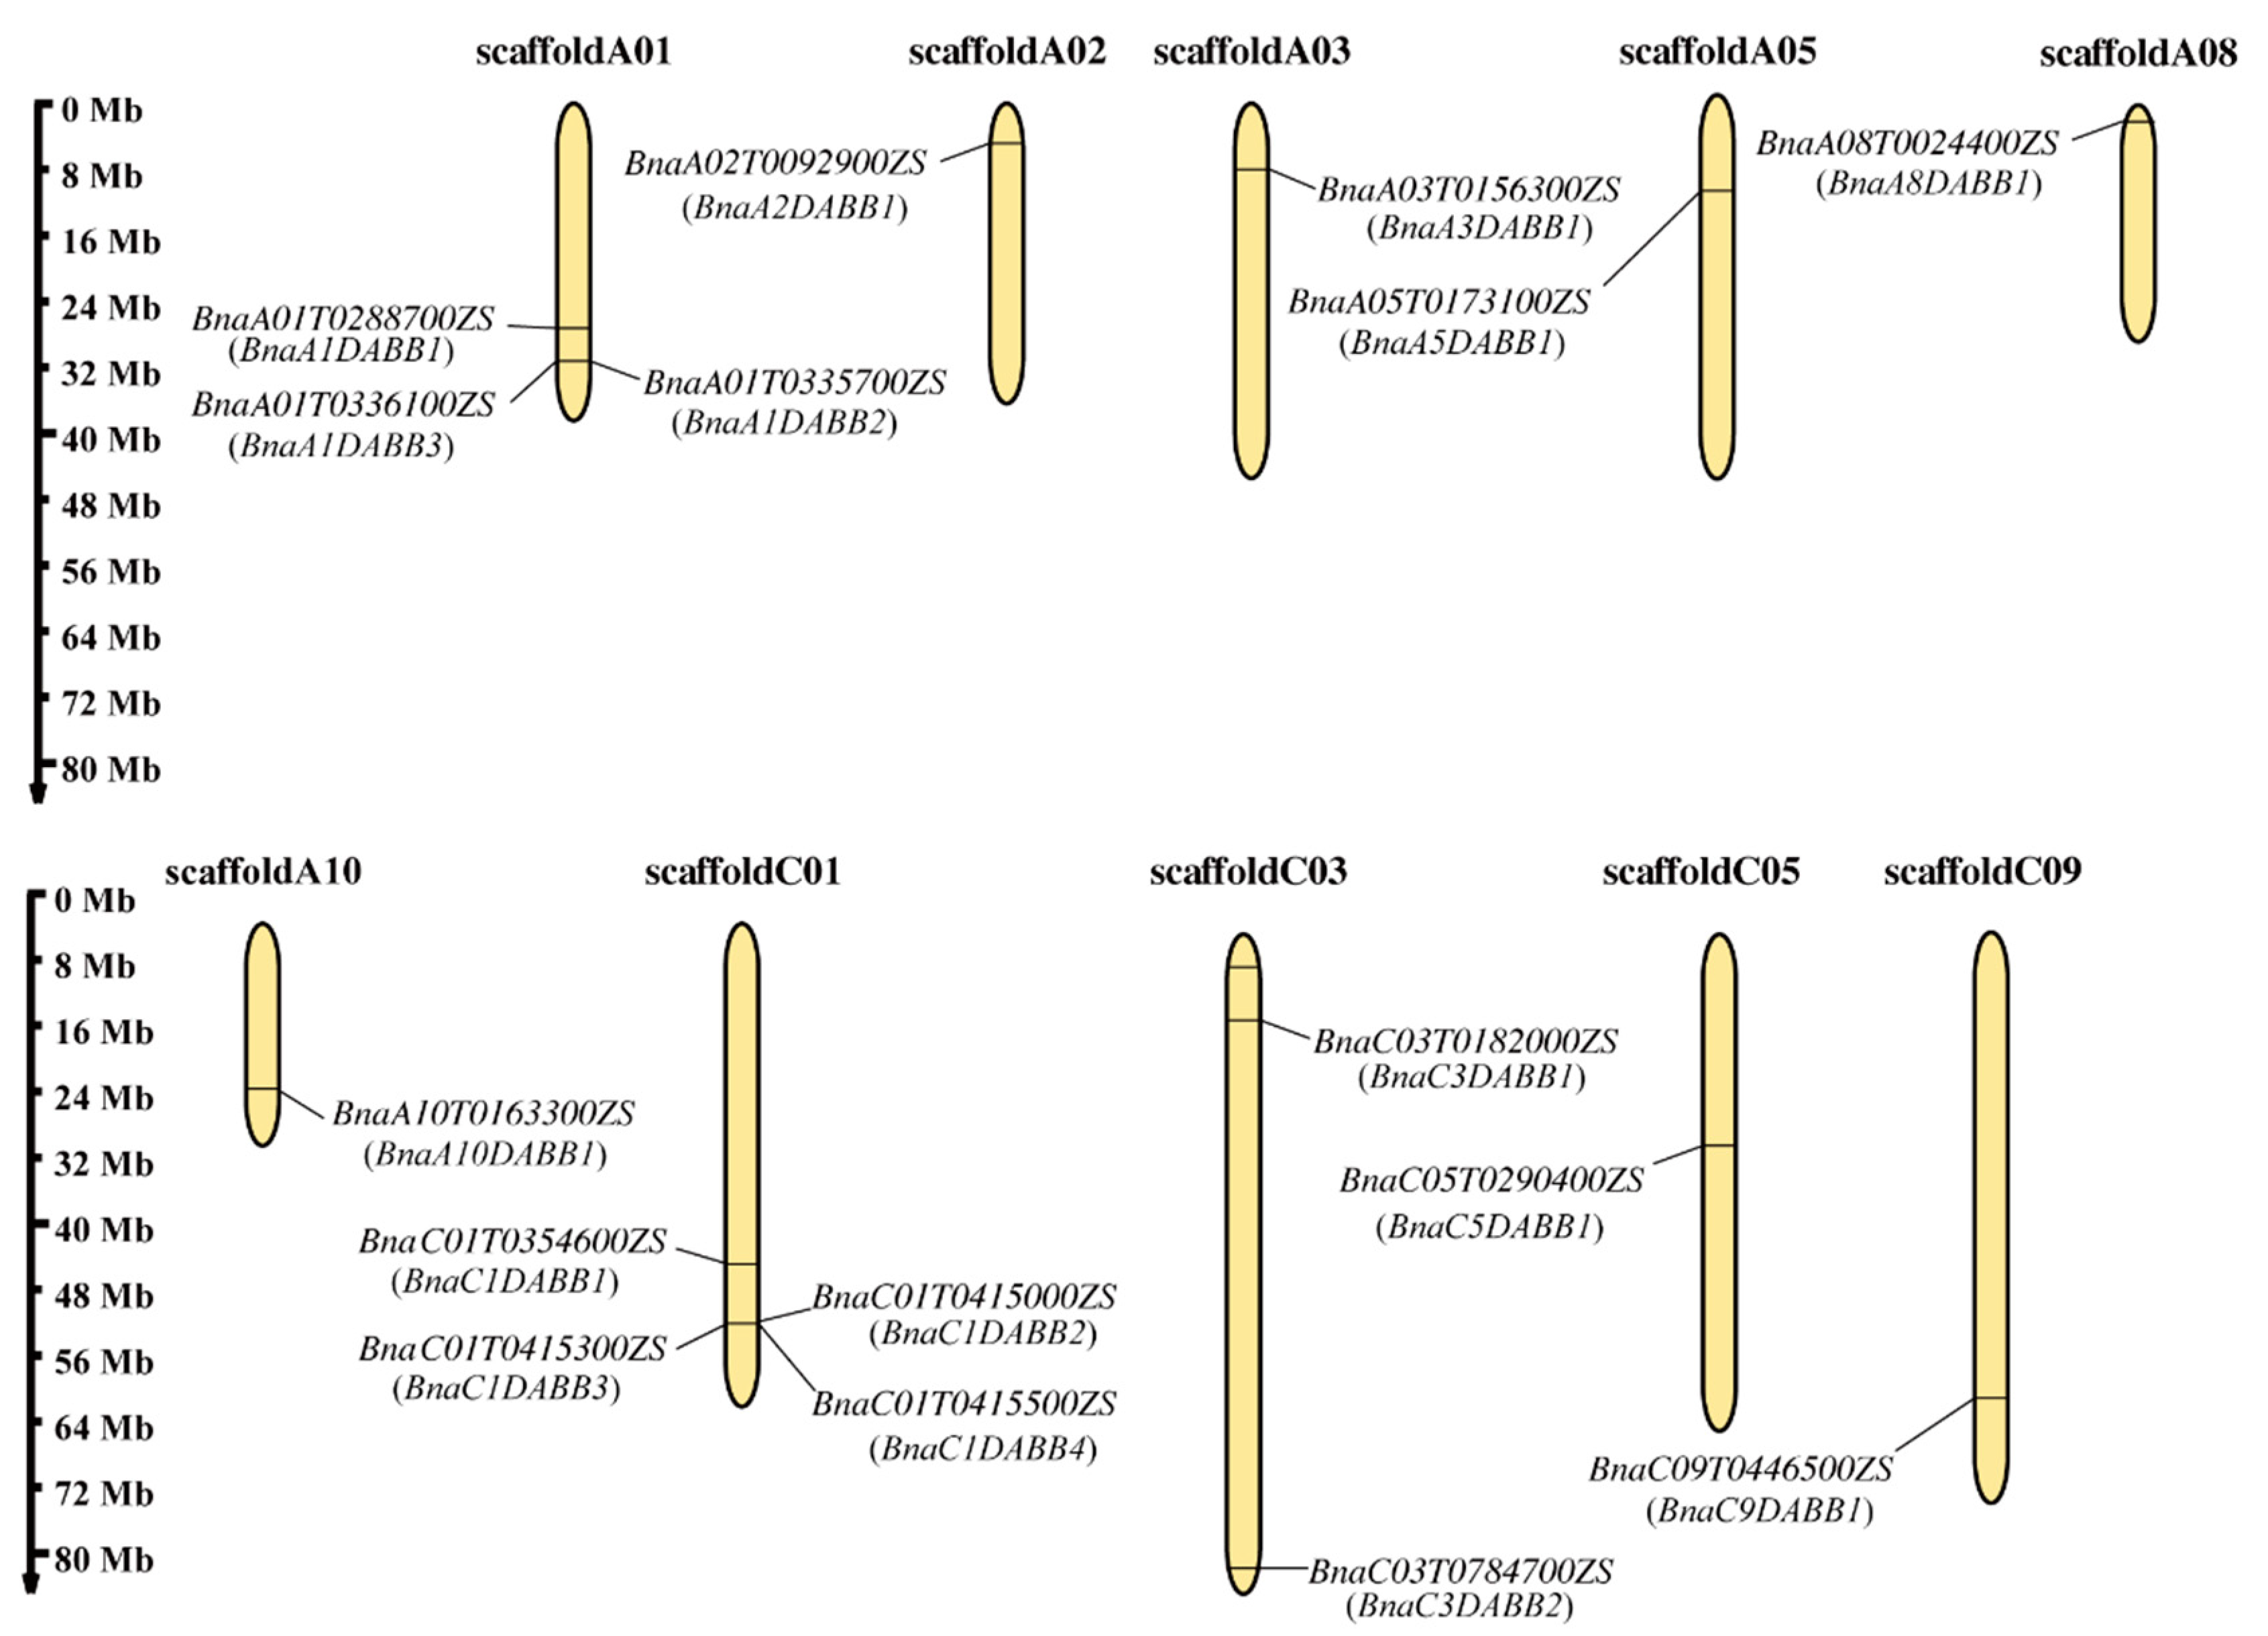
2.1. Identification, Chromosomal and Subcellular Localization of DABBs in B. napus

When a BLASTP search was performed against the protein database of B. napus using A. thaliana DABB protein sequences (Q9SYD8/At1g51360 and Q9LUV2/At3g17210, antifungal proteins; Q9FK81/At5g22580, ABD19682.1 (At2g32500) and Q9SIP1/At2g31670, involved in stress response) as queries, 15 potential BnaDABBs were identified. Furthermore, using the hmmsearch tool, 17 potential BnaDABBs were identified. By removing the duplicate entries, 17 potential BnaDABBs were then identified. After verifying by the CD and SMART website, and removal of the BnaDABB gene with abnormal annotations, a total of 16 BnaDABBs were obtained subsequently (Supplementary Materials, Text S1).
Members of the BnaDABB gene family were found to be distributed on chromosomes scaffold A01, scaffold A02, scaffold A03, scaffold A05, scaffold A08, scaffold A10, scaffold C01, scaffold C03, scaffold C05, and scaffold C09 respectively. The highest distribution was observed on chromosome C01, followed by chromosome A01. Based on their respective positions on the chromosomes, these BnaDABBs were named as BnaA1DABB1, BnaA1DABB2, BnaA1DABB3, BnaA2DABB1, BnaA3DABB1, BnaA5DABB1, BnaA8DABB1, BnaA10DABB1, BnaC1DABB1, BnaC1DABB2, BnaC1DABB3, BnaC1DABB4, BnaC3DABB1, BnaC3DABB2, BnaC5DABB1, and BnaC9DABB1, separately (Figure 1).
Subcellular localization prediction revealed that the majority of the BnaDABBs were localized in the chloroplast and cytoplasm. However, BnaA1DABB1, BnaA3DABB1, BnaC1DABB1 and BnaC3DABB1 were found to be located in the nucleus. Additionally, the subcellular localization of BnaA10DABB1 and BnaC9DABB1 was found to be widely distributed (Supplementary Table S1).

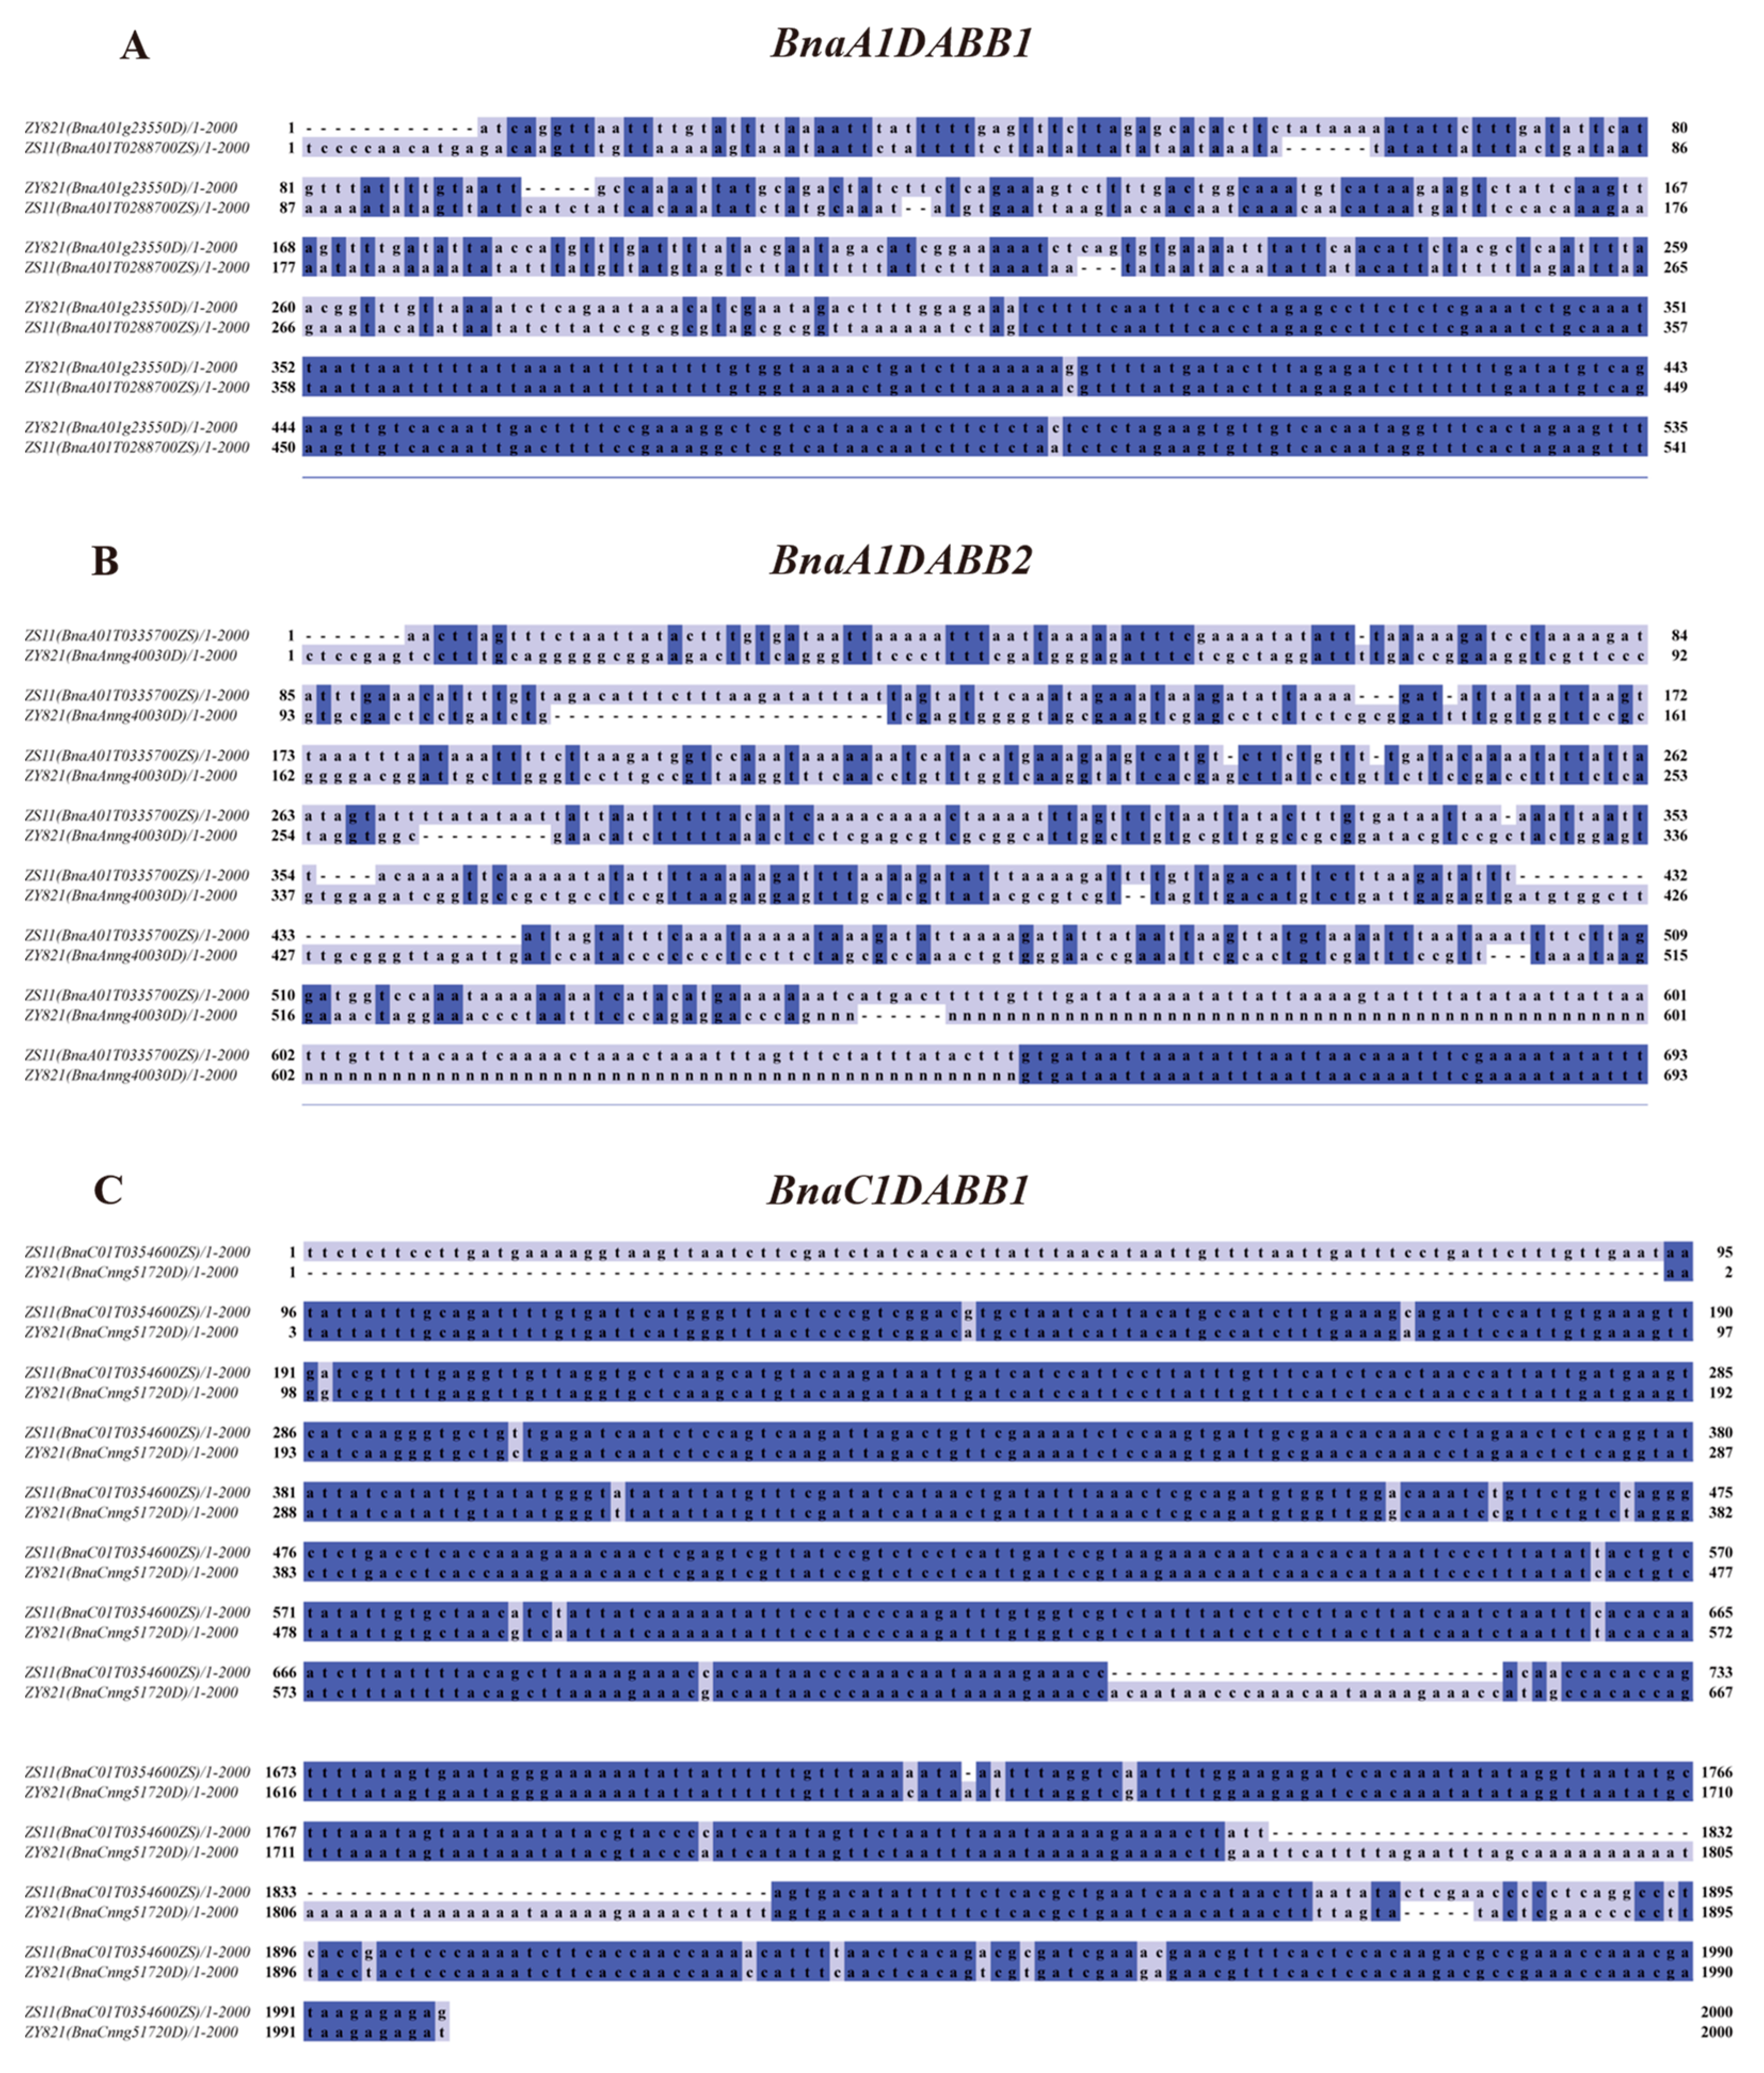
2.2. Analysis of Formation and Evolution of The BnaDABB Members in B. napus

To explore the evolution process of BnaDABBs in B. napus, we conducted a synteny analysis of the genomes of B. napus, B. rapa, and B. oleracea using the Python version of MCScan (JCVI toolkit 1.3.2). As shown in Supplementary Tables S2 and S3, 13 pairs of Br-BnaDABB syntenic genes were found between B. rapa and B. napus, while there were 11 pairs of Bo-BnaDABB syntenic genes between B. oleracea and B. napus. BnaDABBs of the Br-BnaDABB syntenic gene pairs that displayed collinearity with the C genome of the B. napus were removed, resulting in the identification of 7 BnaDABBs originating from B. rapa. Similarly, from the Bo-BnaDABB syntenic gene pairs, 6 BnaDABBs originating from B. oleracea were obtained after excluding those that displayed collinearity with the A genome of the B. napus (Figure 2A). However, the number of these genes was lower than that of BnaDABBs identified from B. napus, suggesting the formation of new BnaDABBs in the later stages of evolution in B. napus.
Analysis of the duplications of BnaDABBs revealed that the BnaA10DABB1 underwent segmental duplication, resulting in the formation of BnaA02DABB1. Similarly, the BnaC1DABB2 underwent tandem duplication, leading to the generation of the BnaC1DABB3 and BnaC1DABB4 (Figure 2B). In a word, in the early evolution stages, B. napus inherited 13 BnaDABBs from its ancestors, B. oleracea and B. rapa. In the later stages, the formation of new BnaDABBs occurred through segmental and tandem duplication, ultimately resulting in the current 16 BnaDABBs.
In order to better understand the evolutionary overview of BnaDABBs in the Brassicaceae family, we further identified DABBs in A. thaliana, B. carinata, B. juncea, and C. sativa (Supplementary Table S4). Compared to Arabidopsis, the Brassica and Camelina genus exhibited a greater abundance of DABBs, suggesting an expansion of DABBs in Brassica and Camelina during their evolution (Figure 2C,D). Collinearity analysis of BnaDABBs in Arabidopsis, Brassica, and Camelina species revealed that the BnaDABBs exhibit widespread collinearity among them (Supplementary Table S5). Furthermore, it was shown that the majority of these genes are evolutionarily conserved (Figure 2E).

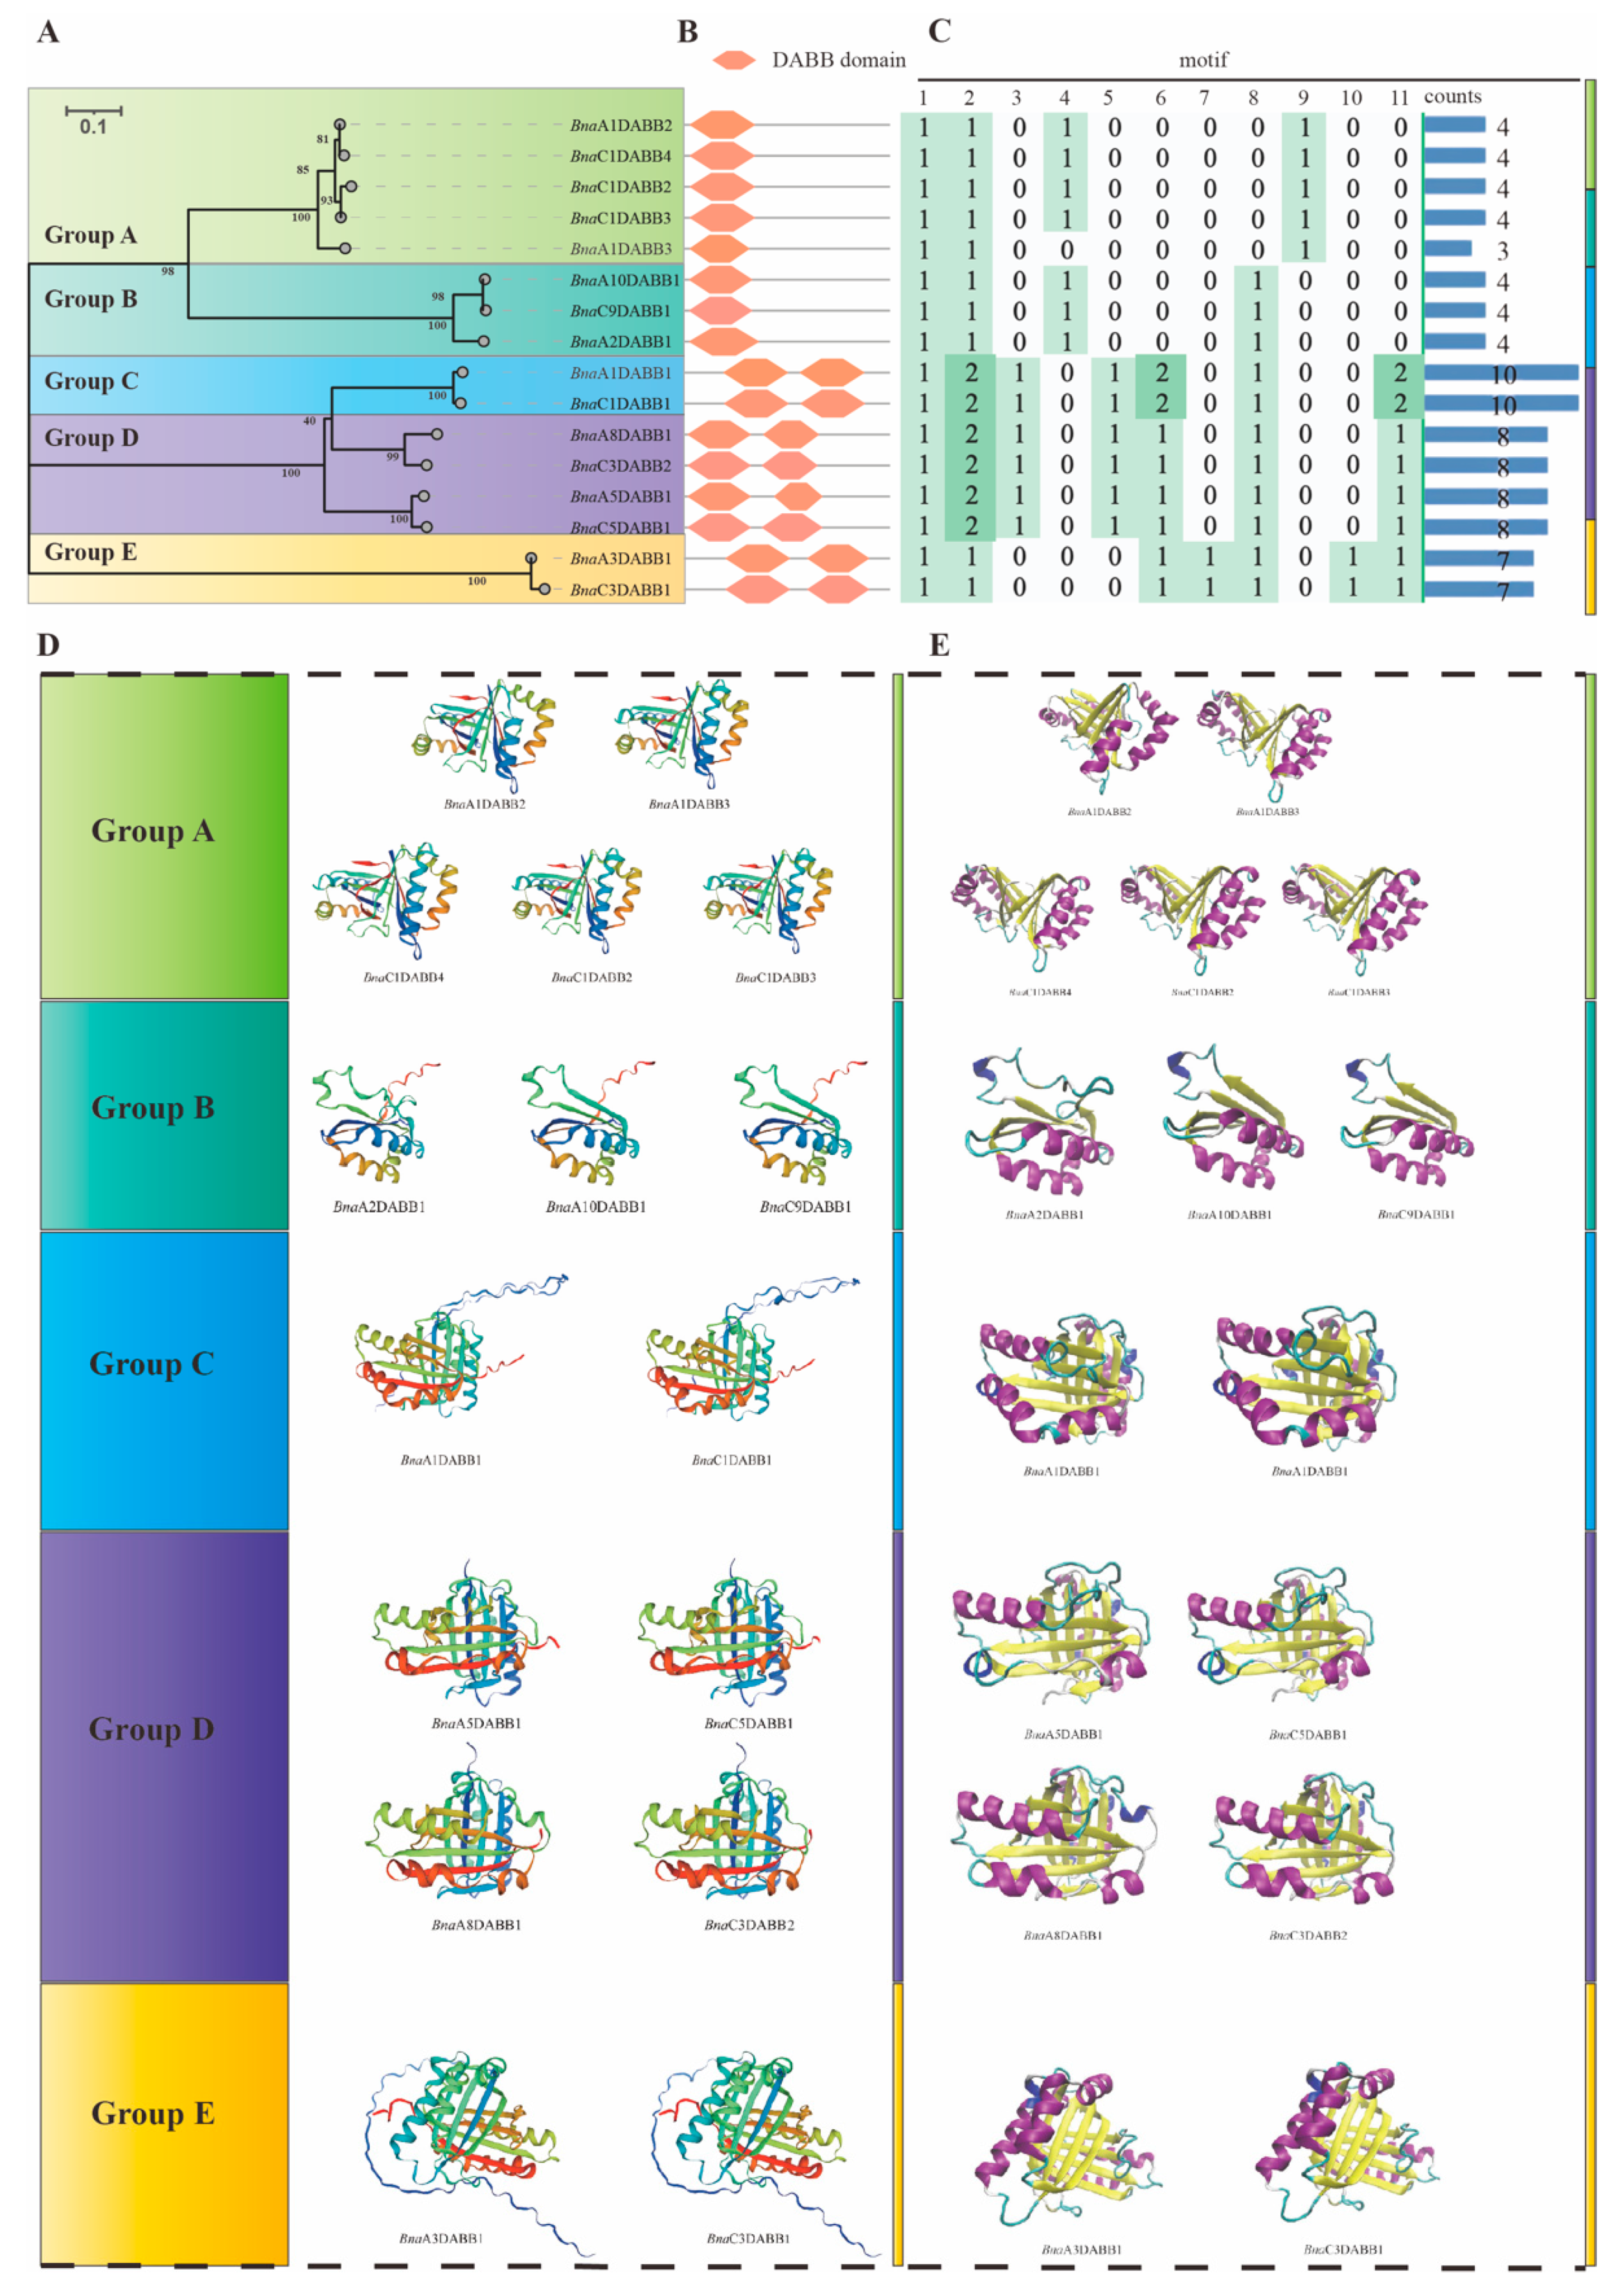
2.3. Phylogenetic Analysis and Biochemical Properties Calculation of BnaDABBs

Phylogenetic analysis indicated that the BnaDABBs in B. napus were diverged into five distinct branches during evolution. Based on this, we classified the BnaDABBs into five groups, designated as Group A, B, C, D, and E (Figure 3A). Conservative structural domain analysis revealed the presence of one DABB domain in both the A and B groups, whereas the C, D, and E groups contained two DABB domains (Figure 3B). The identification of conserved motifs in the BnaDABBs showed that all groups contained motif 1 and motif 2, with consistent types and quantities of motifs across the groups (Figure 3C, Supplementary Figure S1). Further analysis revealed that the BnaDABBs sequences in Group E exhibited the smallest differences, followed by Group C. On the other hand, Groups A, B, and D showed greater differences in their BnaDABBs sequences (Supplementary Figure S2). The 3D structure models of BnaDABBs further accentuated the differences among the groups. The BnaDABBs structures in Group B are the simplest, characterized by a small number of α helices, β sheets, β turns, and random coils. In contrast, the 3D structures in Groups A, C, D, and E are more complex, consisting of multiple α helices, β sheets, β turns and random coils (Figure 3D). Additionally, similar differences were observed in the DABB domains (Figure 3E). However, within each group, the BnaDABB proteins exhibited high similarity in 3D structures and domains, even in the presence of sequence variations (Figure 3D,E).
Furthermore, the protein with the largest molecular weight was found in group E, while group A exhibited the smallest molecular weight; the theoretical isoelectric point (pI) ranged from 5.12 to 8.76. Apart from group C, all groups were stable proteins. The aliphatic index of group E proteins fell in between 77 and 80, which was below 100 and lower than the aliphatic index values of other groups. Additionally, the grand average of hydrophilicity was −0.286, approaching zero. These results suggest that the group E proteins have better hydrophobicity compared to other groups (Table 1), and the BnaDABB proteins may possess diverse functions in B. napus.

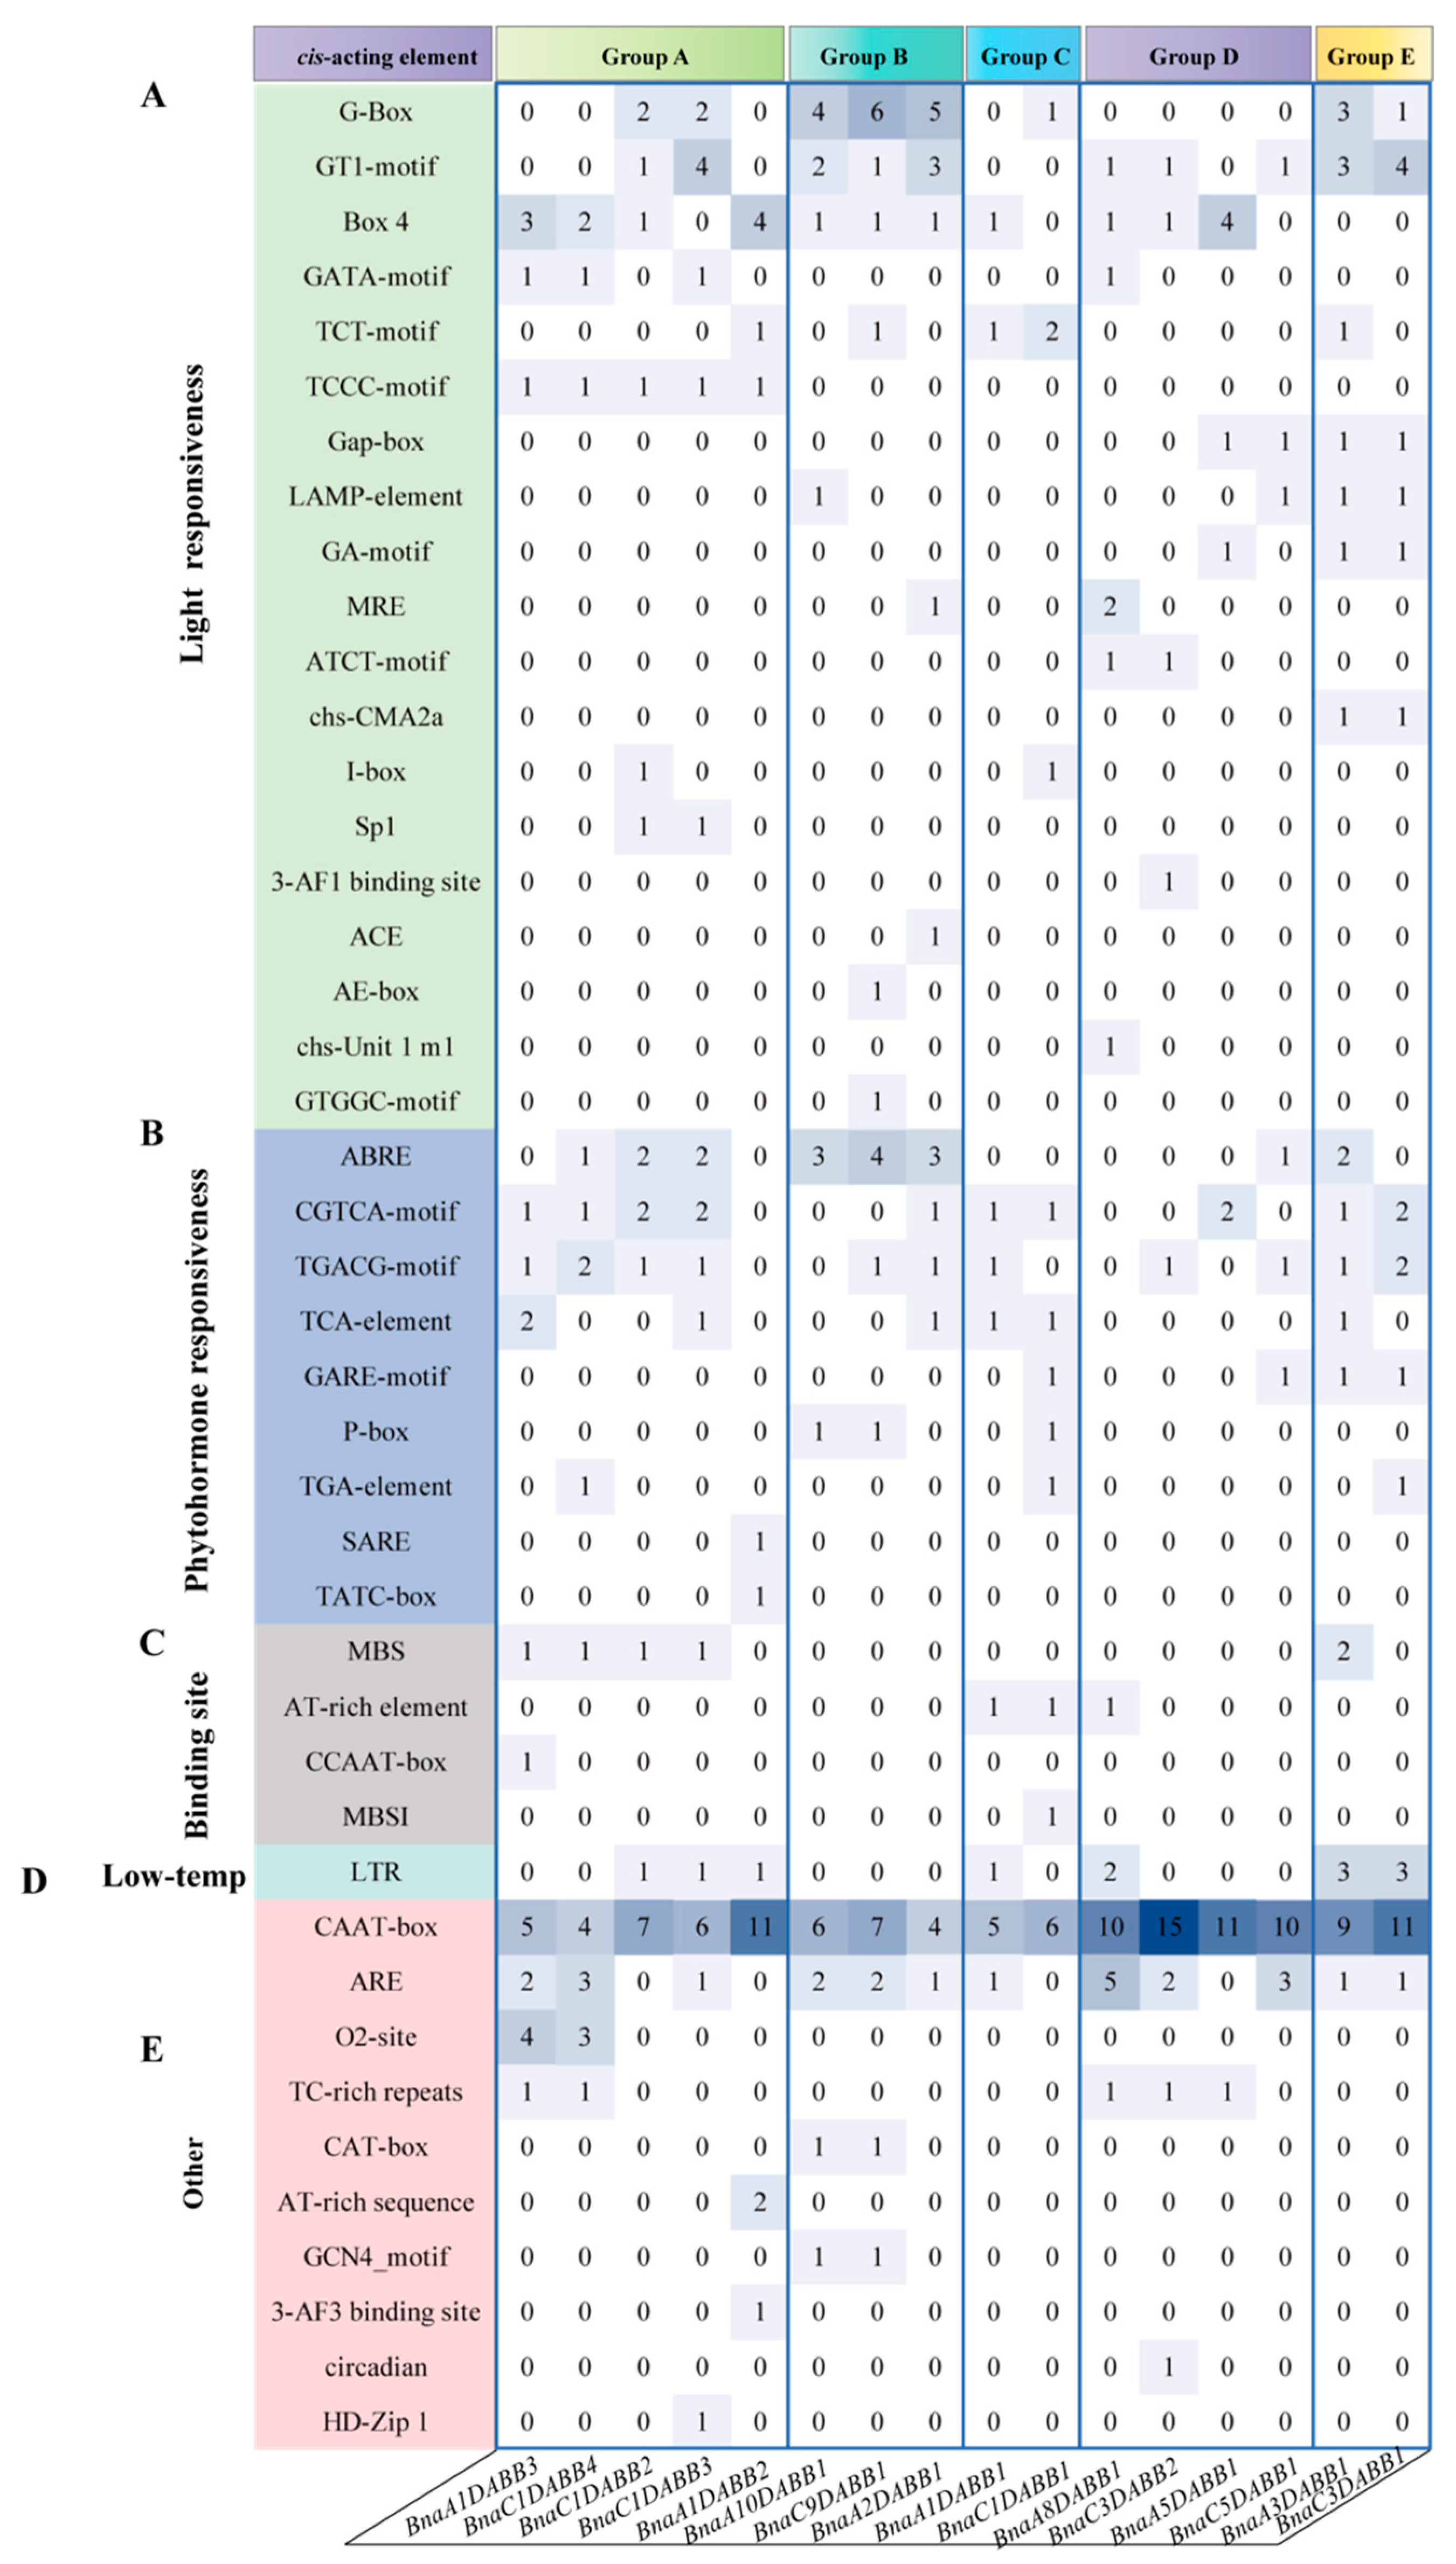
2.4. Analysis of Cis-Elements and Expression Patterns of BnaDABBs

Cis-acting regulatory elements act as molecular switches in the transcriptional regulation of a dynamic network of gene activities that govern diverse biological processes, encompassing abiotic stress responses, hormone signaling, and developmental processes. Therefore, we analyzed the cis-elements of BnaDABBs promoters by PlantCARE (Supplemental Table S6). The enriched cis-regulatory elements in the 2000 bp promoter region suggests that BnaDABBs may be involved in multiple biological processes such as light response (Figure 4A), hormone response (Figure 4B), binding site (Figure 4C), low temperature (Figure 4D), and so on (Figure 4E). Of particular interest is the potential role of BnaDABBs in hormone response. We then analyzed the functionality of the promoter regions of BnaDABBs in relation to hormone-response-associated cis-elements. The results indicated that a majority of BnaDABBs contained the CGTCA-motif and TGACG-motif, suggesting their potential association with MeJA-responsiveness. Additionally, we found that BnaDABBs comprised various hormone-response-related cis-elements, indicative of their significance in hormone responses (Figure 4B).
To further investigate the putative functions of BnaDABBs in plant growth and development, we analyzed the tissue expression patterns of BnaDABBs (Supplementary Table S7), and found that BnaA1DABB1 and BnaC1DABB1 from Group C exhibited higher expression levels in various stages of leaf and seed development, as well as in roots and stems. BnaA1DABB3 and BnaC1DABB4 from Group A exhibited similar expression patterns, but their expression levels were lower compared with BnaA1DABB1 and BnaC1DABB1. Additionally, BnaA10DABB1 and BnaC9DABB1 from Group B showed higher expression levels during leaf development from 1–11 days, as well as in stems (Supplementary Figure S3). These findings further underscore the potential multifunctionality of BnaDABBs in B. napus.

2.5. Expression Profiling of BnaDABBs under Plant Hormones Treatment

To reveal the relationship between BnaDABBs in B. napus and plant hormones, the expression patterns upon various plant hormones treatment were investigated (Supplementary Table S8). Expression profiling of BnaDABB genes in leaf and root indicated that the majority of these genes showed no significant differences in expression levels compared to the control group after treated with phytohormones IAA, GA, ABA, and JA. However, in leaf, BnaC1DABB2/3/4 in group A, BnaA10/C9DABB1 in group B, and BnaA1/C1DABB1 in group C exhibited increased expression levels after JA treatment (Supplementary Figure S4A). In roots, BnaC1DABB2/3 in group A, BnaC9DABB1 in group B, and BnaA1/C1DABB1 in group C also displayed similar expression patterns (Supplementary Figure S4B). Furthermore, BnaA10DABB1 in group B showed decreased expression levels after ABA treatment in leaf (Supplementary Figure S4A), and BnaA8DABB1 in Group D exhibited a similar expression pattern in root (Supplementary Figure S4B). Overall, these expression results suggest that BnaDABBs may play a role in response to JA and ABA.

2.6. Expression Profiling of BnaDABB Genes under Abiotic Stresses Treatment

To elucidate the expression patterns of BnaDABBs in abiotic stress responses in B. napus, we investigated the expression of these genes in leaf and root after salt, drought, freezing, low temperature, high temperature, and osmotic stress treatments (Supplementary Table S9). It was revealed that compared to the control group of BnaDABBs in leaf, BnaA1DABB3 and BnaC1DABB4 in group A exhibited downregulated expression levels after salt, drought, low temperature, high temperature and osmotic stress treatments; BnaA10DABB1 and BnaC9DABB1 in group B showed downregulated expression levels after salt, freezing, and osmotic stress treatments (Supplementary Figure S5A). Compared with the control group of BnaDABBs in root, BnaC1DABB2/3 in group A displayed downregulated expression levels after salt, drought, freezing, high temperature, and osmotic stress treatments. BnaA10DABB1 and BnaC9DABB1 in group B exhibited downregulated expression levels after salt, freezing, low temperature, high temperature, and osmotic stress treatments, but upregulated expression levels after drought treatment (Supplementary Figure S5B). These results suggest that BnaDABBs also play an important role in the biological processes of non-biological stress responses in B. napus.

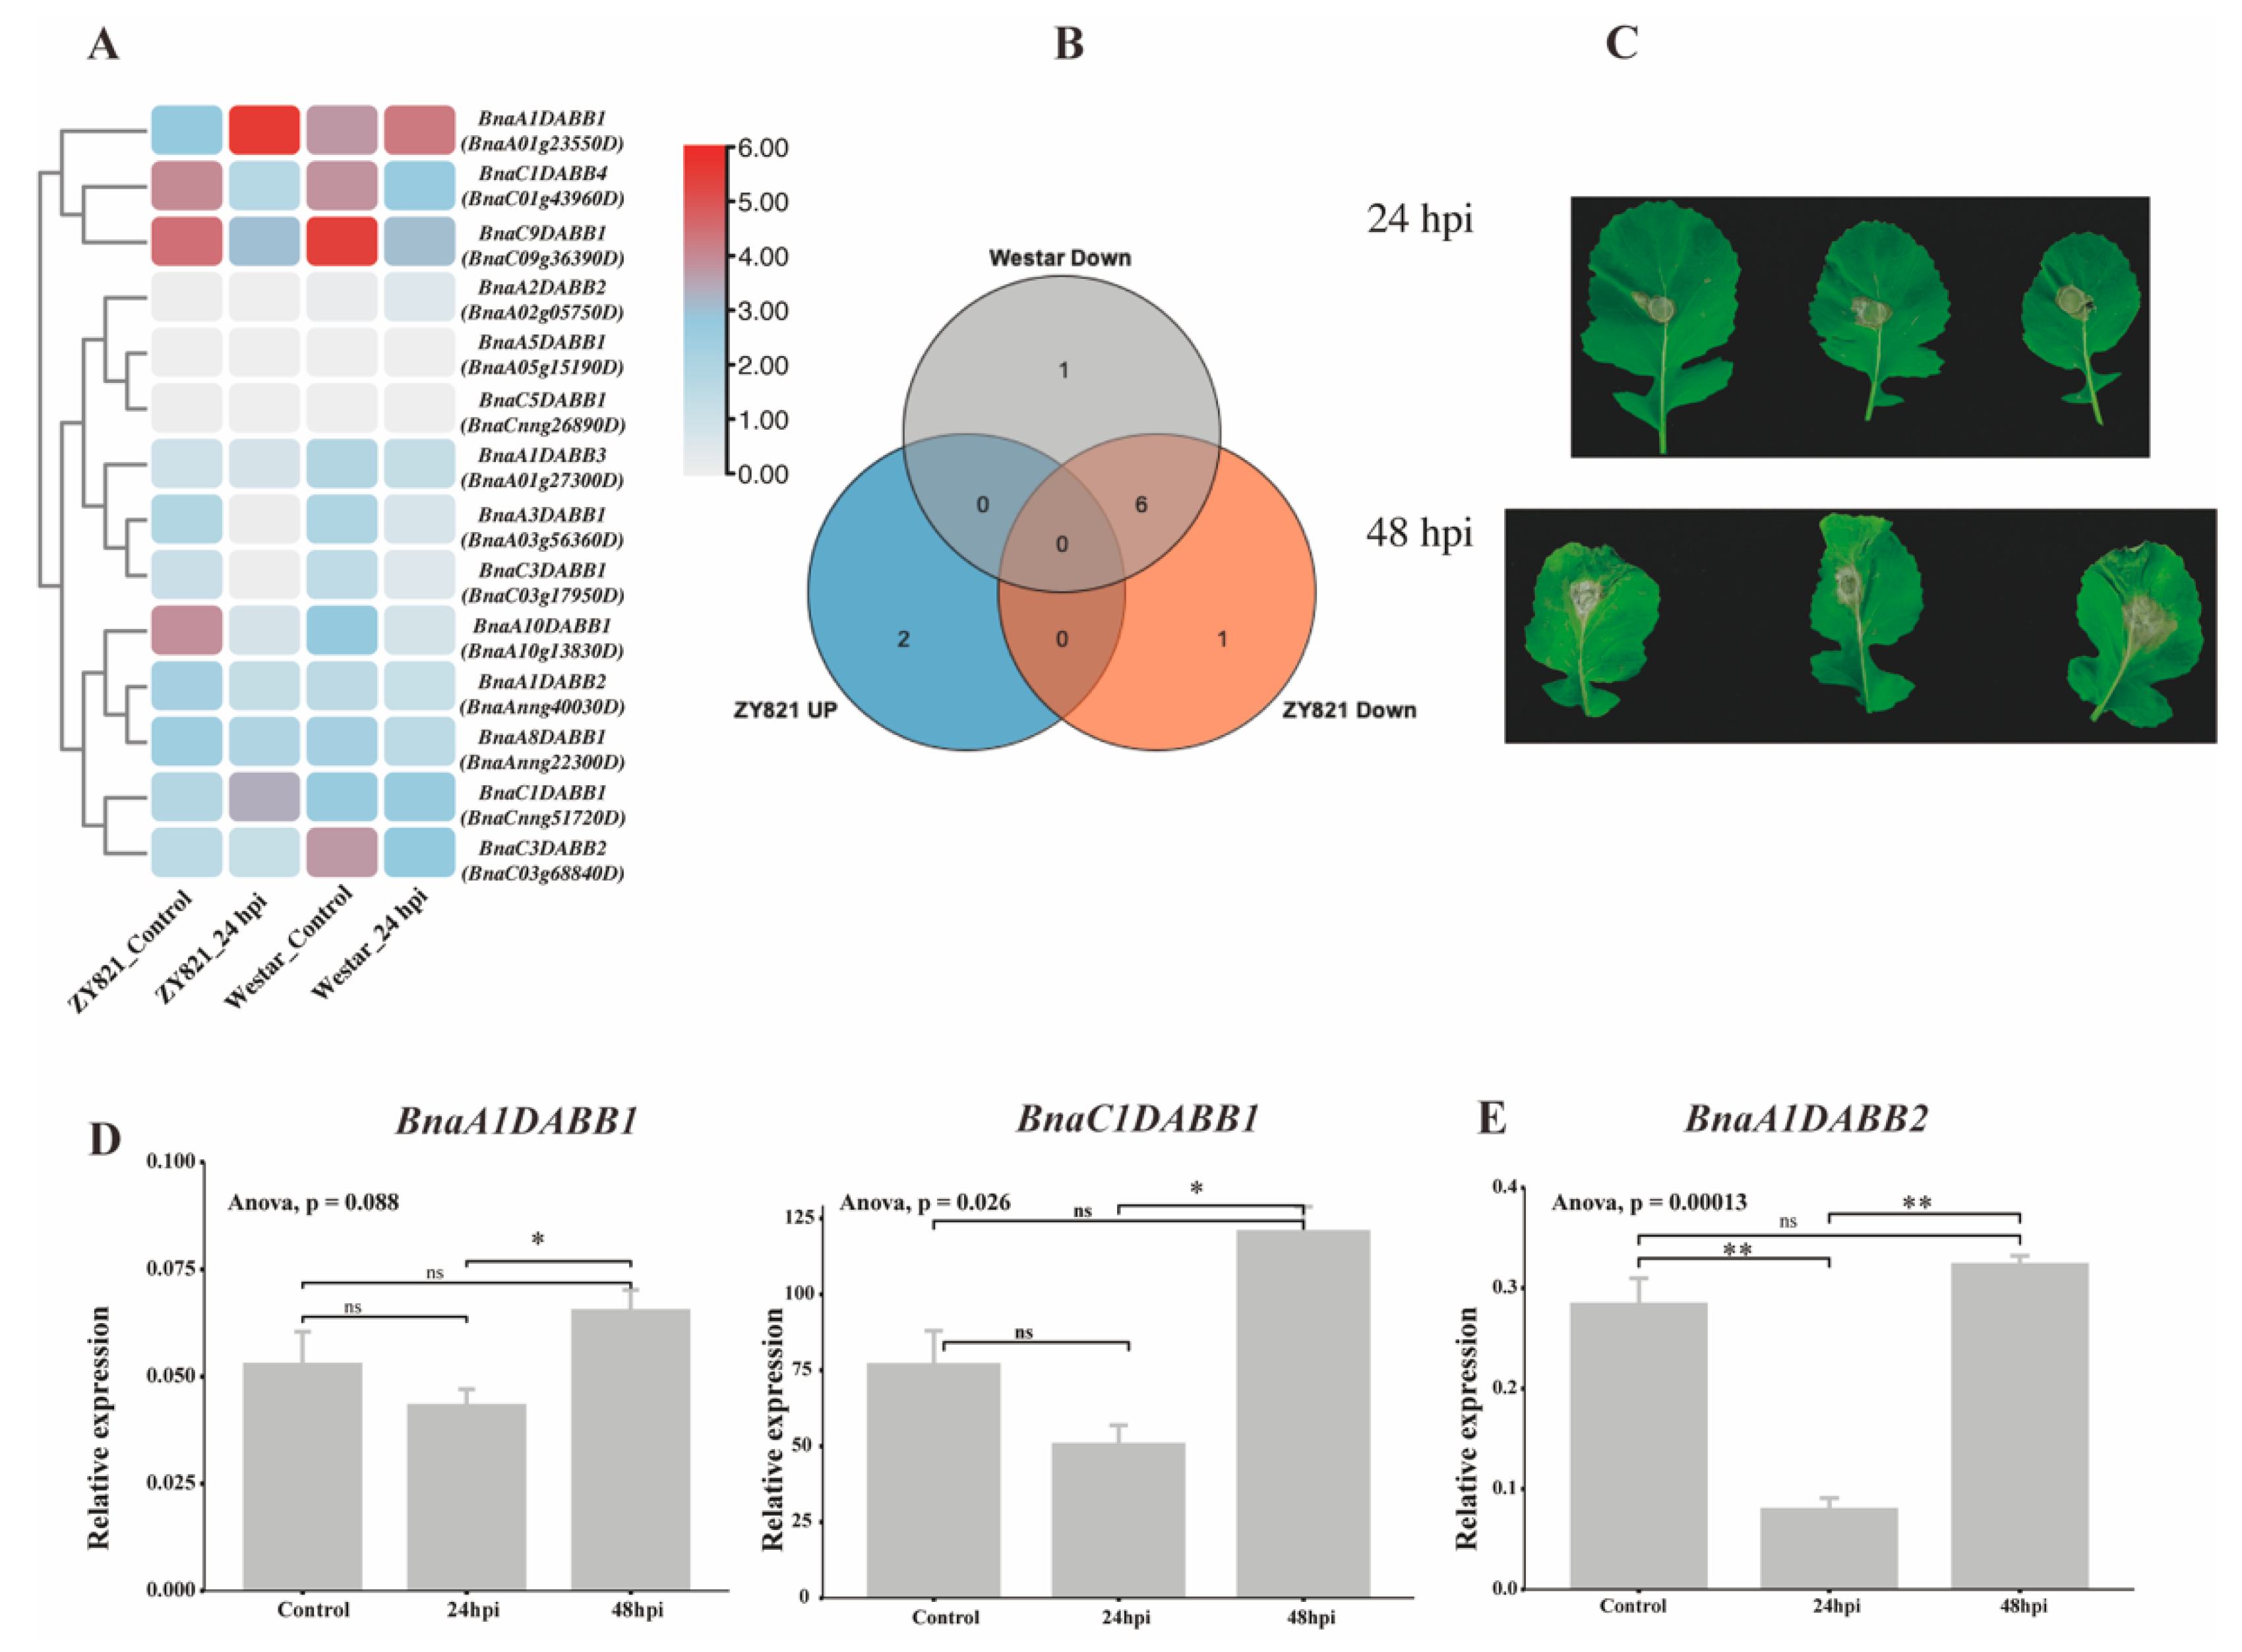
2.7. Expression Profiling of BnaDABBs during Infection by Sclerotinia sclerotiorum

To uncover the importance of BnaDABBs during the interaction between B. napus and S. sclerotiorum, we conducted an analysis of the expression levels of BnaDABBs in leaves of susceptible (B. napus cv. Westar, Westar) and middle tolerant (B. napus cv. ZhongYou 821, ZY821) varieties after 24 h of pathogen exposure (Figure 5A, Supplementary Table S10). The examination unveiled an upregulation of 2 BnaDABBs and a downregulation of 7 BnaDABBs in ZY821, while in Westar, 7BnaDABBs were downregulated. Moreover, compared to Westar, BnaCnng51720D and BnaA01g23550D were upregulated, whereas BnaAnng40030D was downregulated in ZY 821. Additionally, we also observed a downregulation in the expression levels of six shared BnaDABBs in both ZY 821 and Westar (Figure 5B). These findings suggest that these genes, BnaCnng51720D, BnaA01g23550D and BnaAnng40030D, may contribute to the resistance of B. napus against S. sclerotiorum.
As tolerant gene expression in varieties might be similar, and there remains a notable scarcity of data on the interaction between ZS11, a commonly used B. napus variety and S. sclerotiorum [11,12,13], we thus verified the highly homologous BnaDABBs in ZS11 (Supplementary Table S11) to gain a deeper understanding of their expression characteristics of BnaCnng51720D (BnaC1DABB1), BnaA01g23550D (BnaA1DABB1), and BnaAnng40030D (BnaA1DABB2) after 24 and 48 h of S. sclerotiorum infection using qPCR. The results indicated that at 24 h post-infection, there were no significant changes in the expression levels of BnaC1DABB1 and BnaA1DABB1, while the expression of BnaA1DABB2 significantly decreased (p < 0.01), consistent with the expression pattern observed in ZY 821. However, after 48 h of infection, the expression levels of these genes significantly increased, showing a notable change compared to 24 h (Figure 5C–E). These findings suggest that BnaC1DABB1, BnaA1DABB1, and BnaA1DABB2 may function differently in ZY82 and ZS11. The divergence may be associated with the distinct promoter sequences of these genes. To further validate this hypothesis, we conducted a comparative analysis of the promoter sequences of BnaC1DABB1, BnaA1DABB1, and BnaA1DABB2 in ZS11 and B. napus, and detected some differences in the 2000bp promoter sequences of these genes (Supplementary Table S12). Compared to ZY821, BnaA1DABB1 of ZS11 exhibited lower conservation and significant differences within the promoter sequence spanning 1 to 314 bp (Figure 6A). Similarly, BnaA1DABB2 of ZS11 showed reduced conservation and marked sequence divergence in the promoter region spanning 1 to 650 bp compared with ZY821 (Figure 6B). In addition, BnaC1DABB2 of ZS11 displayed lower conservation and substantial sequence differences in the promoter regions spanning 1 to 95 bp, 693 to 724 bp, and 1800 to 1895 bp compared to ZY821(Figure 6C).

3. Discussion

It is believed that B. napus (AACC, 2n = 38) originated from natural hybridization between B. rapa (AA, 2n = 20) and B. oleracea (CC, 2n = 18) more than 7,500 years ago [14]. Building upon this premise, we investigated the evolutionary processes underlying the formation of the BnaDABB gene family. Our analyses revealed that during evolution, B. napus retained 7 BnaDABBs from B. rapa and 6 BnaDABBs from B. oleracea. Furthermore, we found that tandem and segmental duplication are significant mechanisms driving the expansion of the BnaDABB gene family. In addition to the 13 BnaDABBs inherited from B. rapa and B. oleracea, B. napus acquired 3 additional BnaDABBs through these duplication events, resulting in the current set of 16 BnaDABBs. These results provide a deep understanding of the evolutionary history of the BnaDABB gene family.
A. thaliana [15], B. carinata [16], B. juncea [17], and C. sativa [18] are important species within the Brassicaceae family. Through synteny analysis to explore the evolutionary relationships of BnaDABB gene families in these species, we observed a widespread synteny relationship between B. napus and A. thaliana, B. carinata, B. juncea, and C. sativa. Compared to Arabidopsis, the DABB gene members in B. carinata, B. juncea, C. sativa, and B. napus exhibited an expanding trend during evolution. Moreover, we noticed that the majority of BnaDABBs showed conservation in evolution. These findings collectively suggest that DABB gene members may play significant biological roles in Brassicaceae species.
Plant hormones are critical signaling molecules that play essential roles in regulating plant growth, development, and responses to environmental stress [19,20]. Analysis of the cis-regulatory elements in the promoter regions of BnaDABBs revealed that the majority of BnaDABBs contain at least two or more hormone-responsive cis-elements, suggesting that BnaDABBs may function in hormone responses. To confirm this hypothesis, we analyzed the expression profiles of BnaDABBs under multiple hormone stresses. As expected, we found that in B. napus leaves and roots under jasmonic acid (JA) stress, the expression levels of BnaC1DABB2/3, BnaC9DABB1, and BnaA1/C1DABB1 significantly increased compared with the control group. Additionally, we observed that BnaA10DABB1 and BnaA8DABB1 might be associated with abscisic acid (ABA) stress. Under ABA stress, the expression of BnaA10DABB1 and BnaA8DABB1 significantly decreased. These findings suggest a potential yet unknown functional link between BnaDABBs and JA or ABA.
Research has confirmed that DABB genes may play a crucial role in abiotic stress responses. For instance, the SP1 [21] gene from Aspen shows responsiveness to various stress conditions such as salt, cold, and heat. Similarly, we found that under salt, drought, freezing, low temperature, high temperature, and osmotic stresses, the expression levels of BnaA1DABB3, BnaC1DABB4, BnaA10DABB1, and BnaC9DABB1 were downregulated compared to the control group. Additionally, the expression levels of BnaA1DABB3 and BnaC1DABB4 in leaves were downregulated after drought, low-temperature, and high-temperature treatments. When treating plant roots in the same manner, the expression levels of BnaC1DABB2/3 were downregulated after salt, drought, freezing, high-temperature, and osmotic stress treatments. Moreover, the expression levels of BnaA10DABB1 and BnaC9DABB1 were downregulated after salt, freezing, low-temperature, and high-temperature treatments but upregulated after drought treatment.
It was further observed that, in addition to plant hormones and abiotic stresses, BnaDABBs also responded to the infection of S. sclerotiorum. Within 24 h post-infection (hpi), the expression levels of most BnaDABBs were downregulated, yet by 48 hpi, the expression levels of BnaA1DABB2, BnaA10DABB1, and BnaA3DABB1 were significantly upregulated compared to 24 hpi, indicating a potential role of BnaDABBs in the interaction between S. sclerotiorum and rapeseed. This interaction might be regulated by methyl MeJA, as most BnaDABBs contain cis-acting elements responsive to MeJA, such as TGACG-motif and CGTCA-motif. Previous studies have shown that methyl MeJA can induce the expression of disease resistance genes in plants and play a critical role in plant disease resistance [22]. Additionally, research on DABB genes in Arabidopsis suggests that the expressed proteins exhibit antifungal activity and belong to a novel class of antifungal proteins [7,8]. Hence, it is plausible to postulated that DABB genes in rapeseed, induced by MeJA, may encode proteins with antifungal activity, thereby enhancing resistance against pathogenic fungi. However, further in-depth studies are required to validate the antifungal proteins encoded by DABBs in rapeseed.
In summary, our research indicates that the DABB genes have diverged into five evolutionarily conserved branches in rapeseed, which have roles in various hormone responses, abiotic stress, and biotic stress responses, providing a new understanding of DABBs in plants for further exploration of the functions of BnaDABBs in B. napus.

4. Materials and Methods

4.1. Fungal Strains and Culture Conditions

The wild-type strain S. sclerotiorum 1980 was grown on potato dextrose agar plates (potato dipping powder 5 g/L, glucose 20 g/L, agar 15 g/L, and chloramphenicol 0.1 g/L, Bio-Way Technology, Shanghai, China), and cultured in a constant temperature incubator at 20 °C.

4.2. Plant Materials and Growth Conditions

Seeds of B. napus (Zhongshuang 11, ZS11) were sterilized and put in a refrigerator at 4 °C for vernalization for 2–3 days, then planted on soil and cultivated in a growth room at a temperature of 22 °C, with a photoperiod of 16 h of light followed by 8 h of darkness. Following a 5-week cultivation period, the method described by previous researchers [12] was utilized to conduct the S. sclerotiorum infection.

4.3. Identification of DABB Genes in B. napus and Related Species

A BLASTP (2.12.0) [23] was conducted using the AtDABB protein sequence from A. thaliana against the B. napus (ZS11.v0) protein database, employing an e-value threshold of 1 × 10⁻¹⁰. Moreover, the Dabb domain hmm file (PF07876.hmm) was downloaded from the Pfam website [24] (http://pfam.xfam.org/, accessed on 11 October 2023), and the hmmsearch tool (HMMER 3.3.2) [25] was employed to identify potential genes harboring this conserved domain in the B. napus protein database. Duplicate genes were eliminated by comparing the outcomes of the two distinct searches. Subsequently, the remaining genes were subjected to further validation for the presence of the DABB-type domain using the CD search website [26] (https://www.ncbi.nlm.nih.gov/Structure/cdd/wrpsb.cgi, accessed on 11 October 2023) and the SMART website [27] (http://smart.embl-heidelberg.de/,accessed on 11 October 2023). By identifying the BnaDABB protein sequence, a parallel approach was employed to search for DABB proteins in B. carinata, B. juncea, B. rapa, B. oleracea, and C. sativa.
The AtDABB family protein sequences information can be found in Supplementary Material Text S2, and the protein and genome database of B.napus.ZS11.v0 and B.carinata.zd-1.v0, were downloaded from the BnIR website (https://yanglab.hzau.edu.cn/BnIR, accessed on 10 October 2023) [28]. The A. thaliana. TAIR10.57, B.juncea.ASM1870372v1.57, C.sativa.Cs.57, B.oleracea.BOL.57 and B.rapa.Brapa_1.0.57 protein and genome database was downloaded from the EnsembI Plants website (http://plants.ensembl.org/index.html, accessed on 10 October 2023).

4.4. Chromosomal Location, Subcellular Localization and Collinearity Analysis of BnaDABB Genes

To ascertain the chromosomal locations of the BnaDABBs in B. napus, the generic feature format (gff3) files and formatted sequence (fa) files of the B. napus genome were utilized to acquire positional data and the length of the chromosomes housing the BnaDABB genes. Subsequently, chromosome mapping was conducted employing the visualization tool MG2C (v2.1) [29]. The genome database, CDS database, and gff3 file were downloaded from the BnIR website (https://yanglab.hzau.edu.cn/BnIR/genome_data, accessed on 10 October 2023). The BnaDABBs were designated based on their respective positions on the chromosomes. Furthermore, the subcellular localization of the identified BnaDABB family members was assessed using Plant-mPLoc [30] (http://www.csbio.sjtu.edu.cn/bioinf/plant-multi/, accessed on 11 October 2023). The Python version3.9.16 of MCScan (JCVI toolkit 1.3.2) [31] was utilized to investigate the intra- and inter-species collinearity relationships of the BnaDABB gene family.

4.5. Phylogenetic Analysis and Biochemical Properties Calculation

Multiple sequences alignment of the BnaDABB proteins and promoter sequences were performed using the Clustal Omega program [32] (https://www.ebi.ac.uk/Tools/msa/clustalo/, accessed on 16 October 2023). Then, a phylogenetic tree was constructed via the neighbor-joining (NJ) method using MEGA 11 [33] software with 1000 bootstrap repetitions. The multiple sequences alignment results were generated by the visualization tool Jalview 2.11.3.2. The software MEME5.5.1 [34] was used to investigate the conserved motifs of BnaDABB proteins; the parameters were set with the maximum number of motifs as 11 and the motif width as 6–100 amino acids. The phylogenetic tree and conserved domain were visualized using iTOL V6 software [35] (https://itol.embl.de, accessed on 16 October 2023). The BnaDABB gene family members were subjected to 3D model construction using the homology modeling software SWISS-MODEL (https://swissmodel.expasy.org, accessed on 16 October 2023) [36]. The constructed models were subsequently evaluated using the online software SAVES (https://saves.mbi.ucla.edu, accessed on 16 October 2023). The 3D structure of the protein domain of BnaDABBs was visualized using VMD1.9.4 software [37], and the BnaDABB protein biochemical properties were predicted using the ExPASy ProtParam tool [38] (https://web.expasy.org/protparam/, accessed on 16 October 2023).

4.6. Analysis of Cis-Element, Expression Patterns and Abiotic Stress

To identify the cis-element of BnaDABBs, TBtools2.030 [39] was used to obtain the 2000 bp sequences of the genomic promoter. Then, the PlantCARE [40] was used to predict the cis-elements on these promoters. Thus, the number and types of different cis-acting elements in BnaDABBs were classified and visualized with excel. The expression patterns of BnaDABBs in different tissues and other abiotic stress treatment were obtained from the BnTIR (https://yanglab.hzau.edu.cn/BnTIR, accessed on 20 October 2023) database [28]. The heatmaps were drawn by TBtools2.030 [39].

4.7. RNA Extraction and RT–qPCR Analysis

Fungal mycelial plugs with a diameter of 5 mm were obtained from the S. sclerotiorum. These plugs were inoculated onto the leaves of rapeseed plants and covered with a layer of cling film to maintain the moisture of the fungal plugs. Leaf tissues within 1 cm of the infection site were collected immediately into liquid nitrogen after 24 h and 48h post-infection. This experiment was replicated three times. For the expression analysis of BnaDABBs, total RNA of the 0, 24, 48 post inoculation was isolated from the infected leaves using the Eastep™ Super Total RNA Extraction Kit (Promega, Madison, WI, USA). Reverse transcription was carried out using the GoScript™ Reverse Transcription System (Promega, Beijing, China). The RT-qPCR assay was carried out using 2 × SYBR Green Premix Pro Taq HS Premix (AG11702, Accurate Biotechnology (Hunan) Co., Ltd., Changsha, China) and a Step-One real-time fluorescence PCR instrument (Applied Biosystems, Foster City, CA, USA). The RT-qPCR reaction system contained 10 ng cDNA, 4 µM of each primer, 5 µL 2 × SYBR Green Premix Pro Taq HS Premix, 0.2 µL ROX reference dye, and 3.4 µL RNase-free water. The RT-qPCR programming was as follows: denaturation at 95 °C for 2 min, followed by 40 cycles (95 °C for 20 s, 55 °C for 20 s, and 72 °C for 30 s). BnaActin7 (BnaC09T0560200ZS) was used as the reference gene. Two or more independent biological replicates and three technical replicates of each sample were performed for quantitative PCR analysis, and the 2−ΔΔCt algorithm was used to analyze the results [39].
The RNA-seq data (Accession Number: GSE81545) was downloaded from NCBI GEO database (https://www.ncbi.nlm.nih.gov/geo/query/acc.cgi?acc=GSE81545, accessed on 20 November 2023). Gene-specific primers used in the experiments are listed in Supplementary Table S13.

Supplementary Materials

The supporting information can be downloaded at: https://www.mdpi.com/article/10.3390/ijms25115721/s1.

Author Contributions

Conceptualization, S.W., K.W. and S.X.; writing—original draft preparation, S.W., K.W. and S.X.; writing—review and editing, S.X. and Q.X.; formal analysis, K.W., S.W. and Q.X. All authors have read and agreed to the published version of the manuscript.

Funding

This research was funded by the National Nature Science Foundation of China (31971836).

Institutional Review Board Statement

Ethical review and approval were waived for this study because it did not involve humans or animals.

Informed Consent Statement

Not applicable.

Data Availability Statement

Data are contained within the article or Supplementary Materials.

Acknowledgments

We cordially thank Zhongsong Liu (Hunan Agricultural University) for sharing seeds of Zhongshuang11, and Jeffrey Rollins (University of Florida) for sharing WT S. sclerotiorum strain 1980.

Conflicts of Interest

The authors declare no conflicts of interest.

References

  1. Neik, T.X.; Amas, J.; Barbetti, M.; Edwards, D.; Batley, J. Understanding Host-Pathogen Interactions in Brassica napus in the Omics Era. Plants 2020, 9, 1336. [Google Scholar] [CrossRef] [PubMed]
  2. Nesi, N.; Delourme, R.; Bregeon, M.; Falentin, C.; Renard, M. Genetic and molecular approaches to improve nutritional value of Brassica napus L. seed. Comptes Rendus Biol. 2008, 331, 763–771. [Google Scholar] [CrossRef] [PubMed]
  3. Ding, L.N.; Li, T.; Guo, X.J.; Li, M.; Liu, X.Y.; Cao, J.; Tan, X.L. Sclerotinia Stem Rot Resistance in Rapeseed: Recent Progress and Future Prospects. J. Agric. Food Chem. 2021, 69, 2965–2978. [Google Scholar] [CrossRef] [PubMed]
  4. Neik, T.X.; Barbetti, M.J.; Batley, J. Current Status and Challenges in Identifying Disease Resistance Genes in Brassica napus. Front. Plant Sci. 2017, 8, 1788. [Google Scholar] [CrossRef] [PubMed]
  5. Bolton, M.D.; Thomma, B.P.; Nelson, B.D. Sclerotinia sclerotiorum (Lib.) de Bary: Biology and molecular traits of a cosmopolitan pathogen. Mol. Plant Pathol. 2006, 7, 1–16. [Google Scholar] [CrossRef] [PubMed]
  6. Zhang, X.; Cheng, J.; Lin, Y.; Fu, Y.; Xie, J.; Li, B.; Bian, X.; Feng, Y.; Liang, W.; Tang, Q.; et al. Editing homologous copies of an essential gene affords crop resistance against two cosmopolitan necrotrophic pathogens. Plant Biotechnol. J. 2021, 19, 2349–2361. [Google Scholar] [CrossRef] [PubMed]
  7. Lee, J.R.; Lee, S.S.; Park, S.C.; Kang, J.S.; Kim, S.Y.; Lee, K.O.; Lee, S.Y. Functional characterization of pathogen-responsive protein AtDabb1 with an antifungal activity from Arabidopsis thaliana. Biochim. Biophys. Acta 2008, 1784, 1918–1923. [Google Scholar] [CrossRef] [PubMed]
  8. Park, S.C.; Lee, J.R.; Shin, S.O.; Park, Y.; Lee, S.Y.; Hahm, K.S. Characterization of a heat-stable protein with antimicrobial activity from Arabidopsis thaliana. Biochem. Biophys. Res. Commun. 2007, 362, 562–567. [Google Scholar] [CrossRef] [PubMed]
  9. Gagne, S.J.; Stout, J.M.; Liu, E.; Boubakir, Z.; Clark, S.M.; Page, J.E. Identification of olivetolic acid cyclase from Cannabis sativa reveals a unique catalytic route to plant polyketides. Proc. Natl. Acad. Sci. USA 2012, 109, 12811–12816. [Google Scholar] [CrossRef]
  10. Yang, X.; Matsui, T.; Kodama, T.; Mori, T.; Zhou, X.; Taura, F.; Noguchi, H.; Abe, I.; Morita, H. Structural basis for olivetolic acid formation by a polyketide cyclase from Cannabis sativa. FEBS J. 2016, 283, 1088–1106. [Google Scholar] [CrossRef]
  11. Zhao, J.; Buchwaldt, L.; Rimmer, S.R.; Sharpe, A.; McGregor, L.; Bekkaoui, D.; Hegedus, D. Patterns of differential gene expression in Brassica napus cultivars infected with Sclerotinia sclerotiorum. Mol. Plant Pathol. 2009, 10, 635–649. [Google Scholar] [CrossRef] [PubMed]
  12. Girard, I.J.; Tong, C.; Becker, M.G.; Mao, X.; Huang, J.; de Kievit, T.; Fernando, W.G.D.; Liu, S.; Belmonte, M.F. RNA sequencing of Brassica napus reveals cellular redox control of Sclerotinia infection. J. Exp. Bot. 2017, 68, 5079–5091. [Google Scholar] [CrossRef] [PubMed]
  13. Seifbarghi, S.; Borhan, M.H.; Wei, Y.; Coutu, C.; Robinson, S.J.; Hegedus, D.D. Changes in the Sclerotinia sclerotiorum transcriptome during infection of Brassica napus. BMC Genom. 2017, 18, 266. [Google Scholar] [CrossRef] [PubMed]
  14. Hu, J.; Chen, B.; Zhao, J.; Zhang, F.; Xie, T.; Xu, K.; Gao, G.; Yan, G.; Li, H.; Li, L.; et al. Genomic selection and genetic architecture of agronomic traits during modern rapeseed breeding. Nat. Genet. 2022, 54, 694–704. [Google Scholar] [CrossRef] [PubMed]
  15. Meinke, D.W.; Cherry, J.M.; Dean, C.; Rounsley, S.D.; Koornneef, M. Arabidopsis thaliana: A model plant for genome analysis. Science 1998, 282, 662+679–682. [Google Scholar] [CrossRef] [PubMed]
  16. Song, X.; Wei, Y.; Xiao, D.; Gong, K.; Sun, P.; Ren, Y.; Yuan, J.; Wu, T.; Yang, Q.; Li, X.; et al. Brassica carinata genome characterization clarifies U’s triangle model of evolution and polyploidy in Brassica. Plant Physiol. 2021, 186, 388–406. [Google Scholar] [CrossRef] [PubMed]
  17. Thakur, A.K.; Parmar, N.; Singh, K.H.; Nanjundan, J. Current achievements and future prospects of genetic engineering in Indian mustard (Brassica juncea L. Czern & Coss.). Planta 2020, 252, 56. [Google Scholar] [CrossRef] [PubMed]
  18. Riaz, R.; Ahmed, I.; Sizmaz, O.; Ahsan, U. Use of Camelina sativa and By-Products in Diets for Dairy Cows: A Review. Animals 2022, 12, 1082. [Google Scholar] [CrossRef] [PubMed]
  19. Waadt, R.; Seller, C.A.; Hsu, P.K.; Takahashi, Y.; Munemasa, S.; Schroeder, J.I. Plant hormone regulation of abiotic stress responses. Nat. Rev. Mol. Cell Biol. 2022, 23, 680–694. [Google Scholar] [CrossRef] [PubMed]
  20. Ku, Y.S.; Sintaha, M.; Cheung, M.Y.; Lam, H.M. Plant Hormone Signaling Crosstalks between Biotic and Abiotic Stress Responses. Int. J. Mol. Sci. 2018, 19, 3206. [Google Scholar] [CrossRef]
  21. Wang, W.X.; Pelah, D.; Alergand, T.; Shoseyov, O.; Altman, A. Characterization of SP1, a stress-responsive, boiling-soluble, homo-oligomeric protein from aspen. Plant Physiol. 2002, 130, 865–875. [Google Scholar] [CrossRef] [PubMed]
  22. Yu, W.; Zhao, R.; Sheng, J.; Shen, L. SlERF2 Is Associated with Methyl Jasmonate-Mediated Defense Response against Botrytis cinerea in Tomato Fruit. J. Agric. Food Chem. 2018, 66, 9923–9932. [Google Scholar] [CrossRef]
  23. Boratyn, G.M.; Schaffer, A.A.; Agarwala, R.; Altschul, S.F.; Lipman, D.J.; Madden, T.L. Domain enhanced lookup time accelerated BLAST. Biol. Direct 2012, 7, 12. [Google Scholar] [CrossRef] [PubMed]
  24. Mistry, J.; Chuguransky, S.; Williams, L.; Qureshi, M.; Salazar, G.A.; Sonnhammer, E.L.L.; Tosatto, S.C.E.; Paladin, L.; Raj, S.; Richardson, L.J.; et al. Pfam: The protein families database in 2021. Nucleic Acids Res. 2021, 49, D412–D419. [Google Scholar] [CrossRef] [PubMed]
  25. Eddy, S.R. Accelerated Profile HMM Searches. PLoS Comput. Biol. 2011, 7, e1002195. [Google Scholar] [CrossRef]
  26. Wang, J.; Chitsaz, F.; Derbyshire, M.K.; Gonzales, N.R.; Gwadz, M.; Lu, S.; Marchler, G.H.; Song, J.S.; Thanki, N.; Yamashita, R.A.; et al. The conserved domain database in 2023. Nucleic Acids Res. 2023, 51, D384–D388. [Google Scholar] [CrossRef] [PubMed]
  27. Letunic, I.; Khedkar, S.; Bork, P. SMART: Recent updates, new developments and status in 2020. Nucleic Acids Res. 2021, 49, D458–D460. [Google Scholar] [CrossRef]
  28. Yang, Z.; Wang, S.; Wei, L.; Huang, Y.; Liu, D.; Jia, Y.; Luo, C.; Lin, Y.; Liang, C.; Hu, Y.; et al. BnIR: A multi-omics database with various tools for Brassica napus research and breeding. Mol. Plant 2023, 16, 775–789. [Google Scholar] [CrossRef]
  29. Chao, J.; Li, Z.; Sun, Y.; Aluko, O.O.; Wu, X.; Wang, Q.; Liu, G. MG2C: A user-friendly online tool for drawing genetic maps. Mol. Hortic. 2021, 1, 16. [Google Scholar] [CrossRef]
  30. Chou, K.C.; Shen, H.B. Plant-mPLoc: A top-down strategy to augment the power for predicting plant protein subcellular localization. PLoS ONE 2010, 5, e11335. [Google Scholar] [CrossRef]
  31. Wang, Y.; Tang, H.; Debarry, J.D.; Tan, X.; Li, J.; Wang, X.; Lee, T.H.; Jin, H.; Marler, B.; Guo, H.; et al. MCScanX: A toolkit for detection and evolutionary analysis of gene synteny and collinearity. Nucleic Acids Res. 2012, 40, e49. [Google Scholar] [CrossRef]
  32. Madeira, F.; Pearce, M.; Tivey, A.R.N.; Basutkar, P.; Lee, J.; Edbali, O.; Madhusoodanan, N.; Kolesnikov, A.; Lopez, R. Search and sequence analysis tools services from EMBL-EBI in 2022. Nucleic Acids Res. 2022, 50, W276–W279. [Google Scholar] [CrossRef] [PubMed]
  33. Tamura, K.; Stecher, G.; Kumar, S. MEGA11: Molecular Evolutionary Genetics Analysis Version 11. Mol. Biol. Evol. 2021, 38, 3022–3027. [Google Scholar] [CrossRef]
  34. Bailey, T.L.; Johnson, J.; Grant, C.E.; Noble, W.S. The MEME Suite. Nucleic Acids Res. 2015, 43, W39–W49. [Google Scholar] [CrossRef] [PubMed]
  35. Letunic, I.; Bork, P. Interactive Tree Of Life (iTOL) v5: An online tool for phylogenetic tree display and annotation. Nucleic Acids Res. 2021, 49, W293–W296. [Google Scholar] [CrossRef] [PubMed]
  36. Waterhouse, A.; Bertoni, M.; Bienert, S.; Studer, G.; Tauriello, G.; Gumienny, R.; Heer, F.T.; de Beer, T.A.P.; Rempfer, C.; Bordoli, L.; et al. SWISS-MODEL: Homology modelling of protein structures and complexes. Nucleic Acids Res. 2018, 46, W296–W303. [Google Scholar] [CrossRef]
  37. Humphrey, W.; Dalke, A.; Schulten, K. VMD: Visual molecular dynamics. J. Mol. Graph. 1996, 14, 33–38. [Google Scholar] [CrossRef]
  38. Wilkins, M.R.; Gasteiger, E.; Bairoch, A.; Sanchez, J.C.; Williams, K.L.; Appel, R.D.; Hochstrasser, D.F. Protein identification and analysis tools in the ExPASy server. Methods Mol. Biol. 1999, 112, 531–552. [Google Scholar] [CrossRef]
  39. Chen, C.; Wu, Y.; Li, J.; Wang, X.; Zeng, Z.; Xu, J.; Liu, Y.; Feng, J.; Chen, H.; He, Y.; et al. TBtools-II: A “one for all, all for one” bioinformatics platform for biological big-data mining. Mol. Plant 2023, 16, 1733–1742. [Google Scholar] [CrossRef]
  40. Lescot, M.; Dehais, P.; Thijs, G.; Marchal, K.; Moreau, Y.; Van de Peer, Y.; Rouze, P.; Rombauts, S. PlantCARE, a database of plant cis-acting regulatory elements and a portal to tools for in silico analysis of promoter sequences. Nucleic Acids Res. 2002, 30, 325–327. [Google Scholar] [CrossRef]
Figure 1. Distributions of BnaDABBs on the chromosomes of B. napus. Scaffold A or scaffold C represents A or C subgenome of B. napus respectively. The chromosome numbers are shown at the tops of the Scaffold. BnaDABBs names and IDs were labeled at the left or right of the chromosomes. Scale bars on the left indicate the chromosome lengths (Mb).
Ijms 25 05721 g001
Figure 2. Evolutionary analysis of the BnaDABBs: (A) collinearity analysis of the genomes of B. napus, B. rapa, and B. oleracea. Grey lines represent syntenic sequences, and the highlighted red and blue lines indicated syntenic gene pairs of BnaDABBs; (B) analysis of segmental and tandem duplication of the BnaDABBs. The values indicate identity (%); (C) phylogenetic tree analysis of B. napus, A. thaliana, B. carinata, B. juncea and C. sativa by time tree (http://www.timetree.org, accessed on 11 October 2023); (D) the number of DABBs presented in B. napus, A. thaliana, B. carinata, B. juncea and C. sativa; and (E) collinearity analysis of the genomes of B. napus, A. thaliana, B. carinata, B. juncea, and C. sativa. The chromosome number was labeled at the top or bottom of each chromosome. The colored bars represent the chromosomes of the different species. The grey lines in the background indicate the collinear blocks in the genomes of the two species connected by the grey lines, while the colored lines highlight the syntenic DABB gene pairs.
Ijms 25 05721 g002
Figure 3. Phylogenetic, protein sequences and structure analysis of the BnaDABB proteins: (A) phylogenetic analysis; (B) conservative structural domain analysis; (C) conservative motif identification. The quantity of various types of motifs was represented by a green color scale, with a color range from minimum to maximum. The larger the value, the darker the color; and (D) A comparative evaluation was carried out on the three-dimensional protein structures of BnaDABBs in ZS11. The SWISS-MODEL was employed in the construction of the 3D protein structure models of BnaDABBs, and visualized using the Rainbow Model color scheme. (E) A contrastion was made on the 3D models of DABB structural domains of BnaDABB proteins in ZS11. The distinct secondary protein structures were represented using different colors in the visualization process of the DABB-type domains of BnaDABB proteins, which was executed through VMD.
Ijms 25 05721 g003
Figure 4. Analysis of cis-element and expression patterns: (A) Cis-elements associated with light responsiveness; (B) Cis-elements associated with phytohormone responsiveness; (C) Cis-elements associated with binding site; (D) Cis-elements associated with light responsiveness; and (E) other cis-elements.
Ijms 25 05721 g004
Figure 5. Analysis of expression profiling of BnaDABBs during S. sclerotiorum infection: (A) expression profiling of BnaDABBs during S. sclerotiorum infection in B. napus of ZY821 and Westar at 24 hpi; (B) number of shared and BnaDABB genes between ZY821 and Westar; (C) lesions induced by S. sclerotiorum on the leaves of ZS11 following inoculation in B. napus; (D) expression profiling of BnaC1DABB1, BnaA1DABB1 during S. sclerotiorum infection in ZS11 at 24 and 48 hpi; and (E) expression profiling of BnaA1DABB2during S. sclerotiorum infection in ZS11 at 24 and 48 hpi.The experiment was conducted three times with similar results. Error bars represent the standard deviation (SD). The expression data was subjected to statistical analysis and visualization using the R package ggpubr (https://rpkgs.datanovia.com/ggpubr/, accessed on 10 January 2024). One-way analysis of variance (ANOVA) and Student’s t-test were employed to determine the significant differences among the control group, 24 h post-infection (24 hpi), and 48 h post-infection (48 hpi) Student’s t-test (ns indicates no significant difference; * indicates significant difference at 0.05 level, p < 0.05; ** indicates significant difference at 0.01 level, p < 0.01).
Ijms 25 05721 g005
Figure 6. Promoter sequence analysis: (A) Promoter sequence comparison of the BnaA1DABB1 gene between species ZS11 and ZY821; (B) Promoter sequence comparison of the BnaA1DABB2 gene between species ZS11 and ZY821; and (C) Promoter sequence comparison of the BnaC1DABB1 gene between species ZS11 and ZY821. Color represents the degree of conservatism of sequence loci, with darker colors indicating greater conservatism.
Ijms 25 05721 g006
Table 1. Physio-biochemical characterization of BnaDABB family members.
GroupNameGene IDMolecular WeightTheoretical pIInstability IndexAliphatic IndexGrand Average of Hydropathicity
ABnaA1DABB2BnaA01T0335700ZS11,213.855.461993.43−0.297
ABnaA1DABB3BnaA01T0336100ZS12,142.965.4126.7295.61−0.103
ABnaC1DABB2BnaC01T0415000ZS12,142.965.4224.8694.67−0.123
ABnaC1DABB3BnaC01T0415300ZS12,147.985.2625.8395.61−0.106
ABnaC1DABB4BnaC01T0415500ZS12,115.945.4127.4295.61−0.077
BBnaA2DABB1BnaA02T0092900ZS13,701.938.7635.9282.07−0.146
BBnaA10DABB1BnaA10T0163300ZS12,321.085.2222.9585.950.109
BBnaC9DABB1BnaC09T0446500ZS12,351.115.2223.7285.950.105
CBnaA1DABB1BnaA01T0288700ZS29,132.537.1445.998.520.051
CBnaC1DABB1BnaC01T0354600ZS29,343.927.1448.9899.930.054
DBnaA5DABB1BnaA05T0173100ZS22,568.014.8533.16107.330.073
DBnaA8DABB1BnaA08T0024400ZS22,540.815.1730.86101.67−0.085
DBnaC3DABB2BnaC03T0784700ZS22,363.705.4928.18101.7−0.087
DBnaC5DABB1BnaC05T0290400ZS22,643.115.1234.97108.30.046
EBnaA3DABB1BnaA03T0156300ZS31,777.885.5131.2477.61−0.286
EBnaC3DABB1BnaC03T0182000ZS31,751.785.435.7779.36−0.286
Disclaimer/Publisher’s Note: The statements, opinions and data contained in all publications are solely those of the individual author(s) and contributor(s) and not of MDPI and/or the editor(s). MDPI and/or the editor(s) disclaim responsibility for any injury to people or property resulting from any ideas, methods, instructions or products referred to in the content.

