Article

Trimeric and Tetrameric Cationic Styryl Dyes as Novel Fluorescence and CD Probes for ds-DNA and ds-RNA

by
Dijana Pavlović Saftić
1,
Ivona Krošl Knežević
1,
Fernando de Lera Garrido
2,3,
Juan Tolosa
2,3,
Dragomira Majhen
4,
Ivo Piantanida
1,* and
Joaquín Calixto García Martínez
2,3,*
1
Division of Organic Chemistry & Biochemistry, Ruđer Bošković Institute, 10000 Zagreb, Croatia
2
Department of Inorganic and Organic Chemistry and Biochemistry, Faculty of Pharmacy, Universidad de Castilla-La Mancha, C/José María Sánchez Ibáñez s/n, 02008 Albacete, Spain
3
Regional Center for Biomedical Research (CRIB), Universidad de Castilla-La Mancha, C/Almansa 13, 02008 Albacete, Spain
4
Division of Molecular Biology, Ruđer Bošković Institute, 10000 Zagreb, Croatia
*
Authors to whom correspondence should be addressed.
Int. J. Mol. Sci. 2024, 25(11), 5724; https://doi.org/10.3390/ijms25115724
Submission received: 9 April 2024 / Revised: 16 May 2024 / Accepted: 20 May 2024 / Published: 24 May 2024

Abstract

:
The wide use of mono- or bis-styryl fluorophores in biomedical applications prompted the presented design and study of a series of trimeric and tetrameric homo-analogues, styryl moieties arranged around a central aromatic core. The interactions with the most common biorelevant targets, ds-DNA and ds-RNA, were studied by a set of spectrophotometric methods (UV-VIS, fluorescence, circular dichroism, thermal denaturation). All studied dyes showed strong light absorption in the 350–420 nm range and strongly Stokes-shifted (+100–160 nm) emission with quantum yields (Φf) up to 0.57, whereby the mentioned properties were finely tuned by the type of the terminal cationic substituent and number of styryl components (tetramers being red-shifted in respect to trimers). All studied dyes strongly interacted with ds-DNA and ds-RNA with 1–10 nM−1 affinity, with dye emission being strongly quenched. The tetrameric analogues did not show any particular selectivity between ds-DNA or ds-RNA due to large size and consequent partial, non-selective insertion into DNA/RNA grooves. However, smaller trimeric styryl series showed size-dependent selective stabilization of ds-DNA vs. ds-RNA against thermal denaturation and highly selective or even specific recognition of several particular ds-DNA or ds-RNA structures by induced circular dichroism (ICD) bands. The chiral (ICD) selectivity was controlled by the size of a terminal cationic substituent. All dyes entered efficiently live human cells with negligible cytotoxic activity. Further prospects in the transfer of ICD-based selectivity into fluorescence-chiral methods (FDCD and CPL) is proposed, along with the development of new analogues with red-shifted absorbance properties.

1. Introduction

Small molecules acting as antitumor drugs are extensively used in therapy, whereby most activity pathways are based on the non-covalent interactions of small molecules with DNA. Some such molecules (prodrugs) are not toxic by themselves and, thus, are harmlessly distributed in the patient’s body–but irradiation of particular body parts by light triggers various molecular mechanisms in prodrugs, causing strong toxicity and well-localized antitumor activity. Such an approach is called photodynamic therapy (PDT) and is intensively used in clinics on well-defined, non-operable tumors. Such photo-active molecules are also strongly fluorescent, often characterized by a long-living triplet state, allowing oxygen sensitization or similar processes [1].
Their fluorescence can also be used in bioimaging, and it is important in the viewing of individual organelles, organs, and organisms because it may give exceptional spatial and temporal resolution. This approach, when combined with the right set of imaging reagents, may be used to selectively monitor “targeted analytes” in cells, organs, and even complete organisms [2,3,4,5,6,7,8,9]. As a general rule, a good fluorescent probe should be able to target specific organelles while not influencing their shape and physiology [10,11,12,13,14].
Due to their favorable optical properties and the plethora of available synthetic approaches and modification protocols, styryl dyes provide an attractive scaffold for creating cellular probes. This building block can be found among several antiviral, antifungal [15,16], antibacterial [17], and anticancer medicines [18] and inhibitors of HIV integrase [19]. This class of compounds has attracted a lot of interest because of its electroluminescence and photochromic capabilities, which might make them useful in optical devices [20,21] or as sensors [22] and biosensors [23,24,25]. Further, a 4-aminostyryl derivative of 6-methylquinoline showed potential therapeutic and diagnostic characteristics against Alzheimer’s disease [26]. A styryl-quinoline dye with the dipicolyamine moiety exhibited multicolor fluorescence recognition of various metal ions [27]. Also, membrane dyes SynaptoGreenTM and SynaptoRedTM (formerly known as FM® dyes) were used to track endocytic vesicles.
Recently, we reported on novel styryl and bis-styryl dyes [28], with particularly intriguing remarkable Stokes red shifts of emission maxima up to Δλ = 150 nm. These dyes showed that the volume or positioning of terminal aromatic substituents directly controlled the DNA/RNA binding, shifting between DNA/RNA groove binding or DNA/RNA intercalation; consequently, some dyes yielded specific fluorimetric or CD responses for various DNA or RNA. Some dyes showed promising antiproliferative activity combined with selective fluorimetric intracellular staining (thus acting as theranostic agents), while others were biologically inactive but still selectively staining various cellular organelles [28,29]. Further, we very recently designed and studied monocationic styryl dyes [30] with fluorescence quantum yields strongly dependent on the selection of the N-quaternary heterocycle. New dyes interacted non-covalently with DNA/RNA by micromolar affinity, yielding a strong fluorescence increase strongly dependent on a heterocycle of a dye. Studied dyes showed mostly negligible cytotoxic activity, combined with localization between mitochondria and lysosomes, selectivity finely tuned by choice of the heterocycle. In this line, and as precursor results, we had shown that tris(styryl)benzenes functionalized properly with a peptide sequence able to bind to A/T-rich sites in DNA and were able to act as biomarkers for DNA three-way junctions [25].
Intrigued by the obtained results for mono- and bis-styryl dyes [28,30], the question arose whether the multiplicity of the styryl motif in one molecule could improve some aforementioned properties. Thus, we designed a novel generation of styryl dyes (Scheme 1) based on a variation of three distinct structural features:
(a)
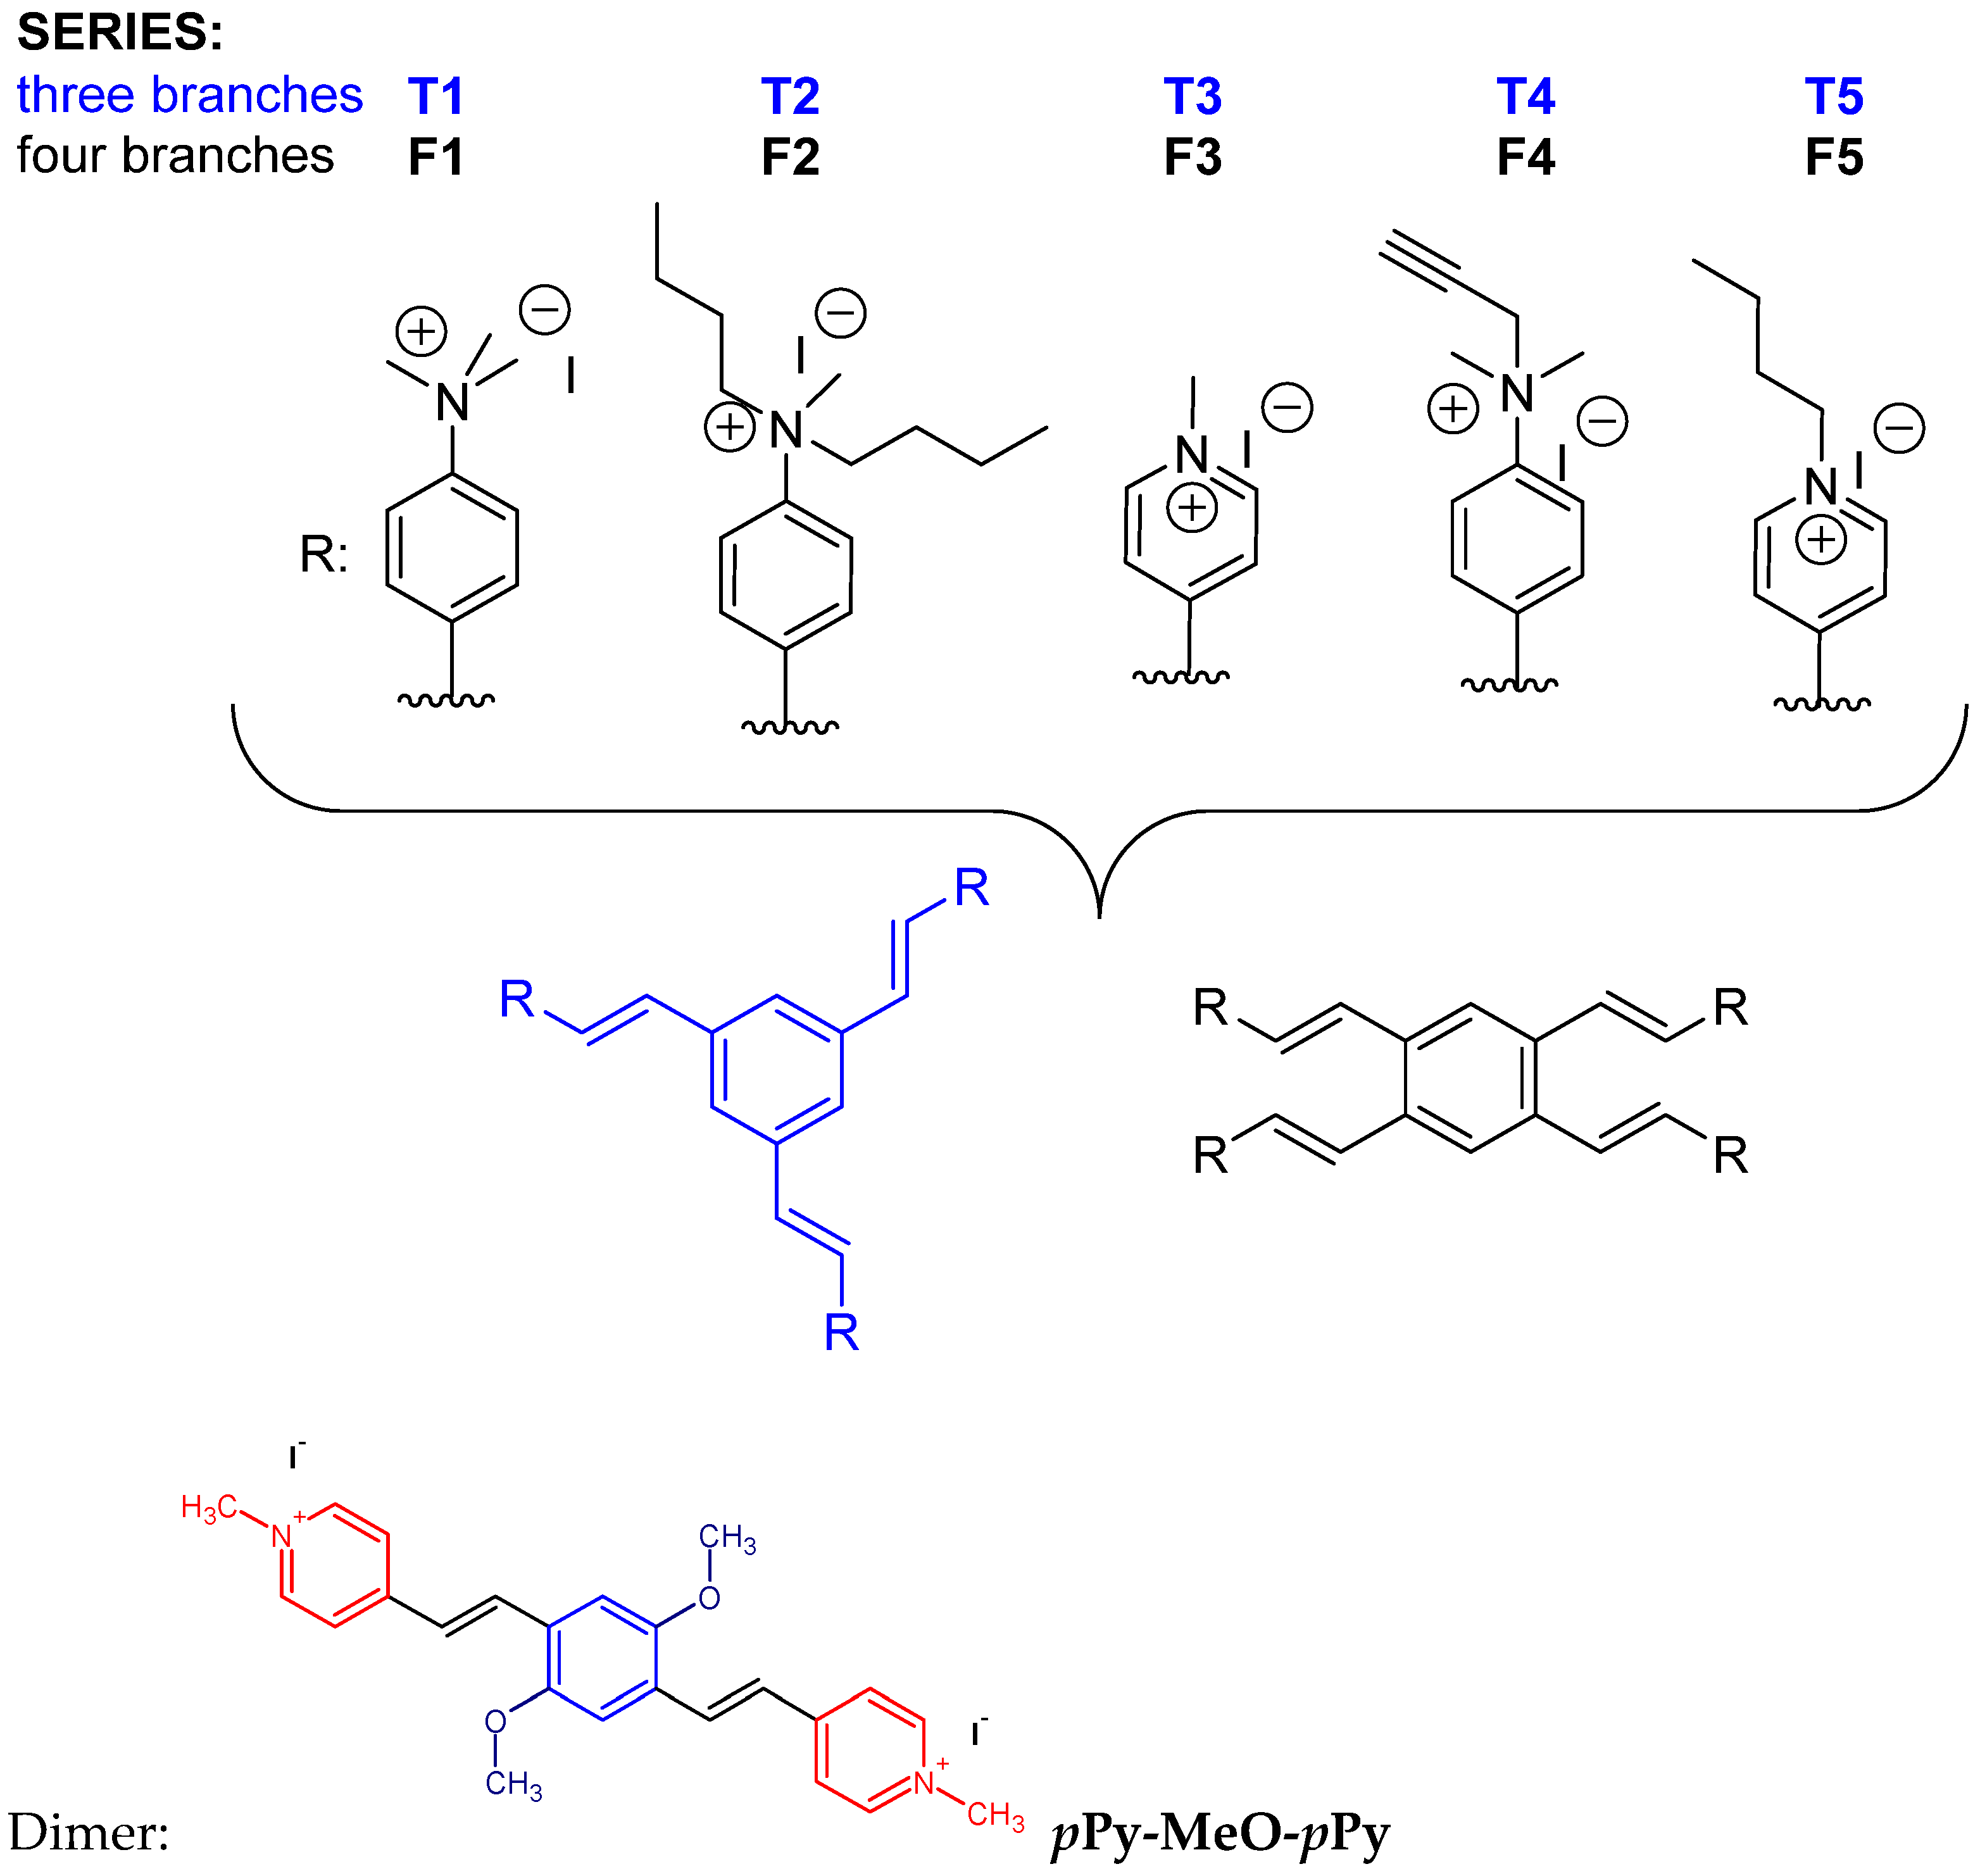
multiplicity of styryl motif through attaching three or four styryl moieties to one central aromatic core;
(b)
type of positive charge by comparing heterocyclic cationic species with exocyclic per-alkylated amines;
(c)
steric shielding of positive charge by the introduction of smaller or larger alkylating groups.
Scheme 1. Structures of studied dyes: T represents trimeric core and F tetrameric core, to which are attached substituents R to form two groups of five analogues each. Dimer pPy-MeO-pPy: previously studied analogue of T3 and F3 [28].
Ijms 25 05724 sch001
To make it easier for the reader to follow the discussion, structures with three branches have been named T1 to T5, and those with four branches have been named F1 to F5.
Polynucleotides we used to investigate modes of binding were the most commonly used ds-DNA representatives with specific structural features (Supp. Info., Table S1): calf thymus (ct)-DNA characterized by typical B-helical structure and approximately equimolar number of G–C and A–T base pairs, synthetic polynucleotides poly(dAdT)2, and poly(dGdC)2 also having B-helical structure, but the latter one characterized by guanine amino groups sterically blocking the minor groove, and a synthetic ds-RNA representative, poly A–poly U, characterized by A-helical structure [31,32].

2. Results and Discussion

2.1. Synthesis

The preparation of the ten compounds tested as probes in this article involves the Horner–Wadsworth–Emmons reaction of the corresponding tris- or tetrakis-phosphonate derivative with three or four equivalents of the selected aldehyde in the presence of potassium tert-butoxide, followed by the full quaternization of the corresponding dialkylamine or pyridine moieties with an excess of the alkylating iodide. Scheme 2 shows the synthetic route to the preparation of F1 as an example of the procedure. All 1H-NMR spectra of the products after the HWE reaction show a coupling constant of 16 Hz between the vinylic protons, proving the absence of any formation of cis adducts. Further details about experimental conditions and the characterization of these compounds are available in the Supp. Info.

2.2. Photophysical Studies of the New Dyes in Aqueous Solutions

All compounds were dissolved in DMSO at 1 × 10⁻² mol dm−3. The stock solutions were stored at +4 °C, and working aliquots were kept at +25 °C. No visible precipitation in working solutions was noticed. The UV-Vis spectra in aqueous solution (Figure 1a) are proportional to the concentration of dye up to c = 1 × 10⁻⁵ M (4 × 10⁻⁶ M) (Supp. Info., Figures S1a–S10a), yielding molar absorptivity (Table 1, ε). The obtained results do not support the formation of aggregates in the conditions used.
The UV-Vis spectra of all studied dyes were not significantly temperature-dependent (Supp. Info., Figures S1b–S10b), revealing excellent stability upon heating and reproducibility upon reversibly cooling down the sample solutions within the 25 °C to 95 °C temperature range. However, the UV-Vis spectra of all dye aqueous solutions changed when stored for several days in the dark, suggesting chemical decomposition, thus fresh solutions from DMSO stock solution were prepared daily.
Detailed analysis of UV-Vis spectra (Figure 1a) revealed a strong impact of the number of substituents on the central aryl, the tetra-substituted analogues generally being red-shifted in comparison to tri-substituted counterparts. This has been previously observed by some of us in analogous derivatives [21,33], and it is because a conjugation is more effective in the tetra derivatives, leading to a reduction in the energy gap between the HOMO and LUMO and thus a red shift of absorption. Also, methyl- and buthyl-pyridylium analogues (T3, F3, T5, and F5) cause pronounced bathochromic shift of the absorption maximum (Δλ > +30 nm) in comparison with trialkyl-N-quaternary-substituted compounds T1, T2, T4, F1, F2, and F4. This is because the quaternization of pyridinic nitrogen leads to a more electron-withdrawing group than the corresponding anilinium derivative. Being more electron-withdrawing, it further destabilizes the HOMO and reduces the HOMO–LUMO energy gap, red-shifting the absorbed light.
All compounds showed fluorescence emission maxima following the trend observed for UV-Vis maxima (Figure 1a,b), namely tetra-substituted and pyridylium analogues being bathochromically shifted in comparison to tri-substituted and trialkyl-N-quaternary analogues. All studied dyes exhibit remarkable Stokes shifts, ranging from 97 nm to 165 nm, depending on the employed chromophores as building blocks. These high Stokes shifts have been observed previously and are due to a structural reorganization of the molecule in the excited state, leading to a planarization of one of its branches in the case of the tri-substituted and two branches in the case of the tetra-substituted. This planarization in the excited state leads to an increase in the conjugation of the molecule in the excited state, an energetic stabilization of this state, and a more red-shifted emission of light [21,33]. This feature gives them an additional advantage in terms of possible biological applications of the new probes [34,35]. The emission intensity of all dyes was proportional to concentration within the 5 × 10⁻⁸–2.5 × 10⁻⁷ M range (Supp. Info., Figures S11–S20), pointing to the absence of any dye aggregation.
The absolute fluorescence quantum yields (Φf) gave very different values between 0.57 and 0.04 (Table 1). Previous observations of analogues of tri- and tetra-substituted oligo- and tetra-substituted oligostyryl benzenes show that, in most cases, Φf ranges from moderate to good but are very dependent on the functional group that incorporates the positive charge [21,33], and this is what is observed in this case. Generally, the lowest Φf was found for methyl-pyridylium analogues T3 and F3, while the highest Φf values were obtained for trialkyl-substituted exocyclic nitrogen analogues T2 and F1.
Detailed analysis of time-correlated single-photon counting (TC-SPC) results (Table 1, τ ) revealed that τ values are controlled by the terminal cationic moiety, exocyclic cations having significantly longer emission lifetime with respect to the pyridylium analogues. Intriguingly, tetrameric analogues in general had somewhat shorter τ values in comparison to trimer analogues, suggesting the facilitation of the radiative relaxation process by more densely packed styryl moieties.
Comparison of spectroscopic properties (Table 1) of T3 and F3 with previously studied dimer pPy-MeO-pPy [28] revealed comparable values of ε (if normalized to single Py-styryl unit) but also showed many intriguing differences. Namely, dimer UV-Vis and emission maxima are strongly red-shifted in comparison to T3 and F3, and fluorescence quantum yield of the dimer is much higher, although emission lifetimes are of a similar order of magnitude. Thus, linking of three or four Py-styryl units through an aromatic center, which distributes aromatic conjugation over the complete system, actually blue-shifted their absorption and emission properties, which is less convenient for bioimaging applications.

2.3. Interactions of New Dyes with ds-DNA and ds-RNA

2.3.1. Thermal Denaturation of ds-DNA/RNA

Thermal denaturation experiments provide information about the ds-polynucleotide helix thermal stability as a function of interaction with added small molecules [32]. The difference between the Tm value of free ds-polynucleotide and a complex with a small molecule (ΔTm value) is an important factor in the characterization of small molecule/ds-polynucleotide interactions. For instance, moderate to strong stabilization (ΔTm > 5 °C) supports pronounced intercalative or minor groove binding interaction [36], whereas weak or negligible stabilization (ΔTm = 0–5 °C) suggests a binding process driven mostly by hydrophobic effect accompanied by weak H-bonding and/or electrostatic interactions–usually excluding classical intercalation as a binding mode.
The addition of studied dyes to ds-DNA or ds-RNA mostly resulted in moderate to strong stabilization of ds-helices (Table 2, Supp. Info., Figures S21–S24). Detailed analysis of results revealed general dependence of the thermal stabilization effect on the bulkiness of dye in general and, particularly, the terminal cationic substituent. Namely, insertion of a compound within the DNA/RNA groove has to be combined with efficient interaction of positive charges with the negatively charged DNA/RNA backbone, and smaller and more flexible trimers (T series) are sterically in advantage over bulky tetramers (F series). Particularly voluminous dibutyl-amine analogues have the lowest (T2) or even a negligible (F2) stabilization effect.
Since the tetrameric series showed poor differentiation between ds-DNA and ds-RNA, the trimeric series is discussed in more detail. The strongest selectivity in stabilization between ds-DNA and ds-RNA showed trimeric analogues: T1 (two-fold selective toward ds-RNA) and oppositely T5 (ten-fold selective toward ds-DNA). For these two compounds, selectivity can be related to the difference in the DNA and RNA binding sites–minor and major groove (Supp. Info., Table S1) [31,32], respectively. It seems that globular T1 with three permethylated cations interacting with DNA-phosphate anions fits better in the more restrictive DNA minor groove than in the much deeper RNA major groove, corroborating well with the results of circular dichroism experiments (vide infra Figure 5 and related discussion). Oppositely, longitudinally extended pyridylium-buthyl cations of T5 reverse selectivity in favor of the deep RNA major groove, in agreement with the results of circular dichroism experiments (vide infra Figure 4 and related discussion).
Comparison of tetramer F3 data with a previously studied dimer [28] (Table 2) revealed a comparable stabilization effect if normalized per number of positive charges. However, trimer T3 showed a significantly stronger stabilization effect, from both dimer and tetramer, which can be attributed to the optimized interplay between insertion of the hydrophobic part of the dye inside the DNA/RNA groove (likely leading by the central aromatic core) and three cationic arms staying out of the DNA/RNA groove and forming efficient electrostatic interactions with the anionic polynucleotide backbone.

2.3.2. Spectrophotometric Titrations of the New Dyes with Polynucleotides

The strong emission and favorable Stokes shift of emission maxima allowed the fluorimetric titrations of investigated dyes with ds-DNA and ds- RNA at very low (50 nM) concentrations. The addition of any ds-DNA or ds-RNA to studied dyes resulted in a strong quenching of their emission (Figure 2, Supp. Info, Figures S25–S44), whereby none of the dyes showed a particular selectivity response toward DNA or RNA. The titration data are processed by a non-linear fitting procedure to the Scatchard equation [37,38,39], yielding binding constants (Figure 2c, Supp. Info, Figures S25–S44, Table 3).
Generally, binding constants obtained from fluorimetric titrations were similar and remarkably high (log Ks ≥ 8–9), with studied dyes showing no significant selectivity between ds-DNA and ds-RNA. The exception is F3, which shows an order of magnitude preference for ds-RNA, likely due to the optimized insertion into the deep and narrow RNA major groove in comparison to the less deep and broader DNA minor groove (see Supp. Info., Table S1: Structural properties of studied ds-DNA and ds-RNA). A previously studied dimer [28] showed lower binding constants with respect to T3 and similar to F3, in agreement with thermal denaturation data (Table 2). Thus, binding affinity and thermal stabilization effects are controlled by fine interplay between the flexibility/bulkiness of dye (controlling insertion into DNA/RNA groove) and number of positive charges, which are able to interact electrostatically with the polynucleotide backbone.

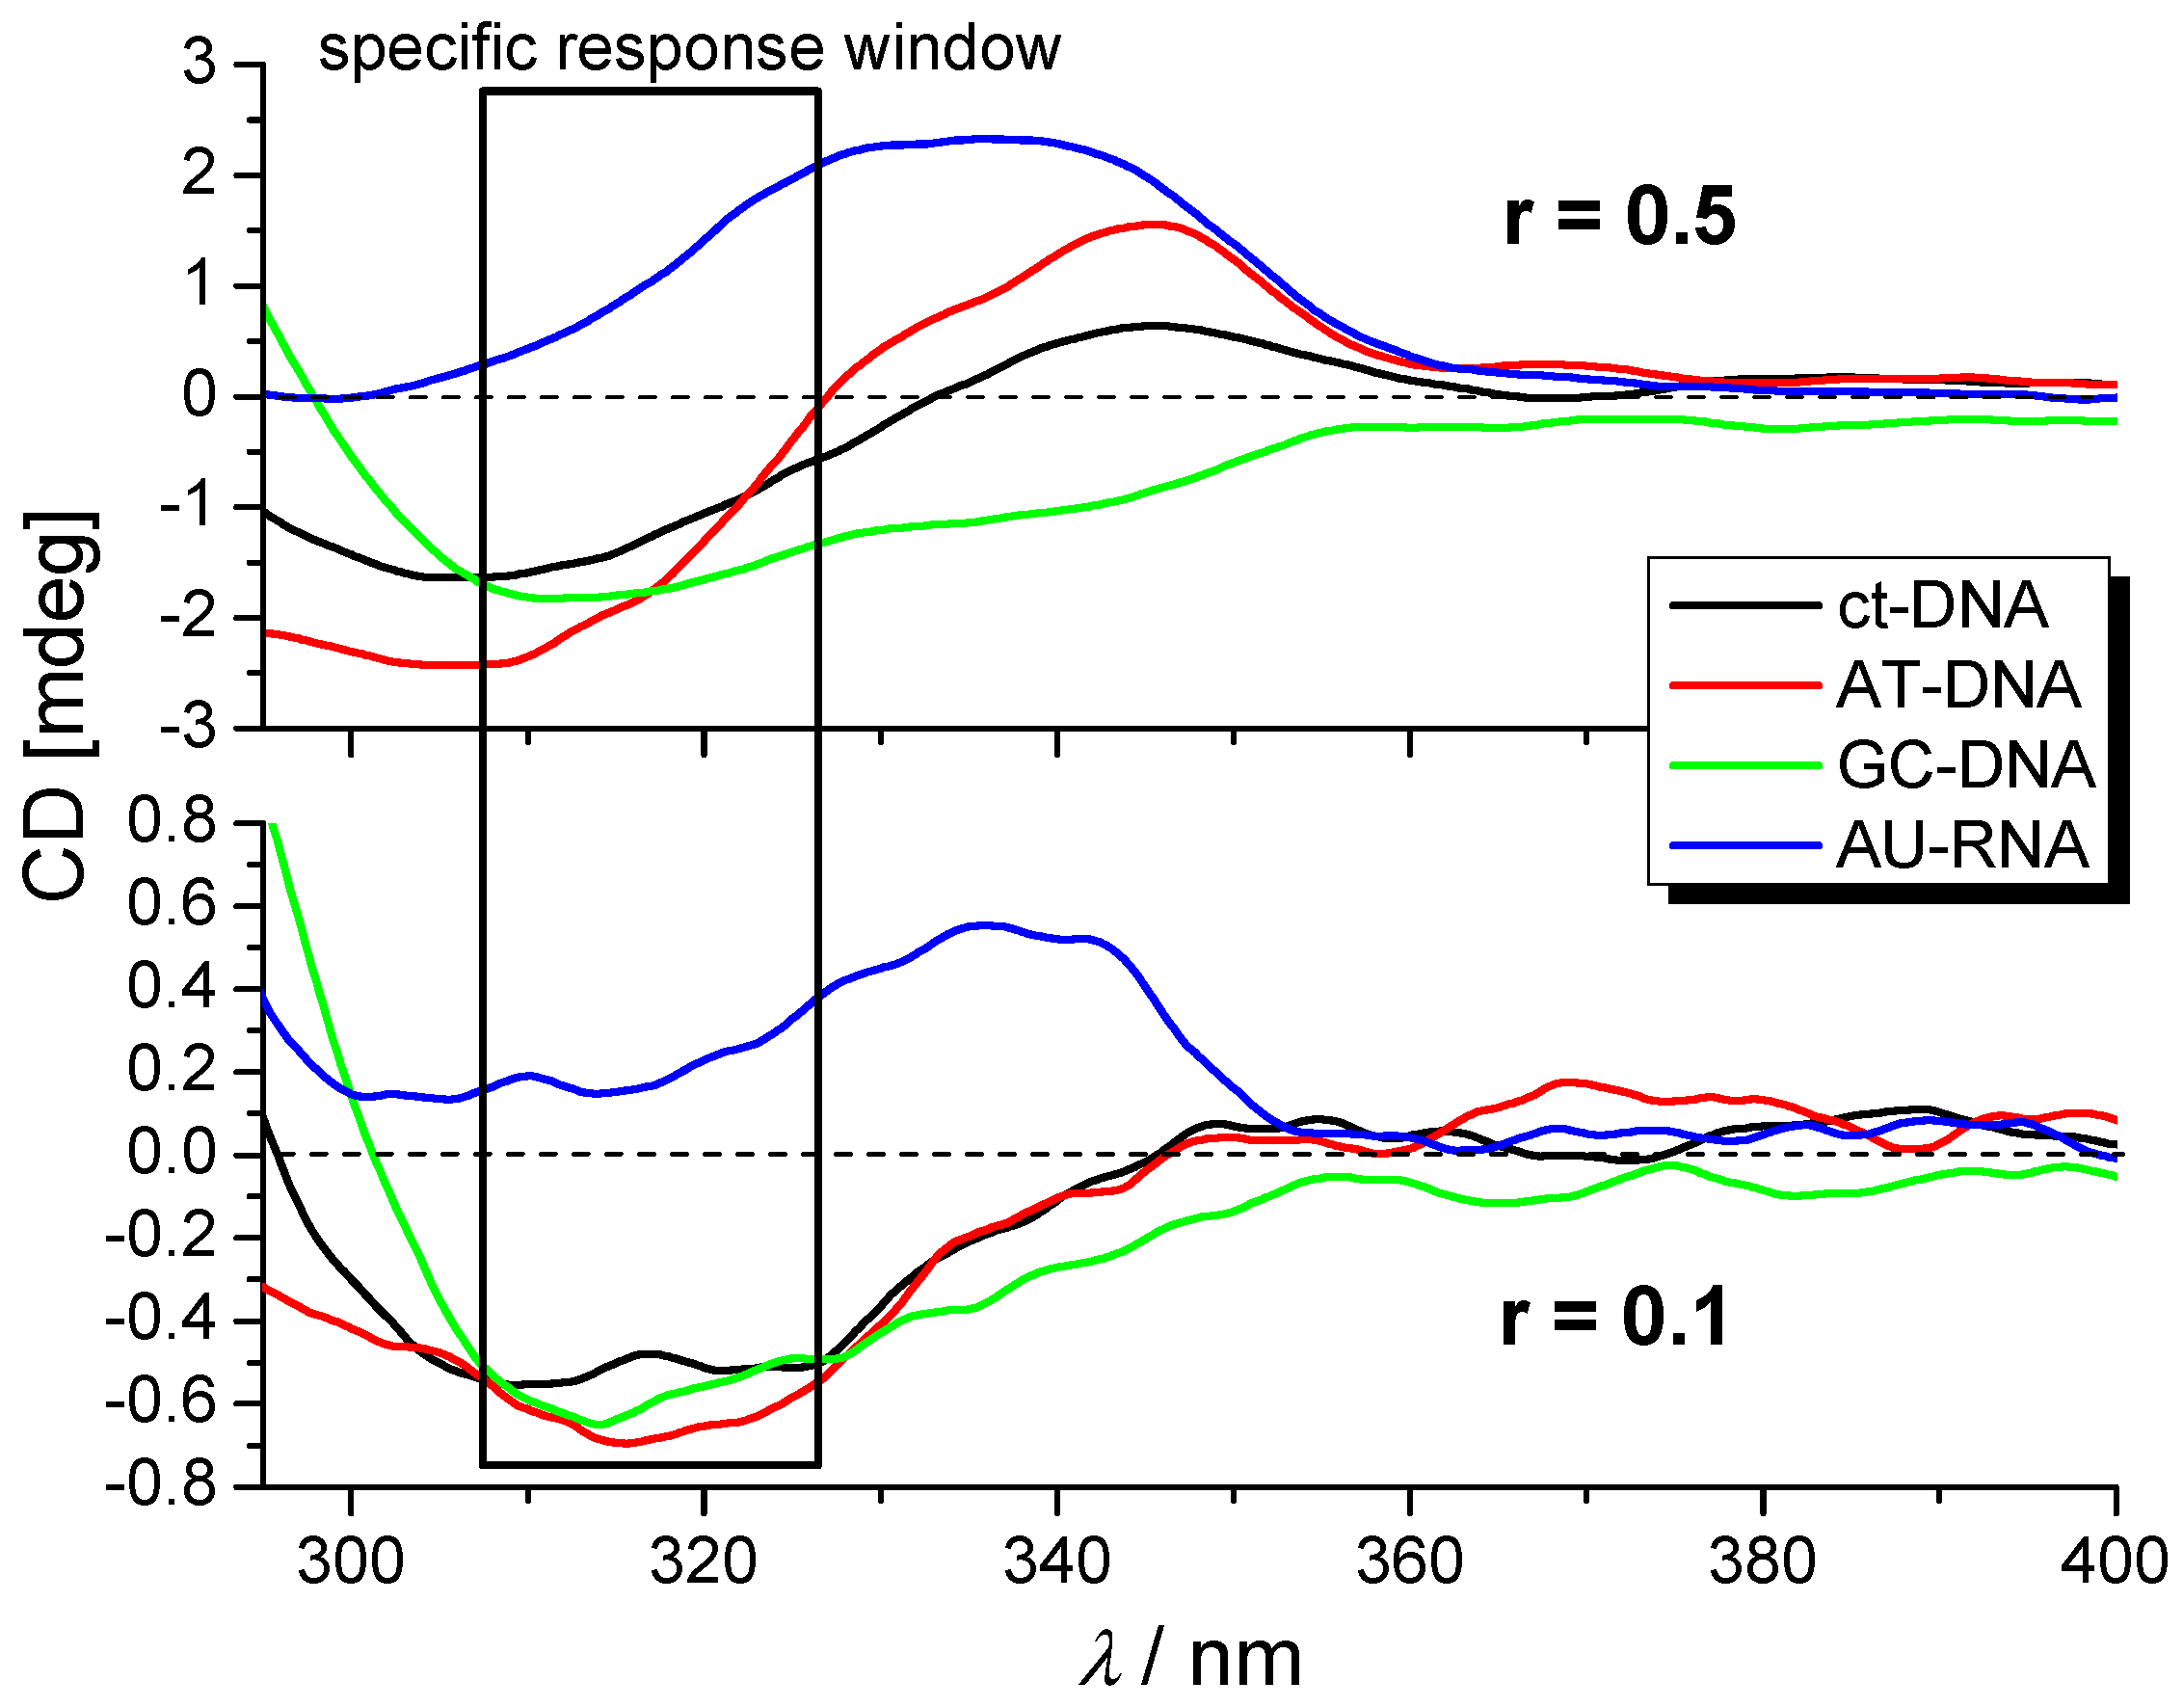
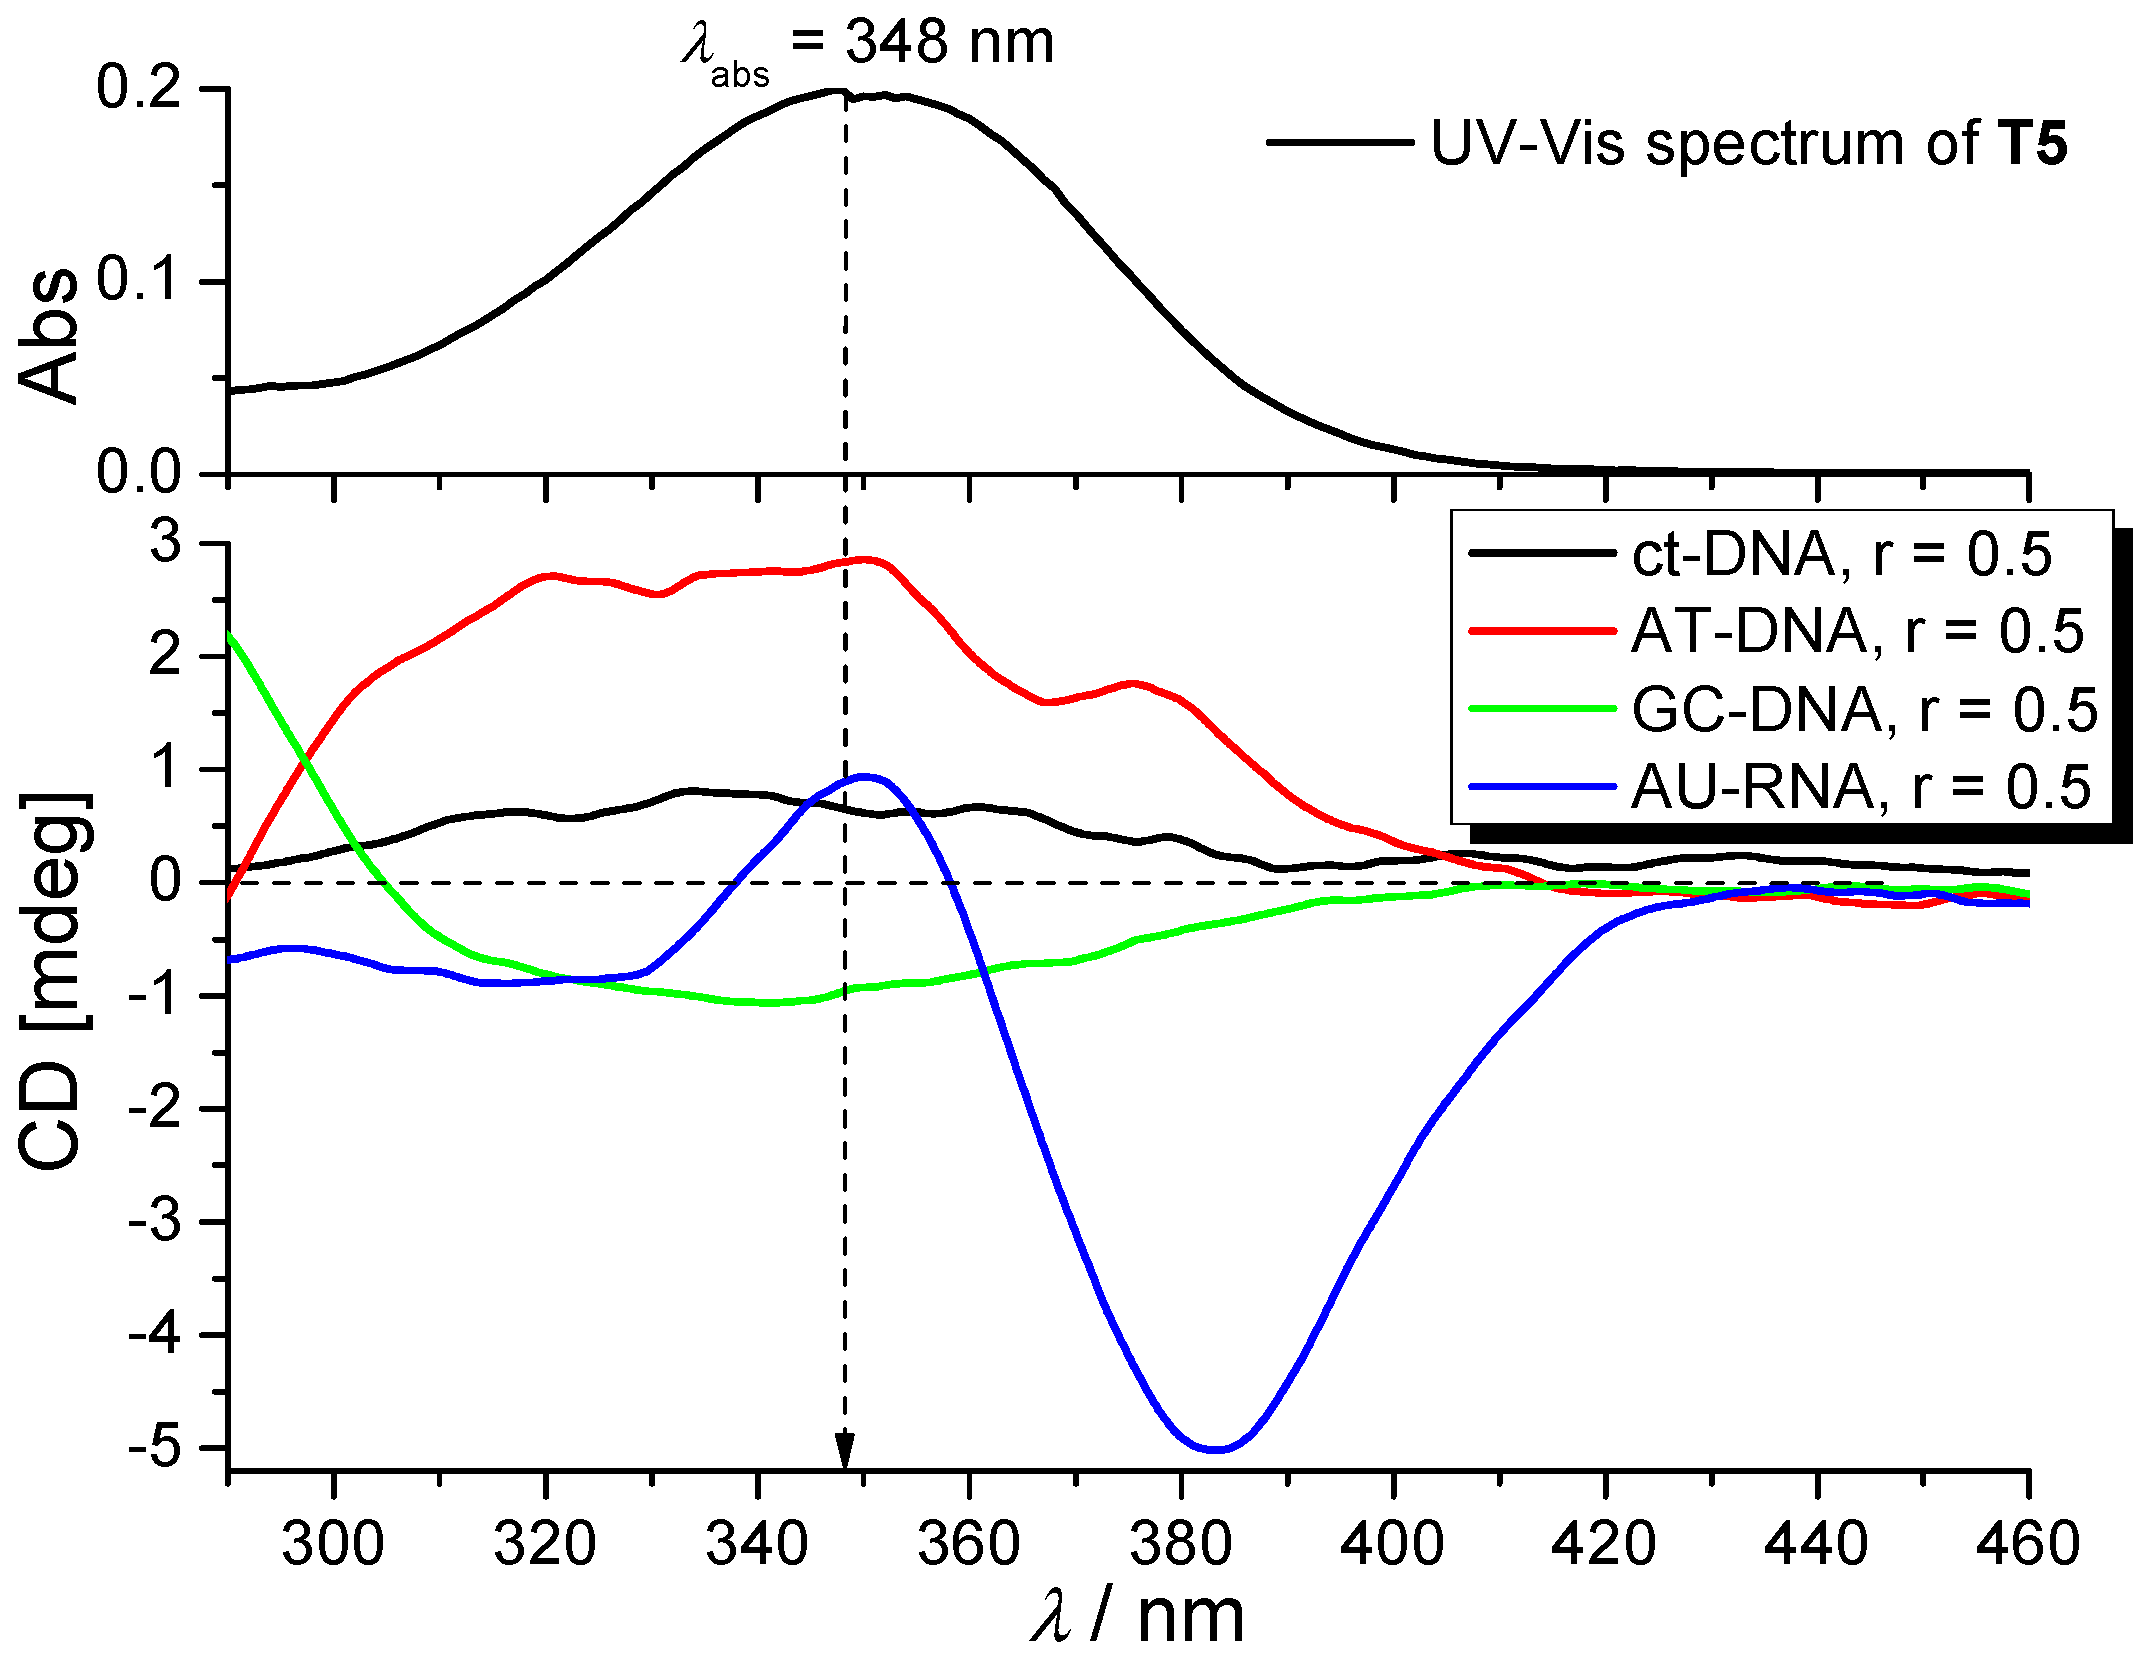
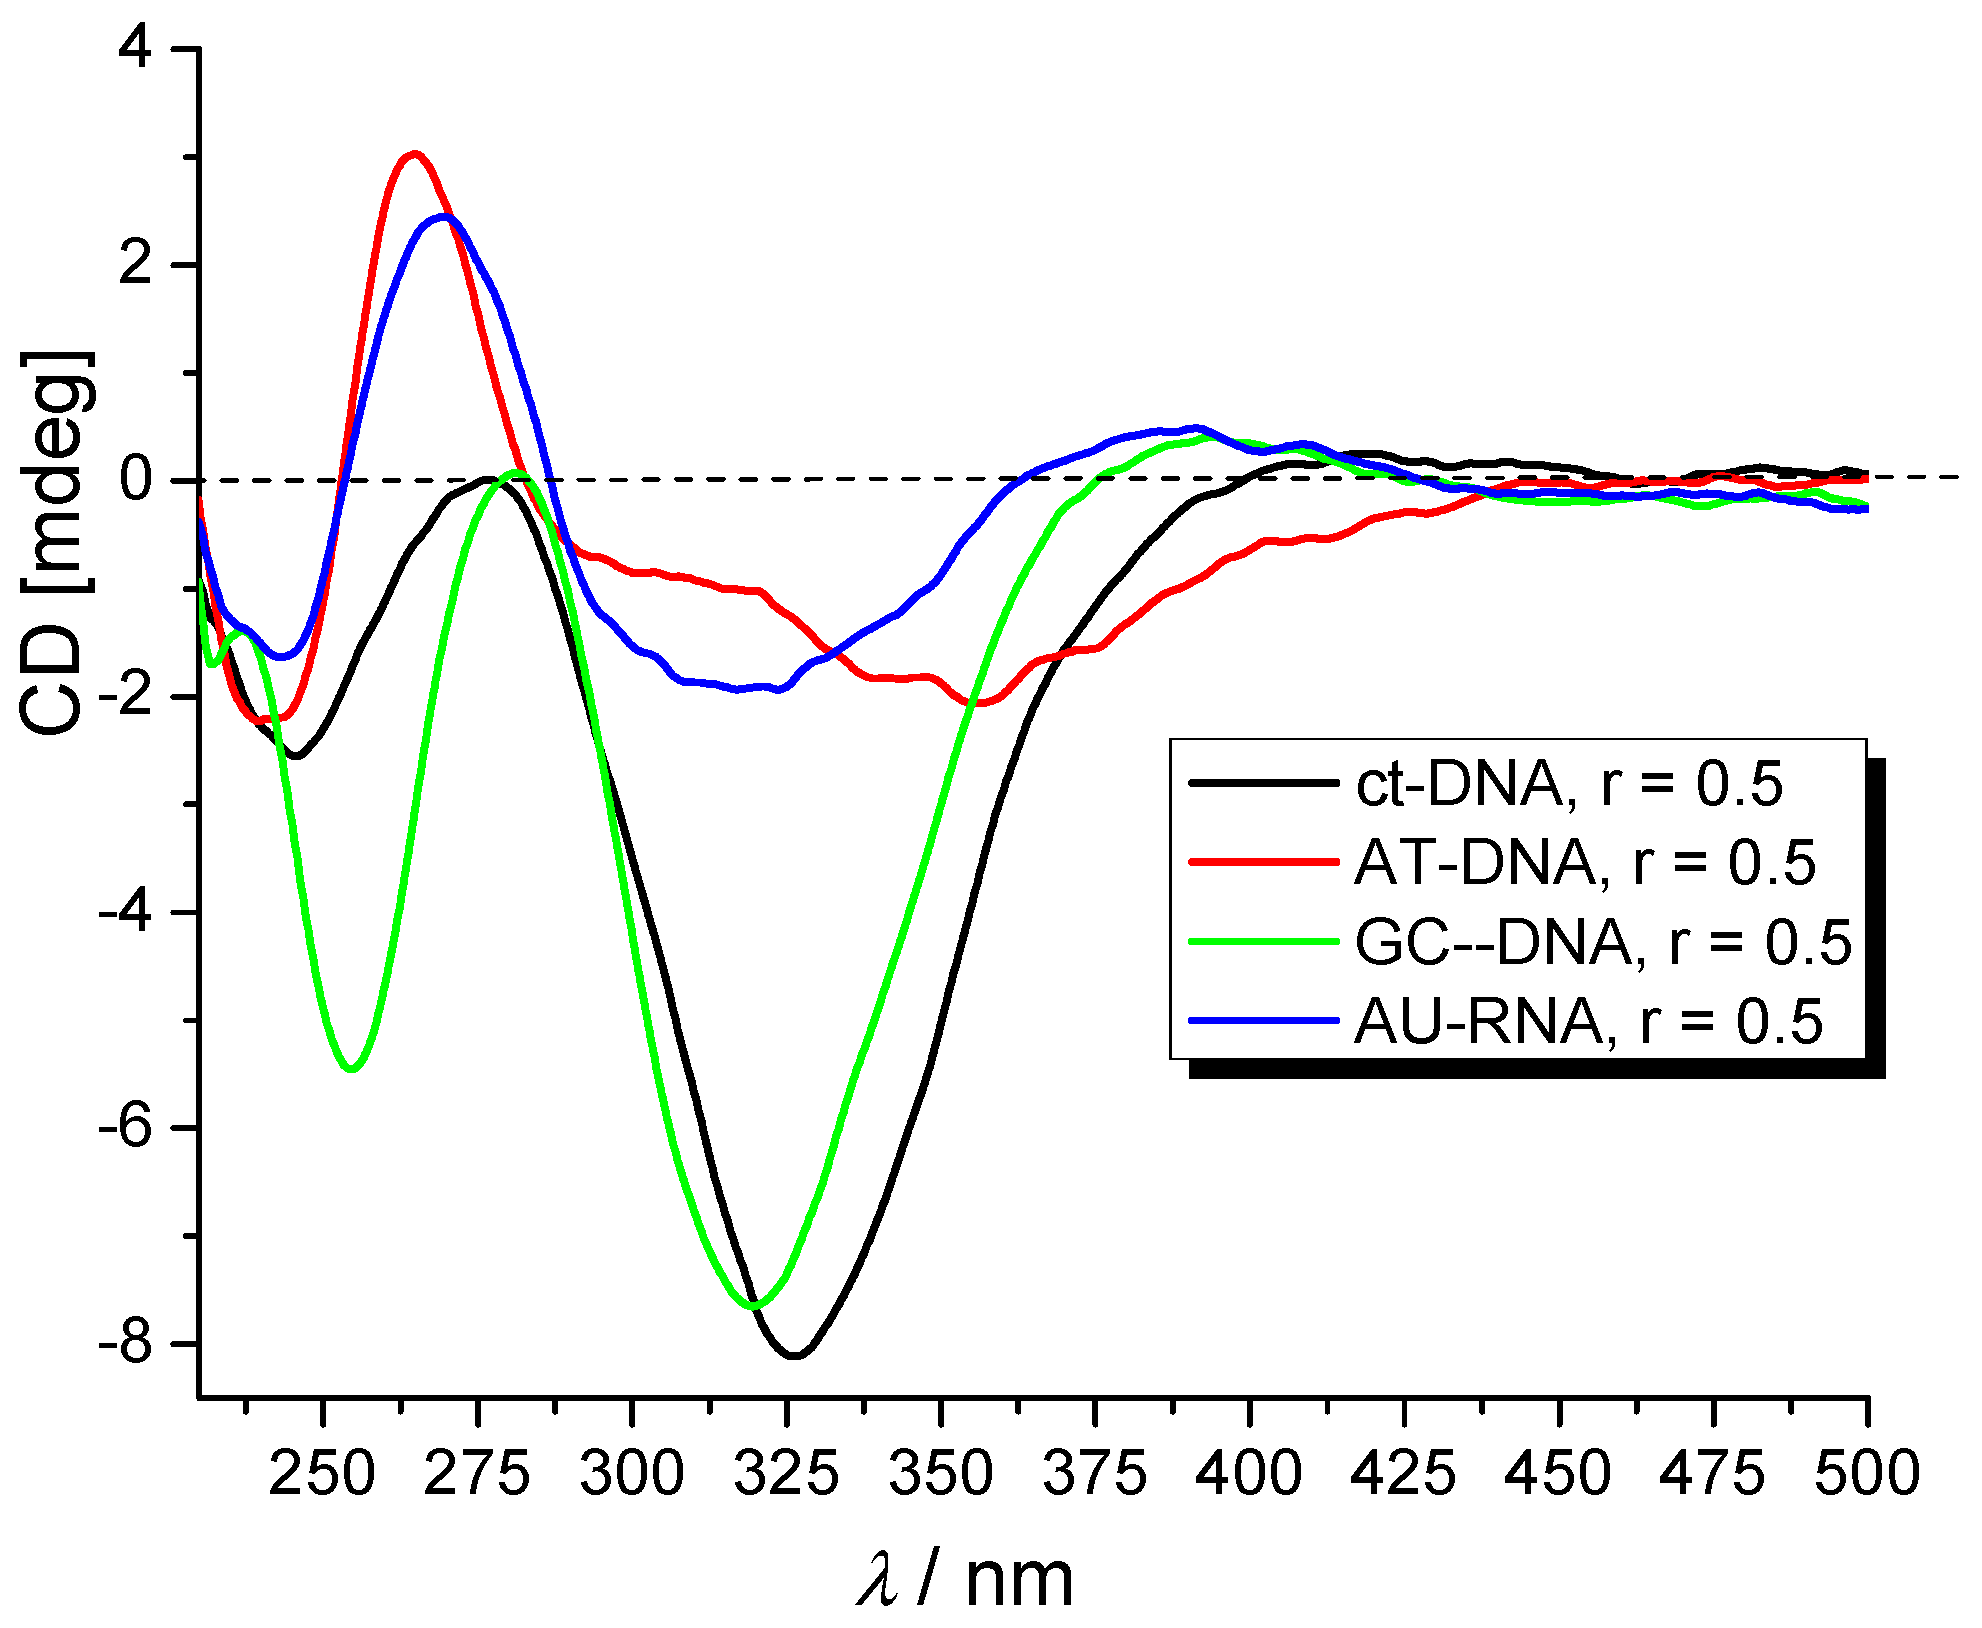
2.3.3. Circular Dichroism (CD) Experiments

To gain insight into the structural properties of dye/polynucleotide complexes, we have chosen circular dichroism (CD) spectroscopy as a highly sensitive method toward chirally related conformational changes in the secondary structure of polynucleotides [40]. In addition, achiral small molecules can eventually acquire an induced CD spectrum (ICD) upon binding to polynucleotides, which could give useful information about modes of interaction [41,42]. It should be noted that studied compounds are achiral and therefore do not possess an intrinsic CD spectrum.
The addition of any of the studied compounds resulted in strong changes in the 230–295 nm range, attributed to the bands of ds-DNA or d-RNA. Such changes in the chiral helicity of DNA/RNA are in line with strong binding constants determined by fluorimetric titrations (Table 3) and, also, are in agreement with thermal stabilization effects (Table 2).
Furthermore, many dyes upon binding to ds-DNA/RNA exhibited pronounced induced (ICD) bands (Supp. Info., Figures S45–S48) as the consequence of uniform orientation of dye chromophores with respect to the polynucleotide chiral axis. For all dyes, the shape and sign of ICD bands were strongly dependent on the ratio r = [dye]/[polynucleotide], whereby bands observed for r ≤ 0.1 are mostly weak, single-sign bands, which could be attributed to single molecules bound in one dominant binding site: ds-DNA minor groove or ds-RNA major groove [41]. However, at a larger excess of dye (r > 0.1), dye aggregates are formed along a polynucleotide, inducing, in many cases, specific pronounced bisignate excitons-coupled bands for a particular target [41].
In general, trimeric dyes showed much stronger ICD bands in comparison to their tetrameric analogues, which could be attributed to the smaller size of trimeric series and consequent deeper molecule immersion within DNA/RNA grooves, resulting in the more uniform orientation of dye chromophores with respect to the DNA/RNA chiral axis. For that reason, some trimeric dyes showed highly selective or even specific ICD bands for certain types of DNA or RNA secondary structures.
For instance, the complex of the most voluminous trimeric analogue T2 with all studied ds-DNA at all ratios gave negative ICD bands within the 308–324 nm range, at variance to the T2/AU-RNA complex yielding a positive ICD band (Figure 3). Such a specific ICD signal can be correlated to the very deep RNA major groove (Supp. Info., Table S1), which differently oriented the T2-chromophore in comparison to the much shallower ds-DNA minor grooves.
Other, smaller trimeric dyes show weak, non-selective ICD bands for a single molecule bound to DNA/RNA; however, at an excess of dye over DNA/RNA (ratio r > 0.1), several molecules aggregate within the binding site, yielding, in some cases, specific and very strong ICD bands.
For instance, T5 (a smaller analogue of T2, having a single butyl attached to a pyridylium chromophore) aggregates in a very specific manner within the very deep AU-RNA major groove (Supp. Info., Table S1), forming the exciton-coupled bisignate bands strongly bathochromically shifted (+30 nm) with respect to T5/ds-DNA complexes (Figure 4). This structural selectivity can also be correlated to the thermal stabilization selectivity toward ds-RNA, as noted in the discussion related to Table 2 (vide supra).
Further, at aggregation conditions for T1, the smaller analogue of T2 showed a much stronger negative ICD band at λ = 325 nm for GC-containing DNAs in comparison to AT-DNA or AU-RNA (Figure 5). Such a highly selective response can be correlated to the specific property of the GC-DNA minor groove, within which amino groups of guanin sterically reduce the orientation of T1 chromophores, forcing them into orientation with respect to the DNA chiral axis into the optimal position for ICD response. The AT-DNA or AU-RNA grooves are free of steric hindrances and allow variation of chromophore orientations, diminishing the intensity of ICD bands. Moreover, this structural selectivity can be correlated to the thermal stabilization selectivity of T1 toward ct-DNA over AU-RNA (vide supra discussion to Table 2), whereby insertion of T1 into the deep major groove of AU-RNA partially hampers electrostatic interactions of cations with polynucleotide phosphate anions, thus resulting in a diminished stabilization effect.

2.4. Biological Experiments
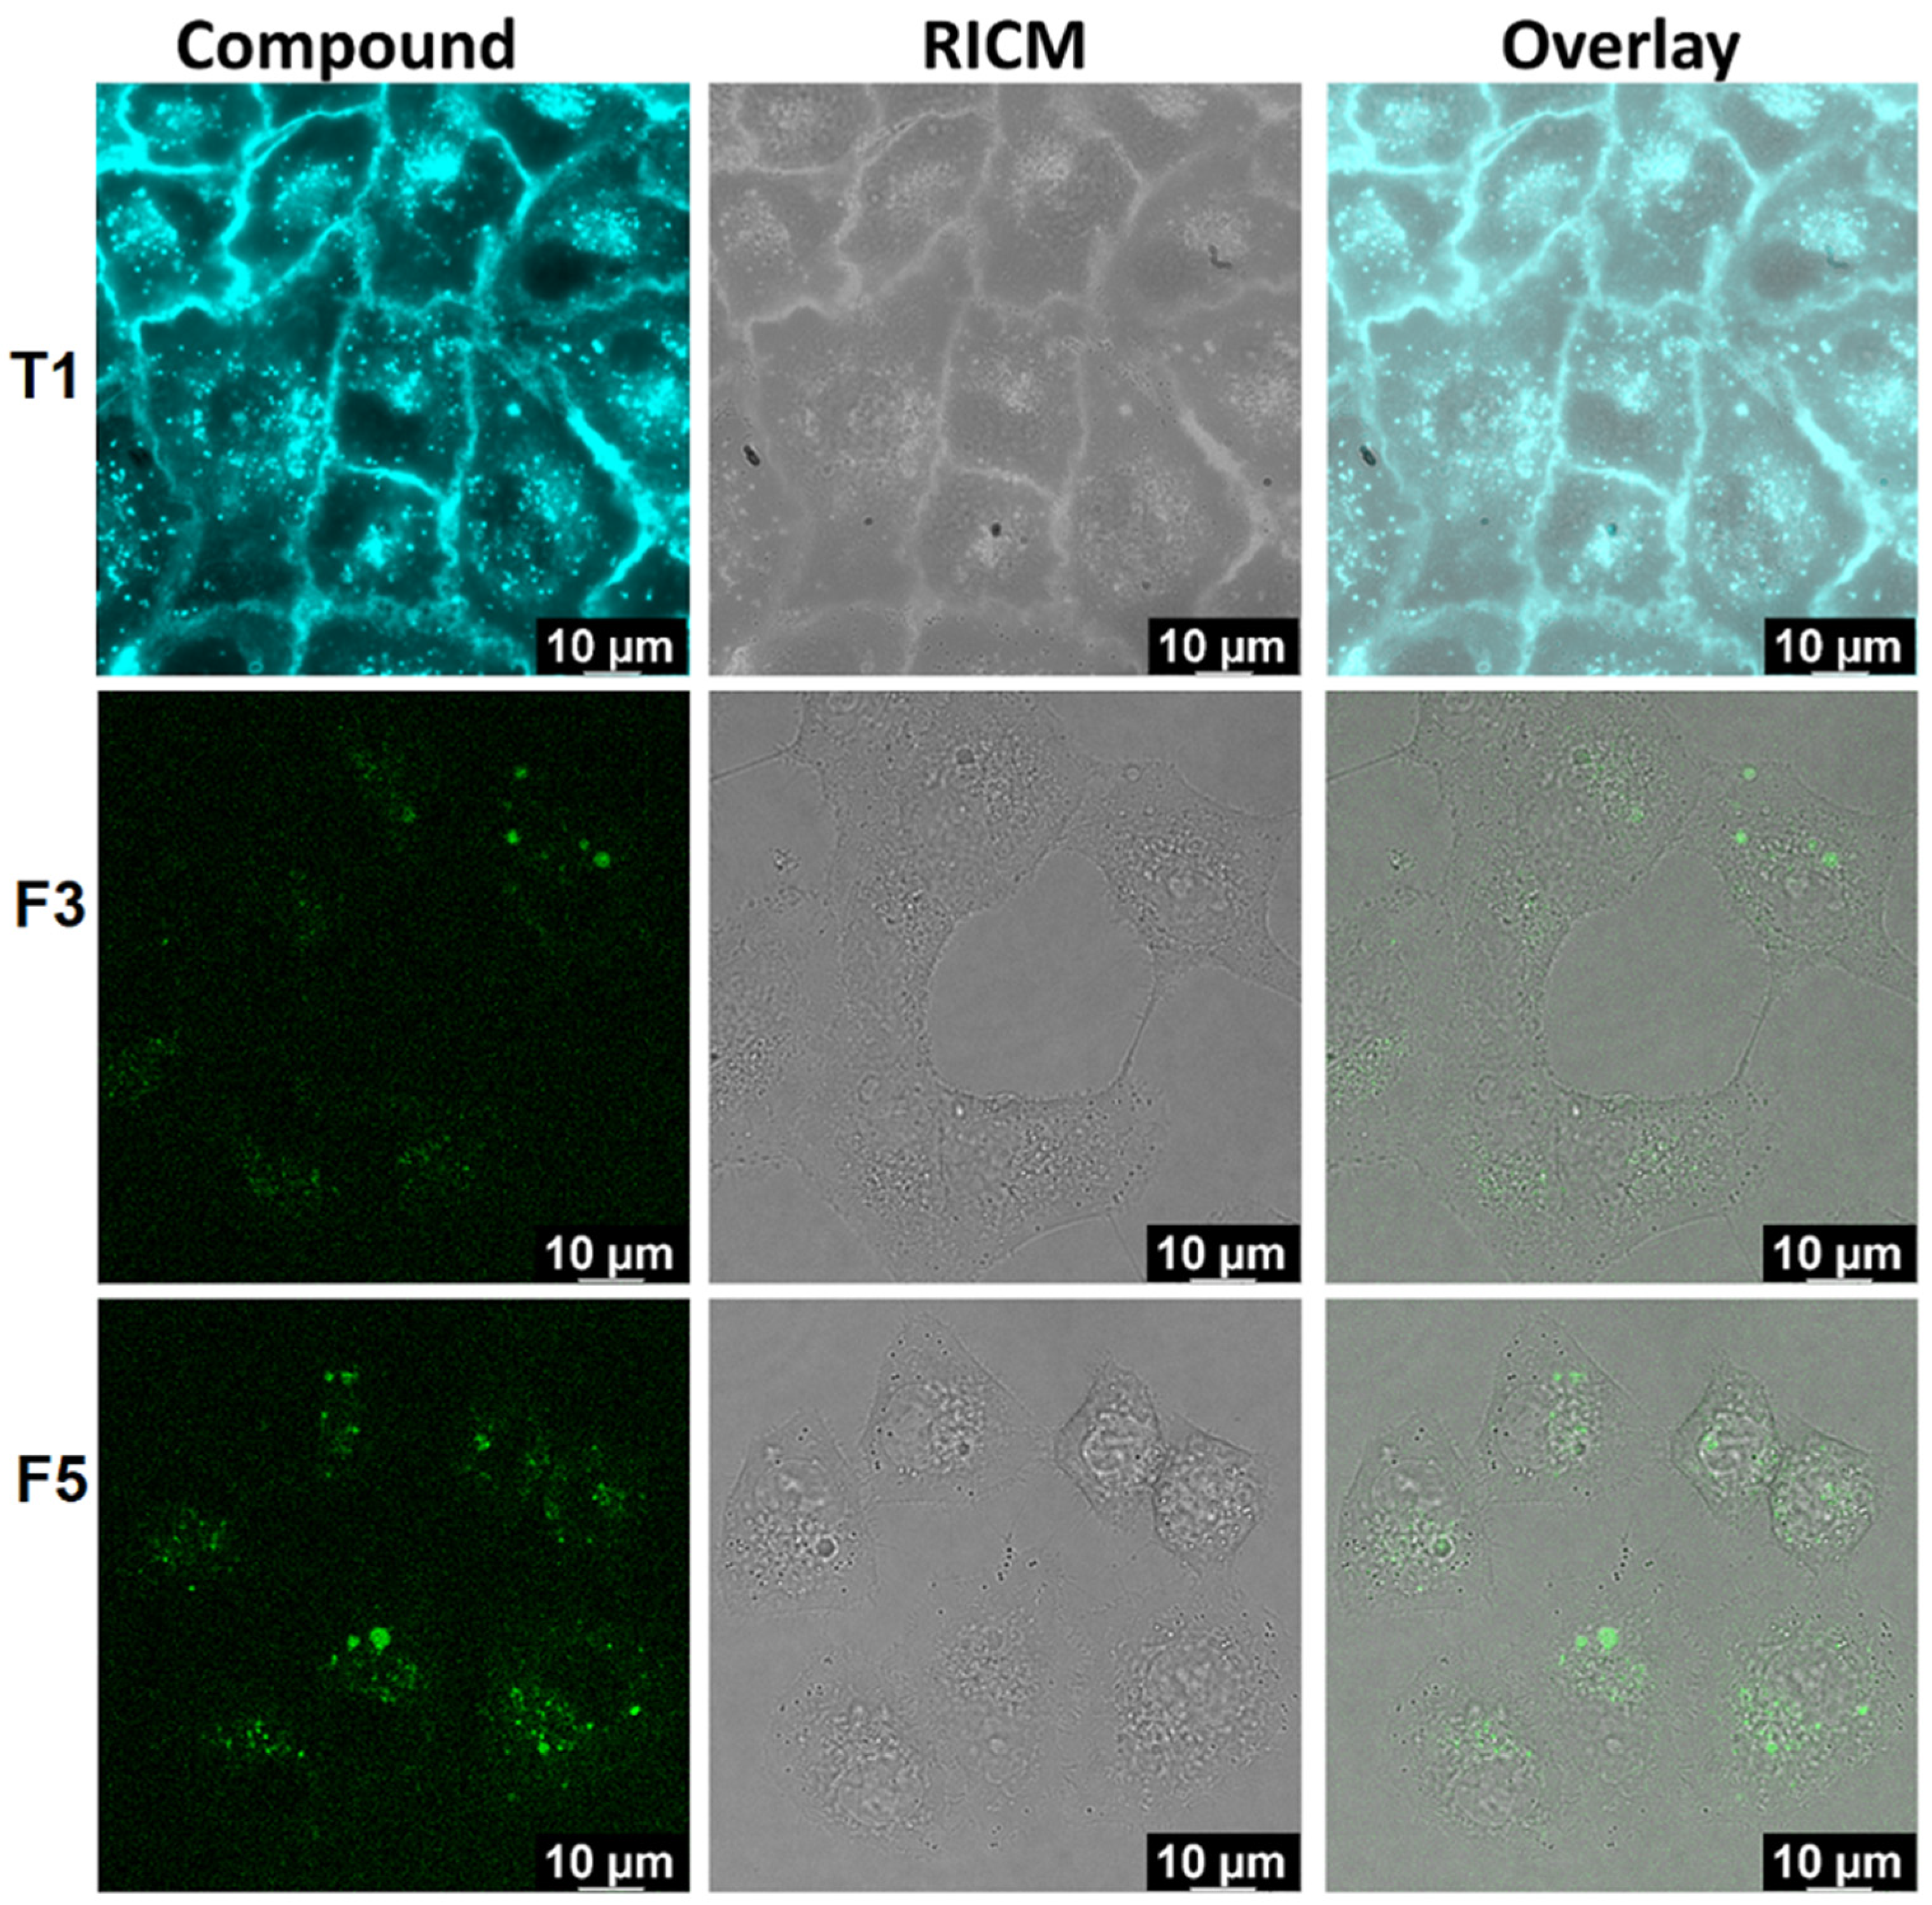
Prior experiments in this work showed that studied dyes strongly bind to ds-DNA/RNA, which can be the cause of strong cytotoxicity [43]. Thus, we studied the impact of dye addition to the human lung carcinoma cell line (A549) by MTT assay (Figure 6). Compared to the control cells (cells treated with DMSO, which was used as a diluent for the dyes), cells treated with the studied compounds exhibited a negligible decrease in cell survival even at the highest tested concentration (10 μM), except T1 and T2, showing minor activity at the highest concentration.

Confocal Microscopy

The observed negligible cytotoxicity of dyes could be a consequence of the inability of dyes to enter living cells, as known for propidium iodide or other fluorescent dyes commonly used to test the viability of cells. To verify successful cellular uptake, we treated A549 cells with 10 μM concentration of dyes for 90 min and performed live cell confocal microscopy. For this study, we have chosen trimeric derivative T1 because of its minor toxicity (likely caused by efficient cellular uptake) and tetrameric analogues F3 and F5 as representatives of non-toxic dyes with the most bathochromically shifted excitation and emission spectra particularly.
As can be seen in Figure 7 (TOP), compound T1 is localized in the cell membrane, indicating this dye has a preference for a phospholipid bilayer. Due to cell auto-fluorescence in the used spectral range and weak emission of F3 and F5, we could not perform co-localization experiments with specific markers for cytoplasmic organelles; however, it can be seen that those compounds enter the cell (Figure 7, center, bottom).
The obtained results show that the studied compounds, T1, F3, and F5, successfully enter the cells. Due to the specific localization to the cell membrane and satisfactory fluorescence properties, T1 merits further assessment as a potential marker for the lipid bilayer.
Whenever several different dyes have to be simultaneously employed in living cells, they have to differ by emitting properties sufficiently. In this respect, only a few membrane-selective blue dyes for living cells are commercially available. For instance, BioTracker™ 400 Blue Cytoplasmic Membrane Dye (Fort Lauderdale, FL, USA, Excitation: 366 nm; Emission: 441 nm) is characterized by Stokes shift of +80 nm, whereas the presented dyes show Stokes shift up to +160 nm, which allows much better differentiation from other simultaneously employed dyes.

3. Materials and Methods

3.1. General

In air- and moisture-sensitive reactions, all glassware was flame-dried and cooled under nitrogen. All reagents and solvents obtained from commercial sources (Merck Life Science S.L.U., Madrid, Spain) were used as received, except for tetrahydrofuran, which was freshly distilled over sodium/benzophenone ketyl under a positive pressure of dry nitrogen. 1H NMR and 13C NMR spectra were acquired at room temperature on a Varian Inova-500 instrument (Palo Alto, CA, USA). The NMR chemical shifts (δ) are given in ppm and are referenced to the residual protons of the deuterated solvent or carbon nuclei of CDCl3 (1H, δ = 7.27 ppm; 13C, δ = 77.0 ppm) or DMSO-d6 (1H, δ = 2.50 ppm; 13C, δ = 39.52 ppm). Acidic impurities in CDCl3 were removed by treatment with anhydrous K2CO3.

3.2. Synthesis

Triphosphonate and tetraphosphonate were obtained by the Arbuzov reaction of 1,3,5-tris(bromomethyl)benzene and 1,2,4,5-tetra(bromomethyl)benzene with triethyl phosphite following a standard methodology [44]. As an example, the synthesis of F1 is described in Scheme 2.
Compound 2. Tetraphosphonate (212 mg, 0.312 mmol) and 4-dimethylamino benzaldehyde (187 mg, 1.25 mmol) were dissolved in dried tetrahydrofuran (10 mL) in a two-necked flask (25 mL) under argon atmosphere. The solution was cooled in an ice bath, and then tBuOK (186.86 mg, 1.665 mmol) was added very slowly. Then, the reaction was allowed to reach room temperature and was stirred for 3 h. Water was added, and the yellow precipitate formed was filtered off. The isolated compound was purified by boiling it in hot methanol. Yield: 92%. 1H NMR (CDCl3, 500 MHz): δ 3.00 (s, 24H, 8 × CH3), 6.75 (A of ABq, 8H, J = 8.5 Hz, ArH), 7.03 (A of AB, 4H, J = 16.0 Hz, 4 × CH=), 7.30 (B of AB, 4H, J = 16.0 Hz, 4 × CH=), 7.48 (B of ABq, 8H, J = 8.5 Hz, ArH), 7.76 (s, 2H, ArH). 13C RMN and DEPT (CDCl3, 125 MHz): δ 150.1 (C), 135.1 (C), 130.4 (CH), 127.7 (CH), 126.4 (C), 123.8 (CH), 122.6 (CH), 112.5 (CH), 40.5 (CH3). MALDI-TOF MS (dithranol): m/z 658.8 [M]+•.
Compound F1. Compound 2 (100 mg, 0.204 mmol) was dissolved in dichloromethane and an excess of iodomethane (284 mg, 2 mmol) was added. The reaction mixture was stirred for 3 days. Compound F1 precipitated in the reaction medium. It was filtered and washed with cold dichloromethane (yellow powder, 90%). 1H NMR (DMSO-d6, 500 MHz): δ 3.66 (s, 36H, 12 × CH3), 7.52 (d, 4H, J = 16.5 Hz, 4 × CH=), 7.94 (d, 4H, J = 16.5 Hz, 4 × CH=), 8.01 (d, 8H, J = 7.0 Hz, ArH), 8.04 (d, 8H, J = 7.0 Hz, ArH). 8.18 (s, 4H, ArH). 13C RMN y DEPT (DMSO-d6, 125 MHz): δ 146.2 (C), 138.9 (C), 135.2 (C), 129.4 (CH), 128.1 (CH), 127.7 (CH), 124.0 (CH), 120.8 (CH), 56.4 (CH3). MALDI-TOF MS (dithranol): m/z 673.8 [M–4I–3CH3]+•.

3.3. Spectrophotometric Characterization

Absorption spectra were recorded on a Varian Cary 100 Bio spectrophotometer (Palo Alto, CA, USA). Fluorescence measurements were performed on a Varian Cary Eclipse fluorimeter (Palo Alto, CA, USA), taking care that the absorbance of a sample at the excitation wavelength was >0.05 to avoid any impact of the inner filter effect. Fluorescence decays were measured by time-correlated single-photon counting (TC-SPC) on an Edinburgh FS5 spectrometer (Edinburgh Instruments Ltd., Livingston, UK) in a previously degassed aqueous solution of dye. Absolute quantum yields of fluorescence (Φf) were measured by the Integrating sphere SC-30 (Edinburgh FS5 Inst.). CD spectra were recorded on a JASCO J815 spectropolarimeter (JASCO, Easton, MD, USA). All spectrophotometric measurements were performed using an appropriate quartz cuvette of 10 mm path length in aqueous buffer solution (sodium cacodylate buffer, pH = 7, I = 0.05 M) at room temperature (25 °C).

3.4. Study of DNA/RNA Interactions

Polynucleotides were purchased as noted: poly dAdT–poly dAdT, poly dGdC–poly dGdC, poly A–poly U (Sigma Aldrich, St. Louis, MO, USA), calf thymus (ct) DNA (Sigma Aldrich, USA) and dissolved in sodium cacodylate buffer, I = 0.05 M, pH = 7.0. The ct-DNA was additionally sonicated and filtered through a 0.45 mm filter to obtain mostly short (ca. 100 base pairs) rod-like B-helical DNA fragments. Polynucleotide concentration was determined spectroscopically according to producer data as the concentration of phosphates (corresponds to c(nucleobase)).
Fluorescence titration experiments were performed by adding portions of the polynucleotide stock solution into the solution of the studied dye. CD experiments were performed by adding portions of the compound stock solution into the solution of the polynucleotide (c = 2 × 10⁻⁵ M) and were recorded with a scanning speed of 200 nm/min (an average of three accumulations). In CD experiments, a buffer background was subtracted from each spectrum. Every reported spectrophotometric titration was the average of at least two measurements.
Thermal denaturation curves for ds-DNA, ds-RNA, and their complexes with studied compounds were determined as previously described [45] by following the absorption change at 260 nm as a function of temperature. The absorbance of the ligands was subtracted from every curve, and the absorbance scale was normalized. Tm values are the midpoints of the transition curves determined from the maximum of the first derivative and checked graphically by the tangent method. The ΔTm values were calculated by subtracting the Tm of the free nucleic acid from the Tm of the complex. Every ΔTm value here reported was the average of at least two measurements. The error in ΔTm is ±0.5 °C.

3.5. Biology

Cells. A549 (human lung carcinoma; ATCC CCL-185) were obtained from the ATCC Cell Biology Collection and were cultured according to the manufacturer’s instructions. Cells were grown in Dulbecco Modified Eagle’s Medium (DMEM, Sigma Aldrich, USA) supplemented with 10% of fetal bovine serum (FBS, Sigma Aldrich, USA) at 37 °C and 5% CO2 in a humidified atmosphere. Three biological replicas were performed for all experiments.
Cytotoxicity assay–±MTT [46]. Studied compounds were dissolved in an appropriate volume of dimethyl sulfoxide (DMSO) under sterile conditions to obtain 10 mM stock solutions and were kept in the dark at +4 °C. Before each assay, fresh working solutions were prepared from the stock solution by diluting them with DMEM. Cells were seeded on 96-well plates at concentrations of 7 × 10³ cells/well in 100 μL of DMEM (10% FBS) and left in the incubator overnight (37 °C, 5% CO2). The next day, 100 μL of the working solution was added to the wells, thus the final volume was 200 μL/well. All measurements were made in quadruplicate. Cells treated with the same dilutions of DMSO represented the control, while cells treated only with DMEM (10% FBS) represented the negative control. The plate was then incubated for the next 72 h (37 °C, 5% CO2). After incubation, the medium was removed, and 40 μL of an MTT solution was added to each well. The plate was incubated in the cell incubator for 3 h, allowing formazan crystals to form. After 3 h, 170 μL of DMSO was added to each well, and the plate was placed on a shaker for 20 min, allowing the crystals to dissolve. The absorbance of the MTT–formazan product was measured with a microplate reader at 600 nm, and the absorbance value correlates directly with cell survival.
Live cell imaging: Live imaging of the cells treated with compounds was performed on the A549 cell line (human lung carcinoma; ATCC CCL-185). Cells were seeded in Ibidi imaging cell chambers (Ibidi®, Gräfelfing, Germany) in 500 μL of the medium, with the concentration of 5 × 10⁴ cells/well, and left in the cell incubator for 48 h (37 °C, 5% CO2). After two days, cells were treated with 10 μM solution of a tested compound and left in the cell incubator for 90 min to allow the compound to enter the cells. After incubation, the medium was replaced with 500 μL of fresh DMEM, and cells were immediately observed by a Leica SP8 X confocal microscope (Leica Microsystems, Wetzlar/Mannheim, Germany).

4. Conclusions

Here, we described the synthesis of a novel series of tri- and tetrameric styryl dyes and fully characterized their spectroscopic and photochemical properties in biorelevant aqueous solution. The multiplicity of the styryl motif had a pronounced effect on the UV-Vis spectra, those of tetra-substituted analogues generally being slightly red-shifted in comparison to tri-substituted counterparts. Also, the type of positively charged moiety influenced strongly absorbance properties; the UV-Vis spectra of pyridylium analogues (T3, F3, T5, and F5) being strongly red-shifted (Δλ > +30 nm) in comparison with trialkyl-N-quaternary-substituted compounds (T1, T2, F1, and F2). All compounds showed strong fluorescence, exhibiting remarkable Stokes shifts ranging from 97 nm to 165 nm, and the emission maxima agreed with the trend observed for UV-Vis maxima. Intriguingly, absolute fluorescence quantum yields (Φf) were strongly dependent on a chromophore bearing positive charge, the pyridylium analogues showing the lowest and the exocyclic nitrogen analogues the highest Φf values.
The thermal denaturation of ds-DNA or ds-RNA was more influenced (stabilized) by smaller trimeric compounds, likely due to their flexibility in adopting optimal positioning of cationic parts against the polyanionic DNA/RNA backbone. However, this molecule size-related selectivity was not evident from fluorimetric titrations, since the emission of all compounds was quenched similarly and the binding affinity was large (within the 1–10 nM−1 range) and similar. Thus, binding affinity and thermal stabilization effects are controlled by fine interplay between flexibility/bulkiness of dye (controlling insertion into the DNA/RNA groove, see Supp. Info. Table S1) and number of positive charges, which are able to interact electrostatically with the polynucleotide backbone.
Most intriguingly, induced circular dichroism (ICD) bands of trimeric (T-series) derivatives at a high ratio r = [dye]/[polynucleotide] were highly selective or even specific for a particular DNA or RNA secondary structure, depending on a dye size: the most voluminous trimeric analogue T2 can efficiently differentiate between ds-DNA (minor groove, Supp. Info., see Table S1) and ds-RNA (major groove) by a negative/positive ICD band sign, a whereas its smaller analogue T1 gave a strongly selective ICD band for GC-DNA with respect to AT-DNA or AU-RNA and the more planar pyridinium analogue T5 yielded a specific ICD band for ds-RNA (major groove, Supp. Info., see Table S1). The tetrameric series gave much weaker ICD bands because their large size prevented deep immersion within DNA/RNA grooves and adequate orientation of chromophores with respect to the DNA/RNA chiral axis.
Further, studied dyes were negligibly toxic against human cells but efficiently entered cells within 1–2 h even at low (10 µM) concentrations. The confocal microscopy results show accumulation in cytoplasm organelles.
The presented results adequately addressed the questions instigating this research and strongly support further optimization of trimeric series of compounds in line with shifting the new dyes’ light absorption bathochromically into tissue-penetrating wavelengths (>500 nm). The comparison of spectroscopic properties of the presented dyes with their dimeric analogue [28] revealed that linking of three or four Py-styryl units through an aromatic center distributes aromatic conjugation over the complete system, causing blue-shifted absorption and emission properties. Therefore, oligomeric Py-styryl dyes should be preferably prepared by linking corresponding dimers by non-conjugated linkers, thus maintaining strongly red-shifted spectroscopic properties of the dimer, more convenient for bioimaging applications. Also, the application of the shown fine-tuned induced chiral recognition (ICD bands) of the DNA/RNA structure could be improved using fluorescence detected circular dichroism (FDCD) [47] and circularly polarized luminescence (CPL) [48] for an increase in the recognition sensitivity.

Supplementary Materials

The following supporting information can be downloaded at: https://www.mdpi.com/article/10.3390/ijms25115724/s1.

Author Contributions

Synthesis and characterization of new compounds: F.d.L.G. and J.T.; study of interactions with biomacromolecules: D.P.S. and I.K.K.; biological testing: D.M.; conceptualization, supervision, funding acquisition, writing of the manuscript: I.P. and J.C.G.M. All authors have read and agreed to the published version of the manuscript.

Funding

This research was funded by the Croatian Science Foundation project HrZZ IP-2022-10-9829, Junta de Comunidades de Castilla-La Mancha/FEDER (project SBPLY/21/180501/000042), and Universidad de Castilla-La Mancha (2022-GRIN-34214).

Institutional Review Board Statement

Not applicable.

Informed Consent Statement

Not applicable.

Data Availability Statement

All data are contained within this manuscript and the Supplementary Materials file.

Conflicts of Interest

The authors declare no conflicts of interest.

References

  1. Lakowicz, J.R. Principles of Fluorescence Spectroscopy; Springer: Boston, MA, USA, 2006. [Google Scholar]
  2. Yang, X.; Wang, Y.; Liu, R.; Zhang, Y.; Tang, J.; Yang, E.; Zhang, D.; Zhao, Y.; Ye, Y. A novel ICT-based two photon and NIR fluorescent probe for labile Fe2+ detection and cell imaging in living cells. Sens. Actuator B-Chem. 2019, 288, 217–224. [Google Scholar] [CrossRef]
  3. Wang, L.; Frei, M.S.; Salim, A.; Johnsson, K. Small-Molecule Fluorescent Probes for Live-Cell Super-Resolution Microscopy. J. Am. Chem. Soc. 2019, 141, 2770–2781. [Google Scholar] [CrossRef] [PubMed]
  4. Ke, C.-S.; Fang, C.-C.; Yan, J.-Y.; Tseng, P.-J.; Pyle, J.R.; Chen, C.-P.; Lin, S.-Y.; Zhang, X.; Chan, Y.-H. Molecular Engineering and Design of Semiconducting Polymer Dots with Narrow-Band, Near-Infrared Emission for in Vivo Biological Imaging. ACS Nano 2017, 11, 3166–3177. [Google Scholar] [CrossRef] [PubMed]
  5. Sun, W.; Guo, S.; Hu, C.; Fan, J.; Peng, X. Recent Development of Chemosensors Based on Cyanine Platforms. Chem. Rev. 2016, 116, 7768–7817. [Google Scholar] [CrossRef] [PubMed]
  6. Nagaya, T.; Nakamura, Y.A.; Choyke, P.L.; Kobayashi, H. Fluorescence-Guided Surgery. Front. Oncol. 2017, 7, 314. [Google Scholar] [CrossRef]
  7. Ren, H.; Huo, F.; Wu, X.; Liu, X.; Yin, C. An ESIPT-induced NIR fluorescent probe to visualize mitochondrial sulfur dioxide during oxidative stress in vivo. Chem. Commun. 2021, 57, 655–658. [Google Scholar] [CrossRef] [PubMed]
  8. Sedgwick, A.C.; Wu, L.; Han, H.-H.; Bull, S.D.; He, X.-P.; James, T.D.; Sessler, J.L.; Tang, B.Z.; Tian, H.; Yoon, J. Excited-state intramolecular proton-transfer (ESIPT) based fluorescence sensors and imaging agents. Chem. Soc. Rev. 2018, 47, 8842–8880. [Google Scholar] [CrossRef]
  9. Dahal, D.; Ojha, K.R.; Pokhrel, S.; Paruchuri, S.; Konopka, M.; Liu, Q.; Pang, Y. NIR-emitting styryl dyes with large Stokes’ shifts for imaging application: From cellular plasma membrane, mitochondria to zebrafish neuromast. Dye. Pigment. 2021, 194, 109629. [Google Scholar] [CrossRef] [PubMed]
  10. Luo, X.; Wang, R.; Lv, C.; Chen, G.; You, J.; Yu, F. Detection of Selenocysteine with a Ratiometric near-Infrared Fluorescent Probe in Cells and in Mice Thyroid Diseases Model. Anal. Chem. 2020, 92, 1589–1597. [Google Scholar] [CrossRef]
  11. Song, X.; Bai, S.; He, N.; Wang, R.; Xing, Y.; Lv, C.; Yu, F. Real-Time Evaluation of Hydrogen Peroxide Injuries in Pulmonary Fibrosis Mice Models with a Mitochondria-Targeted Near-Infrared Fluorescent Probe. ACS Sens. 2021, 6, 1228–1239. [Google Scholar] [CrossRef]
  12. Abeywickrama, C.S.; Baumann, H.J.; Alexander, N.; Shriver, L.P.; Konopka, M.; Pang, Y. NIR-emitting benzothiazolium cyanines with an enhanced stokes shift for mitochondria imaging in live cells. Org. Biomol. Chem. 2018, 16, 3382–3388. [Google Scholar] [CrossRef]
  13. Xu, Z.; Xu, L. Fluorescent probes for the selective detection of chemical species inside mitochondria. Chem. Commun. 2016, 52, 1094–1119. [Google Scholar] [CrossRef]
  14. Dahal, D.; McDonald, L.; Pokhrel, S.; Paruchuri, S.; Konopka, M.; Pang, Y. A NIR-emitting cyanine with large Stokes shifts for live cell imaging: Large impact of the phenol group on emission. Chem. Commun. 2019, 55, 13223–13226. [Google Scholar] [CrossRef]
  15. Musiol, R.; Serda, M.; Hensel-Bielowka, S.; Polanski, J. Quinoline-Based Antifungals. Curr. Med. Chem. 2010, 17, 1960–1973. [Google Scholar] [CrossRef] [PubMed]
  16. Quinteros, M.A.; Galera, I.L.D.; Tolosa, J.; García-Martínez, J.C.; Páez, P.L.; Paraje, M.G. Novel antifungal activity of oligostyrylbenzenes compounds on Candida tropicalis biofilms. Med. Mycol. 2021, 59, 244–252. [Google Scholar] [CrossRef]
  17. Tolosa, J.; De las Heras, G.S.; Carrión, B.; Segura, T.; Páez, P.L.; De Lera-Garrido, F.J.; Rodríguez-López, J.; García-Martínez, J.C. Structure-activity relationships for poly(phenylene)vinylene derivatives as antibacterial agents. ChemistrySelect 2018, 3, 7327–7332. [Google Scholar] [CrossRef]
  18. Solomon, V.R.; Lee, H. Quinoline as a privileged scaffold in cancer drug discovery. Curr. Med. Chem. 2011, 18, 1488–1508. [Google Scholar] [CrossRef] [PubMed]
  19. Musiol, R. Quinoline-based HIV integrase inhibitors. Curr. Pharm. Des. 2013, 19, 1835–1849. [Google Scholar] [CrossRef]
  20. Sánchez-Ruiz, A.; Sousa-Hervés, A.; Pérez-Flores, J.C.; Marín-Rueda, J.R.; Tolosa, J.; Garzón-Ruiz, A.; Rodríguez-López, J.; Canales-Vázquez, J.; García-Martínez, J.C. Inkjet printing of poly(phenylenevinylene)-based fluorophores using an environmentally friendly approach. Prog. Org. Coat. 2022, 166, 106787. [Google Scholar] [CrossRef]
  21. De Lera-Garrido, F.; Domínguez, R.; Fernández-Liencres, M.P.; Martín, C.; Tolosa, J.; García-Frutos, E.M.; Perles, J.; Hofkens, J.; García-Martínez, J.C.; Garzón-Ruiz, A.; et al. Effect of bulky side groups on photophysical properties and electroluminescent performance of oligo(styryl)benzenes. Dye. Pigment. 2023, 213, 111179. [Google Scholar] [CrossRef]
  22. Ortiz-Gómez, I.; González-Alfaro, S.; Sánchez-Ruiz, A.; De Orbe-Payá, I.; Capitán-Vallvey, L.F.; Navarro, A.; Salinas-Castillo, A.; García-Martínez, J.C. Reversal of a fluorescent fluoride chemosensor from turn-off to turn-on based on aggregation induced emission properties. ACS Sens. 2022, 7, 37–43. [Google Scholar] [CrossRef] [PubMed]
  23. Cinar, R.; Nordmann, J.; Dirksen, E.; Müller, T.J.J. Domino synthesis of protochromic “ON–OFF–ON” luminescent 2-styryl quinolines. Org. Biomol. Chem. 2013, 11, 2597–2604. [Google Scholar] [CrossRef] [PubMed]
  24. Nosova, E.V.; Trashakhova, T.V.; Ustyugov, V.S.; Mochul’skaya, N.N.; Valova, M.S.; Lipunova, G.N.; Charushin, V.N. Fluorine-containing quinoline and quinoxaline styryl derivatives: Synthesis and photophysical properties. Russ. Chem. Bull. 2011, 60, 942–947. [Google Scholar] [CrossRef]
  25. Gómez-González, J.; Martínez-Castro, L.; Tolosa-Barrilero, J.; Alcalde-Ordóñez, A.; Learte-Aymamí, S.; Mascareñas, J.L.; García-Martínez, J.C.; Martínez-Costas, J.; Maréchal, J.-D.; Vázquez López, M.; et al. Selective recognition of A/T-rich DNA 3-way junctions with a three-fold symmetric tripeptide. Chem. Commun. 2022, 58, 7769–7772. [Google Scholar] [CrossRef] [PubMed]
  26. Staderini, M.; Aulić, S.; Bartolini, M.; Tran, H.N.A.; González-Ruiz, V.; Pérez, D.I.; Cabezas, N.; Martínez, A.; Martín, M.A.; Andrisano, V.; et al. A Fluorescent styrylquinoline with combined therapeutic and diagnostic activities against Alzheimer’s and prion diseases. ACS Med. Chem. Lett. 2013, 4, 225–229. [Google Scholar] [CrossRef] [PubMed]
  27. Shiraishi, Y.; Ichimura, C.; Sumiya, S.; Hirai, T. Multicolor fluorescence of a styrylquinoline dye tuned by metal cations. Chem.-Eur. J. 2011, 17, 8324–8332. [Google Scholar] [CrossRef] [PubMed]
  28. Botti, V.; Cesaretti, A.; Ban, Ž.; Crnolatac, I.; Consiglio, G.; Elisei, F.; Piantanida, I. Fine structural tuning of styryl-based dyes for fluorescence and CD-based sensing of various ds-DNA/RNA sequences. Org. Biomol. Chem. 2019, 17, 8243–8258. [Google Scholar] [CrossRef] [PubMed]
  29. Li, Y.H.; Xu, D.; Sun, A.Y.; Ho, S.L.; Poon, C.Y.; Chan, H.N.; Ng, O.T.W.; Yung, K.K.L.; Yan, H.; Li, H.W.; et al. Fluoro-substituted cyanine for reliable in vivo labelling of amyloid-beta oligomers and neuroprotection against amyloid-beta induced toxicity. Chem. Sci. 2017, 8, 8279–8284. [Google Scholar] [CrossRef] [PubMed]
  30. Čipor, I.; Kurutos, A.; Dobrikov, G.M.; Kamounah, F.S.; Majhen, D.; Nestić, D.; Piantanida, I. Structure-dependent mitochondria or lysosome-targeting styryl fluorophores bearing remarkable Stokes shift. Dye. Pigment. 2022, 206, 110626. [Google Scholar] [CrossRef]
  31. Cantor, C.R.; Schimmel, P.R. Biophysical Chemistry; WH Freeman and Co.: San Francisco, CA, USA, 1980; Volume 3. [Google Scholar]
  32. Egli, M.; Saenger, W. Principles of Nucleic Acid Structure; Springer: New York, NY, USA, 1983. [Google Scholar]
  33. Sánchez-Ruiz, A.; Rodríguez-López, J.; Garzón-Ruiz, A.; Jiménez-Pulido, S.B.; Illán-Cabeza, N.A.; Navarro, A.; García-Martínez, J.C. Shedding light on the origin of solid-state luminescence enhancementin butterfly Molecules. Chem.-Eur. J. 2020, 26, 13990–14001. [Google Scholar] [CrossRef]
  34. Yang, L.; Liu, Y.; Ma, C.; Liu, W.; Li, Y.; Li, L. Naphthalene-fused BODIPY with large Stokes shift as saturated-red fluorescent dye for living cell imaging. Dye. Pigment. 2015, 122, 1–5. [Google Scholar] [CrossRef]
  35. Zheng, Q.; Xu, G.; Prasad, P.N. Conformationally restricted dipyrromethene boron difluoride (BODIPY) dyes: Highly fluorescent, multicolored probes for cellular imaging. Chem.-Eur. J. 2008, 14, 5812–5819. [Google Scholar] [CrossRef]
  36. Wilson, W.D.; Ratmeyer, L.; Zhao, M.; Strekowski, L.; Boykin, D. The search for structure-specific nucleic acid-interactive drugs: Effects of compound structure on RNA versus DNA interaction strength. Biochemistry 1993, 32, 4098–4104. [Google Scholar] [CrossRef] [PubMed]
  37. McGhee, J.D.; von Hippel, P.H. Theoretical aspects of DNA-protein interactions: Co-operative and non-co-operative binding of large ligands to a one-dimensional homogeneous lattice. J. Mol. Biol. 1974, 86, 469–489. [Google Scholar] [CrossRef] [PubMed]
  38. Scatchard, G. The attractions of proteins for small molecules an ions. Ann. N. Y. Acad. Sci. 1949, 51, 660–672. [Google Scholar] [CrossRef]
  39. Gore, M.G. Spectrophotometry and Spectrofluorimetry. A Practical Approach; Oxford University Press: Oxford, UK, 2000. [Google Scholar]
  40. Rodger, A.; Norden, B. Circular Dichroism and Linear Dichroism; Oxford University Press: New York, NY, USA, 1997. [Google Scholar]
  41. Šmidlehner, T.; Piantanida, I.; Pescitelli, G. Polarization spectroscopy methods in the determination of interactions of small molecules with nucleic acids—Tutorial. Beilstein J. Org. Chem. 2018, 14, 84–105. [Google Scholar] [CrossRef] [PubMed]
  42. Eriksson, M.; Norden, B. Linear and Circular Dichroism of Drug-Nucleic Acid Complexes. Methods Enzymol. 2001, 340, 68–98. [Google Scholar] [CrossRef] [PubMed]
  43. Demeunynck, M.; Bailly, C.; Wilson, W.D. Small Molecule DNA and RNA Binders: From Synthesis to Nucleic Acid Complexes; Wiley-VCH Verlag GmbH & Co. KGaA: Weinheim, Germany, 2004. [Google Scholar]
  44. Winter, A.; Friebe, C.; Hager, M.D.; Schubert, U.S. Synthesis of Rigid π-Conjugated Mono-, Bis-, Tris-, and Tetrakis(terpyridine)s: Influence of the Degree and Pattern of Substitution on the Photophysical Properties. Eur. J. Org. Chem. 2009, 2009, 801–809. [Google Scholar] [CrossRef]
  45. Mergny, J.L.; Lacroix, L. Analysis of thermal melting curves. Oligonucleotides 2003, 13, 515–537. [Google Scholar] [CrossRef]
  46. Mosmann, T. Rapid colorimetric assay for cellular growth and survival: Application to proliferation and cytotoxicity assays. J. Immunol. Methods 1983, 65, 55–63. [Google Scholar] [CrossRef]
  47. Ranjbar, B.; Gill, P. Circular Dichroism Techniques: Biomolecular and Nanostructural Analyses—A Review. Chem. Biol. Drug Des. 2009, 74, 101–120. [Google Scholar] [CrossRef] [PubMed]
  48. Górecki, M.; Zinna, F.; Biver, T.; Di Bari, L.J. Induced circularly polarized luminescence for revealing DNA binding with fluorescent dyes. Pharm. Biomed. Anal. 2017, 144, 6–11. [Google Scholar] [CrossRef] [PubMed]
Scheme 2. Synthesis of F1 (i = 0 °C to rt, THF, 3 h. ii = rt, DCM, 48 h) as an example of the approach to all the molecules studied.
Ijms 25 05724 sch002
Figure 1. (a) Comparison of UV-Vis spectra of novel dyes. (b) Fluorescence spectra of the dyes at c = 2.5 × 10⁻⁷ M.
Ijms 25 05724 g001
Figure 2. (a) Changes in fluorescence spectrum of tri-substituted dye T1 (c = 5 × 10⁻⁸ M) upon titration with ctDNA; (b) changes in fluorescence spectrum of tetra-substituted dye F1 (c = 5 × 10⁻⁸ M) upon titration with ctDNA; (c) changes in fluorescence intensity of T1 and F1 (c = 5 × 10⁻⁸ M) upon addition of polynucleotides at pH 7.0.
Ijms 25 05724 g002
Figure 3. CD titration of various ds-DNA and ds-RNA with T2 at ratio r[dye]/[polynucleotide] = (DOWN) 0.1 and (UP) 0.5. Note the square that marks the response window (λ = 308–324 nm) specific for AU-RNA. Performed at pH 7, buffer sodium cacodylate, I = 0.05 M.
Ijms 25 05724 g003
Figure 4. CD titration of various ds-DNA and ds-RNA with T5 at ratio r[dye]/[polynucleotide] = 0.5. Note a strong negative band at 383 nm specific for AU-RNA. Performed at pH 7, buffer sodium cacodylate, I = 0.05 M.
Ijms 25 05724 g004
Figure 5. CD titration of various ds-DNA and ds-RNA with T1 at ratio r[dye]/[polynucleotide] = 0.5. Performed at pH 7, buffer sodium cacodylate, I = 0.05 M.
Ijms 25 05724 g005
Figure 6. Cell survival of A549 cells treated with different concentrations of all studied dyes. Data are presented as mean ± SD made in four replicates, relative to the control samples. Control samples are cells treated with DMSO at the same concentration as a tested compound. Representative data from three independent experiments, which yielded similar results, are shown.
Ijms 25 05724 g006
Figure 7. A549 cells were treated with 10 µM of the respective compound for 90 min at 37 °C and subsequently observed by confocal microscopy. Intracellular distribution of T1 (λexc = 350 nm; λem = 400–500 nm), F3 (λexc = 405 nm; λem = 450–550 nm), and F5 (λexc = 405 nm; λem = 450–550 nm) was observed.
Ijms 25 05724 g007
Table 1. Spectrophotometric data of the dyes in aqueous solution at pH 7.0, sodium cacodylate buffer, I = 0.05 M.
Compd.maxλabs/[nm]
(ε × 103/[M−1 cm−1])
b Φfa λexc
[nm]
λem
[nm]
a τ
[ns]
χ2
T1314
(91.5)
0.27 ± 0.0534041210.68 (14.04%)
20.33 (85.96%)
0.960
T2315
(80.0)
0.41 ± 0.0534048013.05 (33.74%)
21.50 (66.26%)
0.918
T3348
(88.8)
0.04 ± 0.053404540.78 (90.42%)
5.03 (9.58%)
1.055
T4314
(86.3)
0.37 ± 0.0534041110.67 (18.28%)
20.24 (81.72%)
0.931
T5348
(79.5)
0.29 ± 0.053404480.69 (98.06%)
4.55 (1.94%)
1.062
F1333
(75.4)
0.57 ± 0.053404602.89 (21.82%)
7.03 (78.18%)
0.941
F2335
(66.5)
0.20 ± 0.053404602.55 (20.77%)
6.69 (79.23%)
1.050
F3366
(83.0)
0.07 ± 0.053404850.64 (59.91%)
3.56 (40.09%)
0.963
F4334
(60.6)
0.35 ± 0.053404602.60 (28.08%)
6.58 (71.92%)
0.985
F5366
(53.8)
0.06 ± 0.053404850.68 (55.54%)
3.63 (44.46%)
0.906
c dimer446
(35.0)
0.21 ± 0.054576050.19 (21%)
1.60 (79%)
0.98 < χ2 < 1.02
a Samples were excited by pulsing diode EPLED340 at 340.1 nm. Emission was monitored at 460 and 500 nm. Aqueous solutions were purged by argon. The measurements were performed three times, and the average values are reported. The associated errors correspond to the maximum absolute deviation. b Absolute fluorescence quantum yields were measured at room temperature (25 °C) by the integrating sphere SC-30, Edinburgh Inst., for argon purged solutions. c Dimer pPy-MeO-pPy: previously studied analogue of T3 and F3 [28].
Table 2. ΔTm values a (°C) for ds-DNA or ds-RNA upon addition of dyes at ratio r[dye]/[polynucleotide] = 0.1. Performed at pH 7, buffer sodium cacodylate, I = 0.05 M.
Compd.ctDNApApU
T1+11.9+23.2
T2+6.2+5.1
T3>+15.0+8.5
T4+12.0+18.1
T5+14.3+1.5
F1>+15.0+12.5
F200
F3+6.6+6.4
F4+4.8+10.4
F5+3.2+1.7
b dimer+3.1+1.8
a Error in ΔTm: ±0.5 °C. b Dimer pPy-MeO-pPy: [28]; previously studied analogue of T3 and F3.
Table 3. Binding constants a log Ks and emission quenching efficiency (b ΔInt) of complexes of dyes with ds-polynucleotides calculated by processing fluorimetric titrations at pH = 7.0, sodium cacodylate buffer, I = 0.05 M.
Compd.ctDNApApU
T18.6 (0.23)8.9 (0.30)
T28.6 (0.04)8.9 (0.16)
T38.2 (0.24)8.7 (0.13)
T48.9 (0.10)8.6 (0.35)
T58.9 (0.10)8.7 (0.14)
F19.3 (0.17)8.6 (0.17)
F28.0 (0.09)8.6 (0.08)
F37.1 (0.11)8.2 (0.28)
F48.6 (0.17)8.9 (0.17)
F58.9 (0.30)7.6 (0.26)
c dimer6.9 (0.80)7.5 (0.5)
a Processing of titration data by means of the Scatchard equation [37,38,39]. For easier comparison, all log Ks values were re-calculated for fixed n[bound dye]/[polynucleotide] = 0.2. The correlation coefficients were >0.99 for all calculated Ks. b ΔInt = Int(100% complex)/Int0. c Dimer pPy-MeO-pPy: [28]; previously studied analogue of T3 and F3.
Disclaimer/Publisher’s Note: The statements, opinions and data contained in all publications are solely those of the individual author(s) and contributor(s) and not of MDPI and/or the editor(s). MDPI and/or the editor(s) disclaim responsibility for any injury to people or property resulting from any ideas, methods, instructions or products referred to in the content.

