
Cellular Distribution and Ultrastructural Changes in HaCaT Cells, Induced by Podophyllotoxin and Its Novel Fluorescent Derivative, Supported by the Molecular Docking Studies

 , , , ,
  , ,
, ,  and
and
Abstract
1. Introduction
2. Results
2.1. Properties of PPT-FL
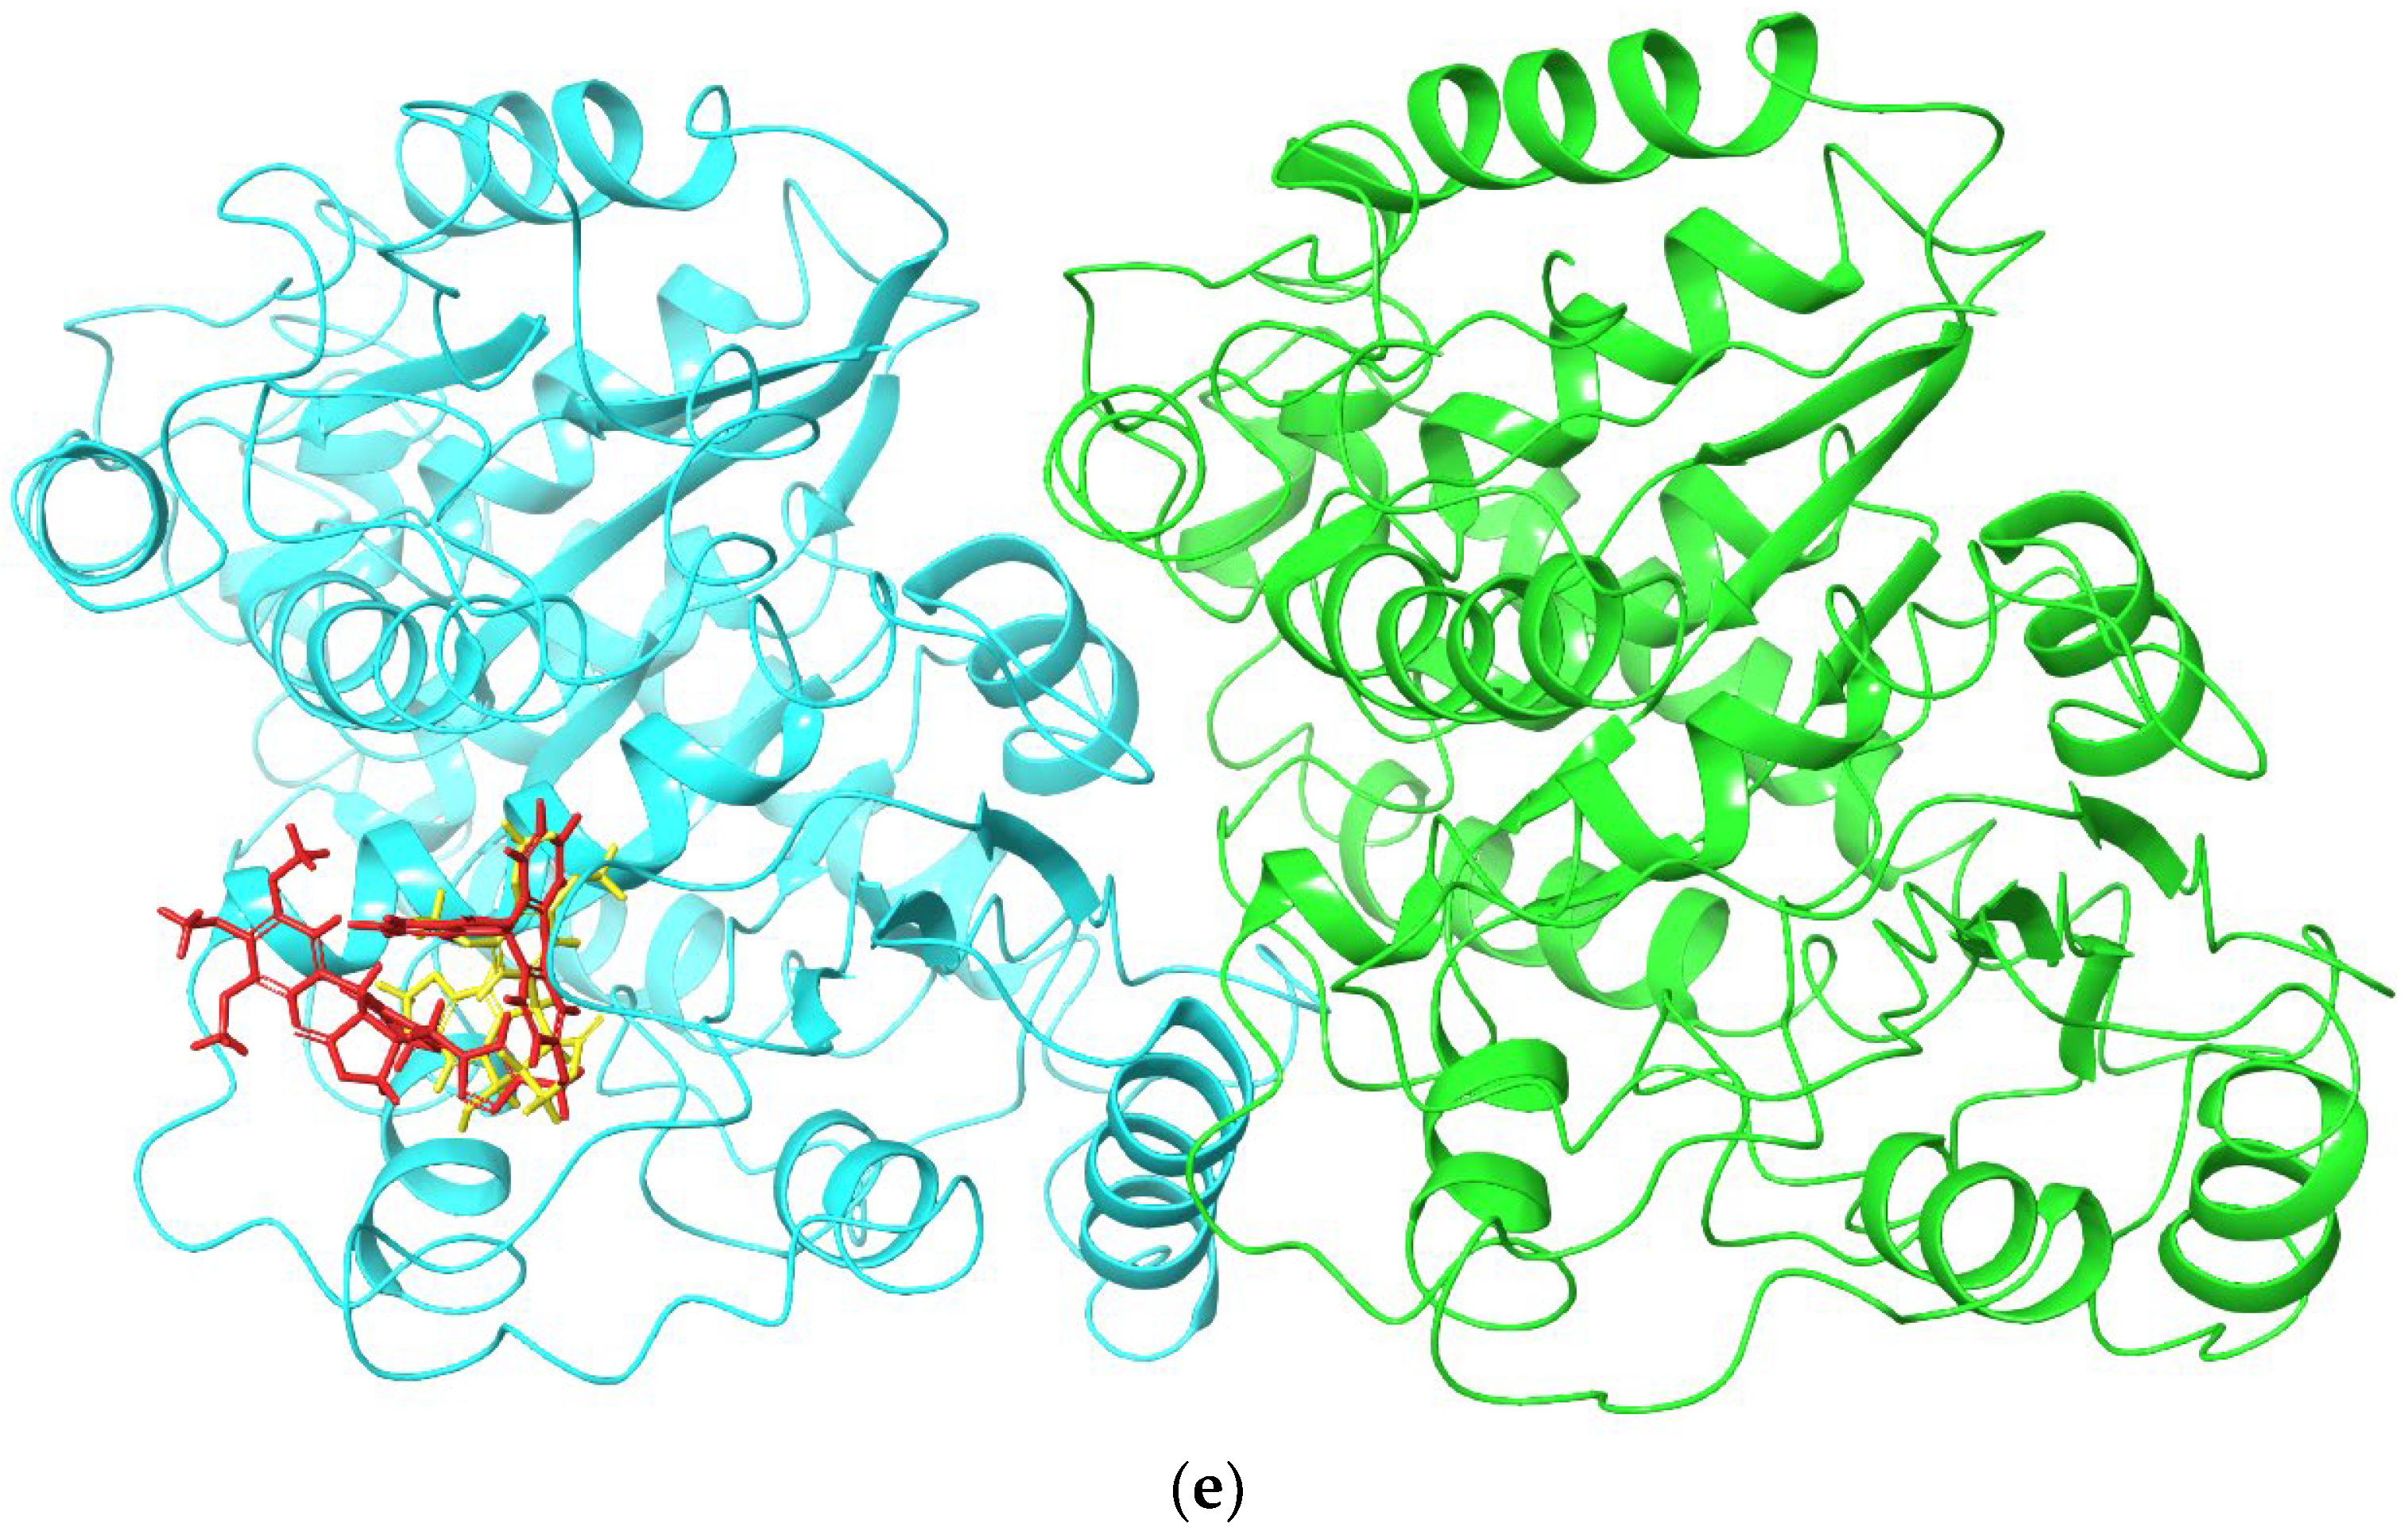
2.2. Molecular Docking and MM/GBSA Calculations
2.3. Cell-Based Assays
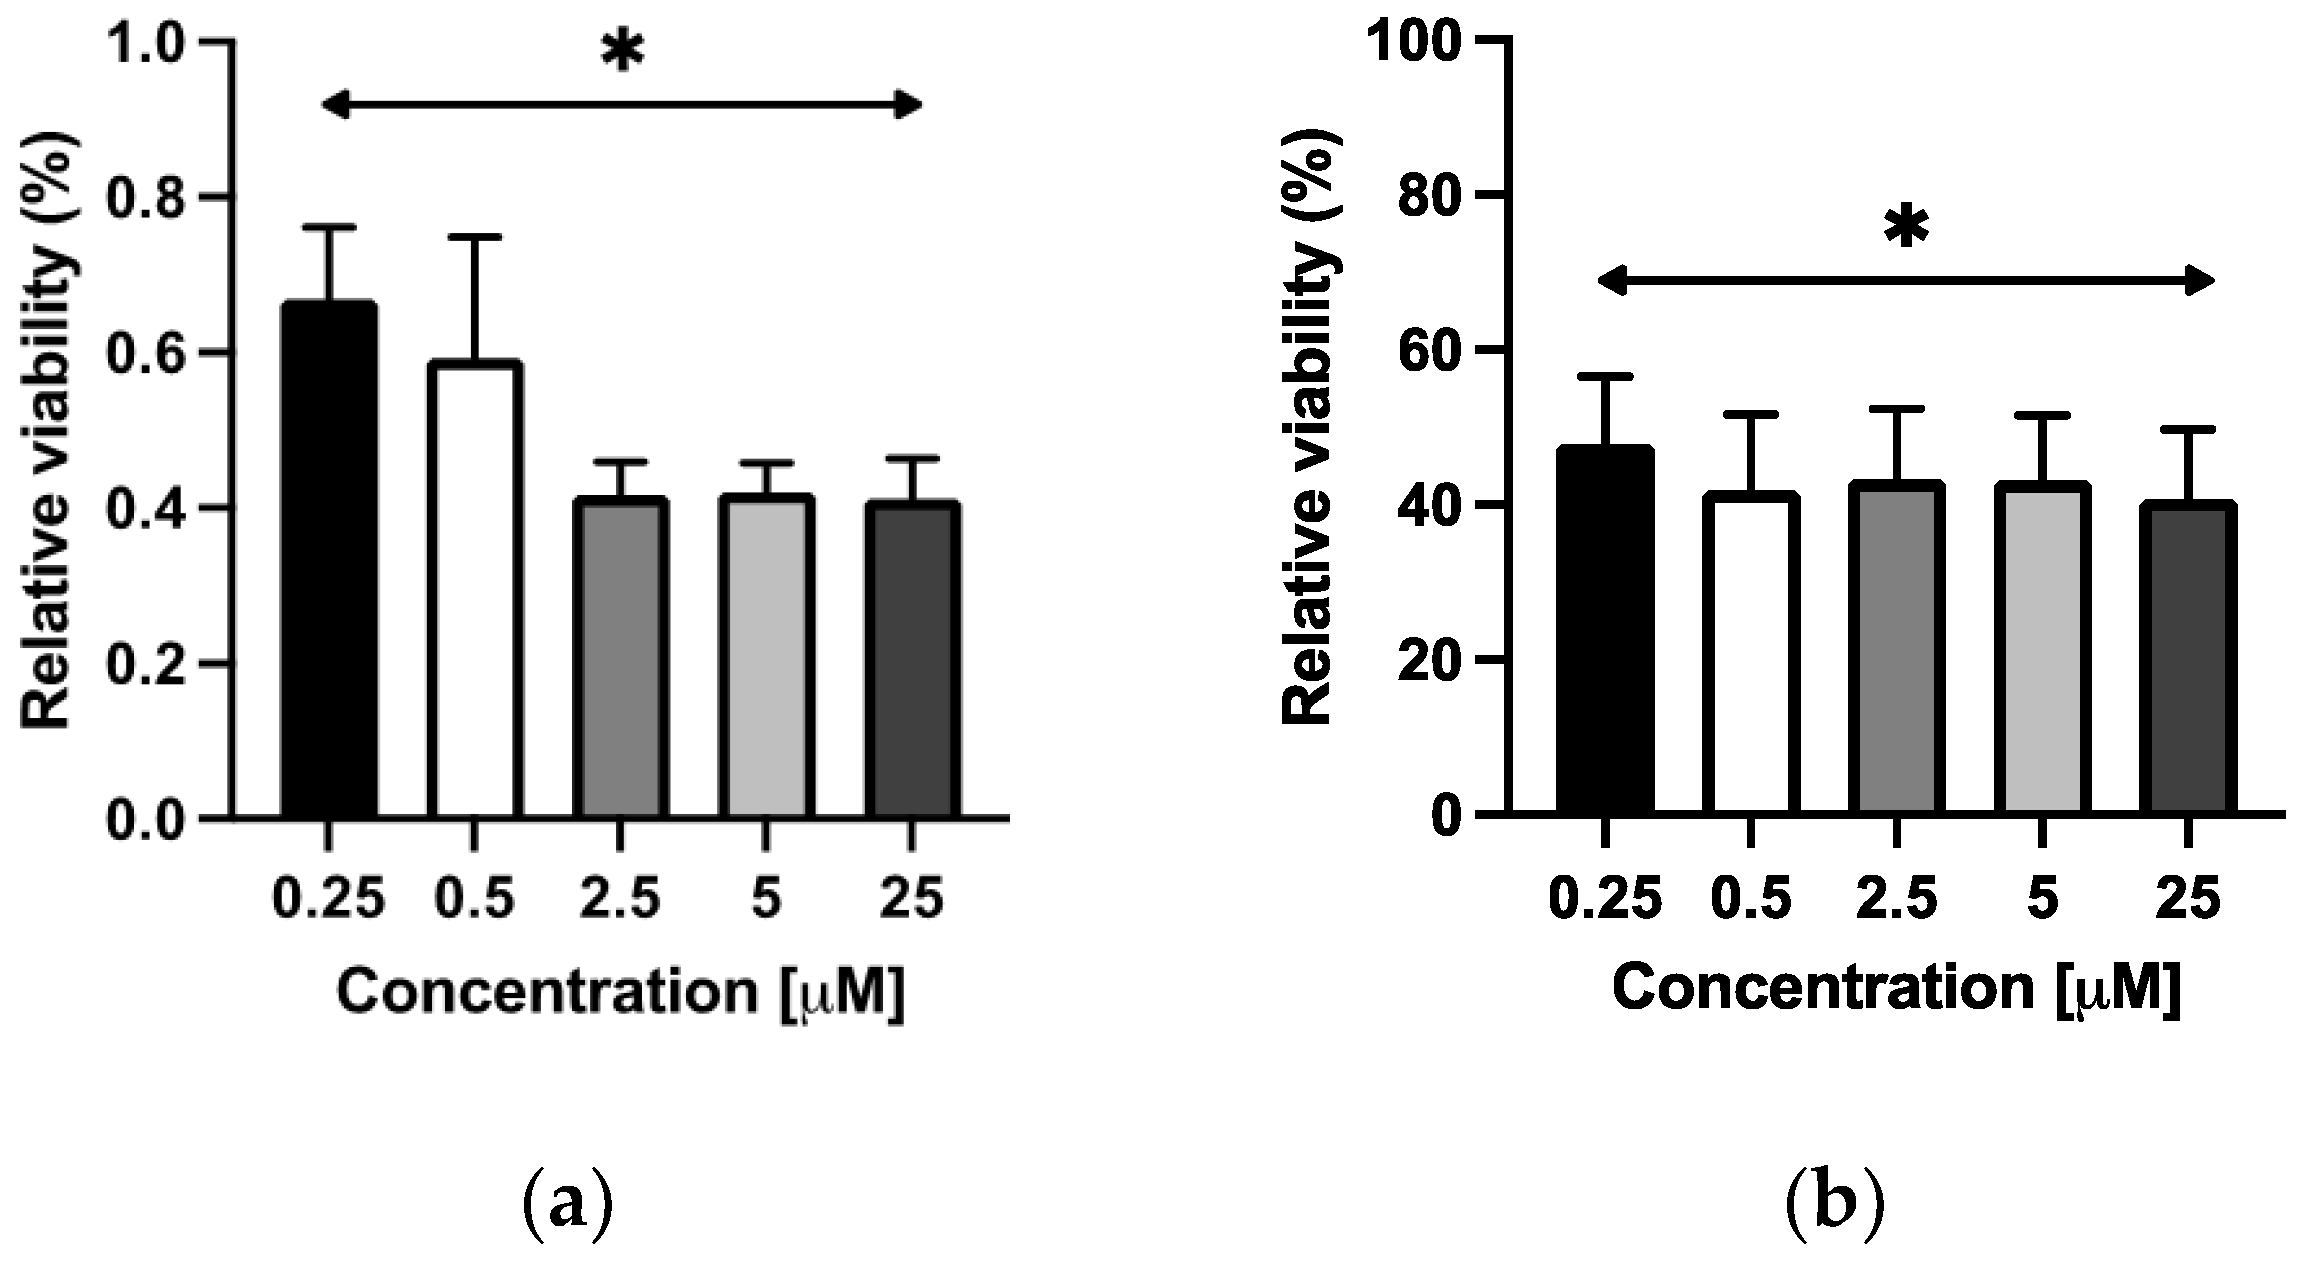
2.3.1. Viability Assay
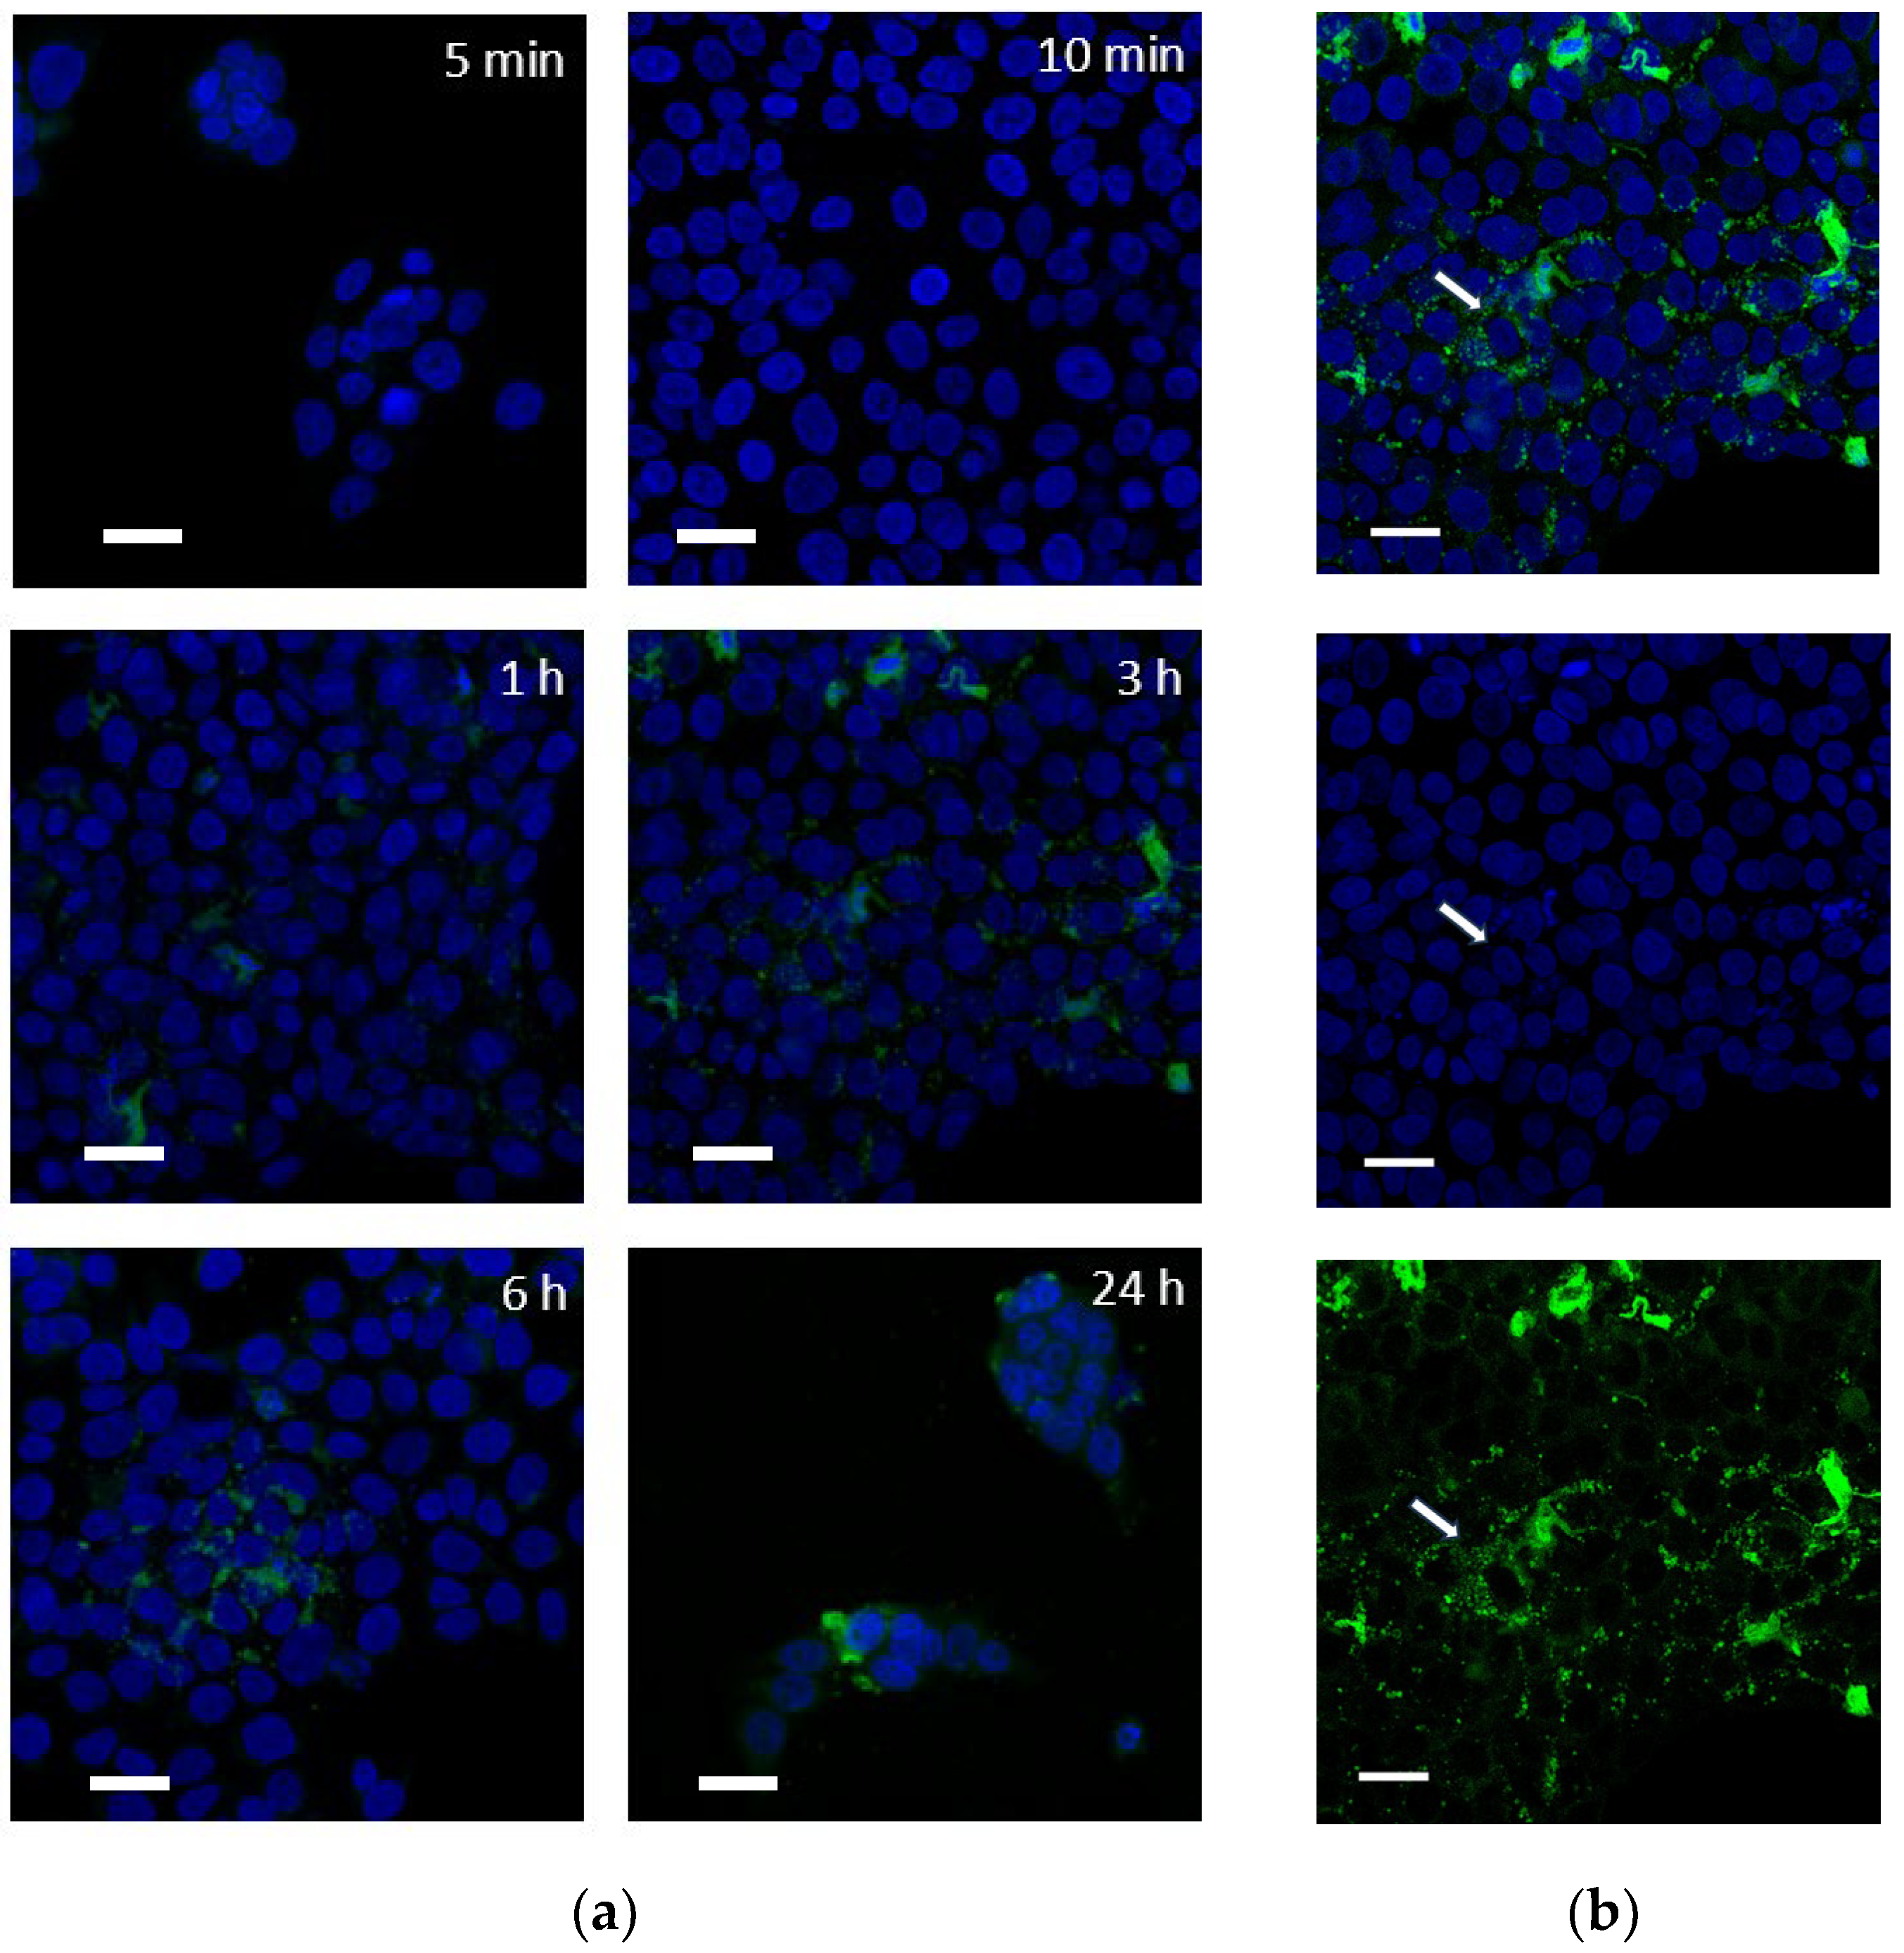
2.3.2. Intracellular Distribution of Fluorescent PPT Derivative (PPT-FL)
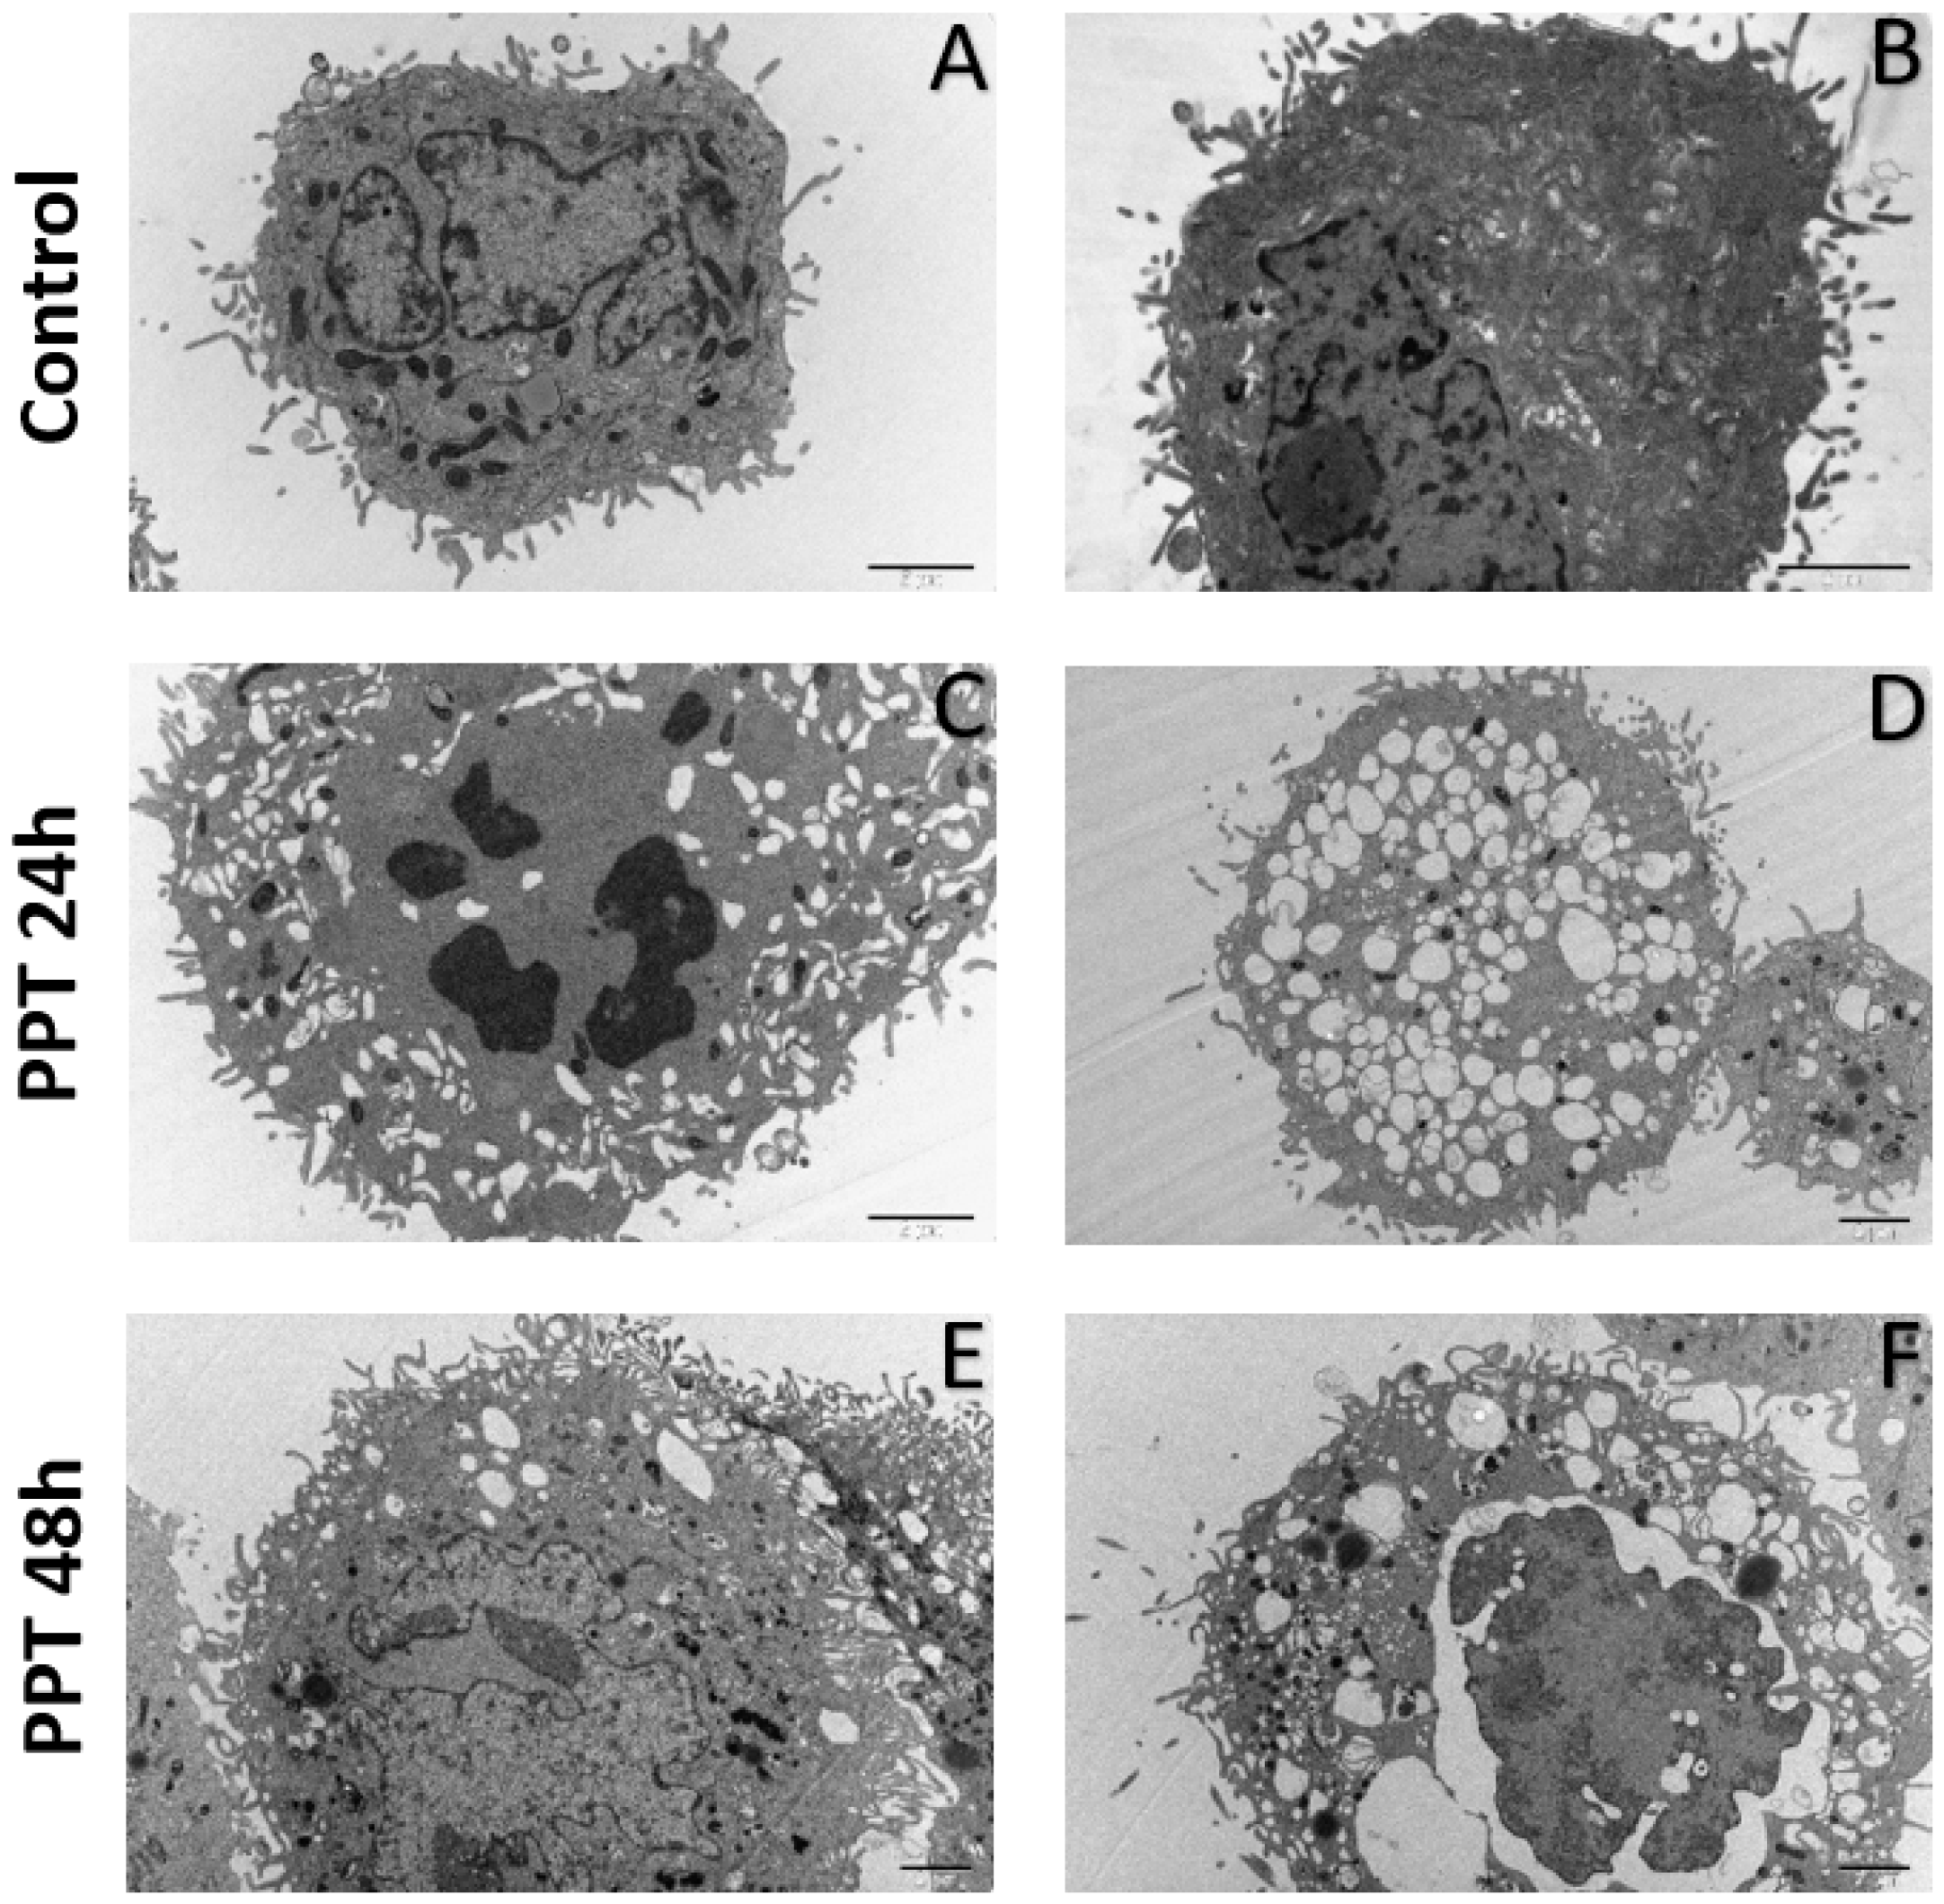
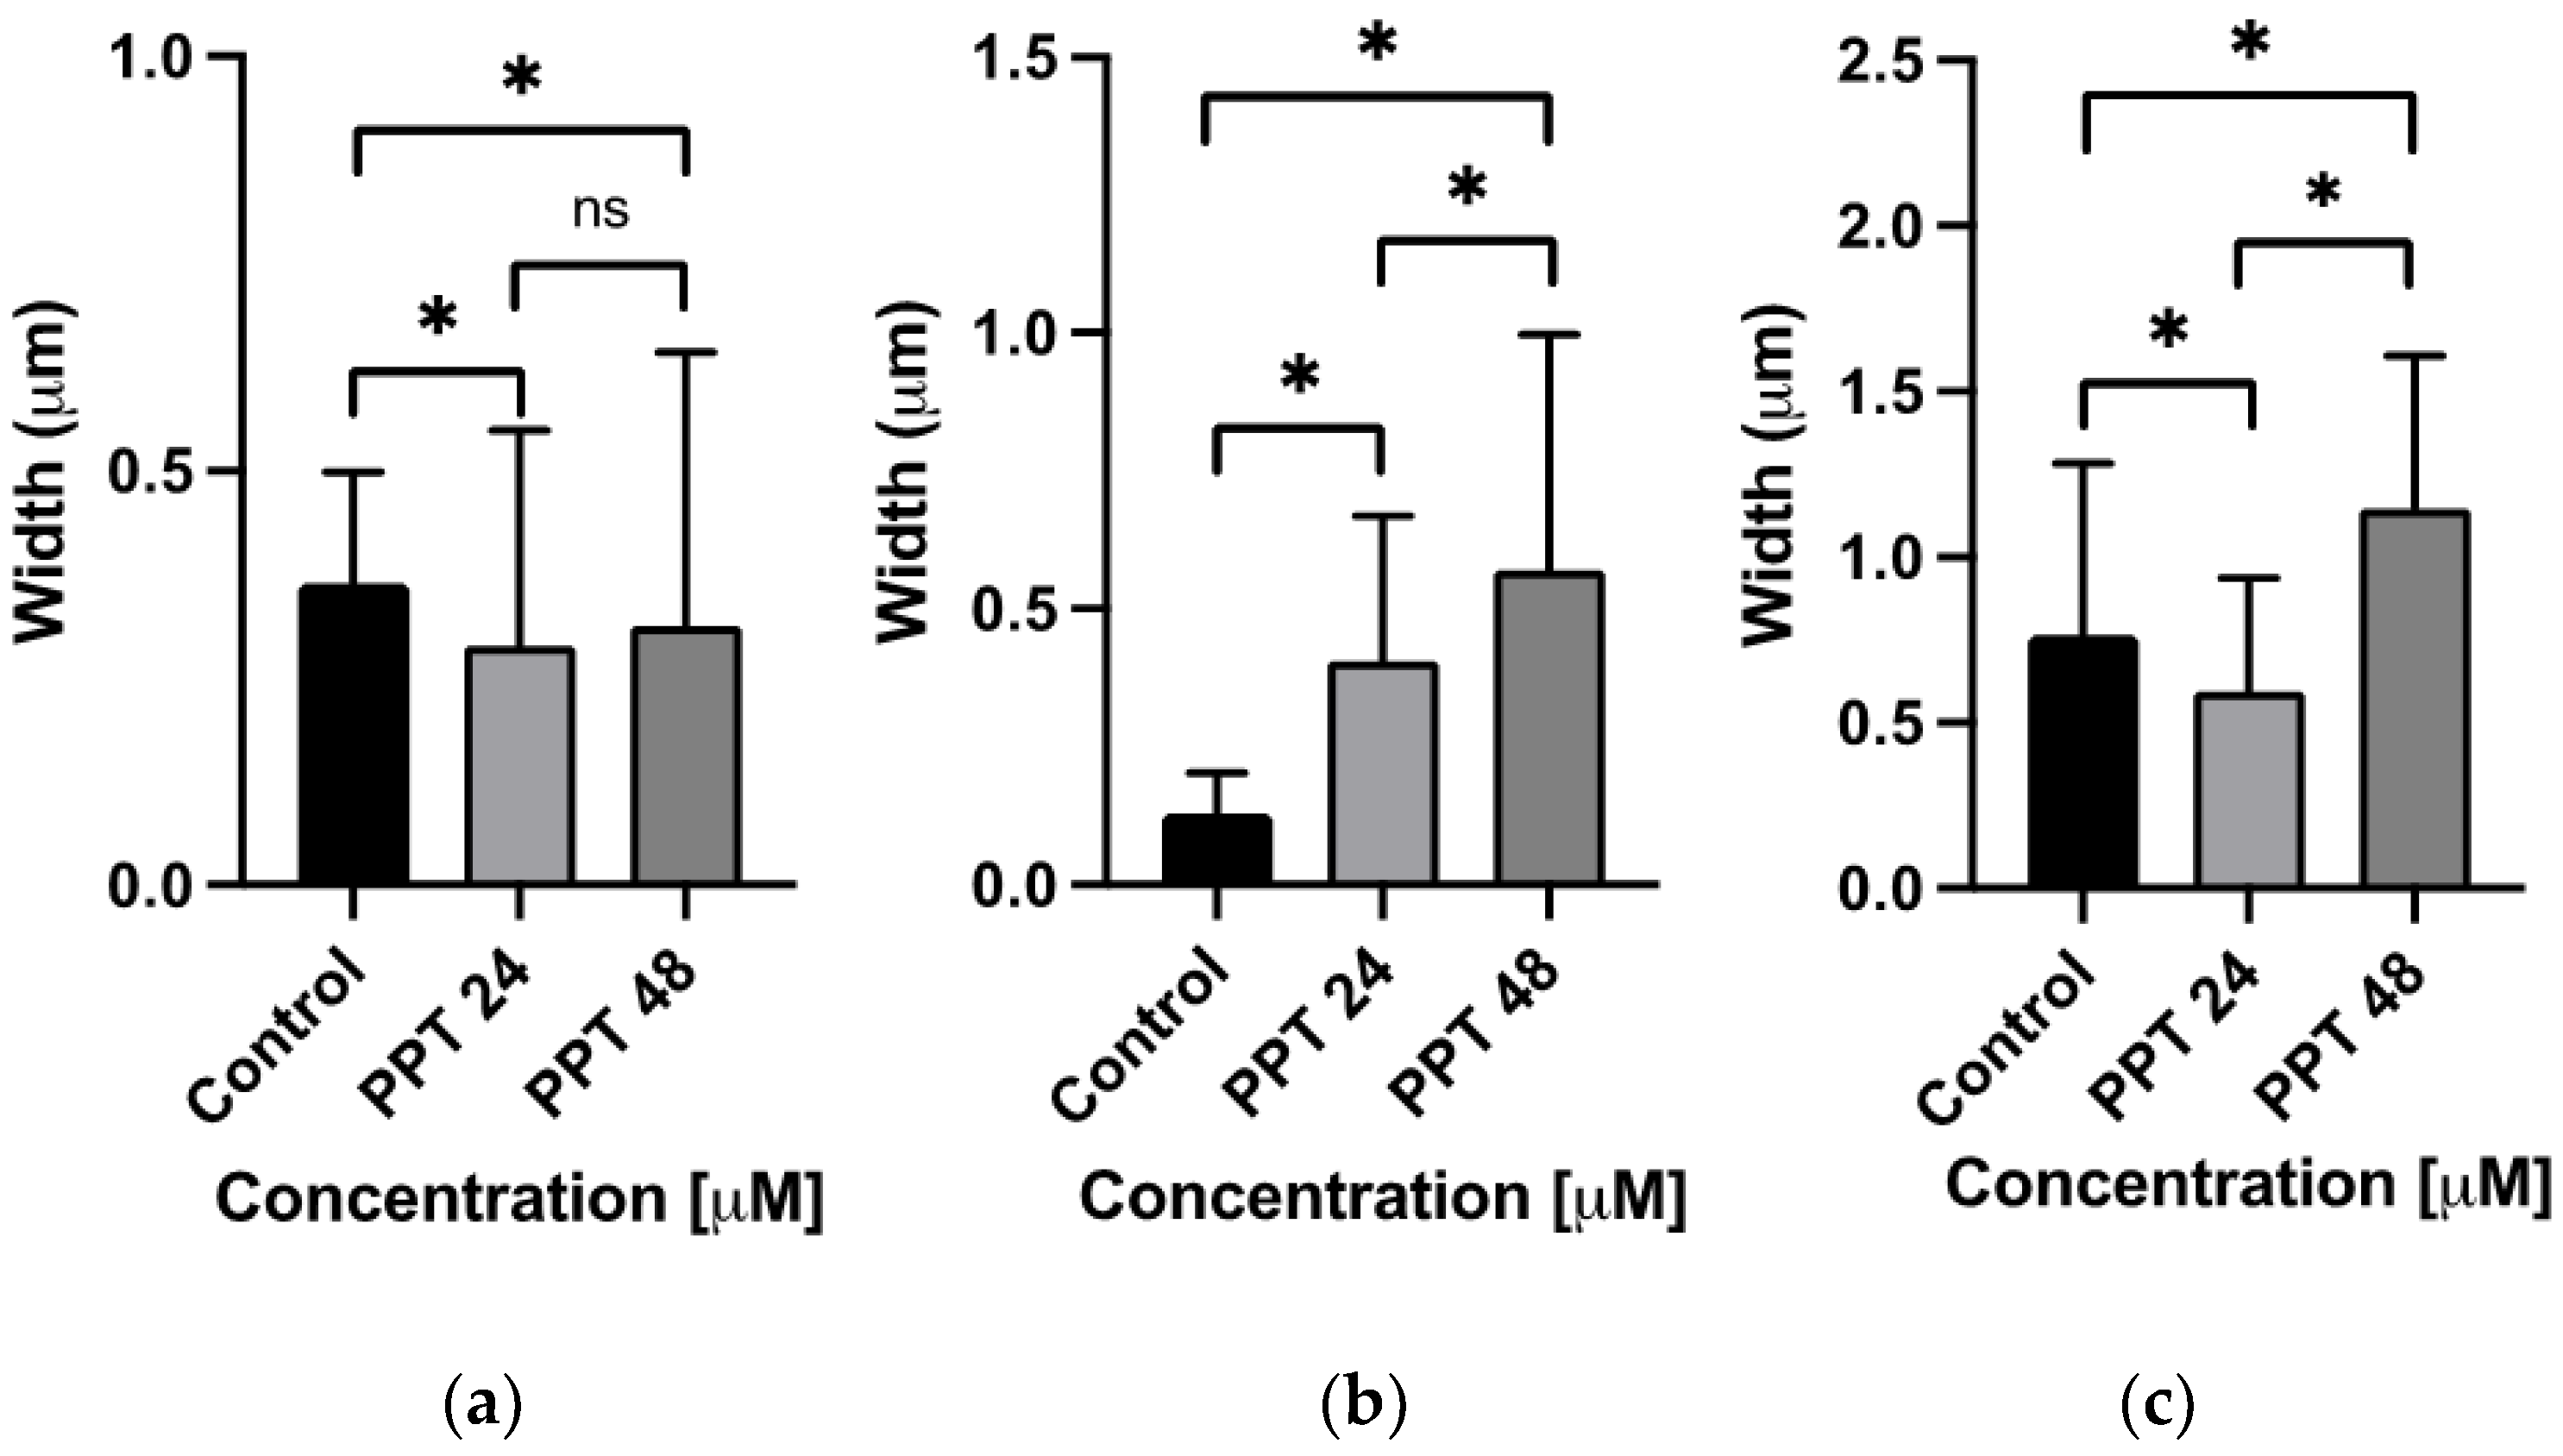
2.3.3. Ultrastructural Analysis
3. Discussion
4. Materials and Methods
4.1. Chemicals
4.2. Chemical Synthesis
4.3. Molecular Docking
4.3.1. Structural Modeling
4.3.2. Active Site Identification and Grid Generation
4.3.3. Ligands Preparation
4.3.4. Glide XP-Ligand Docking
4.3.5. Evaluation of Molecular Docking
4.3.6. MM-GBSA Calculations
4.4. Cell-Based Methods
4.4.1. Cell Culture
4.4.2. Viability Assays
4.4.3. Confocal Microscopy
4.4.4. Transmission Electron Microscopy (TEM)
4.4.5. Morphometric Analysis of TEM Images
4.4.6. Statistical Analysis
5. Conclusions
Author Contributions
Funding
Institutional Review Board Statement
Informed Consent Statement
Data Availability Statement
Acknowledgments
Conflicts of Interest
References
- Nicolaidou, E.; Kanelleas, A.; Nikolakopoulos, S.; Bezrodnii, G.; Nearchou, E.; Gerodimou, M.; Papadopoulou-Skordou, E.; Paparizos, V.; Rigopoulos, D. A short, 8-week course of imiquimod 5% cream versus podophyllotoxin in the treatment of anogenital warts: A retrospective comparative cohort study. Indian J. Dermatol. Venereol. Leprol. 2021, 87, 666–670. [Google Scholar] [CrossRef]
- Gilson, R.; Nugent, D.; Werner, R.N.; Ballesteros, J.; Ross, J. 2019 IUSTI-Europe guideline for the management of anogenital warts. J. Eur. Acad. Dermatol. Venereol. 2020, 34, 1644–1653. [Google Scholar] [CrossRef] [PubMed]
- Shah, Z.; Gohar, U.F.; Jamshed, I.; Mushtaq, A.; Mukhtar, H.; Zia-Ui-Haq, M.; Toma, S.I.; Manea, R.; Moga, M.; Popovici, B. Podophyllotoxin: History, Recent Advances and Future Prospects. Biomolecules 2021, 11, 603. [Google Scholar] [CrossRef] [PubMed]
- Canel, C.; Moraes, R.M.; Dayan, F.E.; Ferreira, D. Podophyllotoxin. Phytochemistry 2000, 54, 115–120. [Google Scholar] [CrossRef] [PubMed]
- Schilstra, M.J.; Martin, S.R.; Bayley, P.M. The effect of podophyllotoxin on microtubule dynamics. J. Biol. Chem. 1989, 264, 8827–8834. [Google Scholar] [CrossRef] [PubMed]
- Brewer, C.F.; Loike, J.D.; Horwitz, S.B.; Sternlicht, H.; Gensler, W.J. Conformational analysis of podophyllotoxin and its congeners. Structure-activity relationship in microtubule assembly. J. Med. Chem. 1979, 22, 215–221. [Google Scholar] [CrossRef] [PubMed]
- Cortese, F.; Bhattacharyya, B.; Wolff, J. Podophyllotoxin as a probe for the colchicine binding site of tubulin. J. Med. Chem. 1977, 252, 1134–1140. [Google Scholar] [CrossRef]
- Luduena, R.F.; Roach, M.C.J.B. Interaction of tubulin with drugs and alkylating agents. 2. Effects of colchicine, podophyllotoxin, and vinblastine on the alkylation of tubulin. Biochemistry 1981, 20, 4444–4450. [Google Scholar] [CrossRef]
- Palanivelu, P.; Ludueña, R. Interactions of the tau-tubulin-vinblastine complex with colchicine, podophyllotoxin, and N, N′-ethylenebis (iodoacetamide). J. Biol. Chem. 1982, 257, 6311–6315. [Google Scholar] [CrossRef]
- Dinic, J.; Podolski-Renic, A.; Stankovic, T.; Bankovic, J.; Pesic, M. New approaches with natural product drugs for overcoming multidrug resistance in cancer. Curr. Pharm. Des. 2015, 21, 5589–5604. [Google Scholar] [CrossRef]
- Sun, W.; Sun, F.; Meng, J.; Cao, X.; Zhao, S.; Wang, C.; Li, L.; Jiang, P. Design, semi-synthesis and bioactivity evaluation of novel podophyllotoxin derivatives as potent anti-tumor agents. Bioorg. Chem. 2022, 126, 105906. [Google Scholar] [CrossRef] [PubMed]
- Yu, X.; Che, Z.; Xu, H. Recent Advances in the Chemistry and Biology of Podophyllotoxins. Chemistry 2017, 23, 4467–4526. [Google Scholar] [CrossRef] [PubMed]
- Kirby, P.; Dunne, A.; King, D.H.; Corey, L. Double-blind randomized clinical trial of self-administered podofilox solution versus vehicle in the treatment of genital warts. Am. J. Med. 1990, 88, 465–469. [Google Scholar] [CrossRef] [PubMed]
- Claesson, U.; Lassus, A.; Happonen, H.; Hogstrom, L.; Siboulet, A. Topical treatment of venereal warts: A comparative open study of podophyllotoxin cream versus solution. Int. J. STD AIDS 1996, 7, 429–434. [Google Scholar] [CrossRef] [PubMed]
- Strus, P.; Borensztejn, K.; Szczepankiewicz, A.A.; Lisiecki, K.; Czarnocki, Z.; Nieznanska, H.; Wojcik, C.; Bialy, L.P.; Mlynarczuk-Bialy, I. Novel podophyllotoxin and benzothiazole derivative induces transitional morphological and functional changes in HaCaT cells. Toxicol. In Vitro 2021, 73, 105144. [Google Scholar] [CrossRef] [PubMed]
- Chang, L.W.; Yang, C.M.; Chen, C.F.; Deng, J.F. Experimental podophyllotoxin (bajiaolian) poisoning: I. Effects on the nervous system. Biomed. Environ. Sci. 1992, 5, 283–292. [Google Scholar] [PubMed]
- Kao, W.F.; Hung, D.Z.; Tsai, W.J.; Lin, K.P.; Deng, J.F. Podophyllotoxin intoxication: Toxic effect of Bajiaolian in herbal therapeutics. Hum. Exp. Toxicol. 1992, 11, 480–487. [Google Scholar] [CrossRef] [PubMed]
- Wei, J.; Chen, J.; Ju, P.; Ma, L.; Chen, L.; Ma, W.; Zheng, T.; Yang, G.; Wang, Y.X. Synthesis and Biological Evaluation of 4beta-N-Acetylamino Substituted Podophyllotoxin Derivatives as Novel Anticancer Agents. Front. Chem. 2019, 7, 253. [Google Scholar] [CrossRef]
- Desbene, S.; Giorgi-Renault, S.J.C.M.C.-A.-C.A. Drugs that inhibit tubulin polymerization: The particular case of podophyllotoxin and analogues. Curr. Med. Chem. Anti Cancer Agents 2002, 2, 71–90. [Google Scholar] [CrossRef]
- Miranda-Vera, C.; Hernandez, A.P.; Garcia-Garcia, P.; Diez, D.; Garcia, P.A.; Castro, M.A. Podophyllotoxin: Recent Advances in the Development of Hybridization Strategies to Enhance Its Antitumoral Profile. Pharmaceutics 2023, 15, 2728. [Google Scholar] [CrossRef]
- Xiao, J.; Gao, M.; Sun, Z.; Diao, Q.; Wang, P.; Gao, F. Recent advances of podophyllotoxin/epipodophyllotoxin hybrids in anticancer activity, mode of action, and structure-activity relationship: An update (2010–2020). Eur. J. Med. Chem. 2020, 208, 112830. [Google Scholar] [CrossRef] [PubMed]
- Zhao, W.; Cong, Y.; Li, H.M.; Li, S.; Shen, Y.; Qi, Q.; Zhang, Y.; Li, Y.Z.; Tang, Y.J. Challenges and potential for improving the druggability of podophyllotoxin-derived drugs in cancer chemotherapy. Nat. Prod. Rep. 2021, 38, 470–488. [Google Scholar] [CrossRef] [PubMed]
- Zhang, X.; Rakesh, K.P.; Shantharam, C.S.; Manukumar, H.M.; Asiri, A.M.; Marwani, H.M.; Qin, H.L. Podophyllotoxin derivatives as an excellent anticancer aspirant for future chemotherapy: A key current imminent needs. Bioorg. Med. Chem. 2018, 26, 340–355. [Google Scholar] [CrossRef] [PubMed]
- Yakkala, P.A.; Penumallu, N.R.; Shafi, S.; Kamal, A. Prospects of Topoisomerase Inhibitors as Promising Anti-Cancer Agents. Pharmaceuticals 2023, 16, 1456. [Google Scholar] [CrossRef] [PubMed]
- Kamal, A.; Ali Hussaini, S.M.; Rahim, A.; Riyaz, S. Podophyllotoxin derivatives: A patent review (2012–2014). Expert Opin. Ther. Pat. 2015, 25, 1025–1034. [Google Scholar] [CrossRef] [PubMed]
- Ardalani, H.; Avan, A.; Ghayour-Mobarhan, M. Podophyllotoxin: A novel potential natural anticancer agent. Avicenna J. Phytomed. 2017, 7, 285–294. [Google Scholar] [PubMed]
- Guo, Q.; Jiang, E. Recent Advances in the Application of Podophyllotoxin Derivatives to Fight Against Multidrug-Resistant Cancer Cells. Curr. Top. Med. Chem. 2021, 21, 1712–1724. [Google Scholar] [CrossRef] [PubMed]
- Shi, R.J.; Fan, H.Y.; Yu, X.H.; Tang, Y.L.; Jiang, J.; Liang, X.H. Advances of podophyllotoxin and its derivatives: Patterns and mechanisms. Biochem. Pharmacol. 2022, 200, 115039. [Google Scholar] [CrossRef]
- Wen, J.; Liu, F.; Tao, B.; Sun, S. GSH-responsive anti-mitotic cell penetrating peptide-linked podophyllotoxin conjugate for improving water solubility and targeted synergistic drug delivery. Bioorg Med. Chem. Lett. 2019, 29, 1019–1022. [Google Scholar] [CrossRef]
- Chu, B.; Shi, S.; Li, X.; Hu, L.; Shi, L.; Zhang, H.; Xu, Q.; Ye, L.; Lin, G.; Zhang, N.; et al. Preparation and evaluation of teniposide-loaded polymeric micelles for breast cancer therapy. Int. J. Pharm. 2016, 513, 118–129. [Google Scholar] [CrossRef]
- Meresse, P.; Dechaux, E.; Monneret, C.; Bertounesque, E. Etoposide: Discovery and medicinal chemistry. Curr. Med. Chem. 2004, 11, 2443–2466. [Google Scholar] [CrossRef] [PubMed]
- Yusenko, M.; Jakobs, A.; Klempnauer, K.H. A novel cell-based screening assay for small-molecule MYB inhibitors identifies podophyllotoxins teniposide and etoposide as inhibitors of MYB activity. Sci. Rep. 2018, 8, 13159. [Google Scholar] [CrossRef] [PubMed]
- Ranade, A.R.; Higgins, L.; Markowski, T.W.; Glaser, N.; Kashin, D.; Bai, R.; Hong, K.H.; Hamel, E.; Hofle, G.; Georg, G.I. Characterizing the Epothilone Binding Site on beta-Tubulin by Photoaffinity Labeling: Identification of beta-Tubulin Peptides TARGSQQY and TSRGSQQY as Targets of an Epothilone Photoprobe for Polymerized Tubulin. J. Med. Chem. 2016, 59, 3499–3514. [Google Scholar] [CrossRef] [PubMed]
- Hammonds, T.R.; Denyer, S.P.; Jackson, D.E.; Irving, W.L. Studies to show that with podophyllotoxin the early replicative stages of herpes simplex virus type 1 depend upon functional cytoplasmic microtubules. J. Med. Microbiol. 1996, 45, 167–172. [Google Scholar] [CrossRef] [PubMed]
- Wang, G.H.; Shen, H.P.; Huang, X.; Jiang, X.H.; Jin, C.S.; Chu, Z.M. Effect of Podophyllotoxin Conjugated Stearic Acid Grafted Chitosan Oligosaccharide Micelle on Human Glioma Cells. J. Korean Neurosurg. Soc. 2020, 63, 698–706. [Google Scholar] [CrossRef] [PubMed]
- Henseleit, U.; Rosenbach, T.; Kolde, G. Induction of apoptosis in human HaCaT keratinocytes. Arch. Dermatol. Res. 1996, 288, 676–683. [Google Scholar] [CrossRef] [PubMed]
- Hartmann, J.T.; Lipp, H.P. Camptothecin and podophyllotoxin derivatives: Inhibitors of topoisomerase I and II—Mechanisms of action, pharmacokinetics and toxicity profile. Drug Saf. 2006, 29, 209–230. [Google Scholar] [CrossRef] [PubMed]
- Lu, P.S.; Xie, L.P.; Kong, X.H.; Xu, Y.; Sun, S.C. Podophyllotoxin Exposure Affects Organelle Distribution and Functions in Mouse Oocyte Meiosis. Front. Cell Dev. Biol. 2021, 9, 672590. [Google Scholar] [CrossRef] [PubMed]
- Walter, P.; Ron, D. The unfolded protein response: From stress pathway to homeostatic regulation. Science 2011, 334, 1081–1086. [Google Scholar] [CrossRef]
- Yuan, S.; She, D.; Jiang, S.; Deng, N.; Peng, J.; Ma, L. Endoplasmic reticulum stress and therapeutic strategies in metabolic, neurodegenerative diseases and cancer. Mol. Med. 2024, 30, 40. [Google Scholar] [CrossRef]
- Cohen, T.; Schwarz, T.M.; Vigant, F.; Gardner, T.J.; Hernandez, R.E.; Lee, B.; Tortorella, D. The Microtubule Inhibitor Podofilox Inhibits an Early Entry Step of Human Cytomegalovirus. Viruses 2016, 8, 295. [Google Scholar] [CrossRef] [PubMed]
- Spano, A.; Sciola, L.; Monaco, G.; Barni, S. Relationship between actin microfilaments and plasma membrane changes during apoptosis of neoplastic cell lines in different culture conditions. Eur. J. Histochem. 2000, 44, 255–267. [Google Scholar] [PubMed]
- Derbre, S.; Roue, G.; Poupon, E.; Susin, S.A.; Hocquemiller, R. Annonaceous acetogenins: The hydroxyl groups and THF rings are crucial structural elements for targeting the mitochondria, demonstration with the synthesis of fluorescent squamocin analogues. Chembiochem 2005, 6, 979–982. [Google Scholar] [CrossRef] [PubMed]
- Ren, J.; Wu, L.; Xin, W.Q.; Chen, X.; Hu, K. Synthesis and biological evaluation of novel 4beta-(1,3,4-oxadiazole-2-amino)-podophyllotoxin derivatives. Bioorg. Med. Chem. Lett. 2012, 22, 4778–4782. [Google Scholar] [CrossRef] [PubMed]
- Berman, H.M.; Westbrook, J.; Feng, Z.; Gilliland, G.; Bhat, T.N.; Weissig, H.; Shindyalov, I.N.; Bourne, P.E. The Protein Data Bank. Nucleic Acids Res. 2000, 28, 235–242. [Google Scholar] [CrossRef]
- Lipiec, S.; Gurba, A.; Agnieszczak, I.M.; Szczepankiewicz, A.A.; Szymanski, P.; Taciak, P.; Szczepaniak, R.; Szeleszczuk, L.; Nieznanska, H.; Wlodarczyk, J.; et al. New gold (III) cyanide complex TGS 121 induces ER stress, proteasome inhibition and death of Ras-hyperactivated cells. Toxicol. In Vitro 2023, 88, 105556. [Google Scholar] [CrossRef]


| Tubulin Structure Refcode | Ligand | Glide GScore [kcal/mol] | MM/GBSA ΔG Binding [kcal/mol] | Residues Forming Hydrogen Bonds |
|---|---|---|---|---|
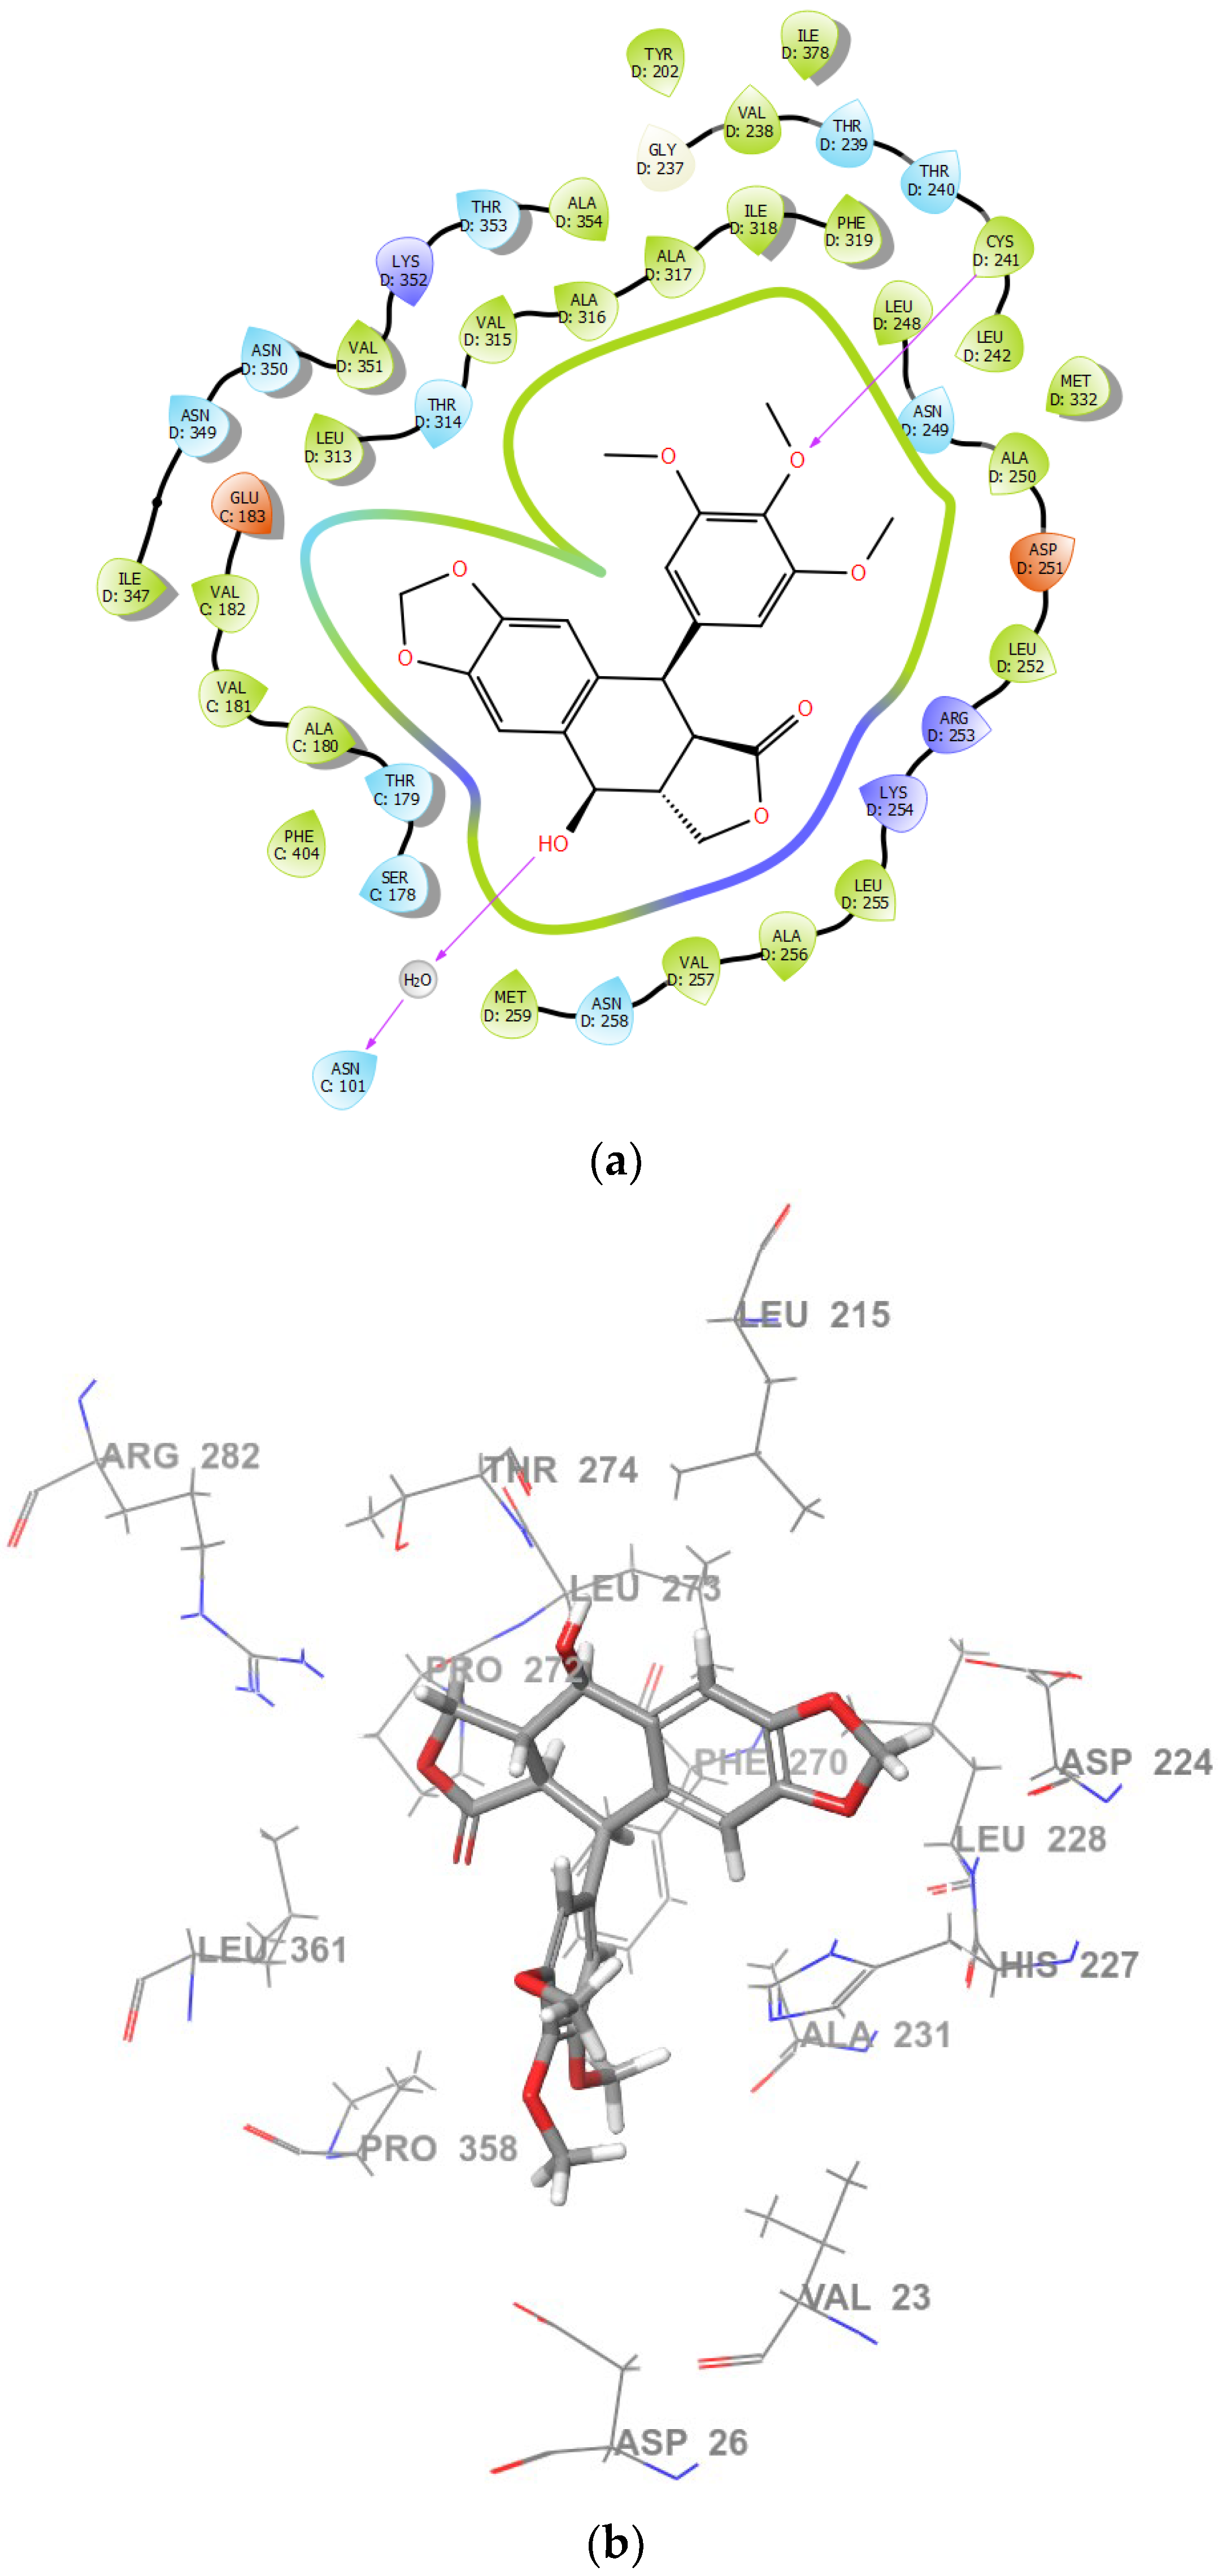
| 1SA1 | PPT | −8.11491 | −61.9107 | THR179 |
| PPT-FL | * | * | * | |
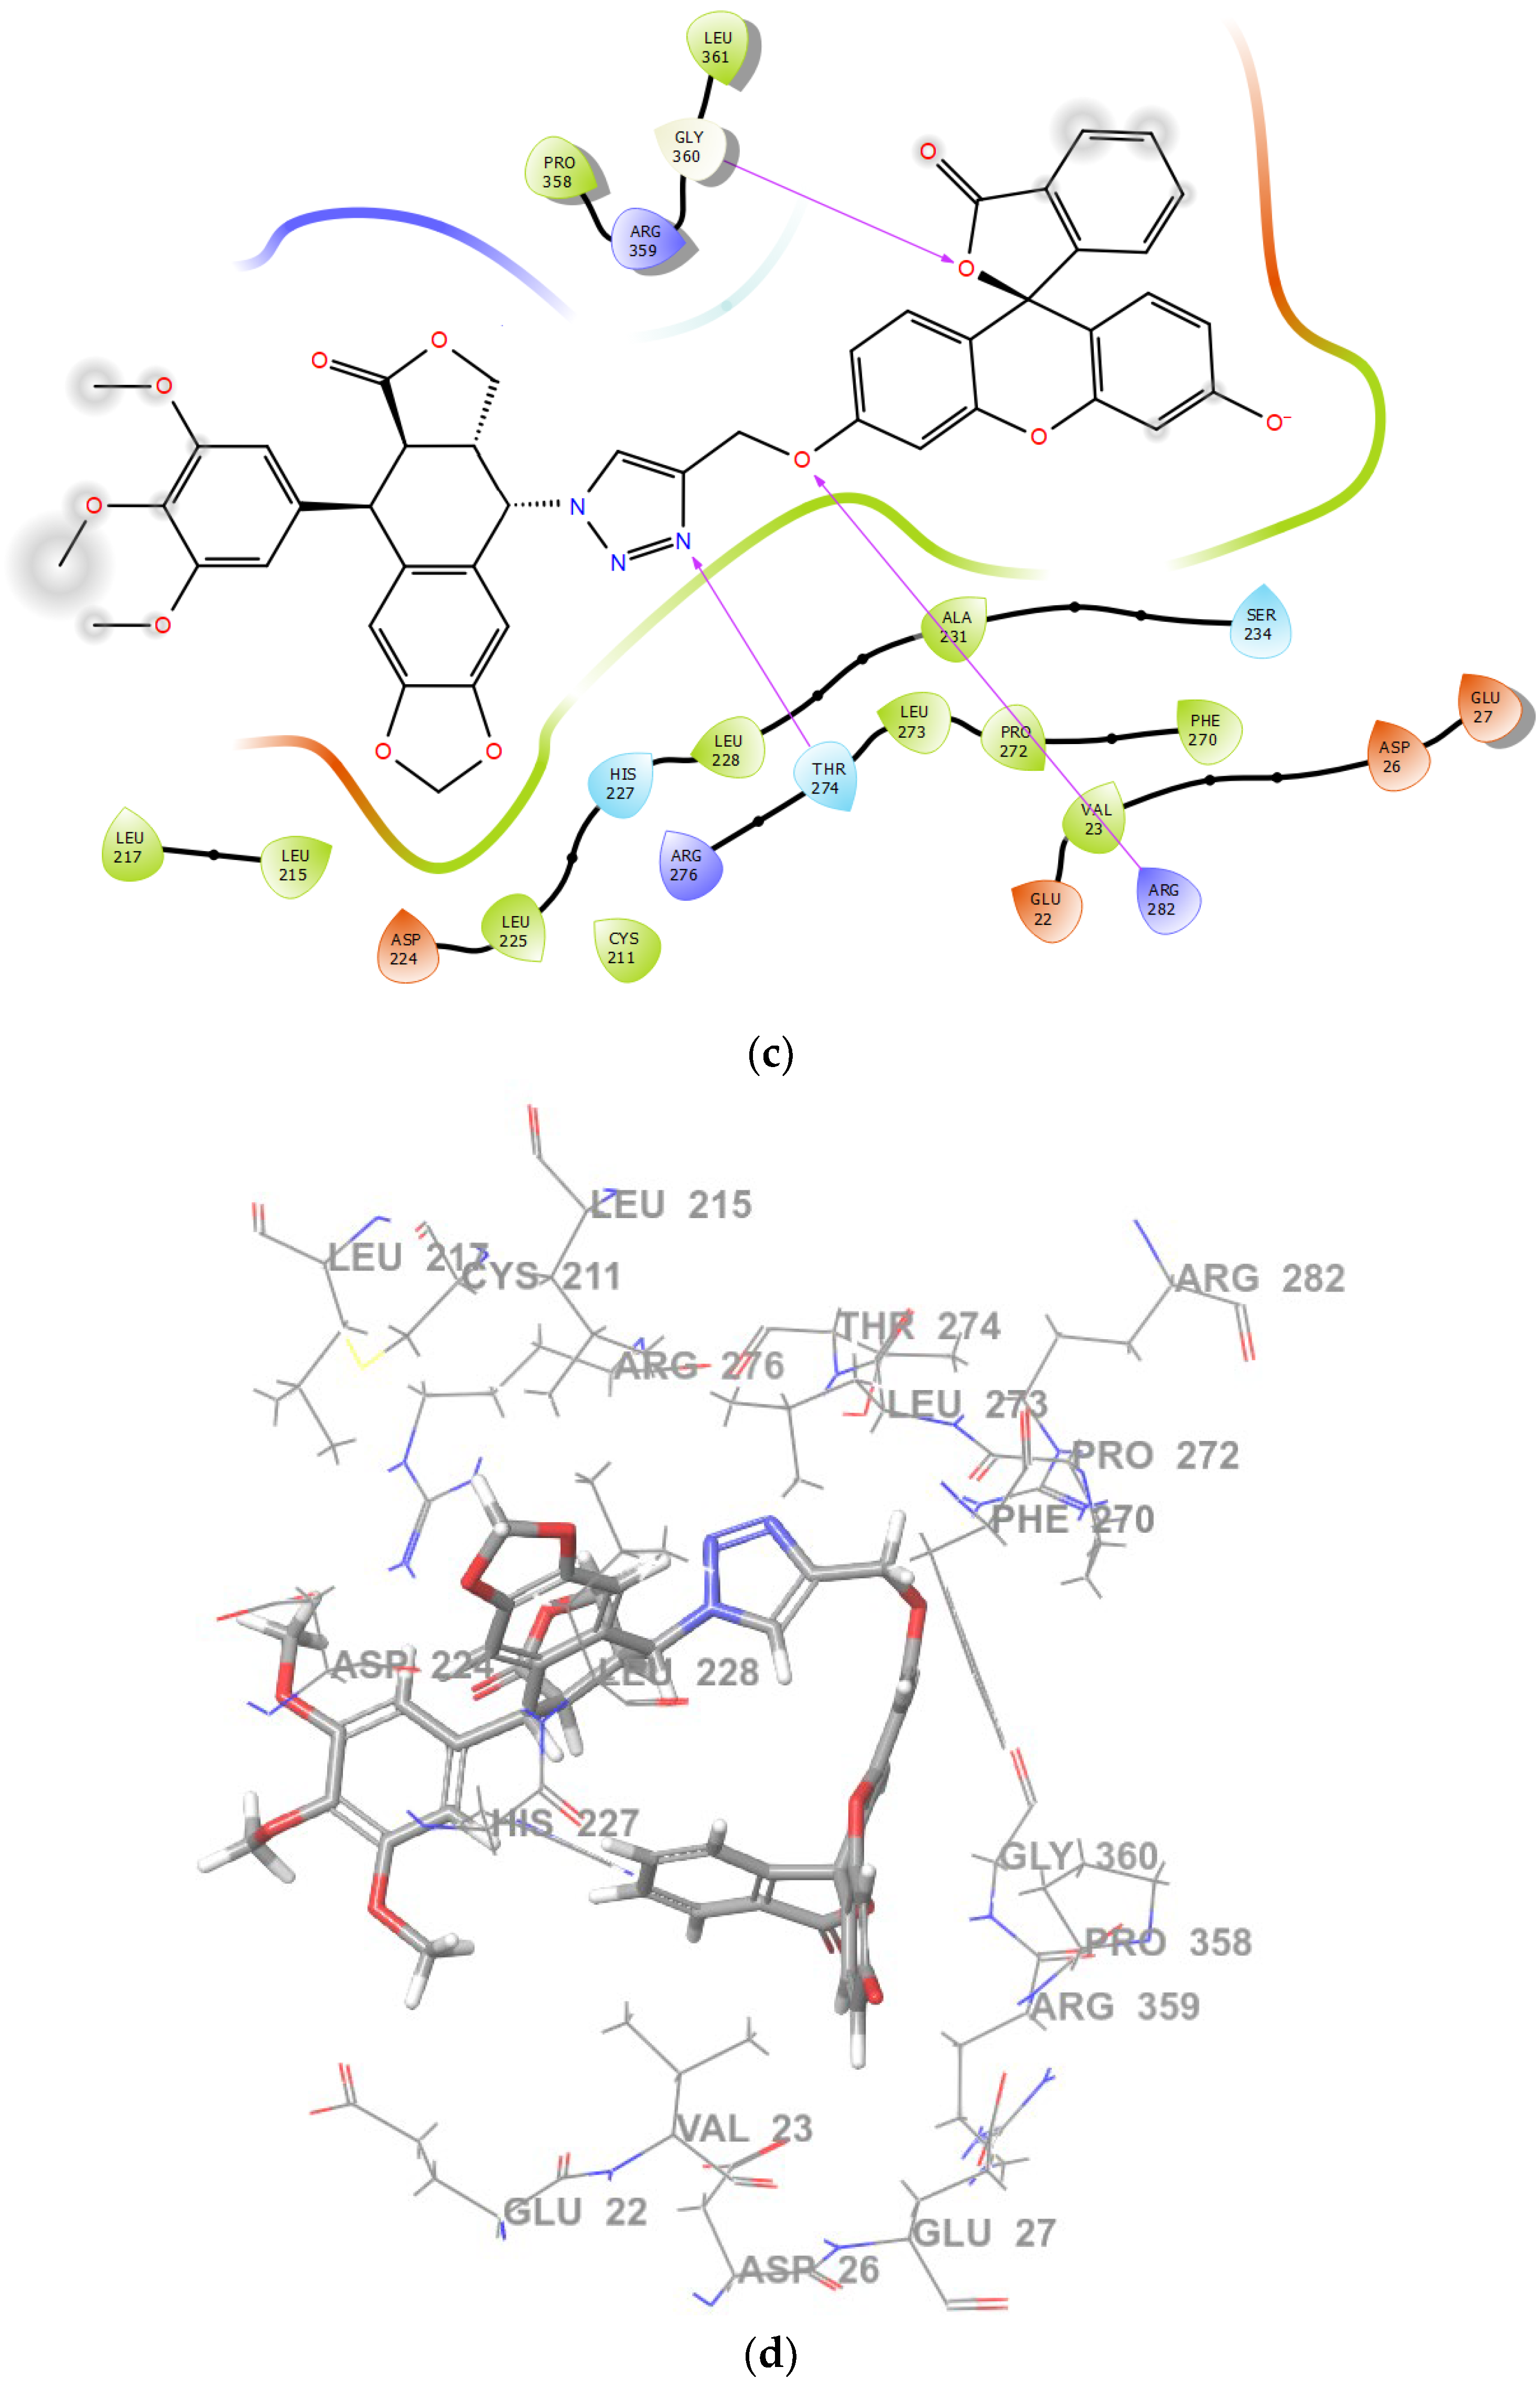
| 1TVK | PPT | −5.13944 | −47.1387 | ASN101, CYS241 |
| PPT-FL | −3.85146 | −51.9734 | THR274, ARG282, GLY360 | |
| 4O2B | PPT | −7.59811 | −15.5007 | THR274 |
| PPT-FL | * | * | * | |
| 3HKD | PPT | * | * | * |
| PPT-FL | * | * | * |
| PDB Refcode | Resolution [Å] | Ligand Present at the Binding Site | Location of the Binding Site |
|---|---|---|---|
| 1SA1 | 4.20 | Podophyllotoxin | Between α and β subunits, closer to β |
| 1TVK | 2.89 | Epothilone | β subunit, on the surface |
| 4O2B | 2.30 | Colchicine | Between α and β subunits, closer to β |
| 3HKD | 3.70 | (3Z,5S)-5-benzyl-3-[1-(phenylamino)ethylidene]pyrrolidine-2,4-dione | β subunit, inside |
| 1SA1 | 3HKC | 3HKD | 3HKE | 3N2G | 3N2K | 3UT5 | |
|---|---|---|---|---|---|---|---|
| 1SA1 | 0.186 | 1.748 | 2.081 | 1.579 | 1.843 | 0.983 | 1.125 |
| 3HKC | 0.874 | 0.218 | 1.482 | 2.210 | 1.645 | 0.598 | 0.874 |
| 3HKD | 0.596 | 0.874 | 0.235 | 1.764 | 1.711 | 0.784 | 0.986 |
| 3HKE | 1.417 | 1.742 | 1.784 | 0.342 | 1.832 | 0.899 | 0.763 |
| 3N2G | 2.081 | 1.385 | 1.463 | 2.145 | 0.217 | 0.698 | 0.984 |
| 3N2K | 1.573 | 1.428 | 1.748 | 1.125 | 0.874 | 0.213 | 0.892 |
| 3UT5 | 0.421 | 1.859 | 1.984 | 1.854 | 1.461 | 1.123 | 0.329 |
Disclaimer/Publisher’s Note: The statements, opinions and data contained in all publications are solely those of the individual author(s) and contributor(s) and not of MDPI and/or the editor(s). MDPI and/or the editor(s) disclaim responsibility for any injury to people or property resulting from any ideas, methods, instructions or products referred to in the content. |
© 2024 by the authors. Licensee MDPI, Basel, Switzerland. This article is an open access article distributed under the terms and conditions of the Creative Commons Attribution (CC BY) license (https://creativecommons.org/licenses/by/4.0/).
Share and Cite
Strus, P.; Sadowski, K.; Kostro, J.; Szczepankiewicz, A.A.; Nieznańska, H.; Niedzielska, M.; Zlobin, A.; Nawar Ra’idah, P.; Molęda, Z.; Szawkało, J.; et al. Cellular Distribution and Ultrastructural Changes in HaCaT Cells, Induced by Podophyllotoxin and Its Novel Fluorescent Derivative, Supported by the Molecular Docking Studies. Int. J. Mol. Sci. 2024, 25, 5948. https://doi.org/10.3390/ijms25115948
Strus P, Sadowski K, Kostro J, Szczepankiewicz AA, Nieznańska H, Niedzielska M, Zlobin A, Nawar Ra’idah P, Molęda Z, Szawkało J, et al. Cellular Distribution and Ultrastructural Changes in HaCaT Cells, Induced by Podophyllotoxin and Its Novel Fluorescent Derivative, Supported by the Molecular Docking Studies. International Journal of Molecular Sciences. 2024; 25(11):5948. https://doi.org/10.3390/ijms25115948
Chicago/Turabian StyleStrus, Piotr, Karol Sadowski, Julia Kostro, Andrzej Antoni Szczepankiewicz, Hanna Nieznańska, Magdalena Niedzielska, Andrei Zlobin, Pramukti Nawar Ra’idah, Zuzanna Molęda, Joanna Szawkało, and et al. 2024. "Cellular Distribution and Ultrastructural Changes in HaCaT Cells, Induced by Podophyllotoxin and Its Novel Fluorescent Derivative, Supported by the Molecular Docking Studies" International Journal of Molecular Sciences 25, no. 11: 5948. https://doi.org/10.3390/ijms25115948
APA StyleStrus, P., Sadowski, K., Kostro, J., Szczepankiewicz, A. A., Nieznańska, H., Niedzielska, M., Zlobin, A., Nawar Ra’idah, P., Molęda, Z., Szawkało, J., Czarnocki, Z., Wójcik, C., Szeleszczuk, Ł., & Młynarczuk-Biały, I. (2024). Cellular Distribution and Ultrastructural Changes in HaCaT Cells, Induced by Podophyllotoxin and Its Novel Fluorescent Derivative, Supported by the Molecular Docking Studies. International Journal of Molecular Sciences, 25(11), 5948. https://doi.org/10.3390/ijms25115948