
Robust Photocatalytic MICROSCAFS® with Interconnected Macropores for Sustainable Solar-Driven Water Purification

 ,
,  , ,
, ,  and
and 
Abstract
:
1. Introduction
2. Results and Discussion
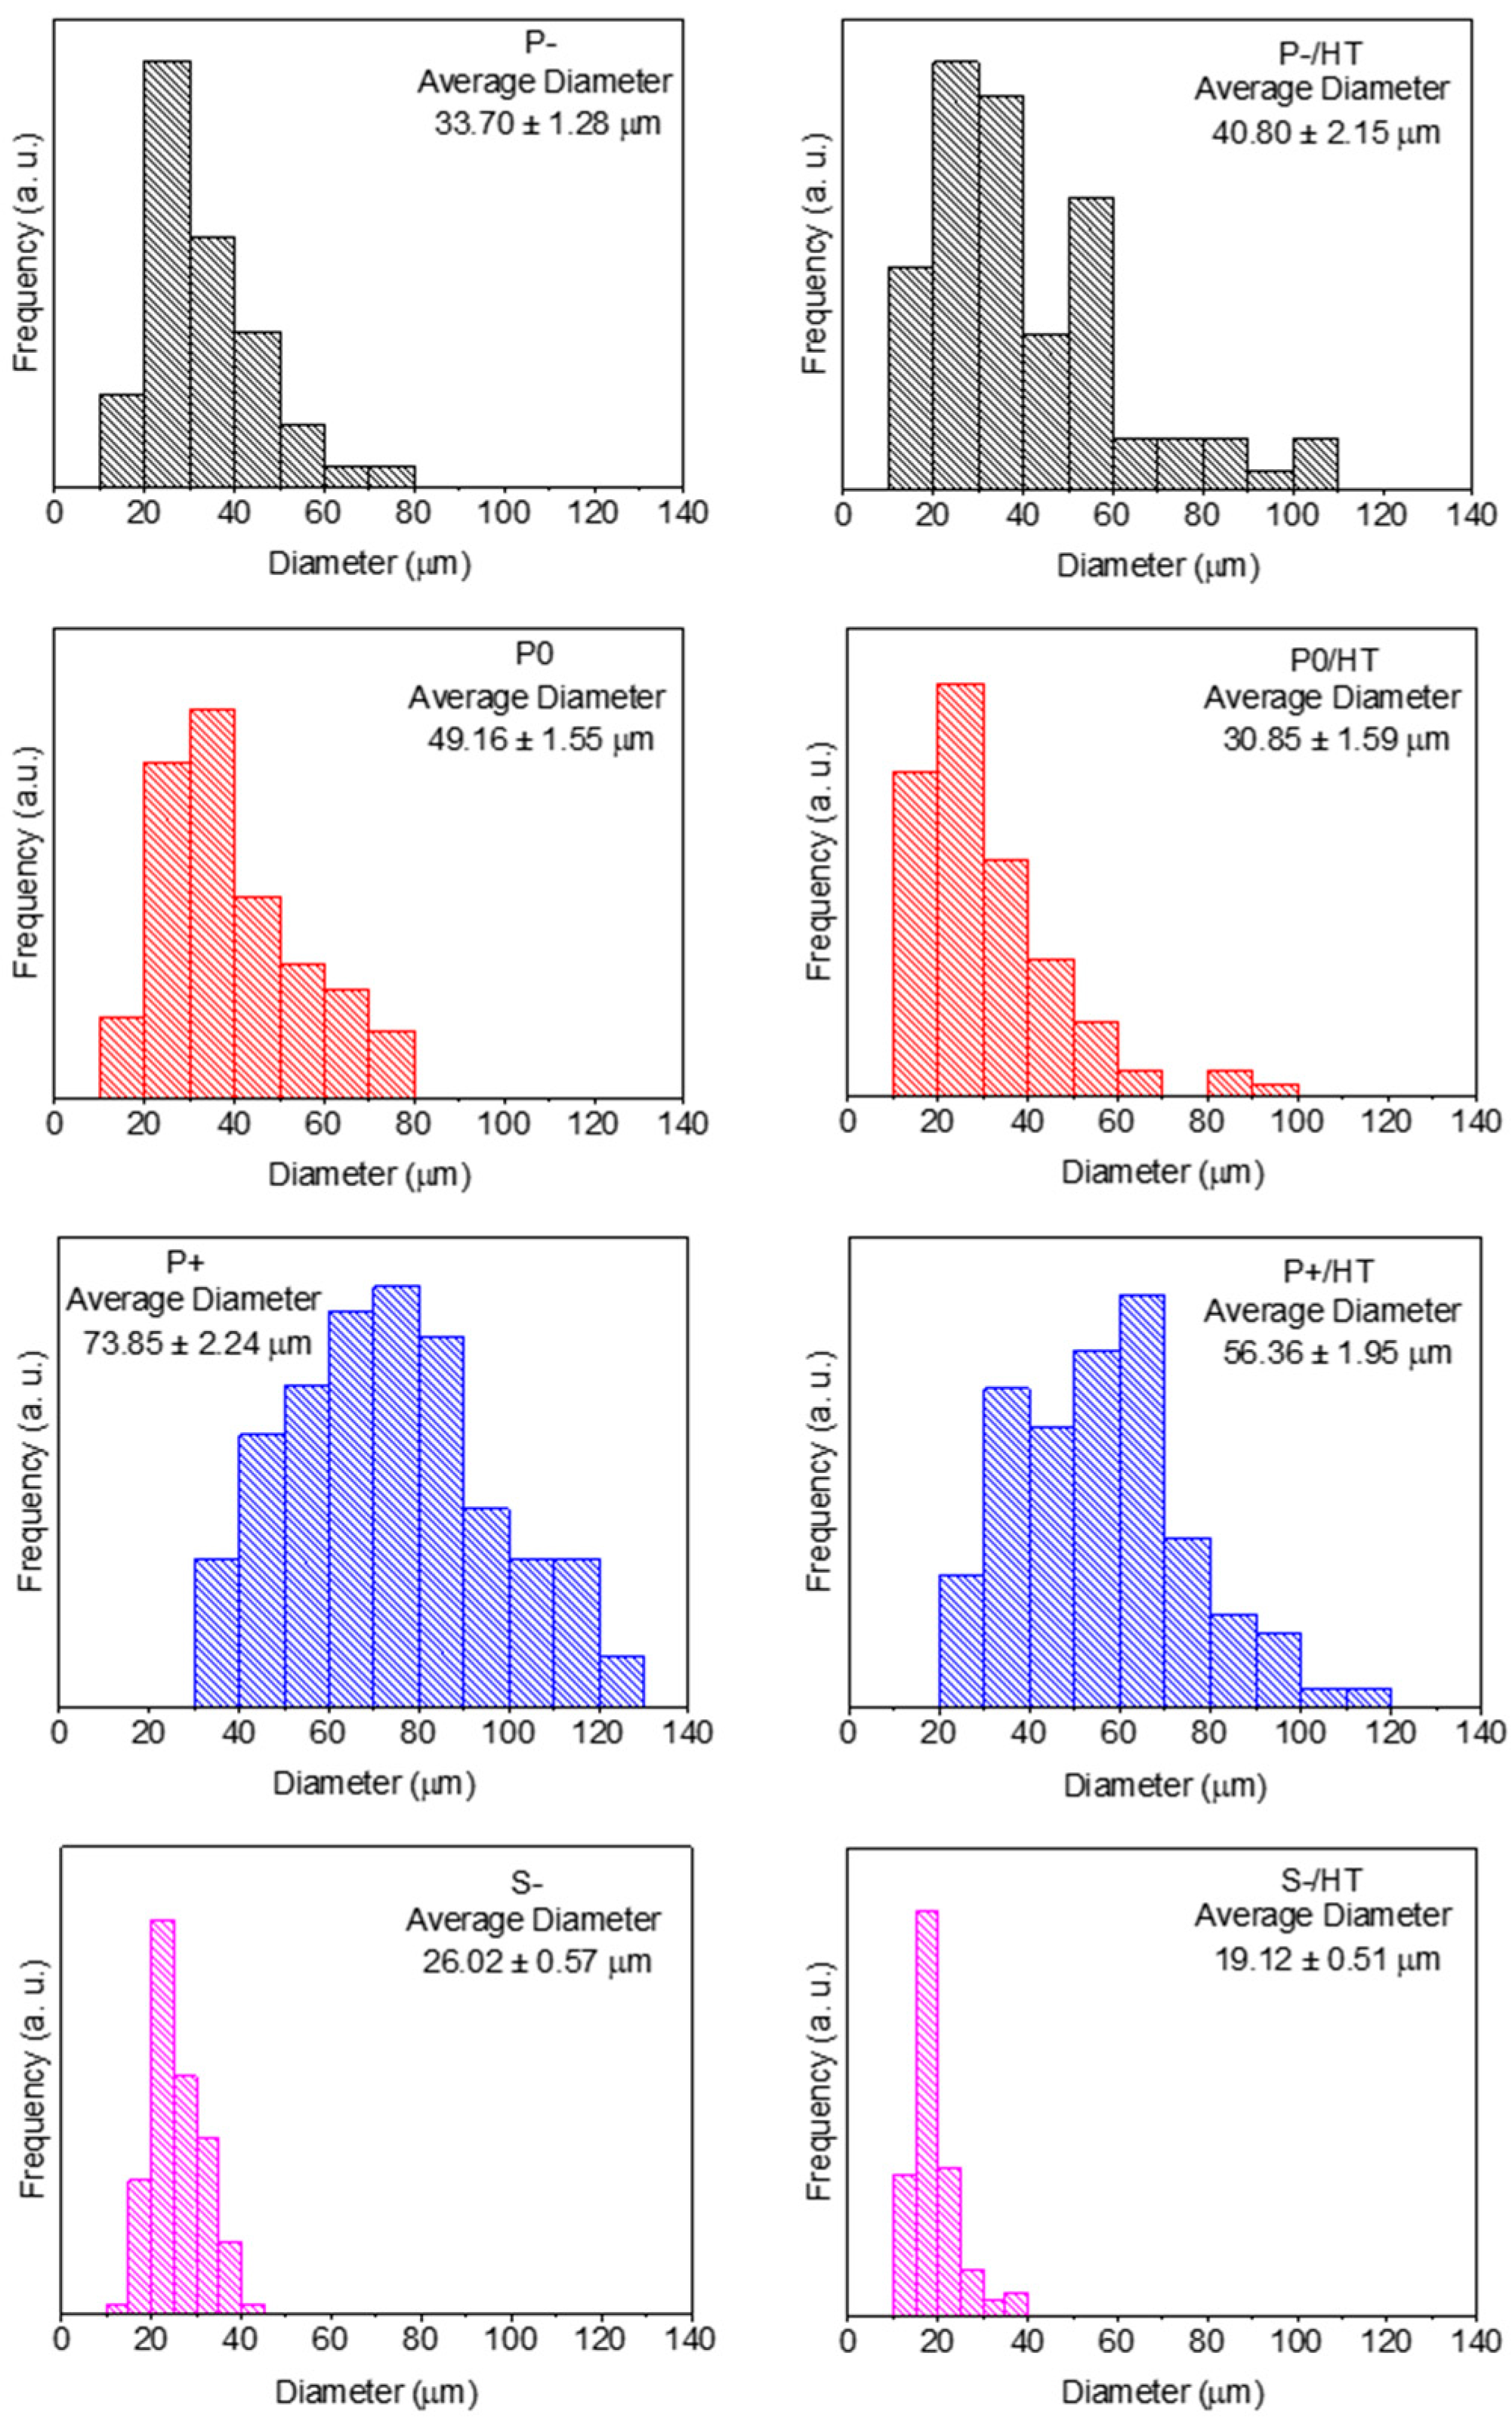
2.1. Characterization of the MICROSCAFS® before and after Heat Treatment and Photocatalyst (P25 TiO2 NPs) Loading
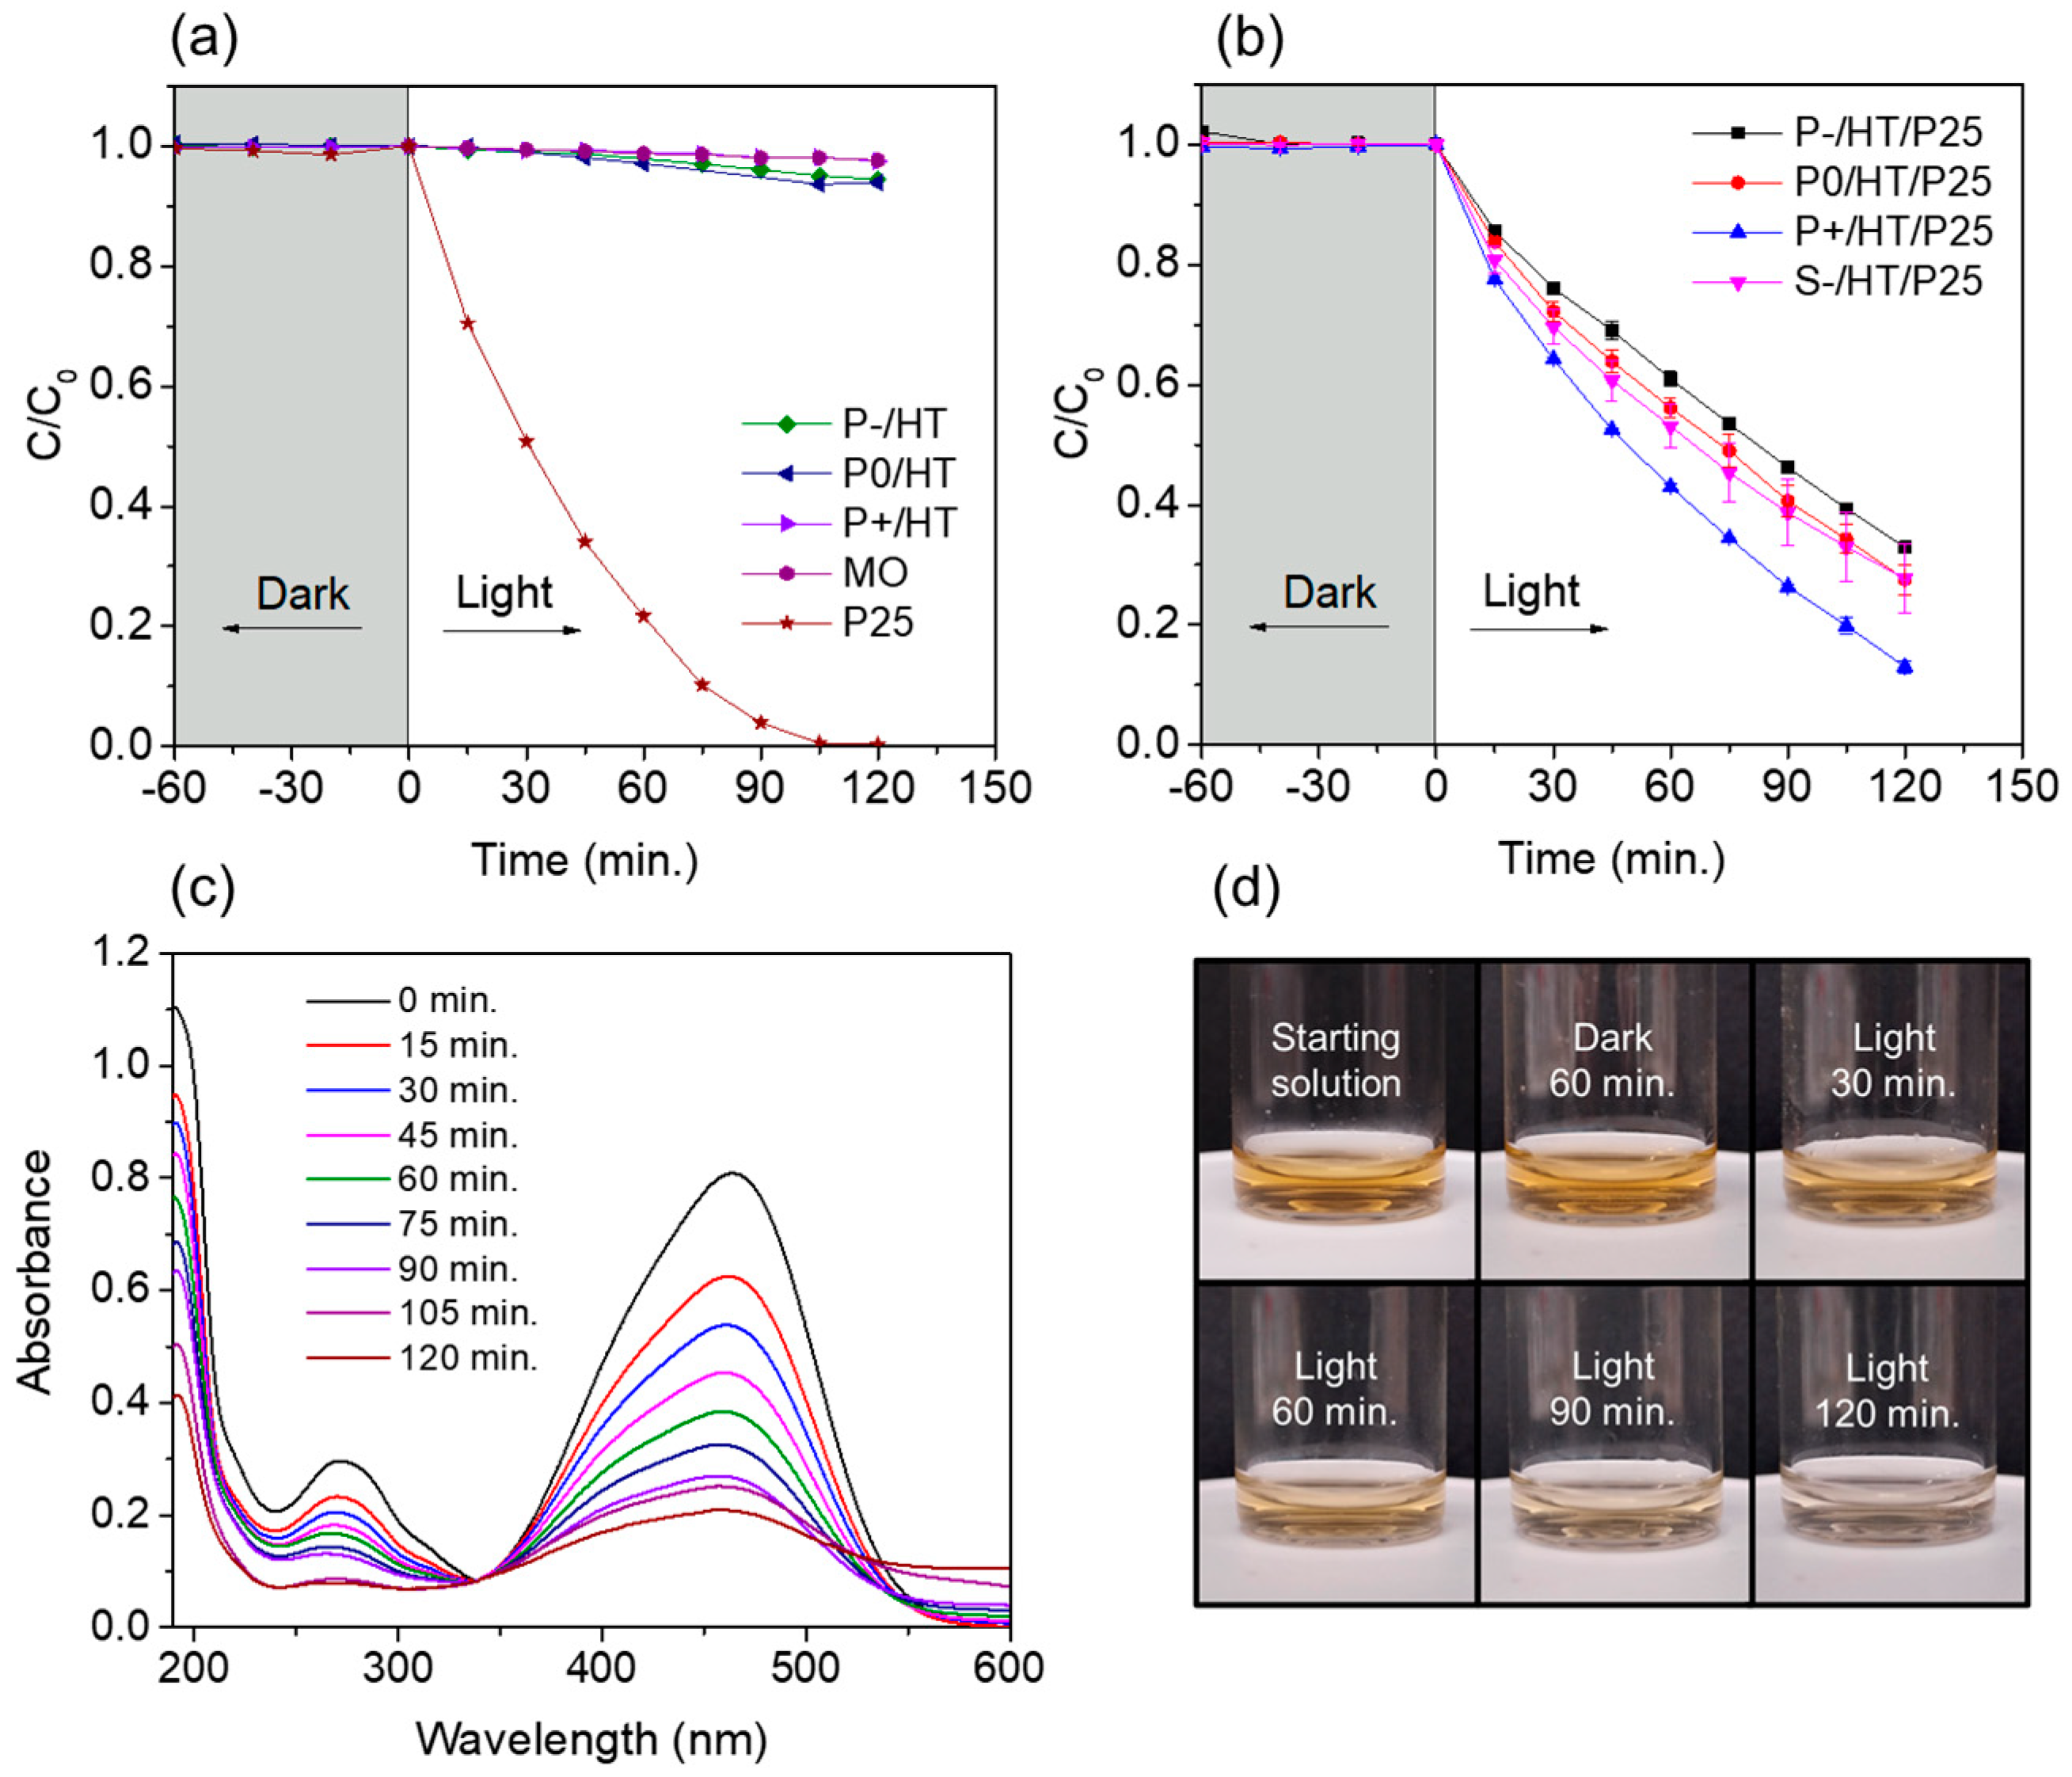
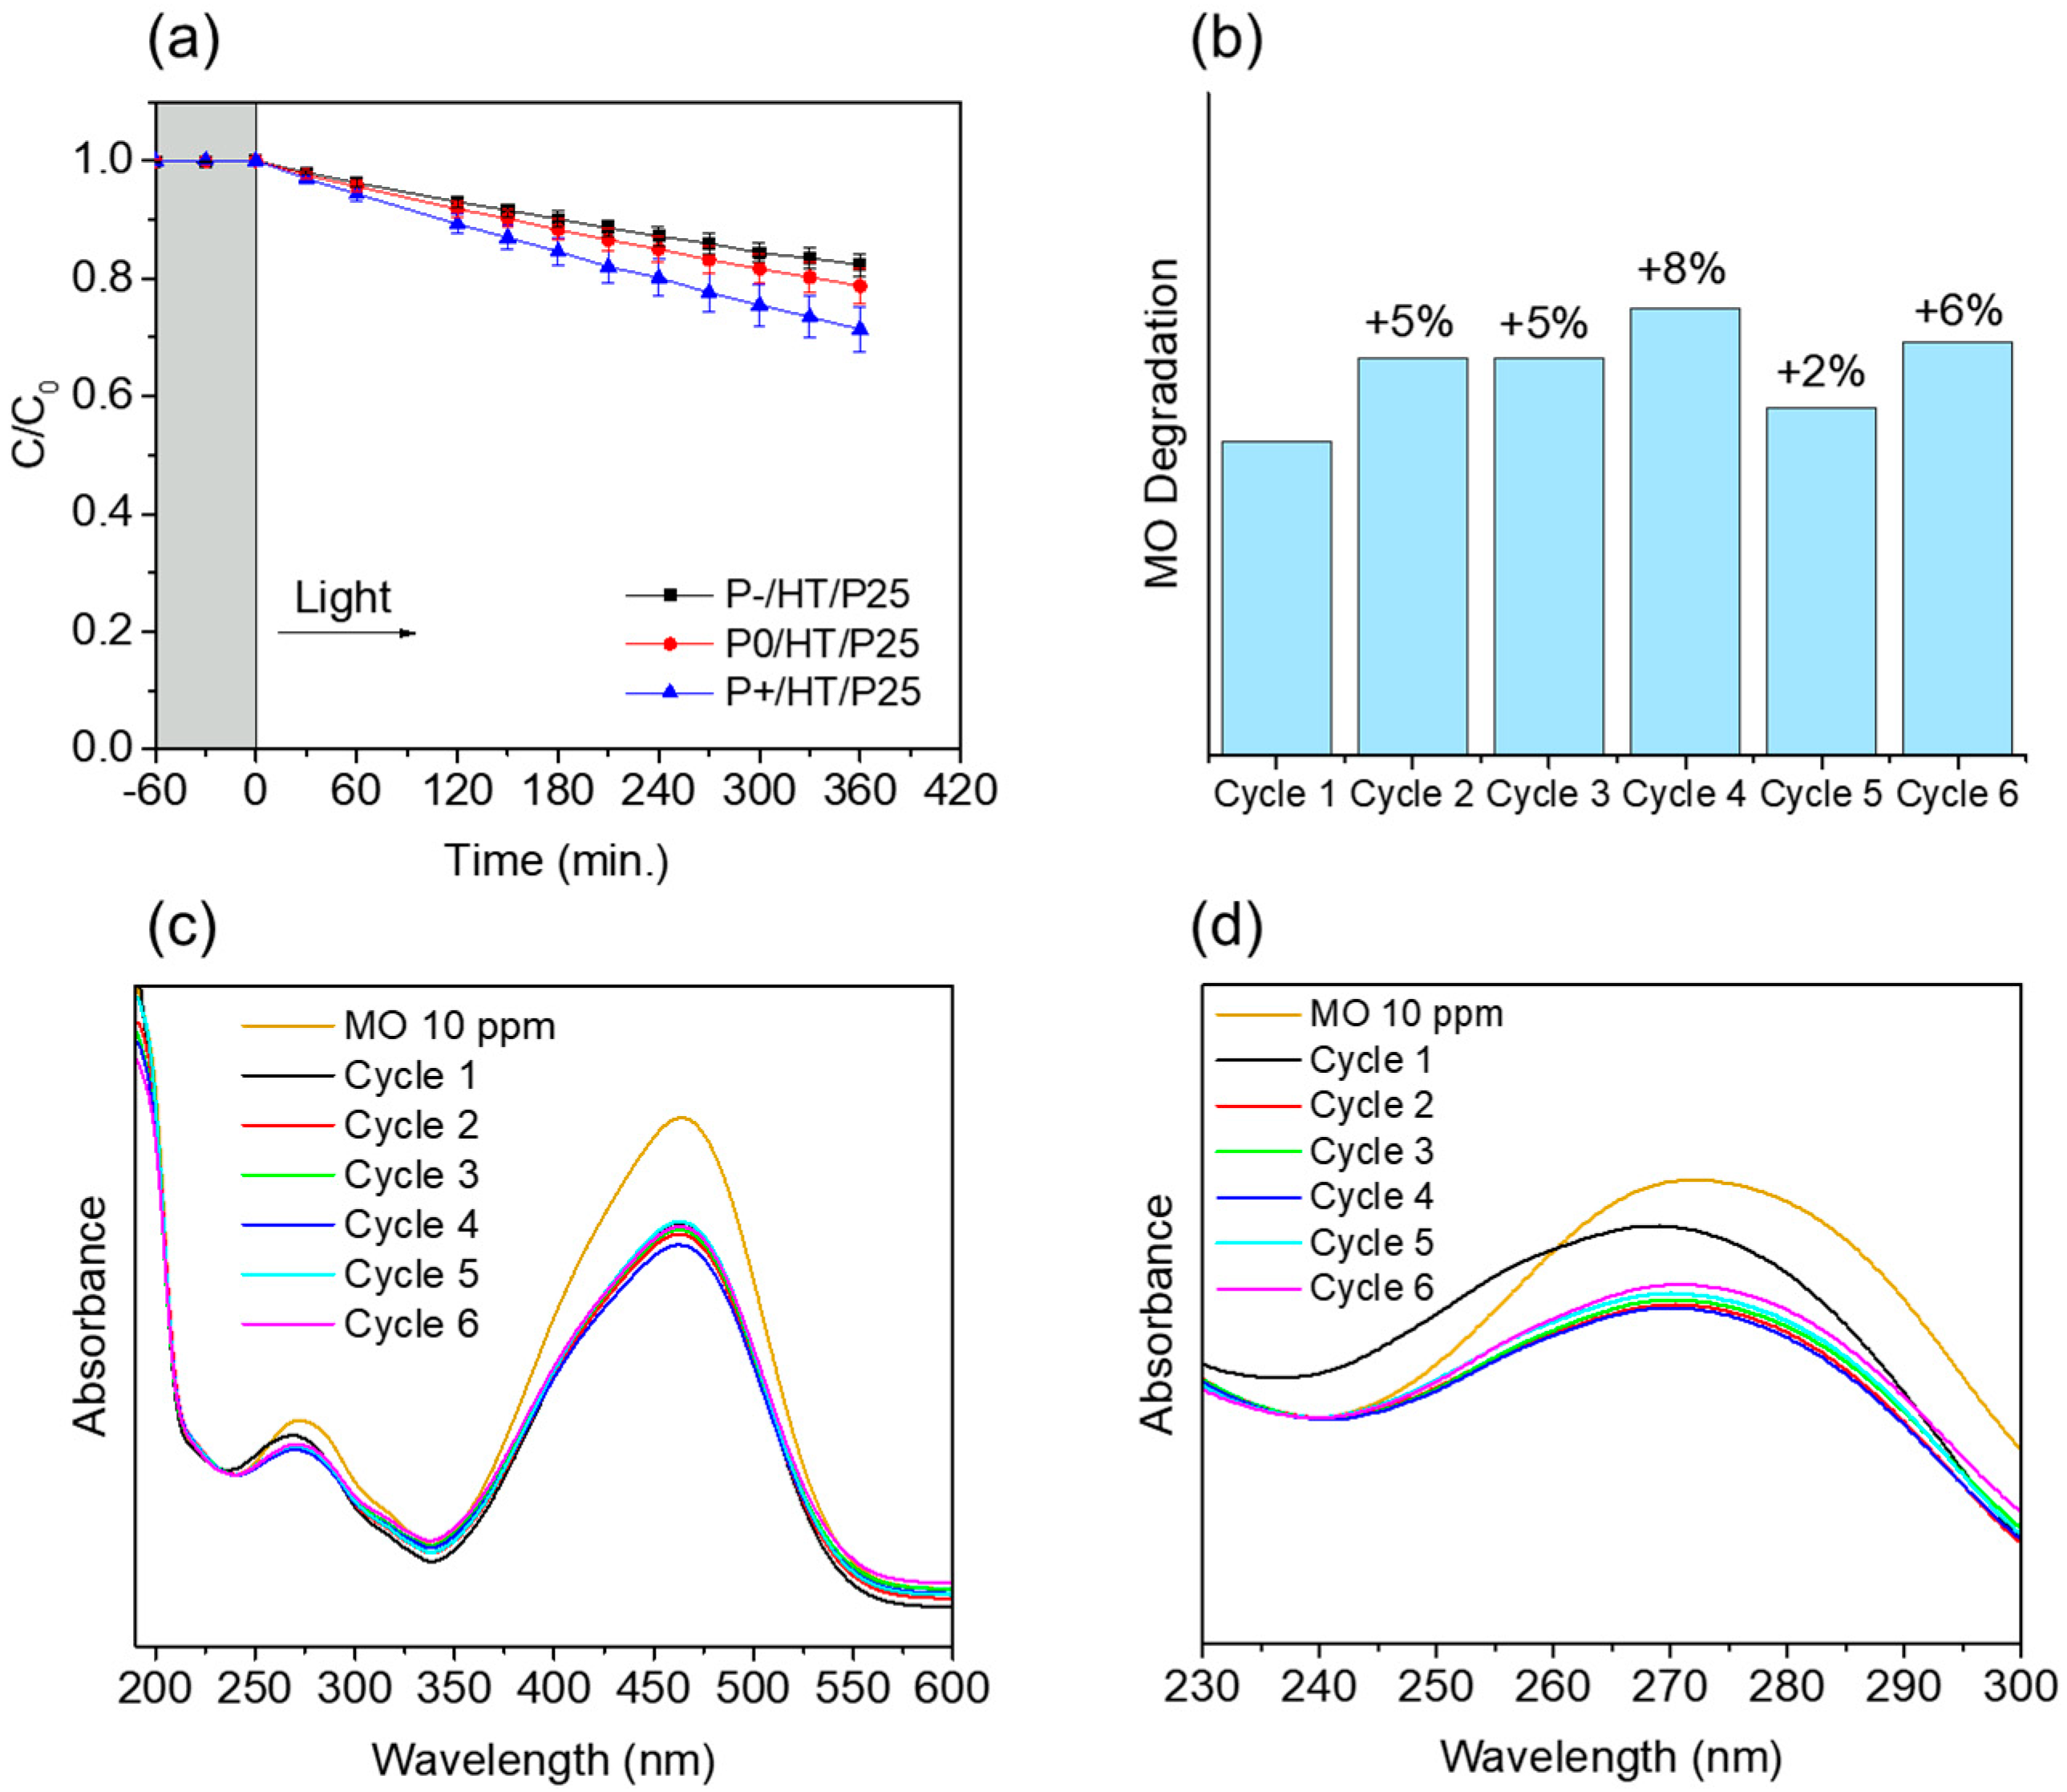
2.2. Photocatalytic Studies on the P25 TiO2 NPs-Loaded MICROSCAFS®
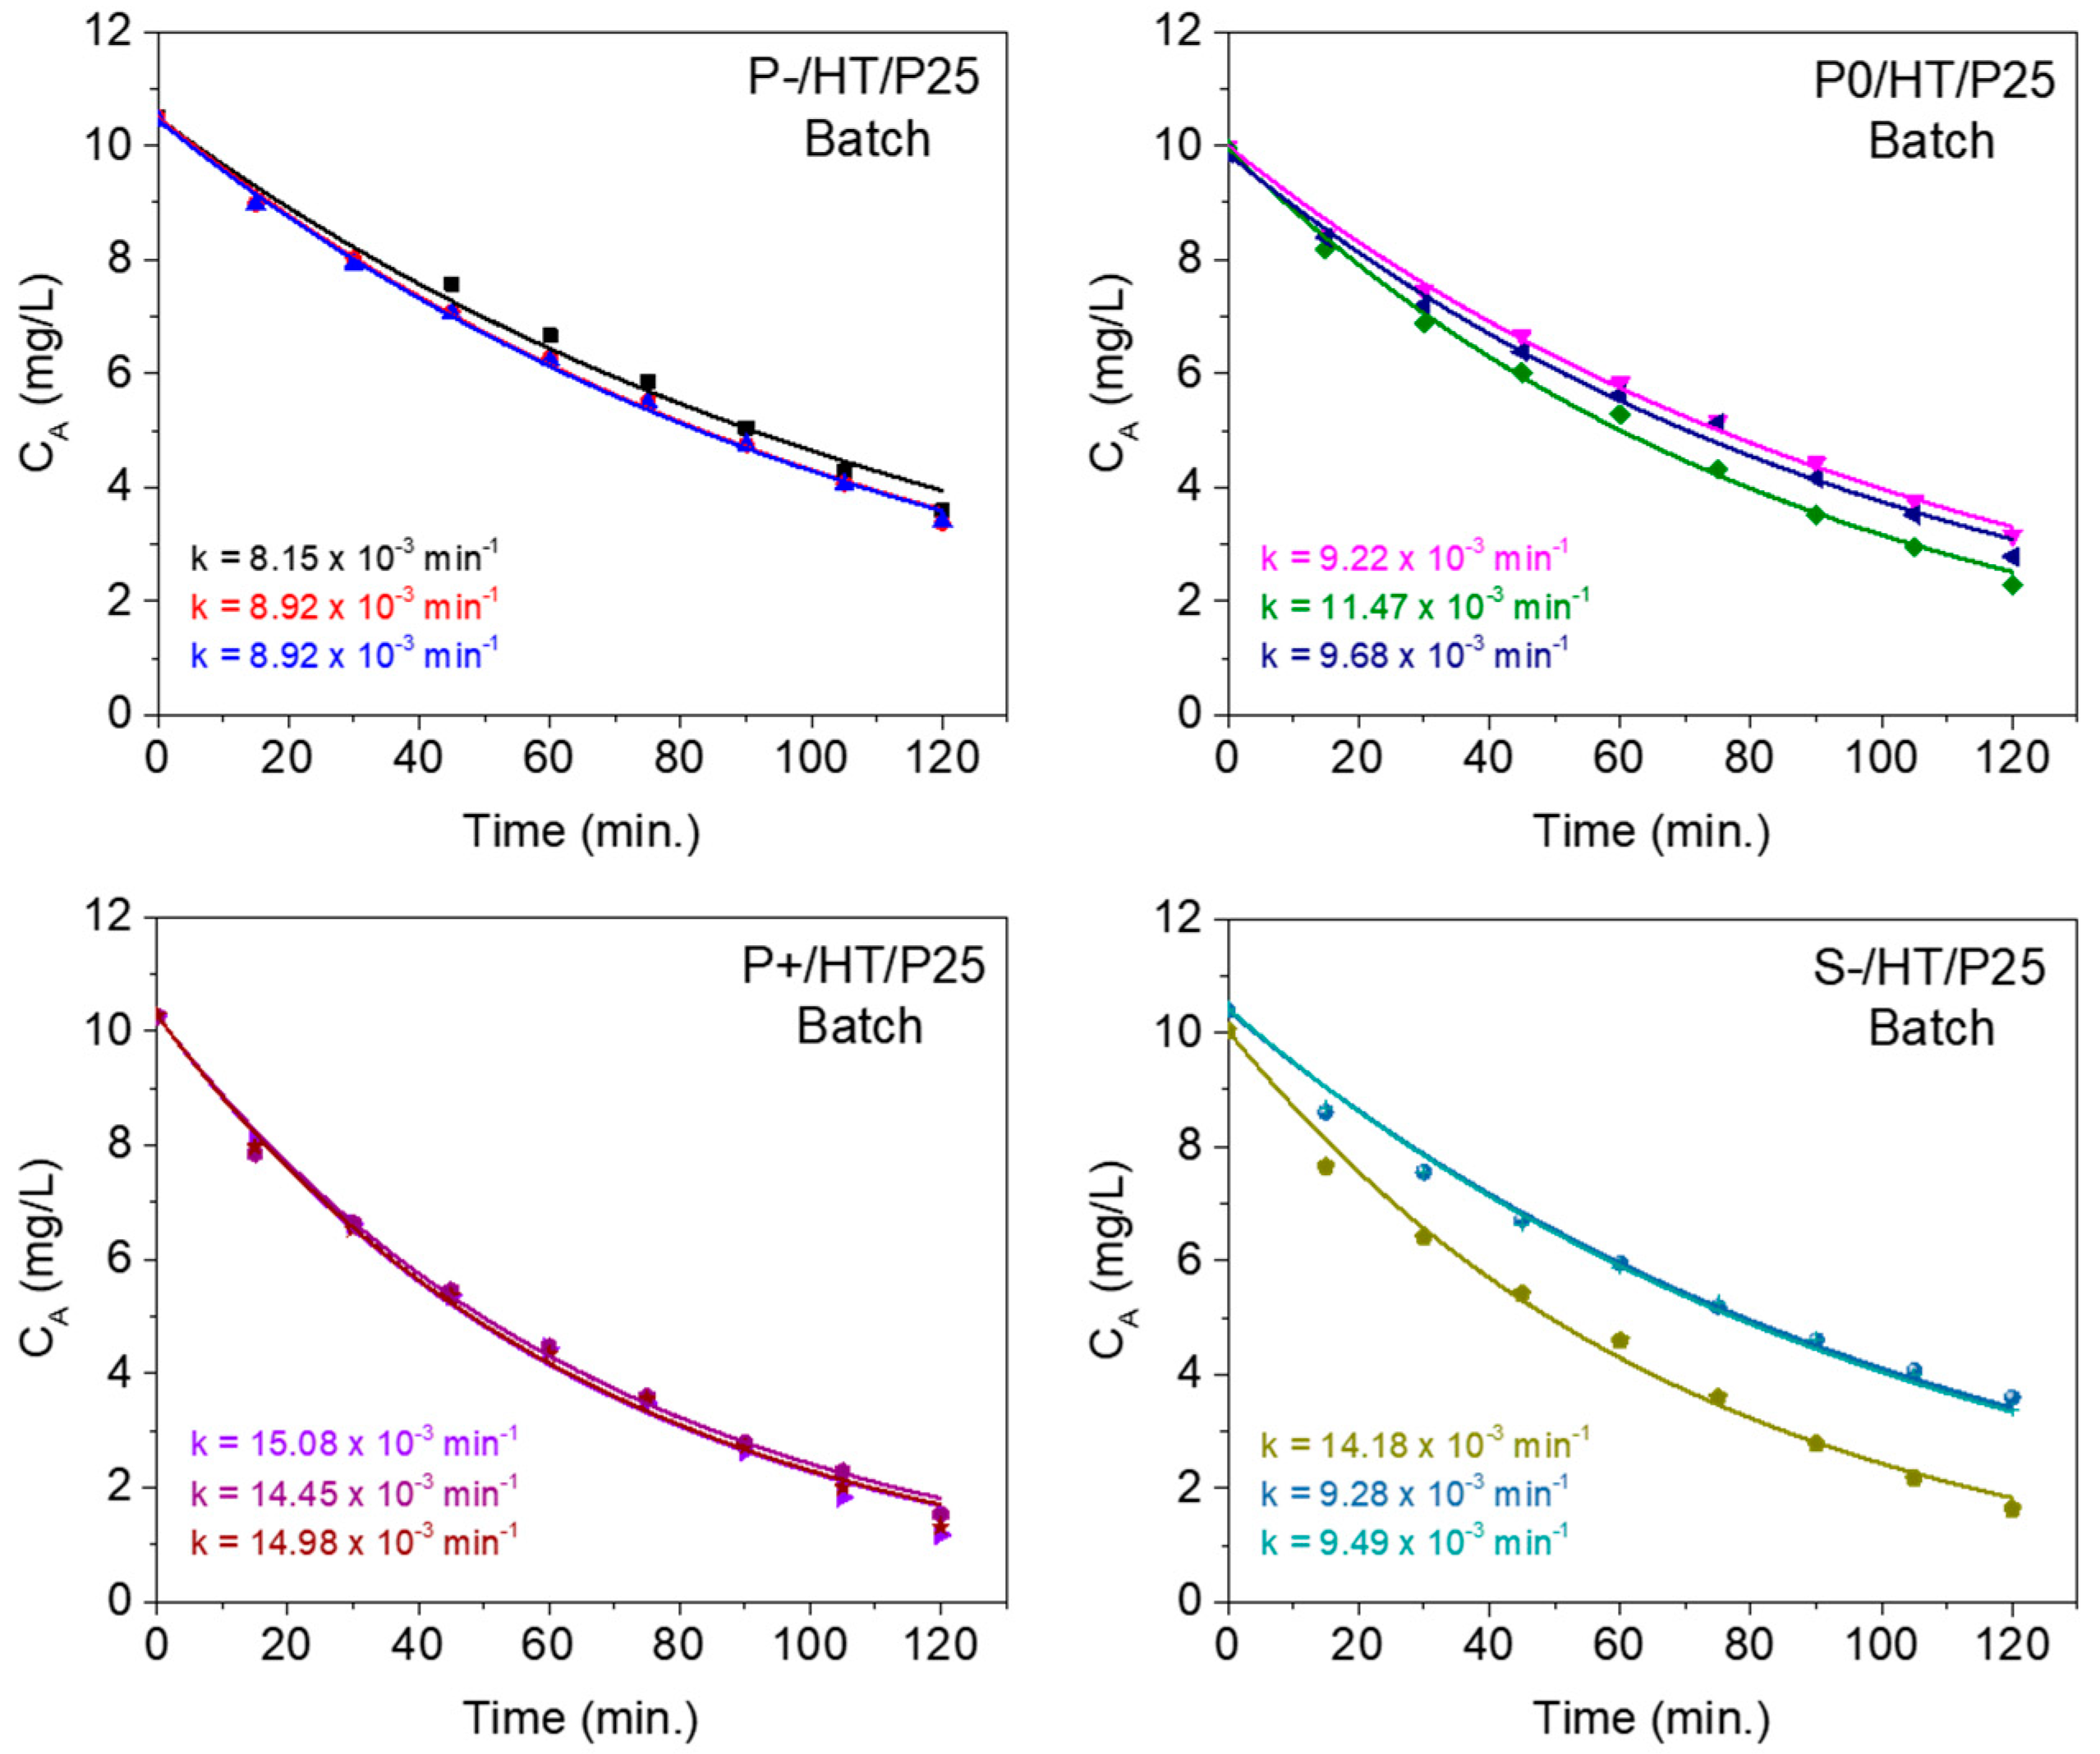
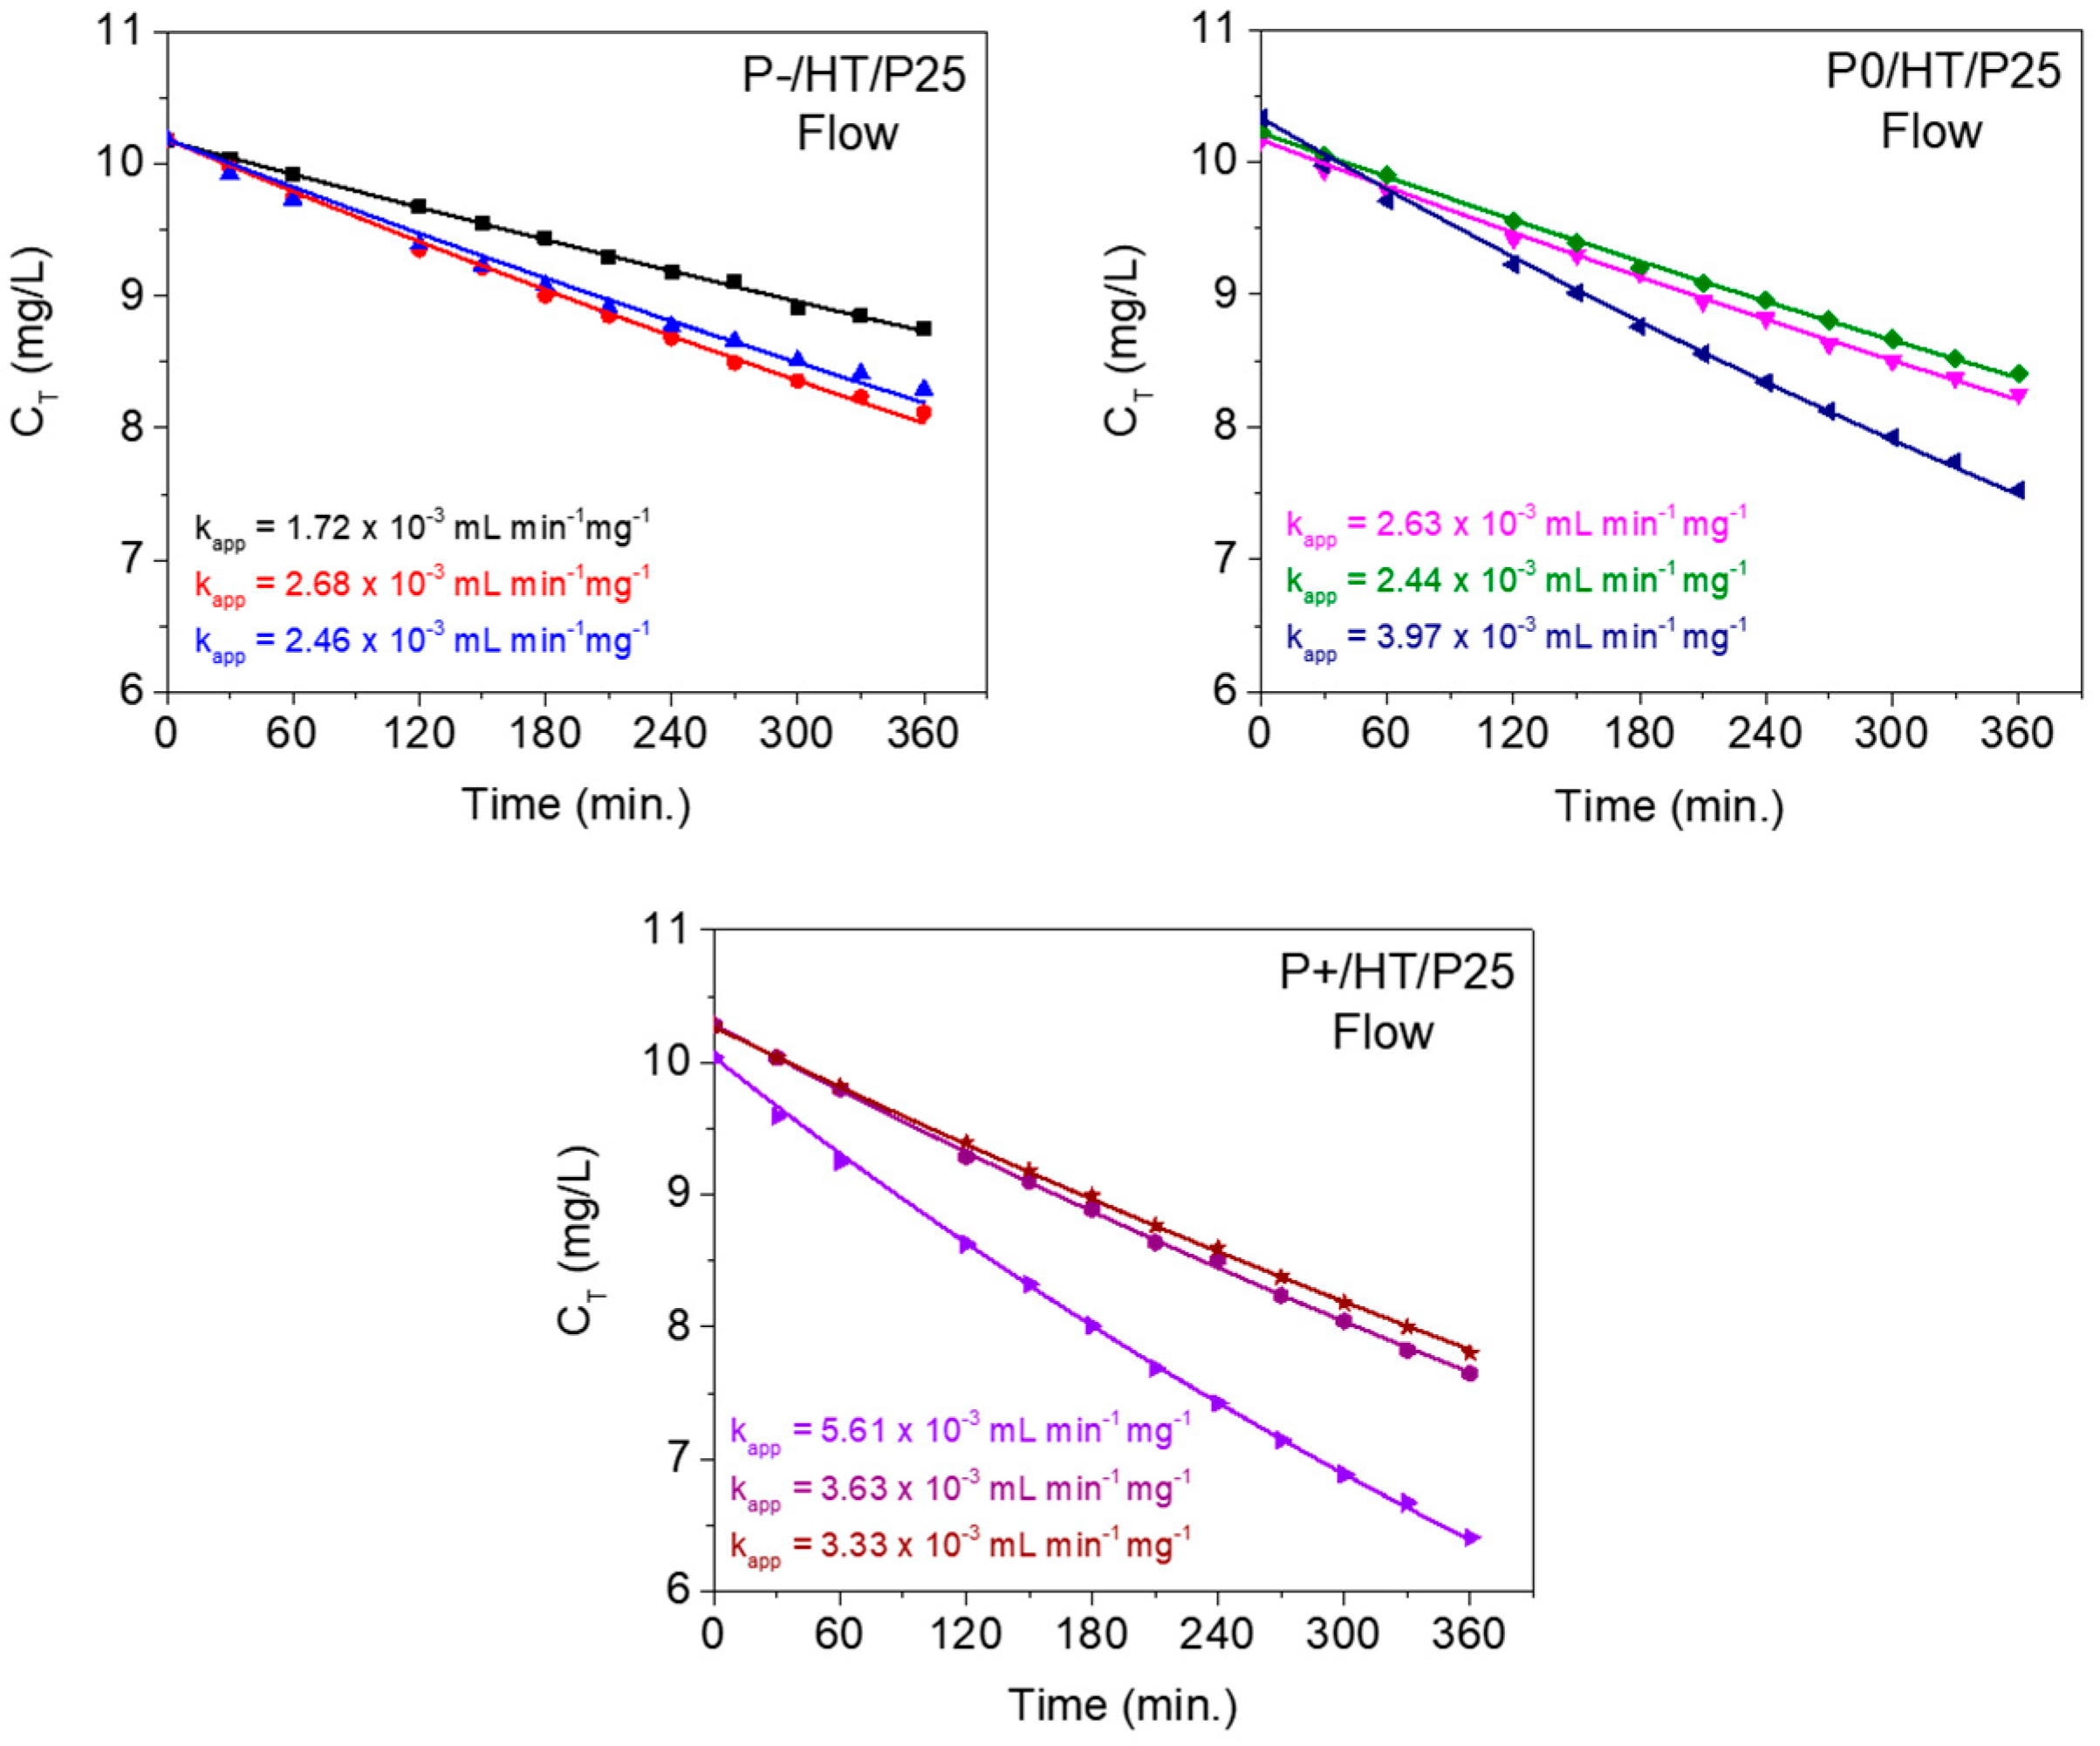
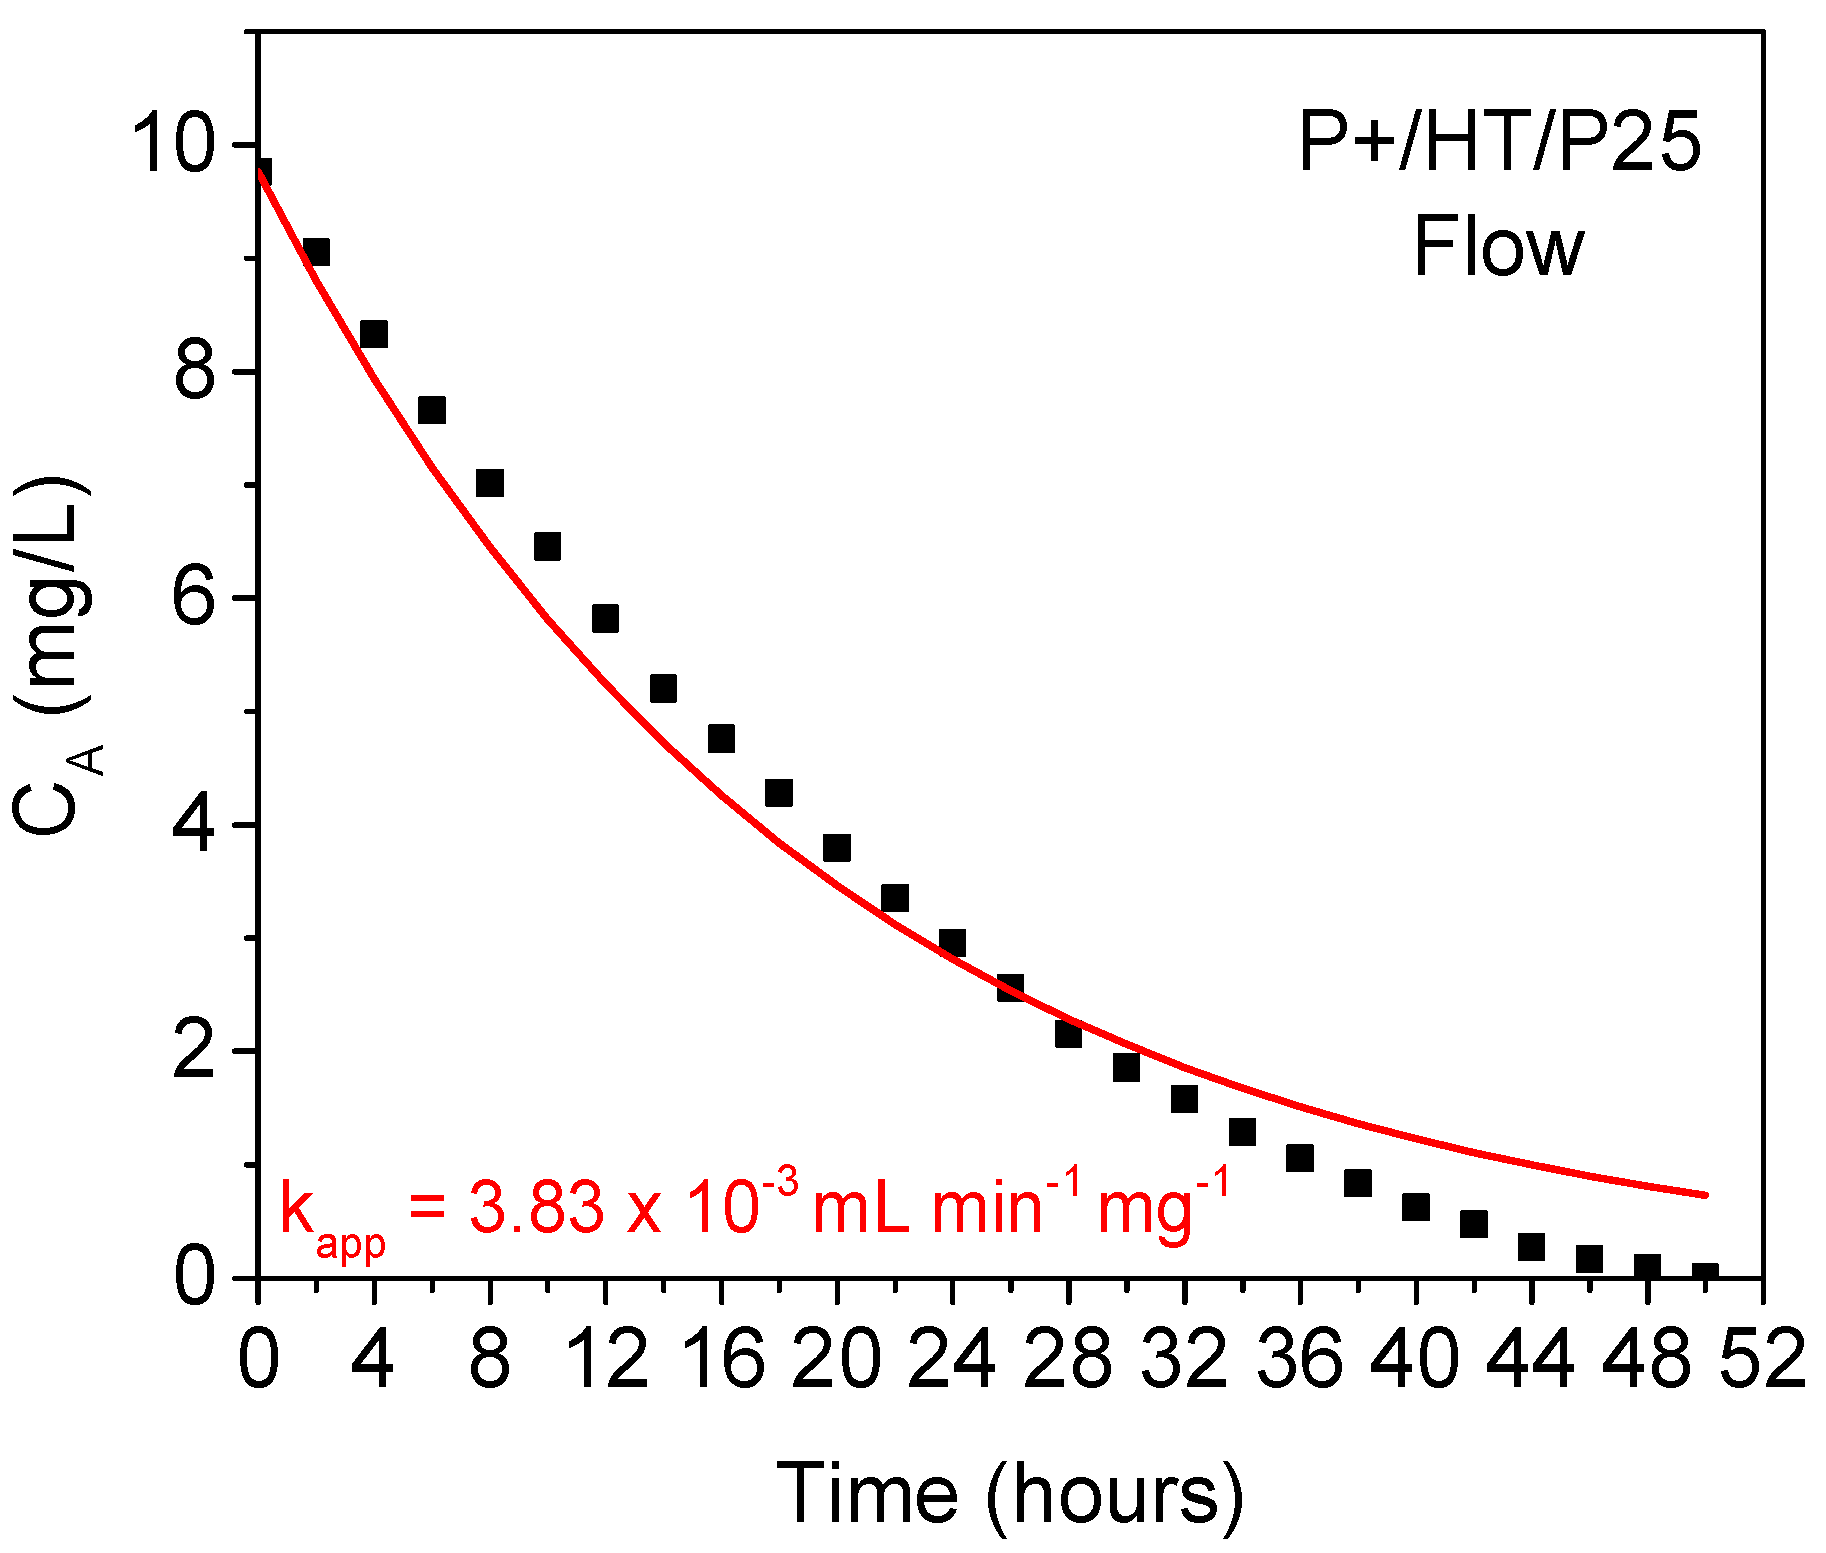
2.3. Kinetics Studies
2.4. Study of the By-Products from Photocatalytic MO Degradation
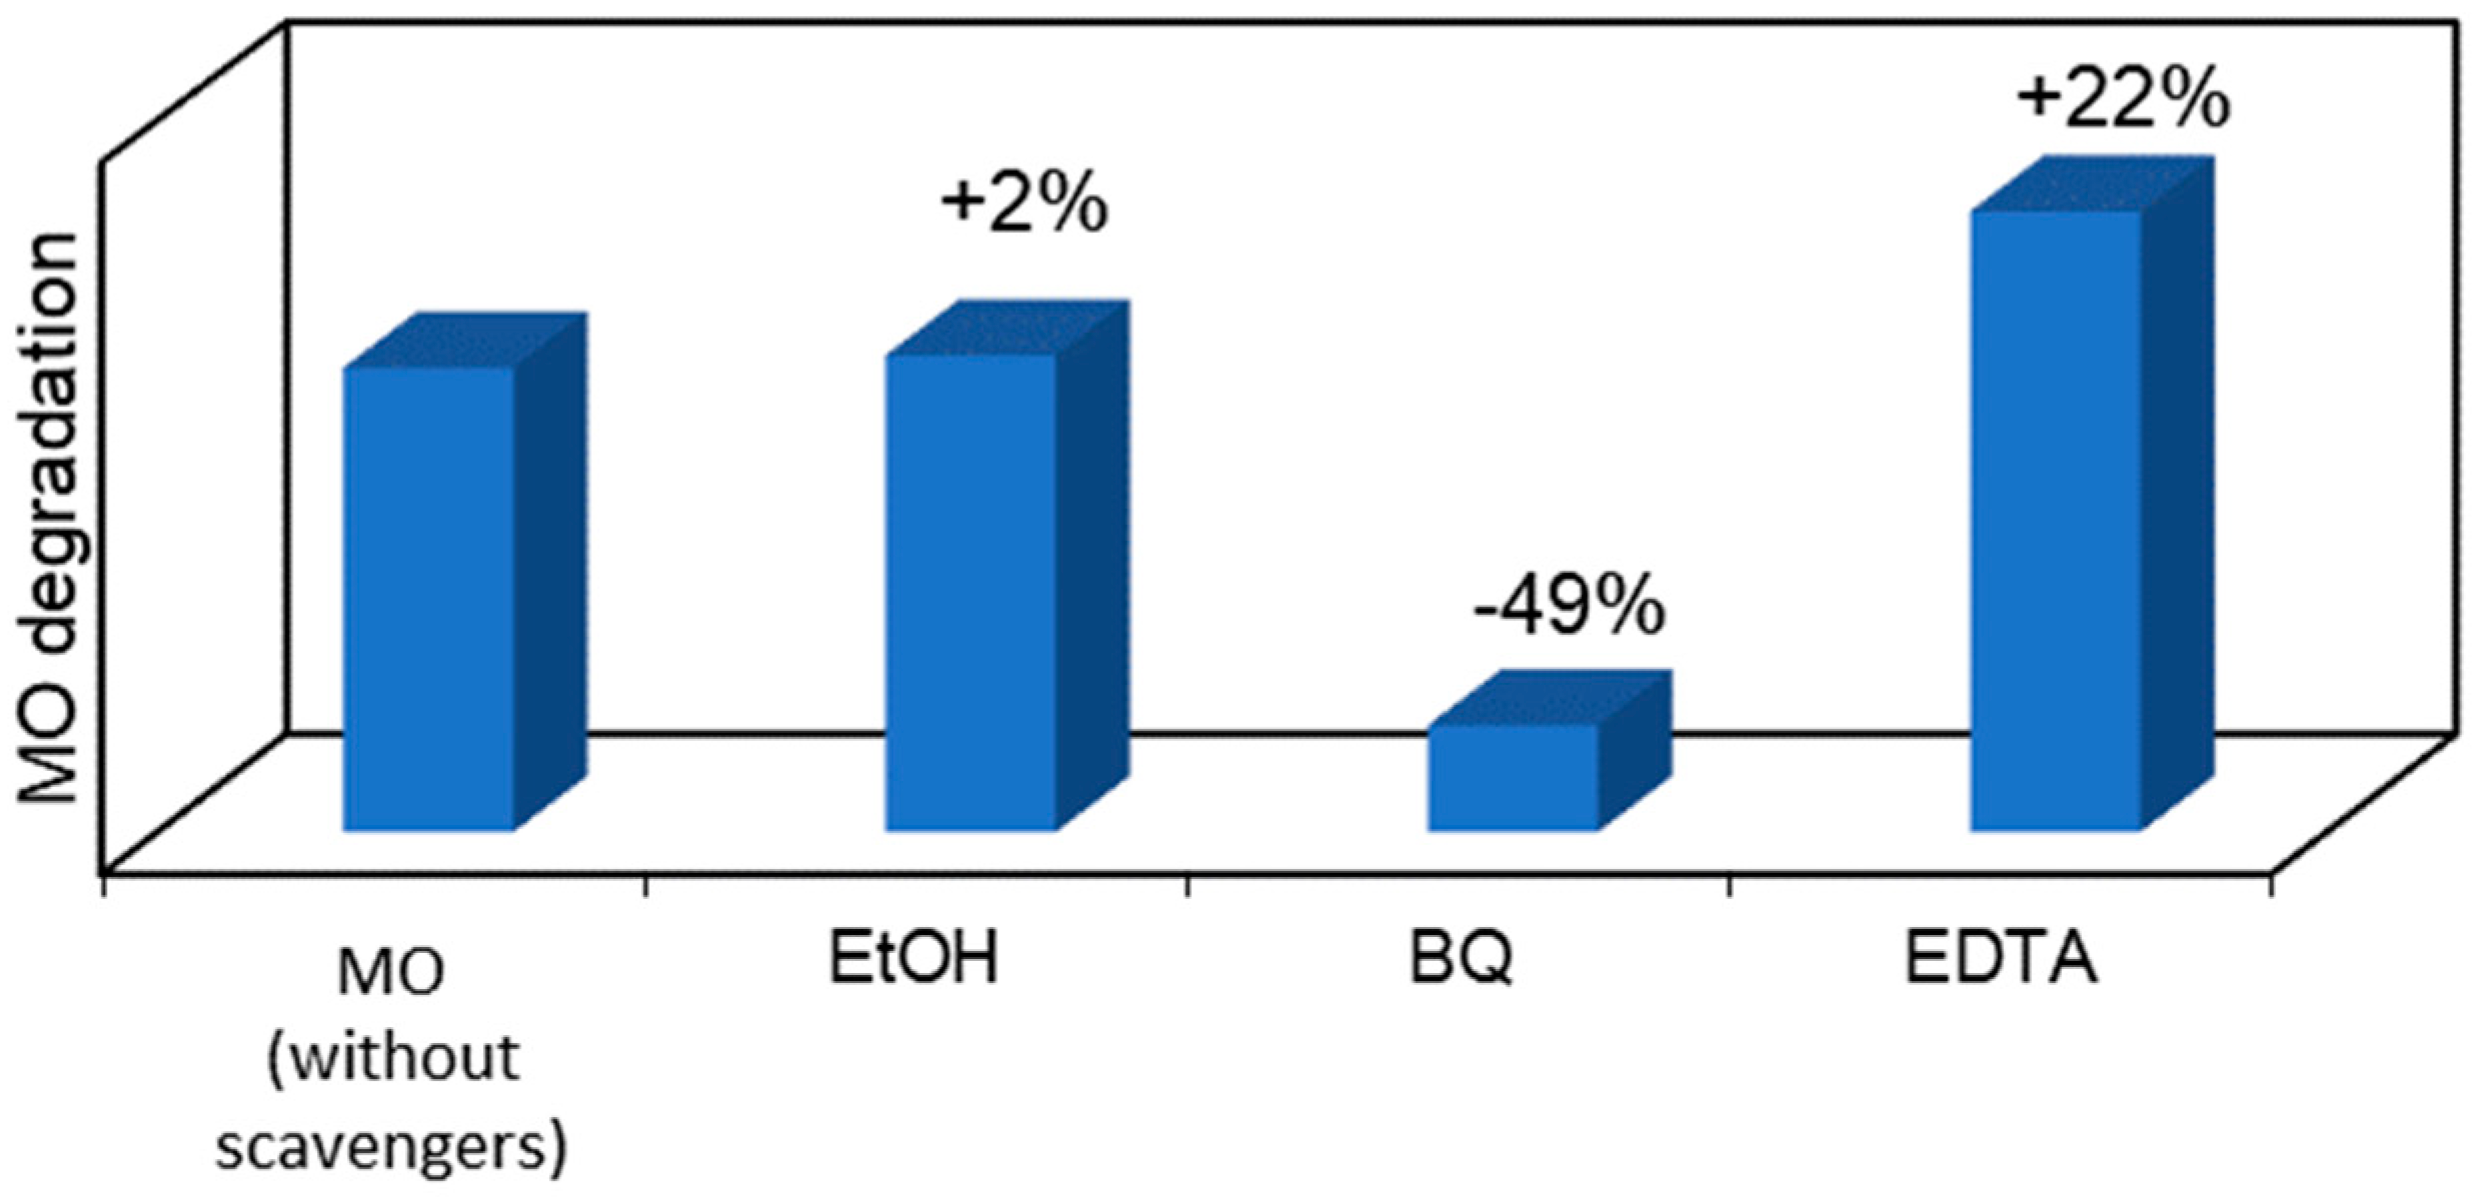
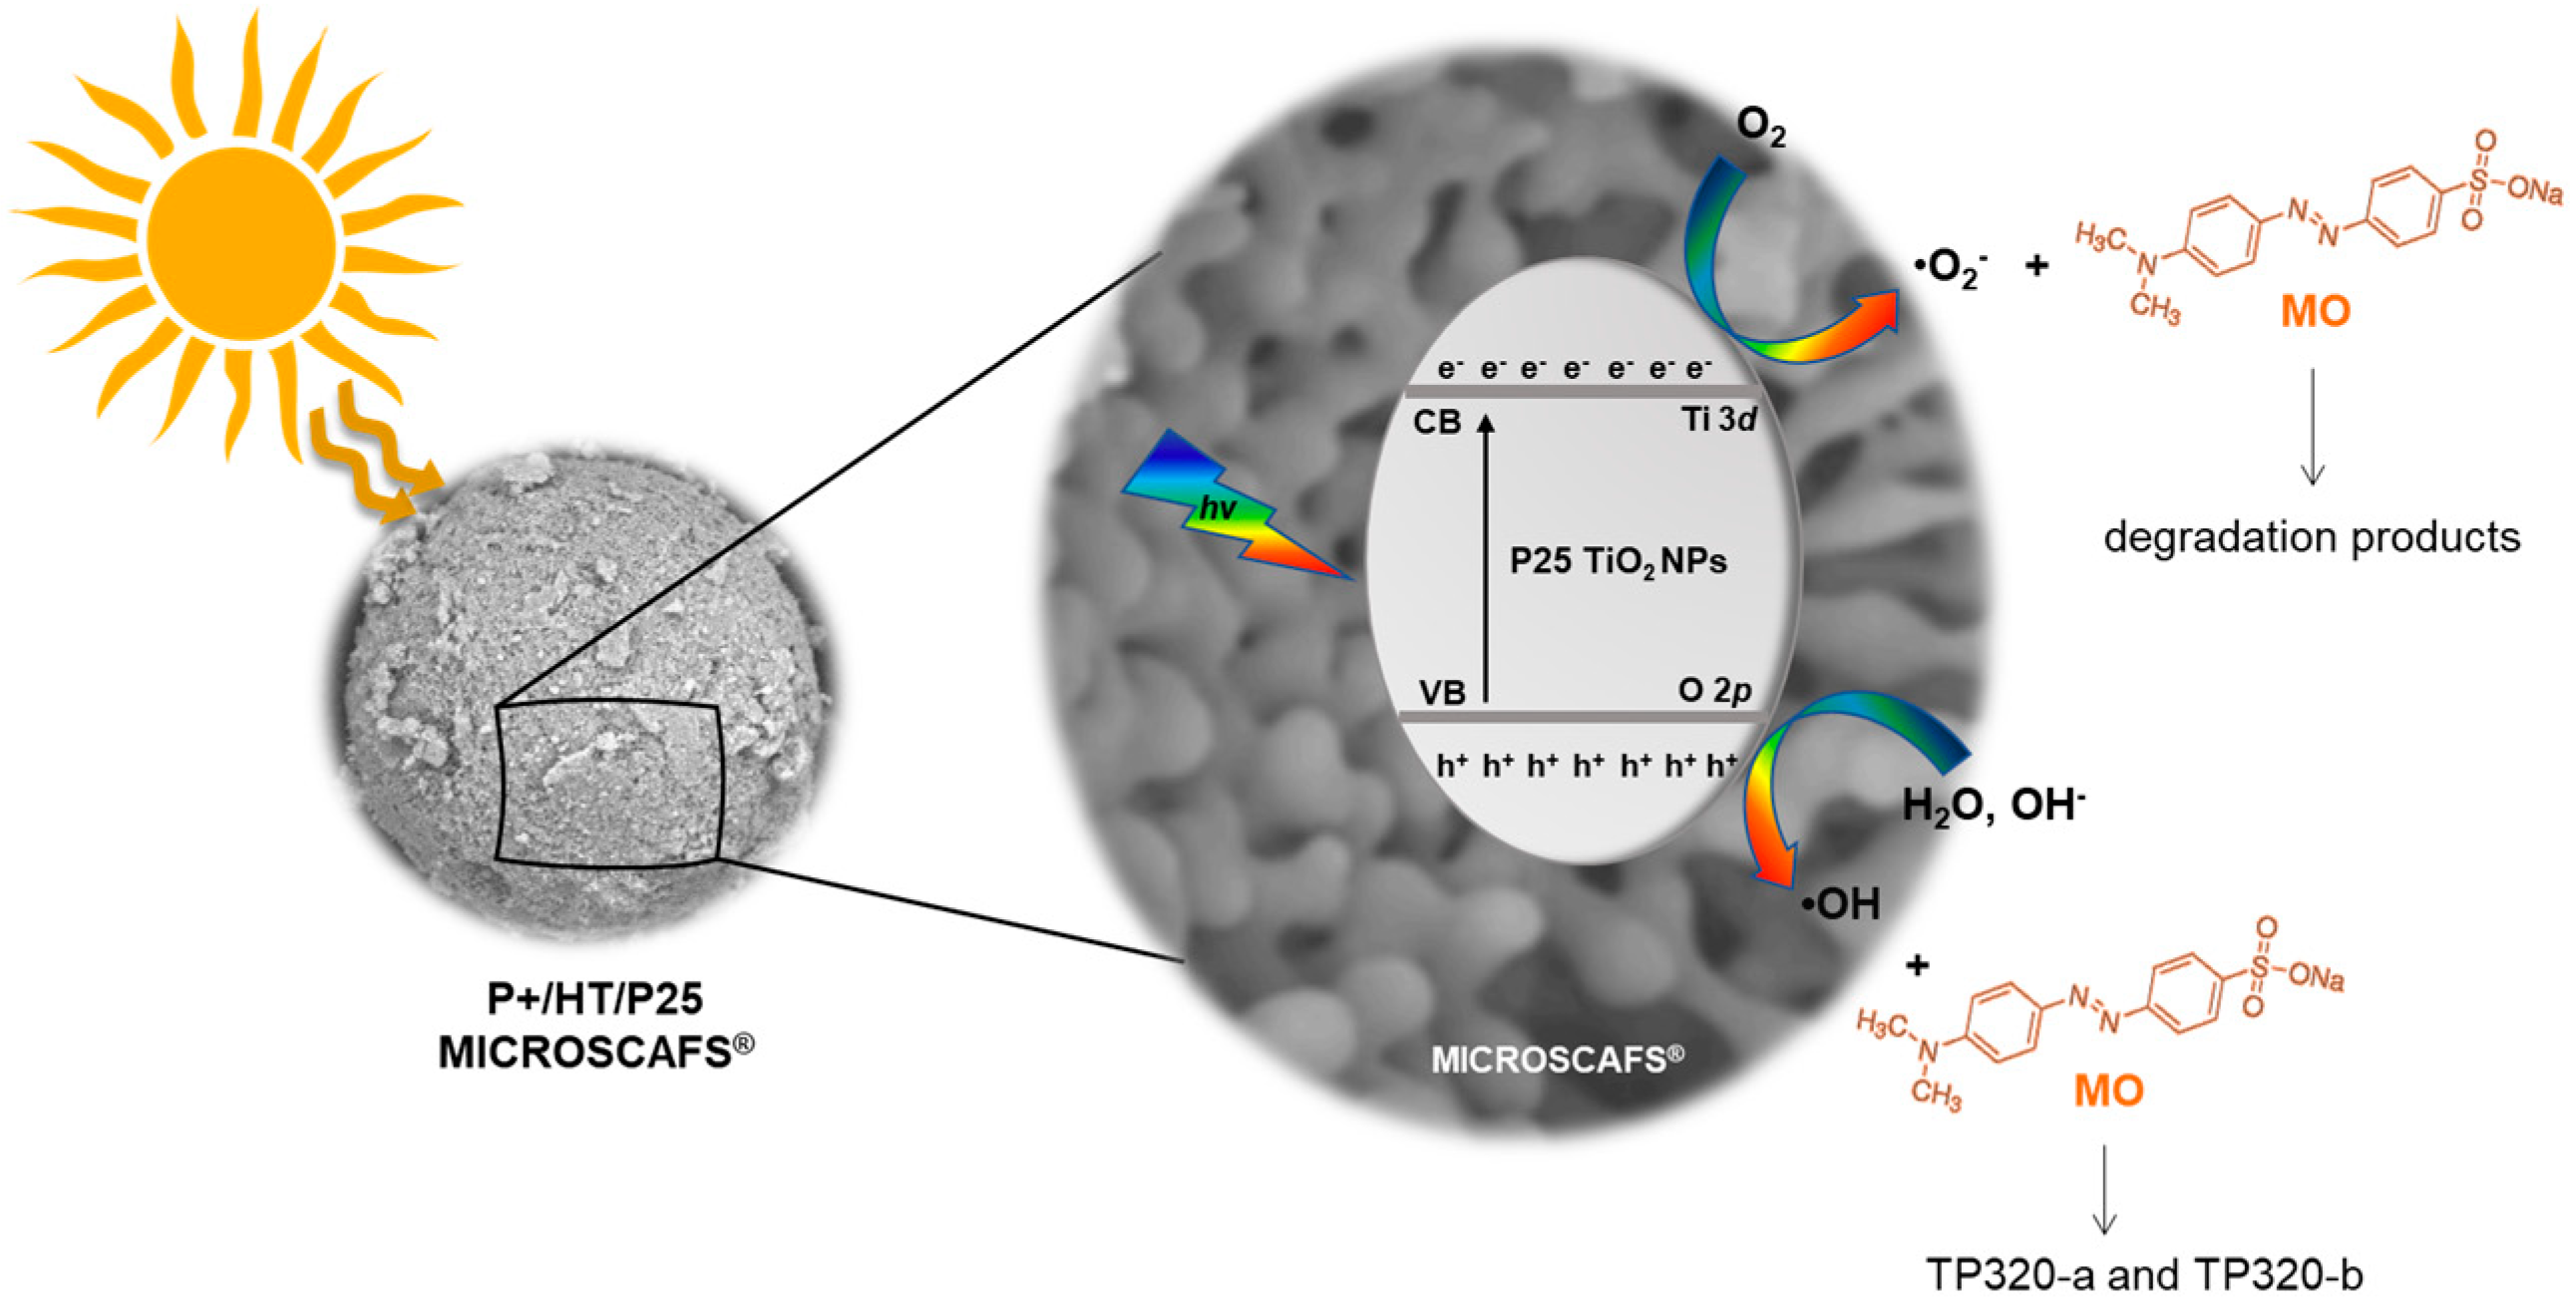
2.5. Scavenger’s Study on the Photocatalytic MICROSCAFS® and Photocatalysis Mechanistic Study
3. Materials and Methods
3.1. Materials
3.2. Synthesis of the MICROSCAFS®
3.3. Preparation of the Photocatalytic MICROSCAFS®
3.4. Characterization
3.5. Photocatalytic Tests
3.6. Kinetics Modeling of the Photocatalytic Performance
3.7. Analytical Methods for Photocatalysis By-Products Determination
4. Conclusions
Supplementary Materials
Author Contributions
Funding
Institutional Review Board Statement
Informed Consent Statement
Data Availability Statement
Acknowledgments
Conflicts of Interest
References
- Lin, J.; Ye, W.; Xie, M.; Seo, D.H.; Luo, J.; Wan, Y.; Van der Bruggen, B. Environmental Impacts and Remediation of Dye-Containing Wastewater. Nat. Rev. Earth Environ. 2023, 4, 785–803. [Google Scholar] [CrossRef]
- Saravanan, A.; Deivayanai, V.C.; Kumar, P.S.; Rangasamy, G.; Hemavathy, R.V.; Harshana, T.; Gayathri, N.; Alagumalai, K. A Detailed Review on Advanced Oxidation Process in Treatment of Wastewater: Mechanism, Challenges and Future Outlook. Chemosphere 2022, 308, 136524. [Google Scholar] [CrossRef]
- Mancuso, A.; Iervolino, G. Synthesis and Application of Innovative and Environmentally Friendly Photocatalysts: A Review. Catalysts 2022, 12, 1074. [Google Scholar] [CrossRef]
- Rauf, M.A.; Ashraf, S.S. Fundamental Principles and Application of Heterogeneous Photocatalytic Degradation of Dyes in Solution. Chem. Eng. J. 2009, 151, 10–18. [Google Scholar] [CrossRef]
- Park, S.; Choi, G.R.; Lee, J.C.; Kim, Y.C.; Oh, D.; Cho, S.; Lee, J.-H. Organic and Inorganic Binder-Coating Properties for Immobilization of Photocatalytic ZnO Nanopowders. Res. Chem. Intermed. 2010, 36, 819–825. [Google Scholar] [CrossRef]
- Jiang, Y.; Liu, A. Cornstalk Biochar-TiO2 Composites as Alternative Photocatalyst for Degrading Methyl Orange. Environ. Sci. Pollut. Res. 2023, 30, 31923–31934. [Google Scholar] [CrossRef]
- Marques, A.C.; Vale, M.; Vicente, D.; Schreck, M.; Tervoort, E.; Niederberger, M. Porous Silica Microspheres with Immobilized Titania Nanoparticles for In-Flow Solar-Driven Purification of Wastewater. Glob. Chall. 2021, 5, 2000116. [Google Scholar] [CrossRef] [PubMed]
- Wu, A.; Wang, D.; Wei, C.; Zhang, X.; Liu, Z.; Feng, P.; Ou, X.; Qiang, Y.; Garcia, H.; Niu, J. A Comparative Photocatalytic Study of TiO2 Loaded on Three Natural Clays with Different Morphologies. Appl. Clay Sci. 2019, 183, 105352. [Google Scholar] [CrossRef]
- Lucchini, M.A.; Lizundia, E.; Moser, S.; Niederberger, M.; Nyström, G. Titania-Cellulose Hybrid Monolith for In-Flow Purification of Water under Solar Illumination. ACS Appl. Mater. Interfaces 2018, 10, 29599–29607. [Google Scholar] [CrossRef]
- Stewart, B.D.; Andrews, L.G.; Pelletier, B.S.; Daly, C.A.; Boyd, J.E. Porous PMMA-Titania Composites: A Step towards More Sustainable Photocatalysis. J. Water Process Eng. 2015, 8, 179–185. [Google Scholar] [CrossRef]
- Lei, P.; Wang, F.; Gao, X.; Ding, Y.; Zhang, S.; Zhao, J.; Liu, S.; Yang, M. Immobilization of TiO2 Nanoparticles in Polymeric Substrates by Chemical Bonding for Multi-Cycle Photodegradation of Organic Pollutants. J. Hazard. Mater. 2012, 227–228, 185–194. [Google Scholar] [CrossRef] [PubMed]
- Ökte, A.N.; Karamanis, D.; Tuncel, D. Dual Functionality of TiO2-Flyash Nanocomposites: Water Vapor Adsorption and Photocatalysis. Catal. Today 2014, 230, 205–213. [Google Scholar] [CrossRef]
- da Silva, T.C.A.; Marchiori, L.; Mattos, B.O.; Ullah, S.; Barud, H.d.S.; Domeneguetti, R.R.; Rojas-Mantilla, H.D.; Zanoni, M.V.B.; Rodrigues-Filho, U.P.; Ferreira-Neto, E.P.; et al. Designing Highly Photoactive Hybrid Aerogels for In-Flow Photocatalytic Contaminant Removal Using Silica-Coated Bacterial Nanocellulose Supports. ACS Appl. Mater. Interfaces 2023, 15, 23146–23159. [Google Scholar] [CrossRef]
- Hu, Y.; Dong, H.; Tapa, A.R.; Shamsi, J.; Shayeh, J.S.; Trokourey, A.; Liu, B.; Zhao, X.; Xie, Y. NaBr-Assisted Aqueous Synthesis of Perovskite-Embedded PbBr(OH) Hierarchical Nanostructures for Dye Photodegradation. ACS Appl. Nano Mater. 2023, 6, 2538–2548. [Google Scholar] [CrossRef]
- Wu, J.; Ke, K.; Qin, N.; Lin, E.; Kang, Z.; Bao, D. Magnetically Retrievable Fe3O4@SiO2@ZnO Piezo-Photocatalyst: Synthesis and Multiple Catalytic Properties. J. Colloid. Interface Sci. 2023, 636, 167–175. [Google Scholar] [CrossRef]
- Sun, G.; Li, N.; Zuo, S.; Shen, W.; Wu, M.; Li, Q.; Shi, M.; Ma, J. Piezo-Photocatalysis over Phase-Engineered MoSe2 Modified Bi2WO6 Hierarchical Microspheres: Utilizing Piezoelectric Effect to Enhance Photocatalytic Performance. Ceram. Int. 2022, 48, 37242–37252. [Google Scholar] [CrossRef]
- Wang, J.; Sgarzi, M.; Němečková, Z.; Henych, J.; Licciardello, N.; Cuniberti, G. Reusable and Antibacterial Polymer-Based Nanocomposites for the Adsorption of Dyes and the Visible-Light-Driven Photocatalytic Degradation of Antibiotics. Glob. Chall. 2022, 6, 2200076. [Google Scholar] [CrossRef] [PubMed]
- Imran, M.; Ashraf, W.; Hafiz, A.K.; Khanuja, M. Synthesis and Performance Analysis of Photocatalytic Activity of ZnIn2S4 Microspheres Synthesized Using a Low-Temperature Method. ACS Omega 2022, 7, 22987–22996. [Google Scholar] [CrossRef]
- Qin, M.; Jin, K.; Li, X.; Wang, R.; Zhao, Y.; Wang, H. Bi Nanosphere-Decorated Oxygen-Vacancy BiOBr Hollow Microspheres with Exposed (110) Facets to Enhance the Photocatalytic Performance for the Degradation of Azo Dyes. N. J. Chem. 2022, 46, 12410–12418. [Google Scholar] [CrossRef]
- Kim, J.; Jo, S.; Lee, W.; Lim, J.; Seung Lee, T. Moving Photocatalyst of a Titanium Dioxide-Based Micromotor Asymmetrically Decorated with Conjugated Polymer Dots. Mater. Des. 2022, 219, 110743. [Google Scholar] [CrossRef]
- Li, X.; Raza, S.; Liu, C. Preparation of Titanium Dioxide Modified Biomass Polymer Microspheres for Photocatalytic Degradation of Rhodamine-B Dye and Tetracycline. J. Taiwan Inst. Chem. Eng. 2021, 122, 157–167. [Google Scholar] [CrossRef]
- Liang, H.; Wang, S.; Lu, Y.; Ren, P.; Li, G.; Yang, F.; Chen, Y. Highly Efficient and Cheap Treatment of Dye by Graphene-Doped TiO2 Microspheres. Water Sci. Technol. 2020, 83, 223–232. [Google Scholar] [CrossRef] [PubMed]
- He, J.; Liu, Q.; Zhang, Y.; Zhao, X.; Zhang, G.; Xiao, B.; Fu, K. In Situ Synthesis of the Mesoporous C–TiO2 Microspheres Derived from Partial Hydrolysis Tetrabutyl Titanate for Enhanced Photocatalytic Degradation under Visible Light. Mater. Res. Bull. 2023, 161, 112168. [Google Scholar] [CrossRef]
- Feng, X.; Gu, L.; Wang, N.; Pu, Q.; Liu, G. Fe/N Co-Doped Nano-TiO2 Wrapped Mesoporous Carbon Spheres for Synergetically Enhanced Adsorption and Photocatalysis. J. Mater. Sci. Technol. 2023, 135, 54–64. [Google Scholar] [CrossRef]
- Ren, X.; Zhang, X.; Guo, R.; Li, X.; Peng, Y.; Zhao, X.; Pu, X. Hollow Mesoporous G-C3N4/Ag2CrO4 Photocatalysis with Direct Z-Scheme: Excellent Degradation Performance for Antibiotics and Dyes. Sep. Purif. Technol. 2021, 270, 118797. [Google Scholar] [CrossRef]
- Vale, M.; Loureiro, M.V.; Ferreira, M.J.; Marques, A.C. Silica-Based Microspheres with Interconnected Macroporosity by Phase Separation. J. Solgel Sci. Technol. 2020, 95, 746–759. [Google Scholar] [CrossRef]
- Vale, M.; Orišková, S.; Mariquito, A.; Reis, L.; Pinto, M.; Marques, A.C. Multicomponent Oxide Microspheres with Designed Macroporosity (MICROSCAFS®): A Customized Platform for Chemicals Immobilization. RSC Adv. 2023, 13, 12951–12965. [Google Scholar] [CrossRef] [PubMed]
- Loureiro, M.V.; Vale, M.; De Schrijver, A.; Bordado, J.C.; Silva, E.; Marques, A.C. Hybrid Custom-Tailored Sol-Gel Derived Microscaffold for Biocides Immobilization. Microporous Mesoporous Mater. 2018, 261, 252–258. [Google Scholar] [CrossRef]
- Fernandes, S.M.; Barrocas, B.T.; Nardeli, J.V.; Montemor, M.F.; Maçoas, E.; Oliveira, M.C.; de Carvalho, C.C.C.R.; Lauria, A.; Niederberger, M.; Marques, A.C. Maximizing Photocatalytic Efficiency with Minimal Amount of Gold: Solar-Driven TiO2 Photocatalysis Supported by MICROSCAFS® for Facile Catalyst Recovery. J. Environ. Chem. Eng. 2024, 12, 112043. [Google Scholar] [CrossRef]
- Loureiro, M.V.; Ciriminna, R.; Lourenço, M.J.; Santos, L.F.; De Schrijver, A.; Bordado, J.C.; Pagliaro, M.; Marques, A.C. Organically-Modified Silica Based Microspheres for Self-Curing Polyurethane One Component Foams. Microporous Mesoporous Mater. 2017, 244, 244–250. [Google Scholar] [CrossRef]
- Marques, A.C.; Loureiro, M.V.; Lourenço, M.J.; De Schrijver, A.; Bordado, J.C. Amino Surface Functionalized Microcapsules as Curing Agents for Polyurethane Foams. Mater. Manuf. Process. 2017, 32, 1304–1309. [Google Scholar] [CrossRef]
- Nagar, N.; Devra, V. A Kinetic Study on the Degradation and Biodegradability of Silver Nanoparticles Catalyzed Methyl Orange and Textile Effluents. Heliyon 2019, 5, e01356. [Google Scholar] [CrossRef] [PubMed]
- Benz, D.; Van Bui, H.; Hintzen, H.T.; Kreutzer, M.T.; van Ommen, J.R. Mechanistic Insight into the Improved Photocatalytic Degradation of Dyes for an Ultrathin Coating of SiO2 on TiO2 (P25) Nanoparticles. Chem. Eng. J. Adv. 2022, 10, 100288. [Google Scholar] [CrossRef]
- Luna, A.L.; Matter, F.; Schreck, M.; Wohlwend, J.; Tervoort, E.; Colbeau-Justin, C.; Niederberger, M. Monolithic Metal-Containing TiO2 Aerogels Assembled from Crystalline Pre-Formed Nanoparticles as Efficient Photocatalysts for H2 Generation. Appl. Catal. B 2020, 267, 118660. [Google Scholar] [CrossRef]
- Williams, P.A.; Ireland, C.P.; King, P.J.; Chater, P.A.; Boldrin, P.; Palgrave, R.G.; Claridge, J.B.; Darwent, J.R.; Chalker, P.R.; Rosseinsky, M.J. Atomic Layer Deposition of Anatase TiO2 Coating on Silica Particles: Growth, Characterization and Evaluation as Photocatalysts for Methyl Orange Degradation and Hydrogen Production. J. Mater. Chem. 2012, 22, 20203–20209. [Google Scholar] [CrossRef]
- Ljubas, D.; Smoljanić, G.; Juretić, H. Degradation of Methyl Orange and Congo Red Dyes by Using TiO2 Nanoparticles Activated by the Solar and the Solar-like Radiation. J. Environ. Manag. 2015, 161, 83–91. [Google Scholar] [CrossRef] [PubMed]
- Morales-García, Á.; Macià Escatllar, A.; Illas, F.; Bromley, S.T. Understanding the Interplay between Size, Morphology and Energy Gap in Photoactive TiO2 Nanoparticles. Nanoscale 2019, 11, 9032–9041. [Google Scholar] [CrossRef] [PubMed]
- Comparelli, R.; Fanizza, E.; Curri, M.L.; Cozzoli, P.D.; Mascolo, G.; Passino, R.; Agostiano, A. Photocatalytic Degradation of Azo Dyes by Organic-Capped Anatase TiO2 Nanocrystals Immobilized onto Substrates. Appl. Catal. B 2005, 55, 81–91. [Google Scholar] [CrossRef]
- Kokilavani, S.; Alaraidh, I.A.; Okla, M.K.; Chandran, P.; Mohebaldin, A.; Soufan, W.; AL-ghamdi, A.A.; Abdel-Maksoud, M.A.; AbdElgawad, H.; Thomas, A.M.; et al. Efficient Photocatalytic Degradation of Methyl Orange and Malachite Green by Ag3PO4 Decorated BiOBr Nanoflower under Visible Light: Performance Evaluation, Mechanism Insights and Toxicology of the by-Products. J. Alloys Compd. 2022, 909, 164703. [Google Scholar] [CrossRef]
- Putri, R.A.; Safni, S.; Jamarun, N.; Septiani, U.; Kim, M.-K.; Zoh, K. Kinetics Studies on Photodegradation of Methyl Orange in the Presence of C-N-Codoped TiO2 Catalyst. Egypt. J. Chem. 2019, 62, 563–575. [Google Scholar] [CrossRef]
- Baiocchi, C.; Brussino, M.C.; Pramauro, E.; Prevot, A.B.; Palmisano, L.; Marcì, G. Characterization of Methyl Orange and Its Photocatalytic Degradation Products by HPLC/UV–VIS Diode Array and Atmospheric Pressure Ionization Quadrupole Ion Trap Mass Spectrometry. Int. J. Mass. Spectrom. 2002, 214, 247–256. [Google Scholar] [CrossRef]
- Kim, K.-S.; Kam, S.K.; Mok, Y.S. Elucidation of the Degradation Pathways of Sulfonamide Antibiotics in a Dielectric Barrier Discharge Plasma System. Chem. Eng. J. 2015, 271, 31–42. [Google Scholar] [CrossRef]
- Liu, T.; Wang, L.; Lu, X.; Fan, J.; Cai, X.; Gao, B.; Miao, R.; Wang, J.; Lv, Y. Comparative Study of the Photocatalytic Performance for the Degradation of Different Dyes by ZnIn2S4: Adsorption, Active Species, and Pathways. RSC Adv. 2017, 7, 12292–12300. [Google Scholar] [CrossRef]
- Mills, A.; Williams, G. Methyl Orange as a Probe of the Semiconductor–Electrolyte Interfaces in CdS Suspensions. J. Chem. Soc. Faraday Trans. 1987, 83, 2647–2661. [Google Scholar] [CrossRef]
- Osawa, R.A.; Barrocas, B.T.; Monteiro, O.C.; Conceição Oliveira, M.; Florêncio, M.H. Photocatalytic Degradation of Amitriptyline, Trazodone and Venlafaxine Using Modified Cobalt-Titanate Nanowires under UV–Vis Radiation: Transformation Products and in Silico Toxicity. Chem. Eng. J. 2019, 373, 1338–1347. [Google Scholar] [CrossRef]
- Ismail, L.; Rifai, A.; Ferronato, C.; Fine, L.; Jaber, F.; Chovelon, J.-M. Towards a Better Understanding of the Reactive Species Involved in the Photocatalytic Degradation of Sulfaclozine. Appl. Catal. B 2016, 185, 88–99. [Google Scholar] [CrossRef]
- Dirany, A.; Sirés, I.; Oturan, N.; Özcan, A.; Oturan, M.A. Electrochemical Treatment of the Antibiotic Sulfachloropyridazine: Kinetics, Reaction Pathways, and Toxicity Evolution. Environ. Sci. Technol. 2012, 46, 4074–4082. [Google Scholar] [CrossRef] [PubMed]
- Fabiańska, A.; Białk-Bielińska, A.; Stepnowski, P.; Stolte, S.; Siedlecka, E.M. Electrochemical Degradation of Sulfonamides at BDD Electrode: Kinetics, Reaction Pathway and Eco-Toxicity Evaluation. J. Hazard. Mater. 2014, 280, 579–587. [Google Scholar] [CrossRef] [PubMed]
- Vale, M.; Marques, A.C. Mechanistic Study of the Formation of Multicomponent Oxide Porous Microspheres (MICROSCAFS®) by Cryo-Scanning Electron Microscopy. Gels 2023, 9, 704. [Google Scholar] [CrossRef]
- Landi, S.; Segundo, I.R.; Freitas, E.; Vasilevskiy, M.; Carneiro, J.; Tavares, C.J. Use and Misuse of the Kubelka-Munk Function to Obtain the Band Gap Energy from Diffuse Reflectance Measurements. Solid State Commun. 2022, 341, 114573. [Google Scholar] [CrossRef]
- Makuła, P.; Pacia, M.; Macyk, W. How To Correctly Determine the Band Gap Energy of Modified Semiconductor Photocatalysts Based on UV–Vis Spectra. J. Phys. Chem. Lett. 2018, 9, 6814–6817. [Google Scholar] [CrossRef] [PubMed]
- Barrocas, B.; Chiavassa, L.D.; Conceição Oliveira, M.; Monteiro, O.C. Impact of Fe, Mn Co-Doping in Titanate Nanowires Photocatalytic Performance for Emergent Organic Pollutants Removal. Chemosphere 2020, 250, 126240. [Google Scholar] [CrossRef] [PubMed]
- Barrocas, B.T.; Oliveira, M.C.; Nogueira, H.I.S.; Fateixa, S.; Monteiro, O.C. Ruthenium-Modified Titanate Nanowires for the Photocatalytic Oxidative Removal of Organic Pollutants from Water. ACS Appl. Nano Mater. 2019, 2, 1341–1349. [Google Scholar] [CrossRef]
- Osawa, R.A.; Barrocas, B.T.; Monteiro, O.C.; Oliveira, M.C.; Florêncio, M.H. Photocatalytic Degradation of Cyclophosphamide and Ifosfamide: Effects of Wastewater Matrix, Transformation Products and in Silico Toxicity Prediction. Sci. Total Environ. 2019, 692, 503–510. [Google Scholar] [CrossRef] [PubMed]


| Sample Acronym | Average Kinetic Rate Constant k (mL min−1 mg−1) | Average Apparent Flow Reaction Rate Constant kapp (mL min−1 mg−1) |
|---|---|---|
| P−/HT/P25 | (3.47 ± 0.1) × 10−2 | (2.28 ± 0.3) × 10−3 |
| P0/HT/P25 | (4.40 ± 0.3) × 10−2 | (3.01 ± 0.5) × 10−3 |
| P+/HT/P25 | (6.45 ± 0.08) × 10−2 | (4.19 ± 0.7) × 10−3 |
| S−/HT/P25 | (4.99 ± 0.7) × 10−2 | n. a. |
| Compound | Structure | tR (min) | Proposed Empirical Formula | [M−H]− [m/z (∆ppm) mSigma] |
|---|---|---|---|---|
| MO |  | 9.5 | C14H15N3O3S | [304.0770 (−2.9; 6.5)] |
| TP320-a | 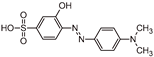 | 10.9 | C14H15N3O4S | [320.0722 (−3.7; 9.2)] |
| TP306 | 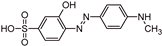 | 9.0 | C13H13N3O4S | [306.0562 (−2.7;12.5)] |
| TP290 |  | 7.8 | C13H13N3O3S | [290.0614 (−3.2; 10.5)] |
| TP276 | 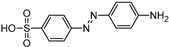 | 5.8 | C12H11N3O3S | [276.0453 (−3.2; 21.6)] |
| TP320-b | 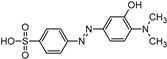 | 3.9 | C14H15N3O4S | [320.0712 (−0.2; 9.7)] |
| Compound | Acute Toxicity | Chronic Toxicity | ||||
|---|---|---|---|---|---|---|
| (mg/L) | (mg/L) | |||||
| Fish (LC50) | Daphnid (LC50) | Green Algae (EC50) | Fish (ChV) | Daphnid (ChV) | Green Algae (ChV) | |
| MO | 1513.99 | 793.35 | 424.07 | 134.62 | 61.88 | 92.88 |
| TP320-a | 173.97 | 39.22 | 192.16 | 15.97 | 7.47 | 91.02 |
| TP320-b | 592.29 | 97.78 | 512.74 | 49.07 | 18.64 | 245.03 |
| TP306 | 433.60 | 76.62 | 395.85 | 36.73 | 14.60 | 188.80 |
| TP290 | 4479.49 | 2231.63 | 967.94 | 375.25 | 151.23 | 189.43 |
| TP276 | 922.37 | 2.07 | 9.26 | 5.36 | 0.13 | 13.94 |
| Harmless LC50/EC50/ChV > 100 | Harmful 100 > LC50/EC50/ChV > 10 | Toxic 10 > LC50/EC50/ChV > 1 | Very toxic LC50/EC50/ChV < 1 | |||
| Sample Acronym | Volume of GPTMS (mL) | Volume of Span® 80 (mL) | Mass of Pluronic® P123 (g) |
|---|---|---|---|
| P− | 10.4 | 6.0 | 0 |
| P0 (reference) | 13.8 | 6.0 | 0 |
| P+ | 17.3 | 6.0 | 0 |
| S− | 13.8 | 7.7 | 2.3 |
Disclaimer/Publisher’s Note: The statements, opinions and data contained in all publications are solely those of the individual author(s) and contributor(s) and not of MDPI and/or the editor(s). MDPI and/or the editor(s) disclaim responsibility for any injury to people or property resulting from any ideas, methods, instructions or products referred to in the content. |
© 2024 by the authors. Licensee MDPI, Basel, Switzerland. This article is an open access article distributed under the terms and conditions of the Creative Commons Attribution (CC BY) license (https://creativecommons.org/licenses/by/4.0/).
Share and Cite
Vale, M.; Barrocas, B.T.; Serôdio, R.M.N.; Oliveira, M.C.; Lopes, J.M.; Marques, A.C. Robust Photocatalytic MICROSCAFS® with Interconnected Macropores for Sustainable Solar-Driven Water Purification. Int. J. Mol. Sci. 2024, 25, 5958. https://doi.org/10.3390/ijms25115958
Vale M, Barrocas BT, Serôdio RMN, Oliveira MC, Lopes JM, Marques AC. Robust Photocatalytic MICROSCAFS® with Interconnected Macropores for Sustainable Solar-Driven Water Purification. International Journal of Molecular Sciences. 2024; 25(11):5958. https://doi.org/10.3390/ijms25115958
Chicago/Turabian StyleVale, Mário, Beatriz T. Barrocas, Rita M. N. Serôdio, M. Conceição Oliveira, José M. Lopes, and Ana C. Marques. 2024. "Robust Photocatalytic MICROSCAFS® with Interconnected Macropores for Sustainable Solar-Driven Water Purification" International Journal of Molecular Sciences 25, no. 11: 5958. https://doi.org/10.3390/ijms25115958
APA StyleVale, M., Barrocas, B. T., Serôdio, R. M. N., Oliveira, M. C., Lopes, J. M., & Marques, A. C. (2024). Robust Photocatalytic MICROSCAFS® with Interconnected Macropores for Sustainable Solar-Driven Water Purification. International Journal of Molecular Sciences, 25(11), 5958. https://doi.org/10.3390/ijms25115958