Article

Differential Mitochondrial Genome Expression of Four Hylid Frog Species under Low-Temperature Stress and Its Relationship with Amphibian Temperature Adaptation

by
Yue-Huan Hong
1,
Ya-Ni Yuan
1,
Ke Li
1,
Kenneth B. Storey
2,
Jia-Yong Zhang
1,3,
Shu-Sheng Zhang
3 and
Dan-Na Yu
1,3,*
1
College of Life Sciences, Zhejiang Normal University, Jinhua 321004, China
2
Department of Biology, Carleton University, Ottawa, ON K1S 5B6, Canada
3
Key Lab of Wildlife Biotechnology, Conservation and Utilization of Zhejiang Province, Zhejiang Normal University, Jinhua 321004, China
*
Author to whom correspondence should be addressed.
Int. J. Mol. Sci. 2024, 25(11), 5967; https://doi.org/10.3390/ijms25115967
Submission received: 6 May 2024 / Revised: 24 May 2024 / Accepted: 27 May 2024 / Published: 29 May 2024

Abstract

:
Extreme weather poses huge challenges for animals that must adapt to wide variations in environmental temperature and, in many cases, it can lead to the local extirpation of populations or even the extinction of an entire species. Previous studies have found that one element of amphibian adaptation to environmental stress involves changes in mitochondrial gene expression at low temperatures. However, to date, comparative studies of gene expression in organisms living at extreme temperatures have focused mainly on nuclear genes. This study sequenced the complete mitochondrial genomes of five Asian hylid frog species: Dryophytes japonicus, D. immaculata, Hyla annectans, H. chinensis and H. zhaopingensis. It compared the phylogenetic relationships within the Hylidae family and explored the association between mitochondrial gene expression and evolutionary adaptations to cold stress. The present results showed that in D. immaculata, transcript levels of 12 out of 13 mitochondria genes were significantly reduced under cold exposure (p < 0.05); hence, we put forward the conjecture that D. immaculata adapts by entering a hibernation state at low temperature. In H. annectans, the transcripts of 10 genes (ND1, ND2, ND3, ND4, ND4L, ND5, ND6, COX1, COX2 and ATP8) were significantly reduced in response to cold exposure, and five mitochondrial genes in H. chinensis (ND1, ND2, ND3, ND4L and ATP6) also showed significantly reduced expression and transcript levels under cold conditions. By contrast, transcript levels of ND2 and ATP6 in H. zhaopingensis were significantly increased at low temperatures, possibly related to the narrow distribution of this species primarily at low latitudes. Indeed, H. zhaopingensis has little ability to adapt to low temperature (4 °C), or maybe to enter into hibernation, and it shows metabolic disorder in the cold. The present study demonstrates that the regulatory trend of mitochondrial gene expression in amphibians is correlated with their ability to adapt to variable climates in extreme environments. These results can predict which species are more likely to undergo extirpation or extinction with climate change and, thereby, provide new ideas for the study of species extinction in highly variable winter climates.

1. Introduction

Hylidae (Anura, Neobatrachia) is an abundant family of amphibians, with 885 species in 57 genera [1,2]. Although commonly known as tree frogs, many species are also found in other environments such as in rice fields, reed marshes and other wetlands. Hylidae has three subfamilies: Hylinae, Phyllomedusinae and Pelodryadinae. Hylinae is the subfamily containing the most frogs and all eight species found in China belong to this subfamily. These are Hyla annectans, H. chinensis, H. sanchiangensis, H. simplex, H. tsinlingensis, H. zhaopingensis, Dryophytes immaculata and D. japonica (https://amphibiansoftheworld.amnh.org/, accessed on 20 June 2023) [3] and (http://www.amphibiachina.org/, accessed on 20 June 2023) [4]. Four species are included in the present study. D. immaculata (Boettger, 1888) [5] (Anura: Hylidae) is known to range from Guangdong in the south to Heibei. H. annectans (Jerdon, 1870) [6] (Anura: Hylidae) is mainly distributed in western China (Yunnan, Guizhou, Sichuan, Hunan), but also in India, Myanmar and Thailand. H. chinensis (Günther, 1858) [7] is found mainly in southern China, but also in northern Vietnam, and H. zhaopingensis (Tang and Zhang, 1984) [8] (Anura: Hylidae) was discovered at Zhaoping of Guangxi, China.
Previous studies focused on the species boundary between D. suweonensis and D. japonica [9,10]. However, Li et al. [11] proposed that the sequences of D. immaculata and D. suweonensis obviously clustered together in the phylogenetic tree to form a homologous monophyletic branch, but the D. suweonensis sequence adopted in that study lacked detailed information about sampling points. Dufresnes [12] also supported the synonym relationship between D. immaculata and D. suweonensis. However, the results of Borzee et al. [13] highlighted differences and divergences between the clades of D. suweonensis and D. immaculata, and suggested that D. suweonensis occurred in a ring around the Yellow Sea via continuous genetic variation of haplotypes, but this was difficult to prove. The same study also showed differences between D. suweonensis and D. immaculata based on morphology and acoustics in the latter study [14]. Hence, at present, the question of whether these two are the same species or not needs further experimentation.
Global climate change has exerted extensive and profound impacts on species, populations and ecosystems [15,16,17]. In recent years, short extreme cold weather events in mainland China have also become more frequent. More and more evidence suggests that the global climate is changing, and a biological response to climate change is ongoing [18]. Many species can adapt and survive the effects of climate change, but the current rate of temperature rise is unprecedented and faster than previous climate change events [18]. This means that extreme heat and cold events will increase in the future. In addition, if a population of one species cannot adapt to new environmental conditions brought about by climate change, this may lead to species extirpation from local areas or even to full extinction, posing a serious threat to biodiversity [19]. The unstable weather caused by global warming has resulted in a drastic decline for several species [20], with a variety of population declines and extinctions being reported in recent decades [21,22,23,24]. Scientists predict that species may respond to these global events by changing their behavior and altering their range [25]. Therefore, whether organisms can survive extreme temperatures and initiate a series of regulatory mechanisms becomes a crucial issue.
Compared with mammals and birds, amphibians are more readily affected by climate change. Indeed, the study of amphibians for climate change is of particular importance in the context of global climate change because they are very sensitive to environmental stresses [26,27]. Hence, they are considered to be good models for seeking out the factors leading to genetic variation and differentiation patterns [28,29]. In particular, amphibians are subject to dual pressures because they have both aquatic and terrestrial phases in their life [30]. Moreover, compared to homeothermic animals, poikilotherm animals are more likely to track changes in their climatic space [31]. Studying the relationship between animal species distribution and climate variables is crucial for improving our ability to predict the ecological consequences of future climate change [32,33,34]. Due to the high sensitivity of poikilotherms to temperature change, amphibians regulate their metabolism and several species activate a series of cold resistance mechanisms under low-temperature stress [34]. Indeed, the use of liver glycogen to produce cryoprotectants at the onset of freezing occurs in several frost-tolerant amphibians [35,36,37,38,39,40]. As a species that can live at 0 °C (or lower) for a long time, R. sylvatica can also endure prolonged time under hypoxic/anoxic conditions [41]. Indeed, many organisms that are subjected to low-temperature stress show a strong suppression of metabolic rate [42,43,44]. For example, the resting metabolic rate of the toad Bufo marinus temporarily decreases under low-temperature exposure [45]. In addition, mtDNA has a variety of unique properties that enable it to act as a cellular sentinel for genotoxic stress [46], responding to temperature extremes ahead of nuclear genes. When amphibians are exposed to low-temperature stress, the expression of cold-resistance-related genes can be activated and regulated along with the synthesis of stress-related substances in order to reduce damage to their bodies [35,36,37,38,39,40,41,42,43,44,45,46]. Furthermore, since antioxidant defenses are closely related to cold tolerance, the transcription levels of mitochondrial protein-coding genes, which are closely related to ATP generation, can also reflect the expression of cold-resistance-related genes.
Mitochondria play an important role in the adaptation of organisms to environmental temperature change and are closely linked to oxygen restriction [47,48,49,50,51,52,53]. Mitogenomes are also currently used as effective tools for species identification and for determining phylogenetic relationships [54]. Although there have been many studies of anuran mitogenomes in order to elucidate phylogenetic relationships, few studies have included data on mitochondrial gene expression, and most have focused on the expression of nuclear genes. However, in recent years, some data have been gathered to describe mitochondrial gene expression responses to environmental stress (e.g., temperature). For example, Zhang et al. [54] showed that expression of the mitochondrial COX1 gene in D. versicolor was significantly reduced at low temperature. Jin et al. [55] conducted cold stress experiments in two different populations of Hoplobatrachus rugulosus. The results showed that Thai Ho. rugulosus (TT frogs) showed a fast growth rate and high-temperature tolerance, whereas Chinese Ho. rugulosus (CT frogs) had a slower growth rate and a strong tolerance of low temperature [47]. Hence, mitochondrial gene expression varies both by species and by the stress encountered.
Li et al. [11] showed that the genus Hyla originated in North America and then spread to China across the Bering land bridge during the Middle Eocene to Early Oligocene. Hence, Dryophytes and Hyla have been separated from other Hylidae for about 22.6 mya [56]. The Hylidae family spread from north to south [11]. However, Yan et al. [57] argued that the Hyla chinensis group originated in southern and eastern China. Since Dryophytes and Hyla used to be considered as one genus, Dullman et al. proposed that Dryophytes should be a separate genus [58]. The selection of these two genera as subjects also helped to find differences between them.
To further explore the mechanisms of amphibian response to low temperature, we selected Dryophytes and Hyla as the research targets for a study of mitochondrial gene expression. Liver is a main organ of energy metabolism in organisms [59], and studies have proven that using liver as a research model can obtain significant expression results [55]. Therefore, in this study, liver was selected as the main organ with which to explore the situation of mitochondrial gene expression under the stress of low temperature. In addition, studying gene expression of amphibians at low temperatures can help us to understand the tolerance of individual species for extreme temperatures. The least tolerant species are more likely to go extinct in the context of frequent temperature extremes, which also provides new ideas for the study of species extinction in extreme climates.

2. Results

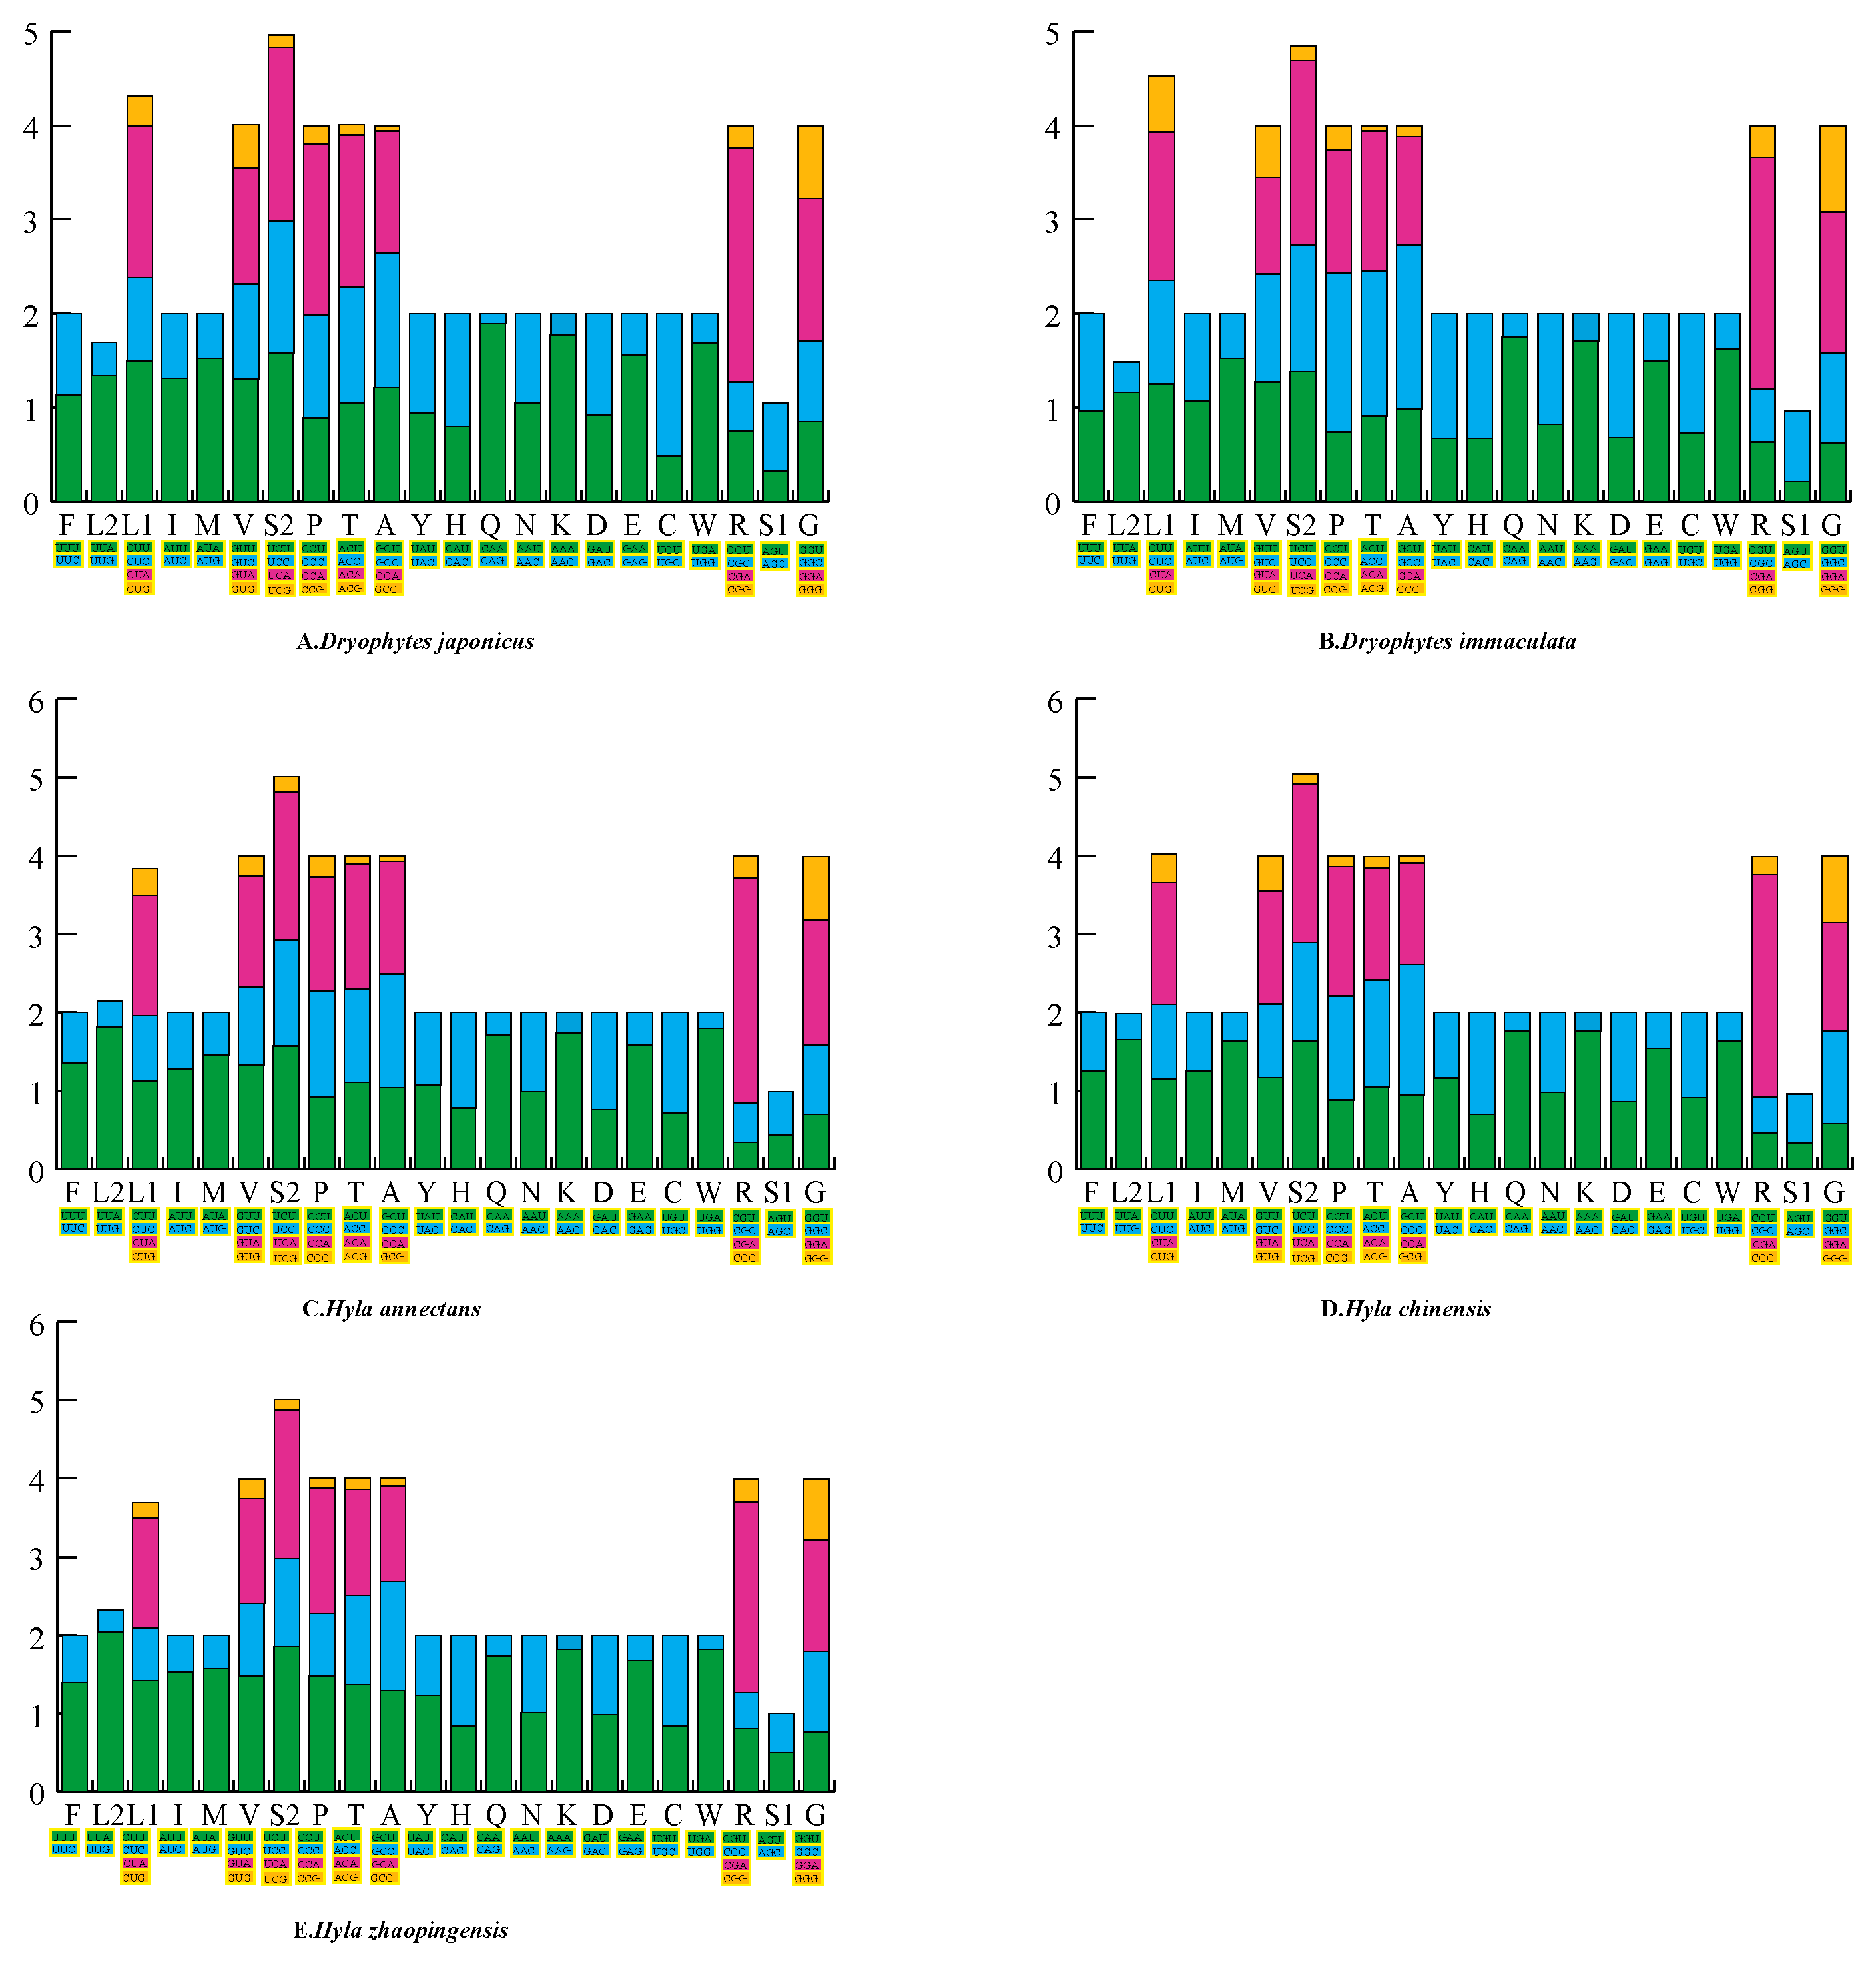
2.1. General Features of the Mitogenome

We obtained the nearly complete mitochondrial genomes of five Hylidae species (except for part of the control region), namely, D. japonicus, D. immaculatus, H. annectans, H. chinensis and H. zhaopingensis. These mitogenomes were loaded into GenBank with identification numbers OR398492, OR398491, OR398488, OR398389 and OR398490, respectively, and gene lengths of 17,221 bp, 18,186 bp, 17,060 bp, 17,087 bp and 15,812 bp, respectively. Gene arrangements were similar to those of other hylid species. Figure S1 shows the mitochondrial gene arrangement order in Hylidae.
The location and characteristics of each gene are shown in Table S1. Of the five mitochondrial genomes of Hylidae assessed in this study, four of them used ATN as the start codon, whereas the ND1 gene used TTG. Most stop codons were full stop codons TAN and AGA, whereas an incomplete stop codon T appeared in ND1, ND3 and COX2. In addition, TA terminators were found on all COX3 genes. The 12S rRNA was located between trnF and trnV, with a length of 932~938 bp, whereas 16S rRNA was located between trnV and trnL2, with a length of 1595~1601 bp. The mitochondrial genomes of the five species of Hylidae had non-coding regions and overlapping regions. The longest overlapping region appeared between ATP6 and ATP8, with a length of about 10 bp, and the longest interval region appeared between trnS1 and ND5, with a length of about 35 bp. And the five species of Hylidae all showed the typical characteristics of vertebrates, with an obvious AT skew. AT content and AT skew data are shown in Table 1.
The RSCU is shown in Figure 1, and the original data are found in Supplemental Table S2. The results showed that each codon had a different frequency of use in the genome and that Hylidae species showed preferential use of A and T in synonymous codons. CGA in arginine (Arg) was the most frequently used codon among all amino acids. In addition, UCA in serine (Ser2) was also frequently used, whereas GCG in alanine (Ala) was the least frequently used amino acid.
The tRNA secondary structures of the five sequences of Hylidae species are shown in Figures S2–S6, respectively. The tRNA length was similar for all species, and the secondary structure was the typical clover leaf. There were base pair mismatches in some tRNAs, the most common being U-G mismatches. In addition, a starting region called the L-strand origin (OL) for replication was found between trnN and trnC and it plays an important role in replication. The OL between trnN and trnC was approximately 25 bases with a stem ring structure (Figure 2). Mismatch was found in the OL of the Hylidae in this study. There was a U-G mismatch in H. zhaopingensis. Moreover, the numbers of U bases and A bases in the stem rings of the five Hylidae were different, and the lengths of the stem loops were also different.

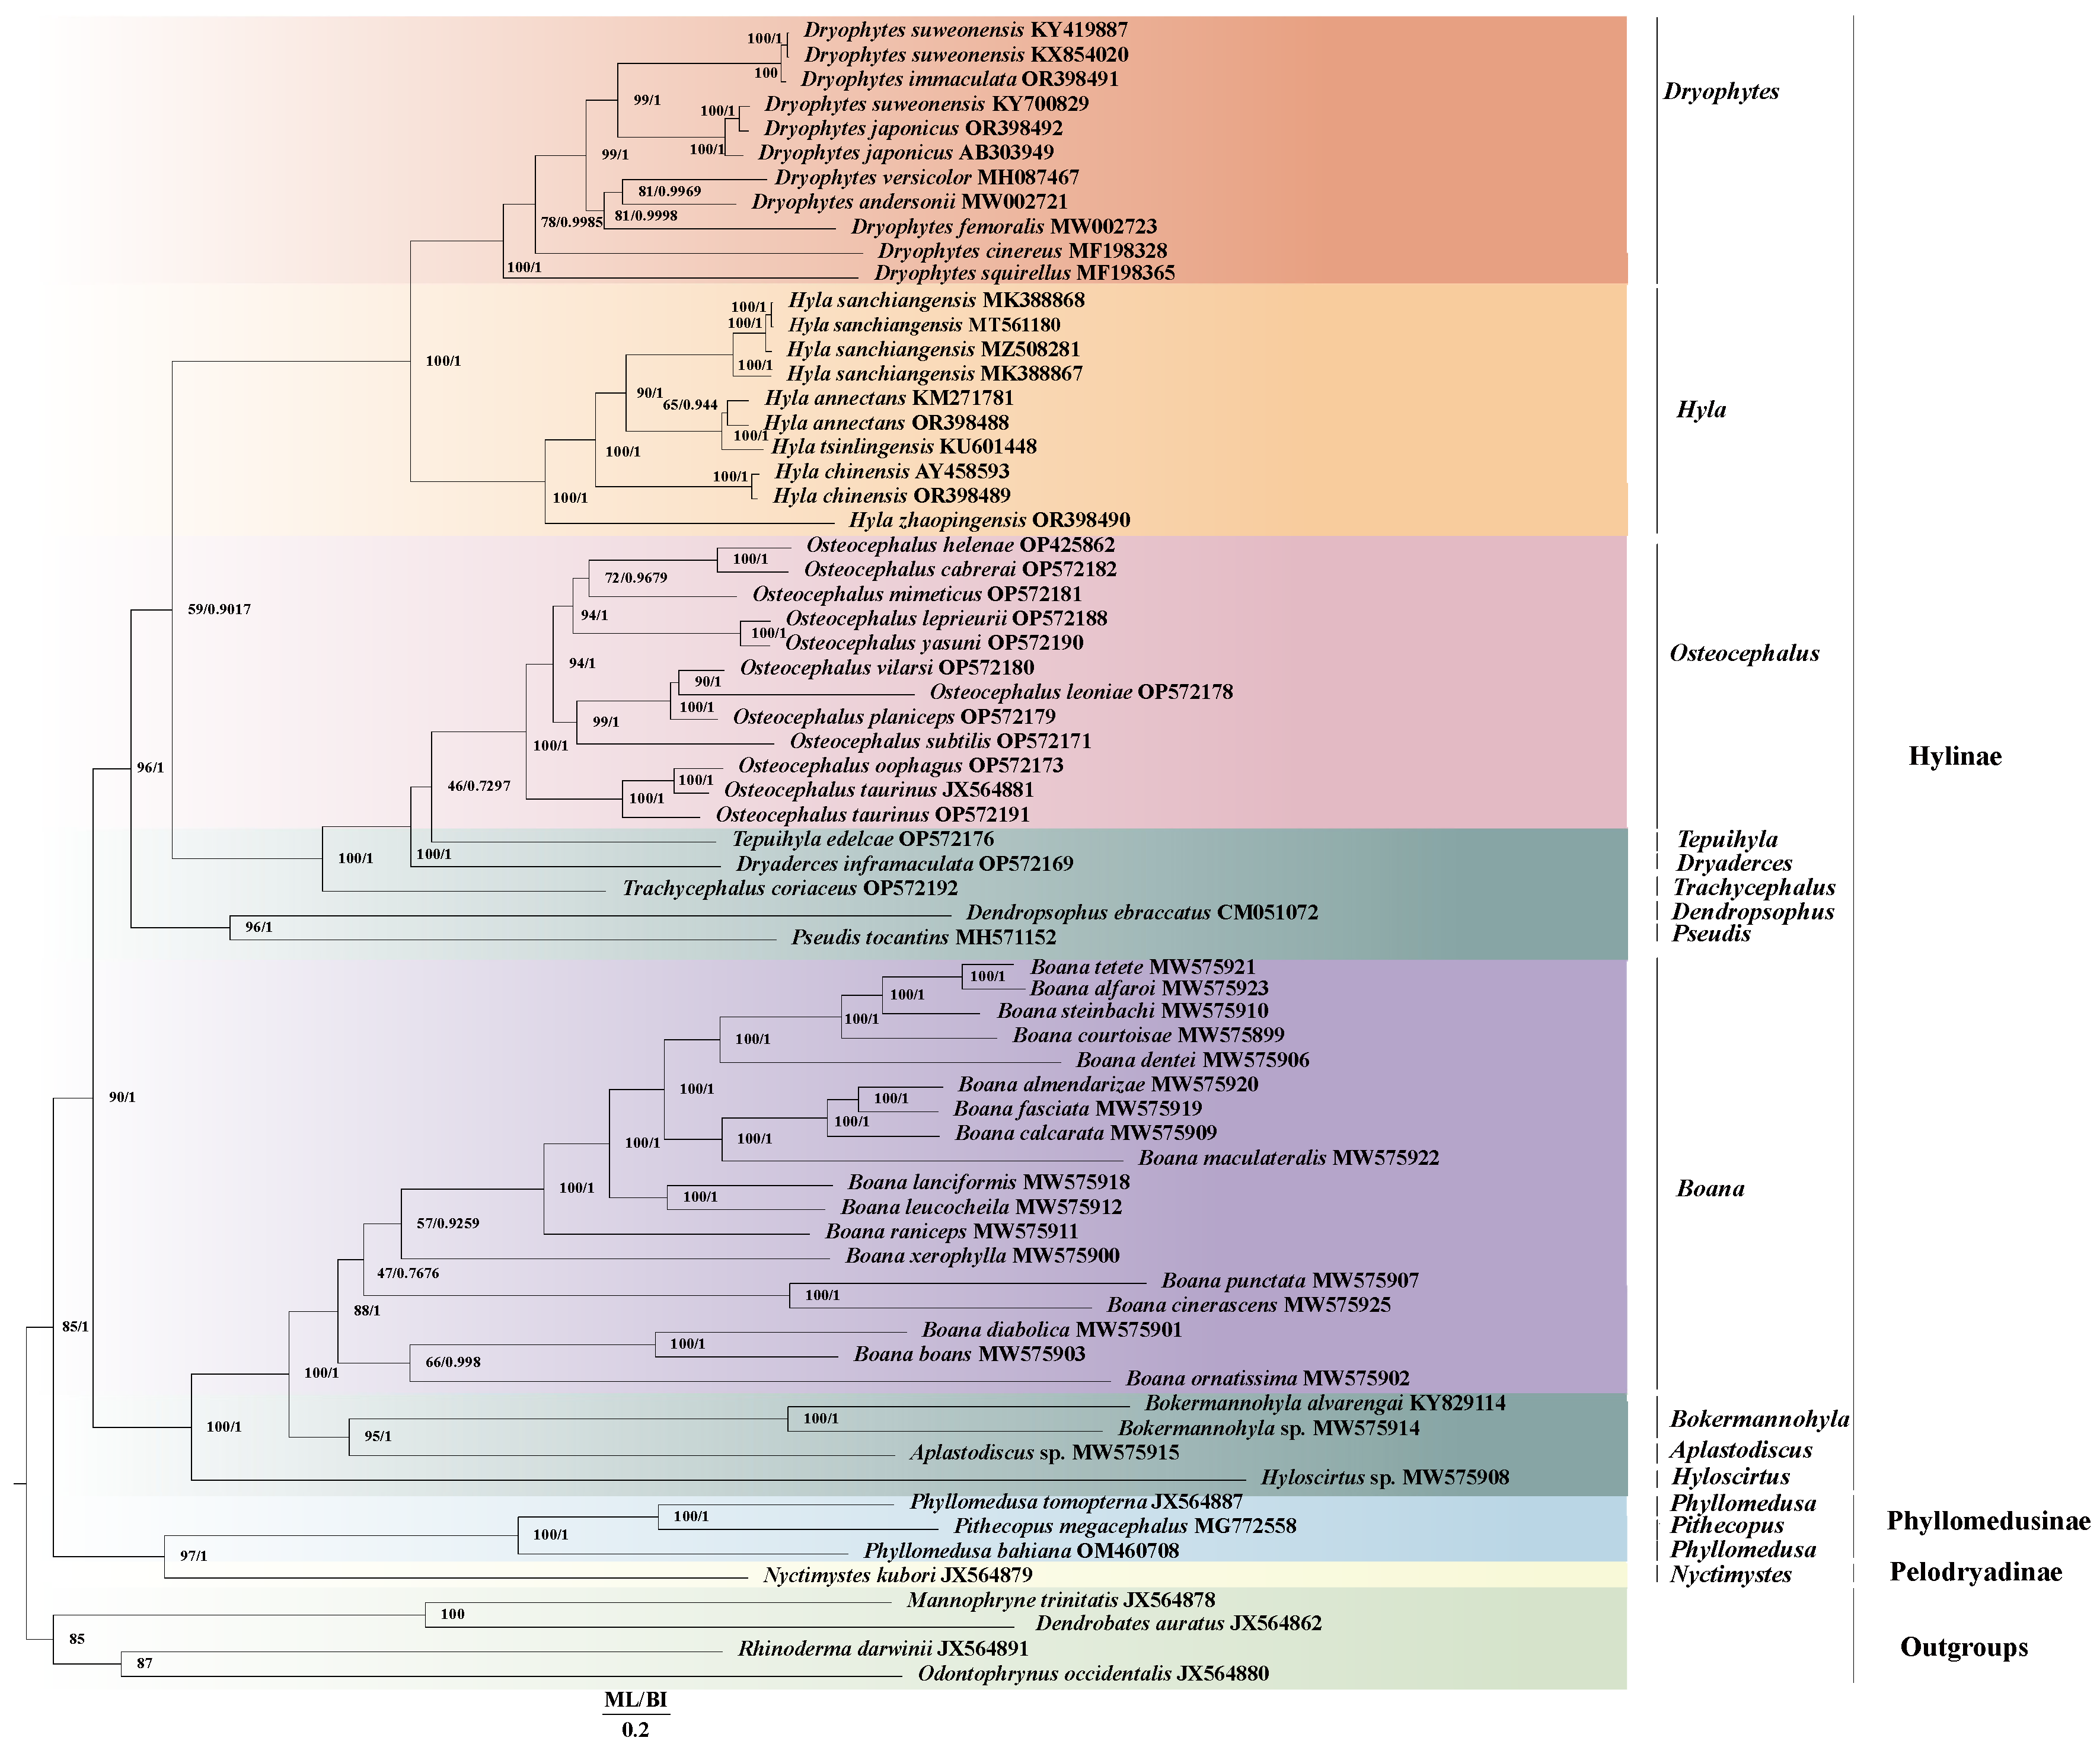
2.2. Genetic Distance and Phylogenetic Relationships

The tree results of first-, second- and third-position codon constructions are shown in Figure 3, and the tree results of the first- and second-position constructions are shown in Figures S7 and S8. We found higher confidence levels (CLs) in results using first-, second- and third-position conformational trees, and so these data were used in this study. The results from the construction of the phylogenetic trees showed that this study included three subfamilies of Hylidae, including Hylinae, Phyllomedusinae and Pelodryadinae. The results showed that Pelodryadinae and Phylomedusinae converged into one branch, and then converged with Hylidae. The phylogenetic relationship of ((((((((((Dryophytes + Hyla) + Osteocephalus) + Dryaderces) + Tepuihyla) + Trachycephalus) + (Dendropsophus + Pseudois)) + Boana) + Bokermannohyla) + Aplastofdiscus) + Hyloscirtus) appeared in the Hylinae subfamily. This research supported Dullman’s findings [58] that Hyla and Dryophytes were monophyletic, and the monophyletic nature of the Hylidae was also supported in this study.
In order to resolve the dispute about the phylogenetic relationships of D. suweonensis, D. japonicus and D. immaculata, we analyzed the genetic distance of all relevant sequences on the NCBI (accessed on 20 June 2023) as well as the two sequences for D. japonicus and D. immaculata reported in this study. The results shown in Table 2 indicate that the genetic distance between D. suweonensis (KY700829) and the other two D. suweonensis samples (KX54020 and KY419887) [60,61] was relatively large at 12.2%, and was closer to the D. japonicus sequences reported earlier (AB303949) [62] and reconfirmed in this study. In addition, the phylogenetic tree (Figure 3) showed that the sequences of D. suweonensis (KY700829) and two D. japonicus species were clustered together, which may be due to an error in the identification of the sequence of D. suweonensis (KY700829).

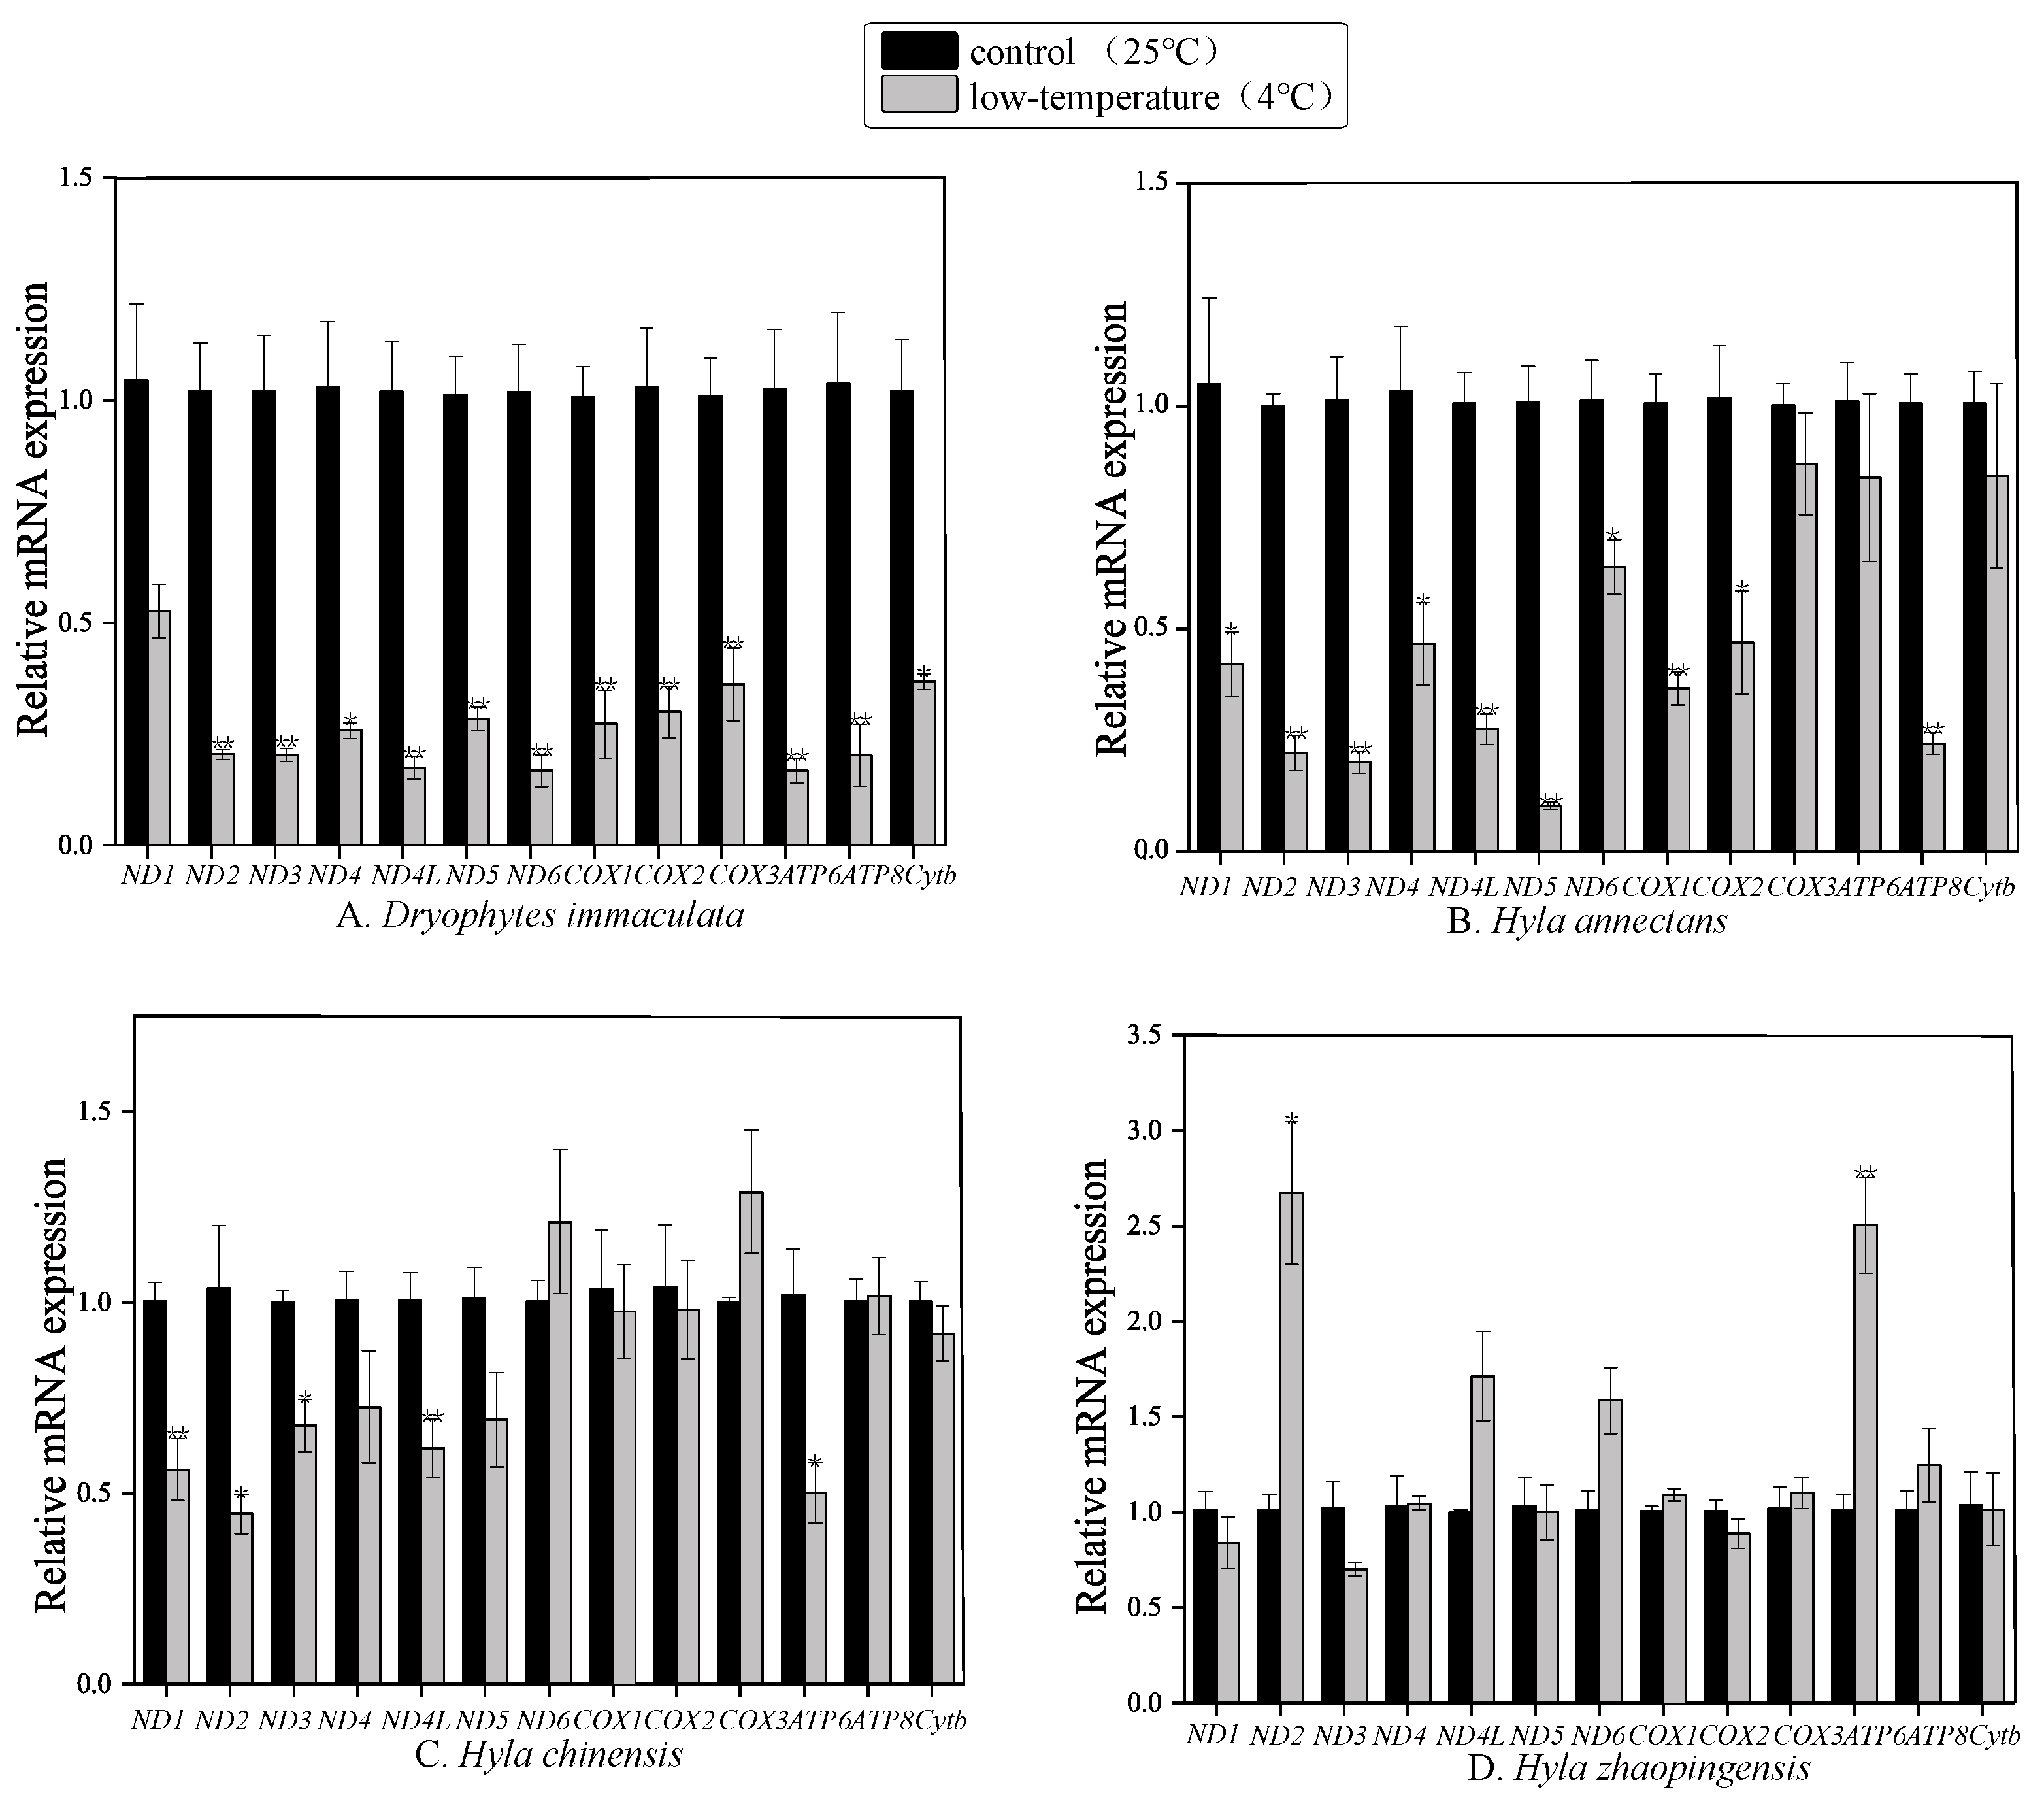
2.3. Effect of Cold Exposure on Transcript Levels of PCGs

Relative transcript levels of the 13 mitochondrial protein-coding genes from the four species of Hylidae were obtained from liver samples and analyzed by RT-qPCR to compare mRNA levels in liver of control frogs held at 25 °C with frogs transferred to 4 °C for 24 h (hypothermia group) (Figure 4). The original data are shown in Table S3. The results showed that, compared with the control group (24 °C), mitochondrial gene expression in liver of the four Hylidae species was significantly altered in response to 24 h cold exposure at 4 °C.
Transcript levels of two genes in H. zhaopingensis liver (ND2 and ATP6) were significantly elevated (p < 0.05) in response to cold exposure by 2.67 ± 0.37 and 2.50 ± 0.25-fold, respectively (Figure 4D). In contrast, transcript levels in liver of D. immaculata, H. annectans and H. chinensis were unchanged or significantly reduced.
In D. immaculata, transcript levels of 12 out of 13 mitochondria genes were significantly reduced under cold exposure (p < 0.05). Transcript levels of ND2, ND3, ND4, ND4L, ND5, ND6, COX1, COX2, COX3, ATP6, ATP8 and Cytb were reduced by 0.21 ± 0.01, 0.20 ± 0.02, 0.26 ± 0.02, 0.18 ± 0.03, 0.29 ± 0.03, 0.17 ± 0.04, 0.27 ± 0.08, 0.30 ± 0.06, 0.36 ± 0.08, 0.17 ± 0.03, 0.20 ± 0.07 and 0.37 ± 0.02-fold, respectively, as compared with controls.
In H. annectans liver transcripts of 10 genes (ND1, ND2, ND3, ND4, ND4L, ND5, ND6, COX1, COX2 and ATP8) were significantly decreased in response to cold exposure, with reductions by 0.42 ± 0.07, 0.22 ± 0.04, 0.20 ± 0.02, 0.47 ± 0.09, 0.28 ± 0.03, 0.10 ± 0.01, 0.64 ± 0.06, 0.37 ± 0.04, 0.47 ± 0.12 and 0.24 ± 0.02-fold, respectively, as compared with controls.
Cold exposure at 4 °C had a lesser effect on mitochondrial gene expression in H. chinensis. Five mitochondrial genes showed significantly reduced expression. Transcript levels of ND1, ND2, ND3, ND4L and ATP6 were reduced by 0.56 ± 0.08, 0.45 ± 0.05, 0.68 ± 0.07, 0.62 ± 0.08 and 0.50 ± 0.08-fold, respectively, as compared with controls.

3. Discussion

3.1. Mitogenome Structure, Genetic Distance and Phylogeny of Hylidae

A non-coding region with a length of about 35 bp was found between trnS1 and ND5 in the five Hylidae sequences evaluated in this study. This non-coding region has been found in many species of Hylidae [62,63,64,65,66,67,68], but did not exist in D. versicolor [54]. Whether this is the feature of all members of Hylidae will require more sequences to be assessed. Since D. versicolor is a North American species, the absence of this non-coding region might suggest a characteristic unique to Asian species of Hylidae. In the previous concept, the non-coding region was considered to be non-functional, but the current study has made progress in annotating these non-coding regions, and the function of this non-coding region needs further research [69].
The genetic distance between D. immaculata and D. suweonensis (KY419887 and KX854020) [60,61] in this study was only 0.8%, and the two species also converged into one branch on the phylogenetic tree. Therefore, at the molecular level, it appeared that the relationship between the two species appeared very close, which was consistent with previous results [54]. However, due to a lack of morphological and other information on D. suweonensis, further research is needed.

3.2. Different mt Gene Expression between Different Species of Dryophytes and Hyla

In D. immaculata, H. annectans and H. chinensis, all genes that showed significant differences were reductions in expression in response to low-temperature exposure. However, in H. zhaopingensis, expression of both ND2 and ATP6 genes was strongly and significantly increased, with an upward trend also seen for ND4L and ND6. Previous studies focused mainly on the physiology of frogs, but in fact, temperature-adaptive transformation of gene expression is a common mechanism of physiological adaptation, particularly for seasonal adaptation to changing environmental temperatures [70]. Due to the close correlation between antioxidant defense and freeze tolerance [47], protein-coding gene expression in the different complexes of mitochondria, which are metabolic energy centers, will very likely change when poikilothermic animals need to adjust to a low-temperature environment. Hence, down-regulation of mitochondrial activity is a simple way to promote entrance into a dormancy by establishing a low-energy metabolic pathway and reducing the demand for ATP, so as to preserve the fuel required for long-term survival in low-temperature environments, particularly when food sources are unavailable during the winter season [71]. This inhibition is likely also the reason for the significant decrease in the expression levels of multiple genes in mitochondria.
We found that only the ND2 gene was significantly different in its expression pattern among the four Hylidae, and in the three species with reduced ND2 expression, ND3 and ND5 gene expression was also significantly decreased. In fact, there are many more species that show genetic differences in ND gene expression in response to various stresses. The proteins encoded by these genes are concentrated in mitochondrial complex I, and positive selection sites in previous studies were also concentrated mostly in mitochondrial complex I [65]. Mitochondrial complex I is a large enzyme and is the main entry point for electrons delivered from nicotinamide adenine dinucleotide (NADH) into the respiratory chain [72]. Complex I oxidizes NADH, transfers electrons to ubiquinone (CoQ) and is generally considered to be the site of the main reactive oxygen species (ROS) producing enzyme in mitochondria, which is closely related to energy production [73]. Not surprisingly, the strong response of the ND series of genes is closely related to a change in mitochondrial energy metabolism.
With the exception of H. zhaopingensis, the Hylidae family members analyzed in this study all showed a downward trend in mitochondrial gene expression under 4 °C low-temperature stress. That is, reduced demand for ATP lowers metabolic rate so as to prolong survival time. Among these genes, the most responsive changes in expression occurred in D. immaculata with the expression of 12 out of 13 mitochondrial-encoded proteins showing strong and significant down-regulation in response to decreased temperature. Compared with H. annectans and H. chinensis, and except for the ND series genes, the expression of all COX series, ATP genes and Cytb genes in D. immaculata were also significantly reduced in response to low temperature. COX series genes are located in cytochrome c oxidase (Complex IV), the last and rate-limiting step in the respiratory chain and closely related to prevention of the formation of ROS [74]. The ATP series genes are located in ATP synthase (Complex V), which is a key enzyme in cell respiration [75]. Cytb is located in mitochondrial complex III and catalyzes the transfer of electrons from succinic acid and nicotinamide adenine dinucleotide-linked dehydrogenase to mitochondrial-encoded cytochrome b [76]. In addition, the ND series genes located on complex I regulate the oxidation of NADH. The decrease in expression levels of these genes directly affects multiple links of the respiratory chain and can lead to reduced activity of related respiratory chain enzymes, blockage of mitochondrial electron transport and the activity of electron transfer6 [77]. Hence, a down-regulation of mitochondrial gene expression can lead to a decrease in ATP production, leading to less harmful reactive oxygen species that help organisms to combat cold environments.
Among various species, there are generally significant differences in thermal tolerance limits and the ability to regulate these limits in a temperature-adaptive manner among species living in variable temperatures [69]. Including H. zhaopingensis in this study, we also showed that the expression of mitochondrial-encoded proteins increased under low-temperature stress. These increases in mitochondrial gene expression in H. zhaopingensis mainly affected mitochondrial respiratory chain complexes I and V that include the NADH dehydrogenases and ATP synthase, thus increasing the expression of key enzymes of the respiratory chain complex. This phenomenon is similar to the principle of increased mitochondrial expression in some species. For example, transcription of the mitochondrial genes ATP6/8, ND4 and 16S RNA in the freeze-tolerant wood frog, Rana sylvatica, was strongly up-regulated in liver and brain during whole body freezing (−2.5 °C, 24 h) [47], and the expression of ATP6 and ATP8 in mitochondria of tilapia fish, Oreochromis aureus, increased at 12 °C compared with that at 24 °C [78]. This also shows that species from different regions may adapt to different temperatures and/or have different adaptability to the same temperature.

3.3. The Relationship between Mitochondrial Gene Expression and Temperature Adaptation

According to the above theory, we chose D. immaculata as the most suitable species for low-temperature studies among the four frog species for three reasons. The first was that, compared to the Hyla genus, the Dryophytes genus is distributed at higher latitudes and these frogs live in colder environments. Bozinovic et al. [79] proposed that the tolerance range of organisms is related to their phenotypic flexibility, so the physiological flexibility of individuals, species and populations should increase with latitude. Therefore, D. immaculata was more likely to be adaptable to low-temperature stress. After prolonged exposure to low temperature, this species can also quickly adjust to temperature changes and actively reduce energy consumption, thus obtaining a longer survival time. The second reason was related to the distribution range, that is, the adaptation of organisms to a long-term living environment. D. immaculata is widely distributed in China, ranging from Guangdong in the south to Heibei in the north. By contrast, Hyla chinensis is mainly distributed in southern China, H. annectans is mainly distributed in the southwest and H. zhaopingensis is distributed in Zhaoping, Guangxi (http://www.amphibiachina.org/, accessed on 20 June 2023). Overall, this indicates that D. immaculata is a more adaptable frog that can endure different temperatures. Finally, according to the phylogenetic results for H. zhaopingensis, which is located at the base of the genus, and the research by Li et al. [11] and Yan et al. [57], we hypothesized that the Dryophytes genus originated in the north and spread southward, whereas the Hyla genus originated in the south and spread north. This also appears to be why D. immaculata is better adapted to low temperatures.
The climate variability hypothesis assumes that tropical organisms should have lower physiological plasticity due to the reduced thermal variability in which they evolved and live [80,81,82]. In line with this theory, temperate species exhibit tolerance over a wider temperature range and have a larger thermal safety threshold than tropical species [83,84]. This is also the reason why the species of H. zhaopingensis located at low latitudes are the least adapted to low temperatures. The monthly average temperature in the winter (December to February) from 1971 to 2010 in the region where H. zhaopingensis lives is higher than 8 °C (China National Climate Center, http://cmdp.ncc-cma.net/cn/index.htm, accessed on 22 June 2023). In addition, Hyla zhaopingensis has the narrowest distribution range among the four species [11]. Such a narrow distribution range can also lead to an inability to adapt to low temperatures. For all of the above reasons, H. zhaopingensis shows little or no ability to adapt to low temperatures, such as 4 °C, and cannot enter a hibernation state. Instead, when faced with cold temperatures, this species entered a state of metabolic disorder. The mitochondria of this species cannot enter low-energy metabolic pathways, but instead attempts are made to restore the frog to a normal temperature by increasing the expression of encoded proteins and increasing ATP production to generate more heat. Indeed, if the temperature falls below 0 °C, ice crystals can form in the frog’s body, causing physical damage to cells, subcellular structure and the compartmentation of subcellular organelles, eventually leading to its death [47,85].
The present study found significant differences in gene expression and cold tolerance mechanisms among the different species of Hylidae under the same temperature stress, indicating that there were differences in the temperature tolerance range and cold tolerance of these four species. The results of this study indicate that H. zhaopingensis is the most ill-adapted species for low-temperature conditions among the four species studied and is also the species that is predictably the most susceptible to extinction under extreme environmental temperature change. In addition, because of its narrow distribution and low biodiversity, H. zhaopingensis could become extinct if extreme low temperature caused the death of a large number of individuals. Therefore, the study of mitochondrial genome expression changes under low-temperature stress can be used as a monitoring method to determine whether species are vulnerable to extinction, as well as to provide ideas for amphibian diversity conservation. In addition, transcriptome technology has gradually developed over the past two years, and by studying the transcriptome’s response to temperature stress, we can better understand the genes and biochemical pathways that are critical for physiological adaptation to a warmer environment and gain insight into the regulatory changes that accompany adaptation on evolutionary timescales [86].

4. Materials and Methods

4.1. Sample Collection and Cold-Stress Treatment

Samples of D. immaculata were collected from Chuzhou, Anhui, China (24.14° N, 110.18° E), samples of H. annectans were from Anshun, Guizhou, China (26.24° N, 105.93° E), samples of H. chinensis were collected from Suzhou, Jiangsu, China (31.30° N, 120.62° E) and samples of H. zhaopingensis were from Maoming, Guangdong, China (21.64° N, 110.91° E). All frogs were collected in July 2022, with 20 frogs collected at each location. The samples for the same species consisted of male frogs with similar body sizes. All animals were washed in a tetracycline bath and placed in a plastic incubator (90 cm × 40 cm × 60 cm) at 25 °C for one week. Ten from each group were randomly selected from the 25 °C temperature group and placed in a plastic box under a wet towel at 25 °C for 24 h as the control group. At the same time, ten frogs were subjected to 4 °C hypothermia stress for 24 h as the hypothermia stress group. In this study, rapid freezing was used, that is, frogs at 25 °C were directly exposed to 4 °C without undergoing a slow cooling process. Subsequently, the control group and the hypothermic temperature group were euthanized by pithing; then, the livers were rapidly dissected and frozen in liquid nitrogen. Subsequently, liver samples were stored in an ultra-low-temperature freezer at −80 °C until use. In addition, this study also included sequencing of the D. japonicus mitogenome.

4.2. Total DNA Extraction, Primer Design, PCR Amplification and Sequencing

Tissue samples were obtained from a clipped toe of each specimen and stored in 100% ethanol at −40 °C for subsequent DNA extraction. Total genomic DNA was extracted using the Ezup Column Animal Genomic DNA Purification Kit (Sangon Biotechnology, Shanghai, China) according to the manufacturer’s manual. The methods used for DNA extraction and PCR amplification are as described by Cai et al. [87] and the general primers used in this study were as described by Zhang et al. [88]. Sequence proofreading was then performed, and specific primers were designed using Primer Premier 5.0 (Primer Biosoft International, San Francisco, CA, USA) based on the fragments measured by the universal primers. To further identify the species and ensure that each quantitative sample for mitochondrial gene expression was the same species with low gene distance difference, DNA was extracted from the toe of all samples and the COX1 gene was amplified by PCR. All PCR products were purified and sequenced by Sangon Biotechnology (Shanghai, China). Nei proposed in 1971 and 1972 that the genetic distance between genes (D = −logeI) could be used to measure genetic differences between different populations [89], and this method has been widely used in species identification, population classification and genetic correlation analysis of species [90]. Results obtained from the genetic distance method for COX1 are shown in Table S4. Samples with genetic distance less than 1% were selected for quantitative experiments.

4.3. Mitogenome Annotation and Sequence Analyses

Seqman in DNASTAR v.6.0 was used for splicing the sequencing results from the four species and Sanger sequencing was manually checked and assembled [91]. All tRNA genes were annotated using MITOS2 (http://mitos2.bioinf.uni-leipzig.de/index.py, accessed on 20 June 2023) [92]. We used MEGA 11.0 [93] to identify and annotate 12S rRNA, 16S rRNA and 13 protein-coding genes (PCGS), and we compared their homology. The tRNAscan—SE1.21 program [94] (http://lowelab.ucsc.edu/tRNAscan-SE/, accessed on 20 June 2023) and the MITOS2 program [92] were used to predict the cloverleaf secondary structure of all tRNA genes. RNAalifold (http://rna.tbi.univie.ac.at/cgi-bin/RNAWebSuite/RNAalifold.cgi, accessed on 20 June 2023) was used to draw all tRNA genes of the replication origin region and secondary structure [95]. PhyloSuite [96] was used to identify the 13 protein-coding genes and calculate relative synonymous codon usage (RSCU) and AT content, and AT skewness was calculated using AT skew = (A − T)/(A + T) and GC skew = (G − C)/(G + C) [97].

4.4. Genetic Distance and Phylogenetic Analyses

Using MEGA11 [66], the genetic distances of all data available for D. immaculata, D. suweonensis and D. japonicus in the NCBI and the experimental samples were calculated using the Kimura 2-parameter model [98]. We downloaded 63 mitogenomes of the family Hylidae from the NCBI to study the relationships between our five sequences and other species of the family Hylidae. Table S8 shows GenBank numbers for the 68 species that were used to construct phylogenetic trees. The 13 protein-coding genes were extracted in PhyloSuite [96] for MAFFT [99] comparison, and conserved regions were selected using Gblock [100] and then linked together using concatenate sequence in PhyloSuite [96]. DAMBE [101] was used to analyze the saturation of the third-codon positions. The results are shown in Table S5. This study used first-, second-, and third-codon positions as well as the first- and second-codon positions for tree construction since the third-codon position had a slightly saturated state. The optimal partition and evolutionary model were selected using the Bayesian information criterion (BIC) [102] in PartitionFinder v2.1.1 [103] (Tables S6 and S7). The partition results were used for Bayesian inference (BI) analysis in MrBayes version 3.2 [104], and the posterior probability (PP) was calculated mainly via the Markov Chain Monte Carlo method (MCMC). Starting from the random tree, 10 million generations were run, and samples were taken every 1000 generations. Based on convergence (<0.01), the first 25% of runs were discarded as aging. The remainder was used to construct the BI phylogenetic tree. The partition result obtained from PartitionFinder [103] was used in RAxML-NG v1.2.1 [105] software to the build ML tree. The model was GTR + I + G, which was run 1000 times in total, and the bootstrap value of the ML tree was 100. Figtree v1.4.4 [106] was used to visualize the structure of a tree. Genus names, and GenBank accession numbers and their references for the species used to construct the phylogenetic tree, are found in Table S8.

4.5. RNA Extraction and cDNA Synthesis

Four samples each of the 4 °C groups and the 25 °C groups of the four species were used for RNA extraction. RNA was obtained by using the RNA extraction kit from Chengdu Fuji Biological Company (Chengdu, China) according to the manufacturer’s instructions. Next, the concentration of the obtained RNA was measured with infinite M200pro enzyme label and the absorbance at 260 nm and 280 nm was measured to keep the A260/280 value greater than 1.7 [107], and the measured OD value was recorded. The RNA reverse transcription mixture was 10 µL in total, including 2 µL PrimeScriptTM RT Master Mix and 8 µL of remaining RNase-Free ddH2O containing the RNA sample. The formula: RNA concentration = 500 ng/OD value was used to calculate the required RNA concentration and water amount. Reverse transcription sampling was performed on a super-clean bench, and the sampling process was carried out on ice. After mixing, the PCR reaction was performed using reverse transcription; PCR parameters were 37 °C 15 min, 85 °C 5 s, 4 °C +∞. The obtained cDNA was stored in an ultra-low-temperature freezer at −80 °C.

4.6. Quantitative Primer Design and Relative mRNA Quantification

Based on the mitochondrial whole genome sequence of multiple species of Hylidae, as determined by conventional PCR, the gene sequences and lengths of the 13 protein-coding genes were obtained. Primer Primier 6.0 (Primer Biosoft International) was used to design primers based on the complete sequence of D. japonicus, D. immaculata, H. annectans, H. chinensis and H. zhaopingensis. Appropriate primers were selected for subsequent formal quantitative experiments. The specific primers used in this study are shown in Table S9. Using EASY Dilution, the cDNA from each sample was diluted to 5 different concentrations of 10−1, 10−2, 10−3, 10−4 and 10−5. Each sample used was 20 µL and included 10 µL SYBR Premix Ex Taq II (2×), 0.4 µL ROX Reference Dye (50×), 0.8 µL forward and reverse primers (10 µMol), 6 µL ddH2O and 2 µL RT reactants (cDNA) for RT-qPCR. Quantitative primers were screened in the StepOnePlus™ PCR reaction system under the following conditions: (a) first stage predenaturing at 95 °C, 30 s, one cycle; (b) PCR reaction: 95 °C, 5 s, and 55 °C, 30 s, for 40 cycles; and finally, the formation solution curve was 95 °C, 15 s, 60 °C, 1 min, and 95 °C, 15 s. Real-time fluorescence quantitative PCR analyses using StepOnePlus™ [108], with β-actin used as an internal reference gene, established a standard curve and three technical replicates were performed for each gene. The upstream primer used for β-actin was GATCTGGCATCACACTTTCT, and the downstream was GTGACACCATCACCAGA. cDNA was diluted with double-distilled water (ddH2O), and the dilution ratio was based on the efficiency of primer amplification. In this study, cDNA was diluted tenfold. Quantitative experiments were performed on a super-clean bench using the SYBR Premix ExTaq kit. The system used was the same as the primer screening system. The design reaction conditions were as follows: 95 °C 30 s, (95 °C 5 s, 55 °C 30 s) for 40 cycles, then 95 °C 15 s, 60 °C 1 min, 95 °C 15 s.

4.7. Data Analysis

Transcript levels of the 13 mitochondrial protein-coding genes were measured using RT-qPCR and StepOne Software v2.1 [108] software, with β-actin as the reference gene, and the expression of each gene was calculated as 2−ΔΔCt. The values for each group were saved as mean ± SE, and SPSS21.0 (SPSS, Inc., Chicago, IL, USA) was used to analyze differences between the values by an independent sample t-test, where p < 0.05 was accepted as a significance difference for n = 3 repeats [109,110]. We calculated the multiple relationships between the relative expression levels of the low-temperature groups and the control groups. The expression levels of the 13 mitochondrial protein-coding genes obtained were then mapped with Origin2021 (Origin Lab, Northampton, MA, USA) to compare the changes in gene expression levels.

5. Conclusions

It may be a long evolutionary process for amphibians to adapt to lower temperatures. Different species of the Hylidae have different response modes when subjected to low-temperature stress. D. immaculata, H. annectans and H. chinensis, which are located at slightly higher latitudes, can all enter a state of hypometabolism in response to cold stress, thereby reducing energy consumption and reducing the expression of some genes in mitochondria. However, H. zhaopingensis, which lives at low latitudes and has a narrow distribution, appears to have insufficient defense mechanisms against low-temperature damage, which can result in metabolic disorder. In the context of extreme low temperatures occurring randomly in a warm winter, H. zhaopingensis is probably the most likely to become locally extinct among the four species. By studying and comparing their expression levels, we can infer which one of these four frogs is more vulnerable to extinction and their adaptive plasticity to the environment.

Supplementary Materials

The following supporting information can be downloaded at: https://www.mdpi.com/article/10.3390/ijms25115967/s1. References [111,112,113,114,115,116] are cited in the Supplementary Materials.

Author Contributions

Conceptualization, Y.-H.H., Y.-N.Y., K.L. and D.-N.Y.; data curation, Y.-H.H., Y.-N.Y., K.L., K.B.S., J.-Y.Z., S.-S.Z. and D.-N.Y.; formal analysis, Y.-H.H., Y.-N.Y., K.L. and J.-Y.Z.; funding acquisition, D.-N.Y.; investigation, Y.-H.H.; methodology, Y.-H.H., S.-S.Z. and D.-N.Y.; project administration, Y.-H.H., S.-S.Z. and D.-N.Y.; writing—original draft, Y.-H.H., Y.-N.Y. and K.L.; writing—review and editing, Y.-H.H., Y.-N.Y., K.L., K.B.S., S.-S.Z., J.-Y.Z. and D.-N.Y. All authors have read and agreed to the published version of the manuscript.

Funding

This research was supported by the National Natural Science Foundation of China (No. 31801963). The funders had no role in study design, data collection and analysis, decision to publish or preparation of the manuscript.

Institutional Review Board Statement

All animal care protocols were previously approved by the Animal Care Committee (protocol # ZSDW202006, ethics approval date 20 January 2020) of Zhejiang Normal University in accordance with the guidelines provided by the Chinese Council on Animal Care.

Informed Consent Statement

Not applicable.

Data Availability Statement

Data to support this study are available from the National Center for Biotechnology Information (https://www.ncbi.nlm.nih.gov) (accessed on 20 June 2023). The GenBank numbers are OR398488-OR398492.

Acknowledgments

The authors are grateful for the contributions made to the data analyses by Yue Ma and for help in the collection of frog samples by Guo-Hua Ding from Lishui College, China. The authors are also grateful for the help of the Zhejiang Wuyanling National Nature Reserve, Taishun, China.

Conflicts of Interest

The authors declare no conflicts of interest.

References

  1. Faivovich, J. A new species of Scinax (Anura: Hylidae) from Misiones, Argentina. Herpetol. J. 2005, 61, 69–77. [Google Scholar] [CrossRef]
  2. Garda, A.A.; Cannatella, D.C. Phylogeny and biogeography of paradoxical frogs (Anura, Hylidae, Pseudae) inferred from 12S and 16S mitochondrial DNA. Mol. Phylogenetics Evol. 2007, 44, 104–114. [Google Scholar] [CrossRef]
  3. Frost, D.R. Amphibian Species of the World: An Online Reference, Version 6.2. Available online: https://amphibiansoftheworld.amnh.org (accessed on 20 June 2023).
  4. Amphibia China. The Database of Chinese Amphibians. Electronic Database. Available online: http://www.amphibiachina.org/ (accessed on 20 June 2023).
  5. Boettger, O. Aufzählung Einiger neu Erworbener Reptilien und Batrachier aus Ost-Asien; Bericht die Senckenbergische Naturforschende Gesellschaft in Frankfurt am Main: Franckfort, Germany, 1888; p. 189. [Google Scholar]
  6. Jerdon, T.C. Notes on Indian herpetology. Proc. Asiat. Soc. Bengal 1870, 1870, 66–85. [Google Scholar]
  7. Günther, A.C.L.G. Neue Batrachier in der Sammlung des britischen Museums. Arch. Für Naturgeschichte Berl. 1858, 24, 319–328. [Google Scholar] [CrossRef]
  8. Tang, Y.X.; Zhang, Z.J. A new species of amphibian from Guangxi. Acta Zootaxon. Sin. 1984, 9, 441–443. [Google Scholar]
  9. Suwon, C.; Eugene, C.; Inna, V.; Jong Ryol, C.; Hang, L.; Mi-Sook, M. Genetic diversity of Korean tree frog (Hyla suweonensis and Hyla japonica): Assessed by mitochondrial cytochrome b gene and cytochrome oxidase subunit I gene. Korean J. Herpetol. 2012, 4, 31–41. [Google Scholar]
  10. Park, S.; Jeong, G.; Jang, Y. No reproductive character displacement in male advertisement signals of Hyla japonica in relation to the sympatric H. suweonensis. Behav. Ecol. Sociobiol. 2013, 67, 1345–1355. [Google Scholar] [CrossRef]
  11. Li, J.T.; Wang, J.S.; Nian, H.H.; Litvinchuk, S.N.; Wang, J.; Li, Y.; Rao, D.Q.; Klaus, S. Amphibians crossing the Bering Land Bridge: Evidence from holarctic treefrogs (Hyla, Hylidae, Anura). Mol. Phylogenetics Evol. 2015, 87, 80–90. [Google Scholar] [CrossRef]
  12. Dufresnes, C.; Litvinchuk, S.N.; Borzee, A.; Jang, Y.; Li, J.T.; Miura, I.; Perrin, N.; Stock, M. Phylogeography reveals an ancient cryptic radiation in East-Asian tree frogs (Hyla japonica group) and complex relationships between continental and island lineages. BMC Evol. Biol. 2016, 16, 253. [Google Scholar] [CrossRef]
  13. Borzée, A.; Kong, S.; Didinger, C.; Nguyen, H.Q.; Jang, Y. A ring-species or a ring of species? Phylogenetic relationship between two treefrog species around the Yellow Sea: Dryophytes suweonensis and D. immaculatus. Herpetol. J. 2018, 28, 160–170. [Google Scholar]
  14. Borzee, A.; Messenger, K.R.; Chae, S.; Andersen, D.; Groffen, J.; Kim, Y.I.; An, J.; Othman, S.N.; Ri, K.; Nam, T.Y.; et al. Yellow sea mediated segregation between North East Asian Dryophytes species. PLoS ONE 2020, 15, e0234299. [Google Scholar] [CrossRef] [PubMed]
  15. Root, T.L.; Price, J.T.; Hall, K.R.; Schneider, S.H.; Rosenzweig, C.; Pounds, J.A. Fingerprints of global warming on wild animals and plants. Nature 2003, 421, 57–60. [Google Scholar] [CrossRef] [PubMed]
  16. Parmesan, C. Ecological and evolutionary responses to recent climate change. Annu. Rev. Ecol. Evol. Syst. 2006, 37, 637–669. [Google Scholar] [CrossRef]
  17. Rosenzweig, C.; Karoly, D.; Vicarelli, M.; Neofotis, P.; Wu, Q.; Casassa, G.; Menzel, A.; Root, T.L.; Estrella, N.; Seguin, B. Attributing physical and biological impacts to anthropogenic climate change. Nature 2008, 453, 353–357. [Google Scholar] [CrossRef] [PubMed]
  18. Houghton, J. Global warming. Rep. Prog. Phys. 2005, 68, 1343–1403. [Google Scholar] [CrossRef]
  19. Yousefkhani, S.S.H.; Yasser, A.; Naser, M.; Yousefabadi, F.; Gasimova, G. Response to global warming of Eichwald’s toad, Bufo eichwaldi Litvinchuk, Borkin, Skorinov and Rosanov, 2008 (Anura; Amphibia) in Iran and Azerbaijan. Folia Biol. 2022, 70, 119–125. [Google Scholar] [CrossRef]
  20. Araújo, M.B.; Thuiller, W.; Pearson, R.G. Climate warming and the decline of amphibians and reptiles in Europe. J. Biogeogr. 2006, 33, 1712–1728. [Google Scholar] [CrossRef]
  21. Raffel, T.R.; Romansic, J.M.; Halstead, N.T.; McMahon, T.A.; Venesky, M.D.; Rohr, J.R. Disease and thermal acclimation in a more variable and unpredictable climate. Nat. Clim. Change 2013, 3, 146–151. [Google Scholar] [CrossRef]
  22. Catenazzi, A. State of the world’s amphibians. Annu. Rev. Env. Resour. 2015, 40, 91–119. [Google Scholar] [CrossRef]
  23. Carey, C.; Alexander, M.A. Climate change and amphibian declines: Is there a link? Divers. Distrib. 2003, 9, 111–121. [Google Scholar] [CrossRef]
  24. Becker, C.G.; Fonseca, C.R.; Haddad, C.F.B.; Batista, R.F.; Prado, P.I. Habitat split and the global decline of amphibians. Science 2007, 318, 1775–1777. [Google Scholar] [CrossRef] [PubMed]
  25. Mosavi, J.; Vaissi, S.; Dastansara, N.; Sharifi, M. Effects of temperature on growth, development and survival in larvae of Pelophylax ridibundus (Pallas, 1771) (Amphibia: Anura): Linking global warming to amphibian development. Acta Zool. Bulg. 2017, 69, 541–546. [Google Scholar]
  26. Ron, S.R.; Duellman, W.E.; Coloma, L.A.; Bustamante, M.R. Population decline of the Jambato toad Atelopus ignescens (Anura: Bufonidae) in the Andes of Ecuador. J. Herpetol. 2003, 37, 116–126. [Google Scholar] [CrossRef]
  27. D’Amen, M.; Bombi, P. Global warming and biodiversity: Evidence of climate-linked amphibian declines in Italy. Biol. Conserv. 2009, 142, 3060–3067. [Google Scholar] [CrossRef]
  28. Zeisset, I.; Beebee, T. Amphibian phylogeography: A model for understanding historical aspects of species distributions. Heredity 2008, 101, 109–119. [Google Scholar] [CrossRef] [PubMed]
  29. Lannoo, M. Amphibian Declines: The Conservation Status of United States Species; University California Press: Berkeley, CA, USA, 2005; pp. 915–925. [Google Scholar]
  30. Adlassnig, W.; Schmidt, B.; Jirsa, F.; Gradwohl, A.; Ivesic, C.; Koller-Peroutka, M. The Arsenic–Antimony Creek at Sauerbrunn/Burgenland, Austria: A toxic habitat for amphibians. Int. J. Environ. Res. Public Health 2022, 19, 6010. [Google Scholar] [CrossRef] [PubMed]
  31. Aragón, P.; Rodríguez, M.; Olalla-Tárraga, M.; Lobo, J. Predicted impact of climate change on threatened terrestrial vertebrates in central Spain highlights differences between endotherms and ectotherms. Anim. Conserv. 2010, 13, 363–373. [Google Scholar] [CrossRef]
  32. Piha, H.; Luoto, M.; Piha, M.; Merilä, J. Anuran abundance and persistence in agricultural landscapes during a climatic extreme. Glob. Change Biol. 2007, 13, 300–311. [Google Scholar] [CrossRef]
  33. Girardello, M.; Griggio, M.; Whittingham, M.J.; Rushton, S.P. Models of climate associations and distributions of amphibians in Italy. Ecol. Res. 2010, 25, 103–111. [Google Scholar] [CrossRef]
  34. Dastansara, N.; Vaissi, S.; Mosavi, J.; Sharifi, M. Impacts of temperature on growth, development and survival of larval Bufo (Pseudepidalea) viridis (Amphibia: Anura): Implications of climate change. Zool. Ecol. 2017, 27, 228–234. [Google Scholar] [CrossRef]
  35. Costanzo, J.P.; Lee Jr, R.E. Cryoprotection by urea in a terrestrially hibernating frog. J. Exp. Biol. 2005, 208, 4079–4089. [Google Scholar] [CrossRef] [PubMed]
  36. Irwin, J.T.; Lee, J.R.E. Geographic variation in energy storage and physiological responses to freezing in the gray treefrogs Hyla versicolor and H. chrysoscelis. J. Exp. Biol. 2003, 206, 2859–2867. [Google Scholar] [CrossRef] [PubMed]
  37. Storey, K.B.; Storey, J.M. Molecular physiology of freeze tolerance in vertebrates. Physiol. Rev. 2017, 97, 623–665. [Google Scholar] [CrossRef] [PubMed]
  38. Biggar, K.K.; Dubuc, A.; Storey, K.B. MicroRNA regulation below zero: Differential expression of miRNA-21 and miRNA-16 during freezing in wood frogs. Cryobiology 2009, 59, 317–321. [Google Scholar] [CrossRef] [PubMed]
  39. Sullivan, K.J.; Biggar, K.K.; Storey, K.B. Transcript expression of the freeze responsive gene fr10 in Rana sylvatica during freezing, anoxia, dehydration, and development. Mol. Cell. Biochem. 2015, 399, 17–25. [Google Scholar] [CrossRef] [PubMed]
  40. Storey, J.M.; Wu, S.; Storey, K.B. Mitochondria and the frozen frog. Antioxidants 2021, 10, 543. [Google Scholar] [CrossRef] [PubMed]
  41. Berman, D.I.; Bulakhova, N.A.; Meshcheryakova, E.N. The Siberian wood frog survives for months underwater without oxygen. Sci. Rep. 2019, 9, 13594. [Google Scholar] [CrossRef] [PubMed]
  42. Varma, A.; Storey, K.B. Freeze-induced suppression of pyruvate kinase in liver of the wood frog (Rana sylvatica). Adv. Biol. Regul. 2022, 88, 100944. [Google Scholar] [CrossRef] [PubMed]
  43. Varma, A.; Storey, K.B. Hepatic citrate synthase suppression in the freeze-tolerant wood frog (Rana sylvatica). Int. J. Biol. Macromol. 2023, 242, 124718. [Google Scholar] [CrossRef]
  44. Biggar, K.K.; Storey, K.B. The emerging roles of microRNAs in the molecular responses of metabolic rate depression. J. Mol. Cell Biol. 2010, 3, 167–175. [Google Scholar] [CrossRef]
  45. Trzcionka, M.; Withers, K.W.; Klingenspor, M.; Jastroch, M. The effects of fasting and cold exposure on metabolic rate and mitochondrial proton leak in liver and skeletal muscle of an amphibian, the cane toad Bufo marinus. J. Exp. Biol. 2008, 211, 1911–1918. [Google Scholar] [CrossRef] [PubMed]
  46. Wu, Z.; Sainz, A.G.; Shadel, G.S. Mitochondrial DNA: Cellular genotoxic stress sentinel. Trends Biochem. Sci. 2021, 46, 812–821. [Google Scholar] [CrossRef] [PubMed]
  47. Roe, B.A.; Ma, D.; Wilson, R.; Wong, J. The complete nucleotide sequence of the Xenopus laevis mitochondrial genome. J. Biol. Chem. 1985, 260, 9759–9774. [Google Scholar] [CrossRef] [PubMed]
  48. Boore, J.L. Animal mitochondrial genomes. Nucleic Acids Res. 1999, 27, 1767–1780. [Google Scholar] [CrossRef] [PubMed]
  49. Wu, X.B.; Wang, Y.Q.; Zhou, K.Y.; Zhu, W.Q.; Nie, J.S.; Wang, C.L. Complete mitochondrial DNA sequence of Chinese alligator, Alligator sinensis, and phylogeny of crocodiles. Chin. Sci. Bull. 2003, 48, 2050–2054. [Google Scholar] [CrossRef]
  50. Sano, N.; Kurabayashi, A.; Fujii, T.; Yonekawa, H.; Sumida, M. Complete nucleotide sequence and gene rearrangement of the mitochondrial genome of the bell-ring frog, Buergeria buergeri (Family Rhacophoridae). Genes Genet. Syst. 2004, 79, 151–163. [Google Scholar] [CrossRef] [PubMed]
  51. Zhang, J.Y.; Zhang, L.P.; Yu, D.N.; Storey, K.B.; Zheng, R.Q. Complete mitochondrial genomes of Nanorana taihangnica and N. yunnanensis (Anura: Dicroglossidae) with novel gene arrangements and phylogenetic relationship of Dicroglossidae. BMC Evol. Biol. 2018, 18, 26. [Google Scholar] [CrossRef] [PubMed]
  52. Kurabayashi, A.; Usuki, C.; Mikami, N.; Fujii, T.; Yonekawa, H.; Sumida, M.; Hasegawa, M. Complete nucleotide sequence of the mitochondrial genome of a Malagasy poison frog Mantella madagascariensis: Evolutionary implications on mitochondrial genomes of higher anuran groups. Mol. Phylogenetics Evol. 2006, 39, 223–236. [Google Scholar] [CrossRef] [PubMed]
  53. Kurabayashi, A.; Yoshikawa, N.; Sato, N.; Hayashi, Y.; Oumi, S.; Fujii, T.; Sumida, M. Complete mitochondrial DNA sequence of the endangered frog Odorrana ishikawae (family Ranidae) and unexpected diversity of mt gene arrangements in ranids. Mol. Phylogenetics Evol. 2010, 56, 543–553. [Google Scholar] [CrossRef]
  54. Zhang, J.Y.; Luu, B.E.; Yu, D.N.; Zhang, L.P.; Al-Attar, R.; Storey, K.B. The complete mitochondrial genome of Dryophytes versicolor: Phylogenetic relationship among Hylidae and mitochondrial protein-coding gene expression in response to freezing and anoxia. Int. J. Biol. Macromol. 2019, 132, 461–469. [Google Scholar] [CrossRef]
  55. Jin, W.T.; Guan, J.Y.; Dai, X.Y.; Wu, G.J.; Zhang, L.P.; Storey, K.B.; Zhang, J.Y.; Zheng, R.Q.; Yu, D.N. Mitochondrial gene expression in different organs of Hoplobatrachus rugulosus from China and Thailand under low-temperature stress. BMC Zool. 2022, 7, 24. [Google Scholar] [CrossRef] [PubMed]
  56. Wiens, J.J.; Graham, C.H.; Moen, D.S.; Smith, S.A.; Reeder, T.W. Evolutionary and ecological causes of the latitudinal diversity gradient in hylid frogs: Treefrog trees unearth the roots of high tropical diversity. Am. Nat. 2006, 168, 579–596. [Google Scholar] [CrossRef]
  57. Yan, P.; Pan, T.; Wu, G.Y.; Kang, X.; Ali, I.; Zhou, W.L.; Li, J.T.; Wu, X.B.; Zhang, B.W. Species Delimitation and Evolutionary History of Tree Frogs in the Hyla chinensis Group (Hylidae, Amphibian). Front. Ecol. Evol. 2020, 8, 234. [Google Scholar] [CrossRef]
  58. Duellman, W.E.; Marion, A.B.; Hedges, S.B. Phylogenetics, classification, and biogeography of the treefrogs (Amphibia: Anura: Arboranae). Zootaxa 2016, 4104, 1–109. [Google Scholar] [CrossRef] [PubMed]
  59. Zang, X.Y.; Guo, J.L.; Geng, X.F.; Li, P.F.; Sun, J.Y.; Wang, Q.W.; Xu, C.S. Proteome analysis of the liver in the Chinese fire-bellied newt Cynops orientalis. Genet. Mol. Res. 2016, 15, 15037993. [Google Scholar] [CrossRef] [PubMed]
  60. Borzee, A.; Didinger, C.; Jang, Y. Complete mitochondrial genome of Dryophytes suweonensis (Anura Hylidae). Mitochondrial DNA B Resour. 2017, 2, 5–6. [Google Scholar] [CrossRef] [PubMed]
  61. Lee, M.; Jeon, H.S.; Min, M.; An, J. Sequencing and analysis of the complete mitochondrial genome of Hyla suweonensis (Anura: Hylidae). Mitochondrial DNA B 2017, 2, 126–127. [Google Scholar] [CrossRef] [PubMed]
  62. Igawa, T.; Kurabayashi, A.; Usuki, C.; Fujii, T.; Sumida, M. Complete mitochondrial genomes of three neobatrachian anurans: A case study of divergence time estimation using different data and calibration settings. Gene 2008, 407, 116–129. [Google Scholar] [CrossRef]
  63. Ye, L.T.; Zhu, C.C.; Yu, D.N.; Zhang, Y.P.; Zhang, J.Y. The complete mitochondrial genome of Hyla annectans (Anura: Hylidae). Mitochondrial DNA A 2016, 27, 1593–1594. [Google Scholar] [CrossRef]
  64. Kang, X.; Sun, Z.L.; Guo, W.B.; Wu, J.; Qian, L.F.; Pan, T.; Wang, H.; Li, K.; Zhang, B.W. Sequencing of complete mitochondrial genome for Tsinling Tree Toad (Hyla tsinlingensis). Mitochondrial DNA B 2016, 1, 466–467. [Google Scholar] [CrossRef]
  65. Hong, Y.H.; Huang, H.M.; Wu, L.; Storey, K.B.; Zhang, J.Y.; Zhang, Y.P.; Yu, D.N. Characterization of two mitogenomes of Hyla sanchiangensis (Anura: Hylidae), with phylogenetic relationships and selection pressure analyses of Hylidae. Animals 2023, 13, 1593. [Google Scholar] [CrossRef] [PubMed]
  66. Chen, Q.E.; Lin, Y.F.; Ma, L.; Ding, G.H.; Lin, Z.H. Partial mitochondrial genome of the Sanchiang Tree Toad Hyla sanchiangensis (Anura: Hylidae). Mitochondrial DNA B 2020, 5, 2682–2683. [Google Scholar] [CrossRef]
  67. Zhang, P.; Zhou, H.; Chen, Y.Q.; Liu, Y.F.; Qu, L.H. Mitogenomic perspectives on the origin and phylogeny of living amphibians. Syst. Biol. 2005, 54, 391–400. [Google Scholar] [CrossRef]
  68. Ortiz, D.A.; Hoskin, C.J.; Werneck, F.P.; Réjaud, A.; Manzi, S.; Ron, S.R.; Fouquet, A. Historical biogeography highlights the role of Miocene landscape changes on the diversification of a clade of Amazonian tree frogs. Org. Divers. Evol. 2022, 23, 395–414. [Google Scholar] [CrossRef]
  69. Alexander, R.P.; Fang, G.; Rozowsky, J.; Snyder, M.; Gerstein, M.B. Annotating non-coding regions of the genome. Nat. Rev. Genet. 2010, 11, 559–571. [Google Scholar] [CrossRef]
  70. Somero, G.N. Linking biogeography to physiology: Evolutionary and acclimatory adjustments of thermal limits. Front. Zool. 2005, 2, 1. [Google Scholar] [CrossRef] [PubMed]
  71. Storey, K.B.; Storey, J.M. Tribute to P. L. Lutz: Putting life on ‘pause’–molecular regulation of hypometabolism. J. Exp. Biol. 2007, 210, 1700–1714. [Google Scholar] [CrossRef] [PubMed]
  72. Saraste, M. Oxidative phosphorylation at the fin de siecle. Science 1999, 283, 1488–1493. [Google Scholar] [CrossRef]
  73. Lenaz, G.; Fato, R.; Genova, M.L.; Bergamini, C.; Bianchi, C.; Biondi, A. Mitochondrial complex I: Structural and functional aspects. Biochim. Biophys. Acta 2006, 1757, 1406–1420. [Google Scholar] [CrossRef]
  74. Kadenbach, B. Complex IV-the regulatory center of mitochondrial oxidative phosphorylation. Mitochondrion 2021, 58, 296–302. [Google Scholar] [CrossRef]
  75. Junge, W.; Nelson, N. ATP synthase. Annu. Rev. Biochem. 2015, 84, 631–657. [Google Scholar] [CrossRef]
  76. Barel, O.; Shorer, Z.; Flusser, H.; Ofir, R.; Narkis, G.; Finer, G.; Shalev, H.; Nasasra, A.; Saada, A.; Birk, O.S. Mitochondrial complex III deficiency associated with a homozygous mutation in UQCRQ. Am. J. Hum. Genet. 2008, 82, 1211–1216. [Google Scholar] [CrossRef]
  77. Okajima, Y.; Kumazawa, Y. Mitochondrial genomes of acrodont lizards: Timing of gene rearrangements and phylogenetic and biogeographic implications. BMC Evol. Biol. 2010, 10, 141. [Google Scholar] [CrossRef]
  78. Nitzan, T.; Slosman, T.; Gutkovich, D.; Weller, J.I.; Hulata, G.; Zak, T.; Benet, A.; Cnaani, A. Maternal effects in the inheritance of cold tolerance in blue tilapia (Oreochromis aureus). Environ. Biol. Fish. 2016, 99, 975–981. [Google Scholar] [CrossRef]
  79. Bozinovic, F.; Calosi, P.; Spicer, J.I. Physiological correlates of geographic range in animals. Annu. Rev. Ecol. Evol. Syst. 2011, 42, 155–179. [Google Scholar] [CrossRef]
  80. Gaston, K.J.; Chown, S.L.; Calosi, P.; Bernardo, J.; Bilton, D.T.; Clarke, A.; Clusella-Trullas, S.; Ghalambor, C.K.; Konarzewski, M.; Peck, L.S.; et al. Macrophysiology: A conceptual reunification. Am. Nat. 2009, 174, 595–612. [Google Scholar] [CrossRef] [PubMed]
  81. Ghalambor, C.K.; Huey, R.B.; Martin, P.R.; Tewksbury, J.J.; Wang, G. Are mountain passes higher in the tropics? Janzen’s hypothesis revisited. Integr. Comp. Biol. 2006, 46, 5–17. [Google Scholar] [CrossRef]
  82. Janzen, D.H. Why mountain passes are high in the tropics. Am. Nat. 1967, 101, 233–249. [Google Scholar] [CrossRef]
  83. Sun, B.J.; Williams, C.M.; Li, T.; Speakman, J.R.; Jin, Z.G.; Lu, H.L.; Luo, L.G.; Du, W.G. Higher metabolic plasticity in temperate compared to tropical lizards suggests increased resilience to climate change. Ecol. Monogr. 2022, 92, e1512. [Google Scholar] [CrossRef]
  84. Somero, G.N. The physiology of global change: Linking patterns to mechanisms. Ann. Rev. Mar. Sci. 2012, 4, 39–61. [Google Scholar] [CrossRef]
  85. Hadj-Moussa, H.; Storey, K.B. Micromanaging freeze tolerance: The biogenesis and regulation of neuroprotective microRNAs in frozen brains. Cell. Mol. Life Sci. 2018, 75, 3635–3647. [Google Scholar] [CrossRef] [PubMed]
  86. Consuegra, S.; John, E.; Verspoor, E.; de Leaniz, C.G. Patterns of natural selection acting on the mitochondrial genome of a locally adapted fish species. Genet. Sel. Evol. 2015, 47, 58. [Google Scholar] [CrossRef] [PubMed]
  87. Cai, Y.Y.; Shen, S.Q.; Lu, L.X.; Storey, K.B.; Yu, D.N.; Zhang, J.Y. The complete mitochondrial genome of Pyxicephalus adspersus: High gene rearrangement and phylogenetics of one of the world’s largest frogs. PeerJ 2019, 7, e7532. [Google Scholar] [CrossRef] [PubMed]
  88. Zhang, P.; Liang, D.; Mao, R.L.; Hillis, D.M.; Wake, D.B.; Cannatella, D.C. Efficient sequencing of anuran mtDNAs and a mitogenomic exploration of the phylogeny and evolution of frogs. Mol. Biol. Evol. 2013, 30, 1899–1915. [Google Scholar] [CrossRef] [PubMed]
  89. Nei, M. Genetic distance between populations. Am. Nat. 1972, 106, 283–292. [Google Scholar] [CrossRef]
  90. Liu, W.; Zhao, G.H.; Tan, M.Y.; Zeng, D.L.; Wang, K.Z.; Yuan, Z.G.; Lin, R.Q.; Zhu, X.Q.; Liu, Y. Survey of Spirometra erinaceieuropaei spargana infection in the frog Rana nigromaculata of the Hunan Province of China. Vet. Parasitol. 2010, 173, 152–156. [Google Scholar] [CrossRef] [PubMed]
  91. Burland, T.G. DNASTAR’s Lasergene sequence analysis software. Bioinf. Methods Protoc. 2000, 132, 71–91. [Google Scholar]
  92. Bernt, M.; Donath, A.; Jühling, F.; Externbrink, F.; Florentz, C.; Fritzsch, G.; Pütz, J.; Middendorf, M.; Stadler, P.F. MITOS: Improved de novo metazoan mitochondrial genome annotation. Mol. Phylogenetics Evol. 2013, 69, 313–319. [Google Scholar] [CrossRef]
  93. Tamura, K.; Stecher, G.; Kumar, S. MEGA11: Molecular Evolutionary Genetics Analysis Version 11. Mol. Biol. Evol. 2021, 38, 3022–3027. [Google Scholar] [CrossRef]
  94. Lowe, T.M.; Chan, P.P. tRNAscan-SE On-line: Integrating search and context for analysis of transfer RNA genes. Nucleic Acids Res. 2016, 44, W54–W57. [Google Scholar] [CrossRef]
  95. Gruber, A.R.; Lorenz, R.; Bernhart, S.H.; Neuböck, R.; Hofacker, I.L. The Vienna RNA websuite. Nucleic Acids Res. 2008, 36, W70–W74. [Google Scholar] [CrossRef] [PubMed]
  96. Zhang, D.; Gao, F.; Jakovlić, I.; Zou, H.; Zhang, J.; Li, W.X.; Wang, G.T. PhyloSuite: An integrated and scalable desktop platform for streamlined molecular sequence data management and evolutionary phylogenetics studies. Mol. Ecol. Rescour. 2020, 20, 348–355. [Google Scholar] [CrossRef]
  97. Perna, N.T.; Kocher, T.D. Patterns of nucleotide composition at fourfold degenerate sites of animal mitochondrial genomes. J. Mol. Evol. 1995, 41, 353–358. [Google Scholar] [CrossRef] [PubMed]
  98. Kimura, M. A simple method for estimating evolutionary rates of base substitutions through comparative studies of nucleotide sequences. J. Mol. Evol. 1980, 16, 111–120. [Google Scholar] [CrossRef]
  99. Katoh, K.; Standley, D.M. MAFFT Multiple Sequence Alignment Software Version 7: Improvements in Performance and Usability. Mol. Biol. Evol. 2013, 30, 772–780. [Google Scholar] [CrossRef]
  100. Castresana, J. Selection of conserved blocks from multiple alignments for their use in phylogenetic analysis. Mol. Biol. Evol. 2000, 17, 540–552. [Google Scholar] [CrossRef] [PubMed]
  101. Xia, X.; Xie, Z. DAMBE: Software package for data analysis in molecular biology and evolution. J. Hered. 2001, 92, 371–373. [Google Scholar] [CrossRef] [PubMed]
  102. Schwarz, G. Estimating the dimension of a model. Ann. Stat. 1978, 6, 461–464. [Google Scholar] [CrossRef]
  103. Lanfear, R.; Calcott, B.; Ho, S.Y.; Guindon, S. PartitionFinder: Combined selection of partitioning schemes and substitution models for phylogenetic analyses. Mol. Biol. Evol. 2012, 29, 1695–1701. [Google Scholar] [CrossRef]
  104. Ronquist, F.; Teslenko, M.; Van Der Mark, P.; Ayres, D.L.; Darling, A.; Höhna, S.; Larget, B.; Liu, L.; Suchard, M.A.; Huelsenbeck, J.P. MrBayes 3.2: Efficient Bayesian phylogenetic inference and model choice across a large model space. Syst. Biol. 2012, 61, 539–542. [Google Scholar] [CrossRef]
  105. Kozlov, A.M.; Darriba, D.; Flouri, T.; Morel, B.; Stamatakis, A. RAxML-NG: A fast, scalable and user-friendly tool for maximum likelihood phylogenetic inference. Bioinformatics 2019, 35, 4453–4455. [Google Scholar] [CrossRef] [PubMed]
  106. Rambaut, A.D.A. Figtree Version 1.4.4. Available online: http://tree.bio.ed.ac.uk/software/figtree/ (accessed on 20 June 2023).
  107. Aguilar, O.A.; Hadj-Moussa, H.; Storey, K.B. Freeze-responsive regulation of MEF2 proteins and downstream gene networks in muscles of the wood frog, Rana sylvatica. J. Therm. Biol. 2017, 67, 1–8. [Google Scholar] [CrossRef] [PubMed]
  108. Guide, R. Applied Biosystems StepOne™ and StepOnePlus™. Appl. Biosyst. 2010, 6, 4379704. [Google Scholar]
  109. Brosius, F. SPSS 21 [M]; MITP-Verlags GmbH & Co. KG: Frechen, Germany, 2013. [Google Scholar]
  110. Du, C.C.; Li, X.Y.; Wang, H.X.; Liang, K.; Wang, H.Y.; Zhang, Y.H. Identification of thyroid hormone receptors αand β genes and their expression profiles during metamorphosis in Rana chensinensis. Turk. J. Zool. 2017, 41, 454–463. [Google Scholar] [CrossRef]
  111. Barrow, L.N.; Soto-Centeno, J.A.; Warwick, A.R.; Lemmon, A.R.; Moriarty Lemmon, E. Evaluating hypotheses of expansion from refugia through comparative phylogeography of south-eastern Coastal Plain amphibians. J. Biogeogr. 2017, 44, 2692–2705. [Google Scholar] [CrossRef]
  112. Warwick, A.R.; Barrow, L.N.; Smith, M.L.; Means, D.B.; Lemmon, A.R.; Lemmon, E.M. Signatures of north-eastern expansion and multiple refugia: Genomic phylogeography of the Pine Barrens tree frog, Hyla andersonii (Anura: Hylidae). Biol. J. Linn. Soc. 2021, 133, 120–134. [Google Scholar] [CrossRef]
  113. Fouquet, A.; Marinho, P.; Réjaud, A.; Carvalho, T.R.; Caminer, M.A.; Jansen, M.; Rainha, R.N.; Rodrigues, M.T.; Werneck, F.P.; Lima, A.P. Systematics and biogeography of the Boana albopunctata species group (Anura, Hylidae), with the description of two new species from Amazonia. Syst. Biodivers. Sci. 2021, 19, 375–399. [Google Scholar] [CrossRef]
  114. Gatto, K.P.; Smith, J.J.; Lourenco, L.B. The mitochondrial genome of the endemic Brazilian paradoxical frog Pseudis tocantins (Hylidae). Mitochondrial DNA B 2018, 3, 1106–1107. [Google Scholar] [CrossRef] [PubMed]
  115. Lima, N.G.d.S.; Carmo, A.O.d.; Martins, A.P.V.; Souza, R.C.C.d.; Kalapothakis, E.; Eterovick, P.C. Complete mitochondrial genome sequence of the high-altitude Brazilian tree frog Bokermannohyla alvarengai (Anura, Hylidae). Mitochondrial DNA B 2017, 2, 281–282. [Google Scholar] [CrossRef]
  116. Lima, N.G.d.S.; Carmo, A.O.d.; Souza, R.C.C.d.; Kalapothakis, E.; Eterovick, P.C. Complete mitochondrial genome sequence of the high altitude Brazilian treefrog Pithecopus megacephalus (Anura, Phyllomedusidae). Mitochondrial DNA B 2020, 5, 388–389. [Google Scholar] [CrossRef]
Figure 1. Relative synonymous codon use (RSCU) of (A) Dryophytes japonicus, (B) Dryophytes immaculata, (C) Hyla annectans, (D) Hyla chinensis and (E) Hyla zhaopingensis. All the codons used, as well as different combinations of synonymous codons, are listed on the X-axis, whereas the RSCU values are listed on the Y-axis. Different codons are represented by different colors.
Ijms 25 05967 g001
Figure 2. The secondary structures for L-strand origin of replication (OL) for individuals of (A) Dryophytes japonicus, (B) Dryophytes immaculata, (C) Hyla annectans, (D) Hyla chinensis and (E) Hyla zhaopingensis.
Ijms 25 05967 g002
Figure 3. First, second and third positions of codon conformational tree results. BI and ML analyses were used to predict the phylogenetic relationships among the Hylidae based on the nucleotide data set encoding the 13 proteins. Species name information and GenBank number are marked on the figure. Posterior probabilities (PPs) of BI and Bootstrap values (BPs) of ML analyses are shown at the nodes.
Ijms 25 05967 g003
Figure 4. Relative expression of mitochondrial genes under control (25 °C) and low-temperature (4 °C) stress in (A) Dryophytes immaculata, (B) Hyla annectans, (C) Hyla chinensis and (D) Hyla zhaopingensis, where “*” indicates a significant difference (p < 0.05) and “**” indicates (p < 0.01).
Ijms 25 05967 g004
Table 1. The mitogenome composition of the five species.
Full Length * (bp)A (%)T (%)C (%) G (%) A + T (%) G + C (%)AT SkewGC Skew
Dryophytes japonicus17,22130.230.225.214.460.439.6−0.001−0.273
Dryophytes immaculata18,18629.428.527.314.957.942.20.015−0.295
Hyla annectans17,06030.330.524.814.560.839.3−0.004−0.263
Hyla chinensis17,08730.23025.414.460.239.80.004−0.276
Hyla zhaopingensis15,81229.832.223.914.16238−0.038−0.257
Annotation: * means the whole genome except partial CR.
Table 2. Genetic distances of six species of Hylidae.
KY700829 Dryophytes suweonensisKY419887
Dryophytes suweonensis
KX854020
Dryophytes suweonensis
Dryophytes
japonicus
Dryophytes
immaculata
AB303949.1 Dryophytes
japonicus
KY700829
Dryophytes suweonensis
KY419887 Dryophytes suweonensis0.12158
KX854020
Dryophytes suweonensis
0.121830.00176
Dryophytes japonicus0.012760.121640.12189
Dryophytes immaculata0.121750.008310.008120.12189
AB303949.1
Dryophytes japonicus
0.025260.120610.120860.024790.12046
Disclaimer/Publisher’s Note: The statements, opinions and data contained in all publications are solely those of the individual author(s) and contributor(s) and not of MDPI and/or the editor(s). MDPI and/or the editor(s) disclaim responsibility for any injury to people or property resulting from any ideas, methods, instructions or products referred to in the content.

