
Myelin Oligodendrocyte Glycoprotein (MOG)35–55 Mannan Conjugate Induces Human T-Cell Tolerance and Can Be Used as a Personalized Therapy for Multiple Sclerosis
 , ,
, ,  ,
,  ,
,  and
and 
Abstract
1. Introduction
2. Results
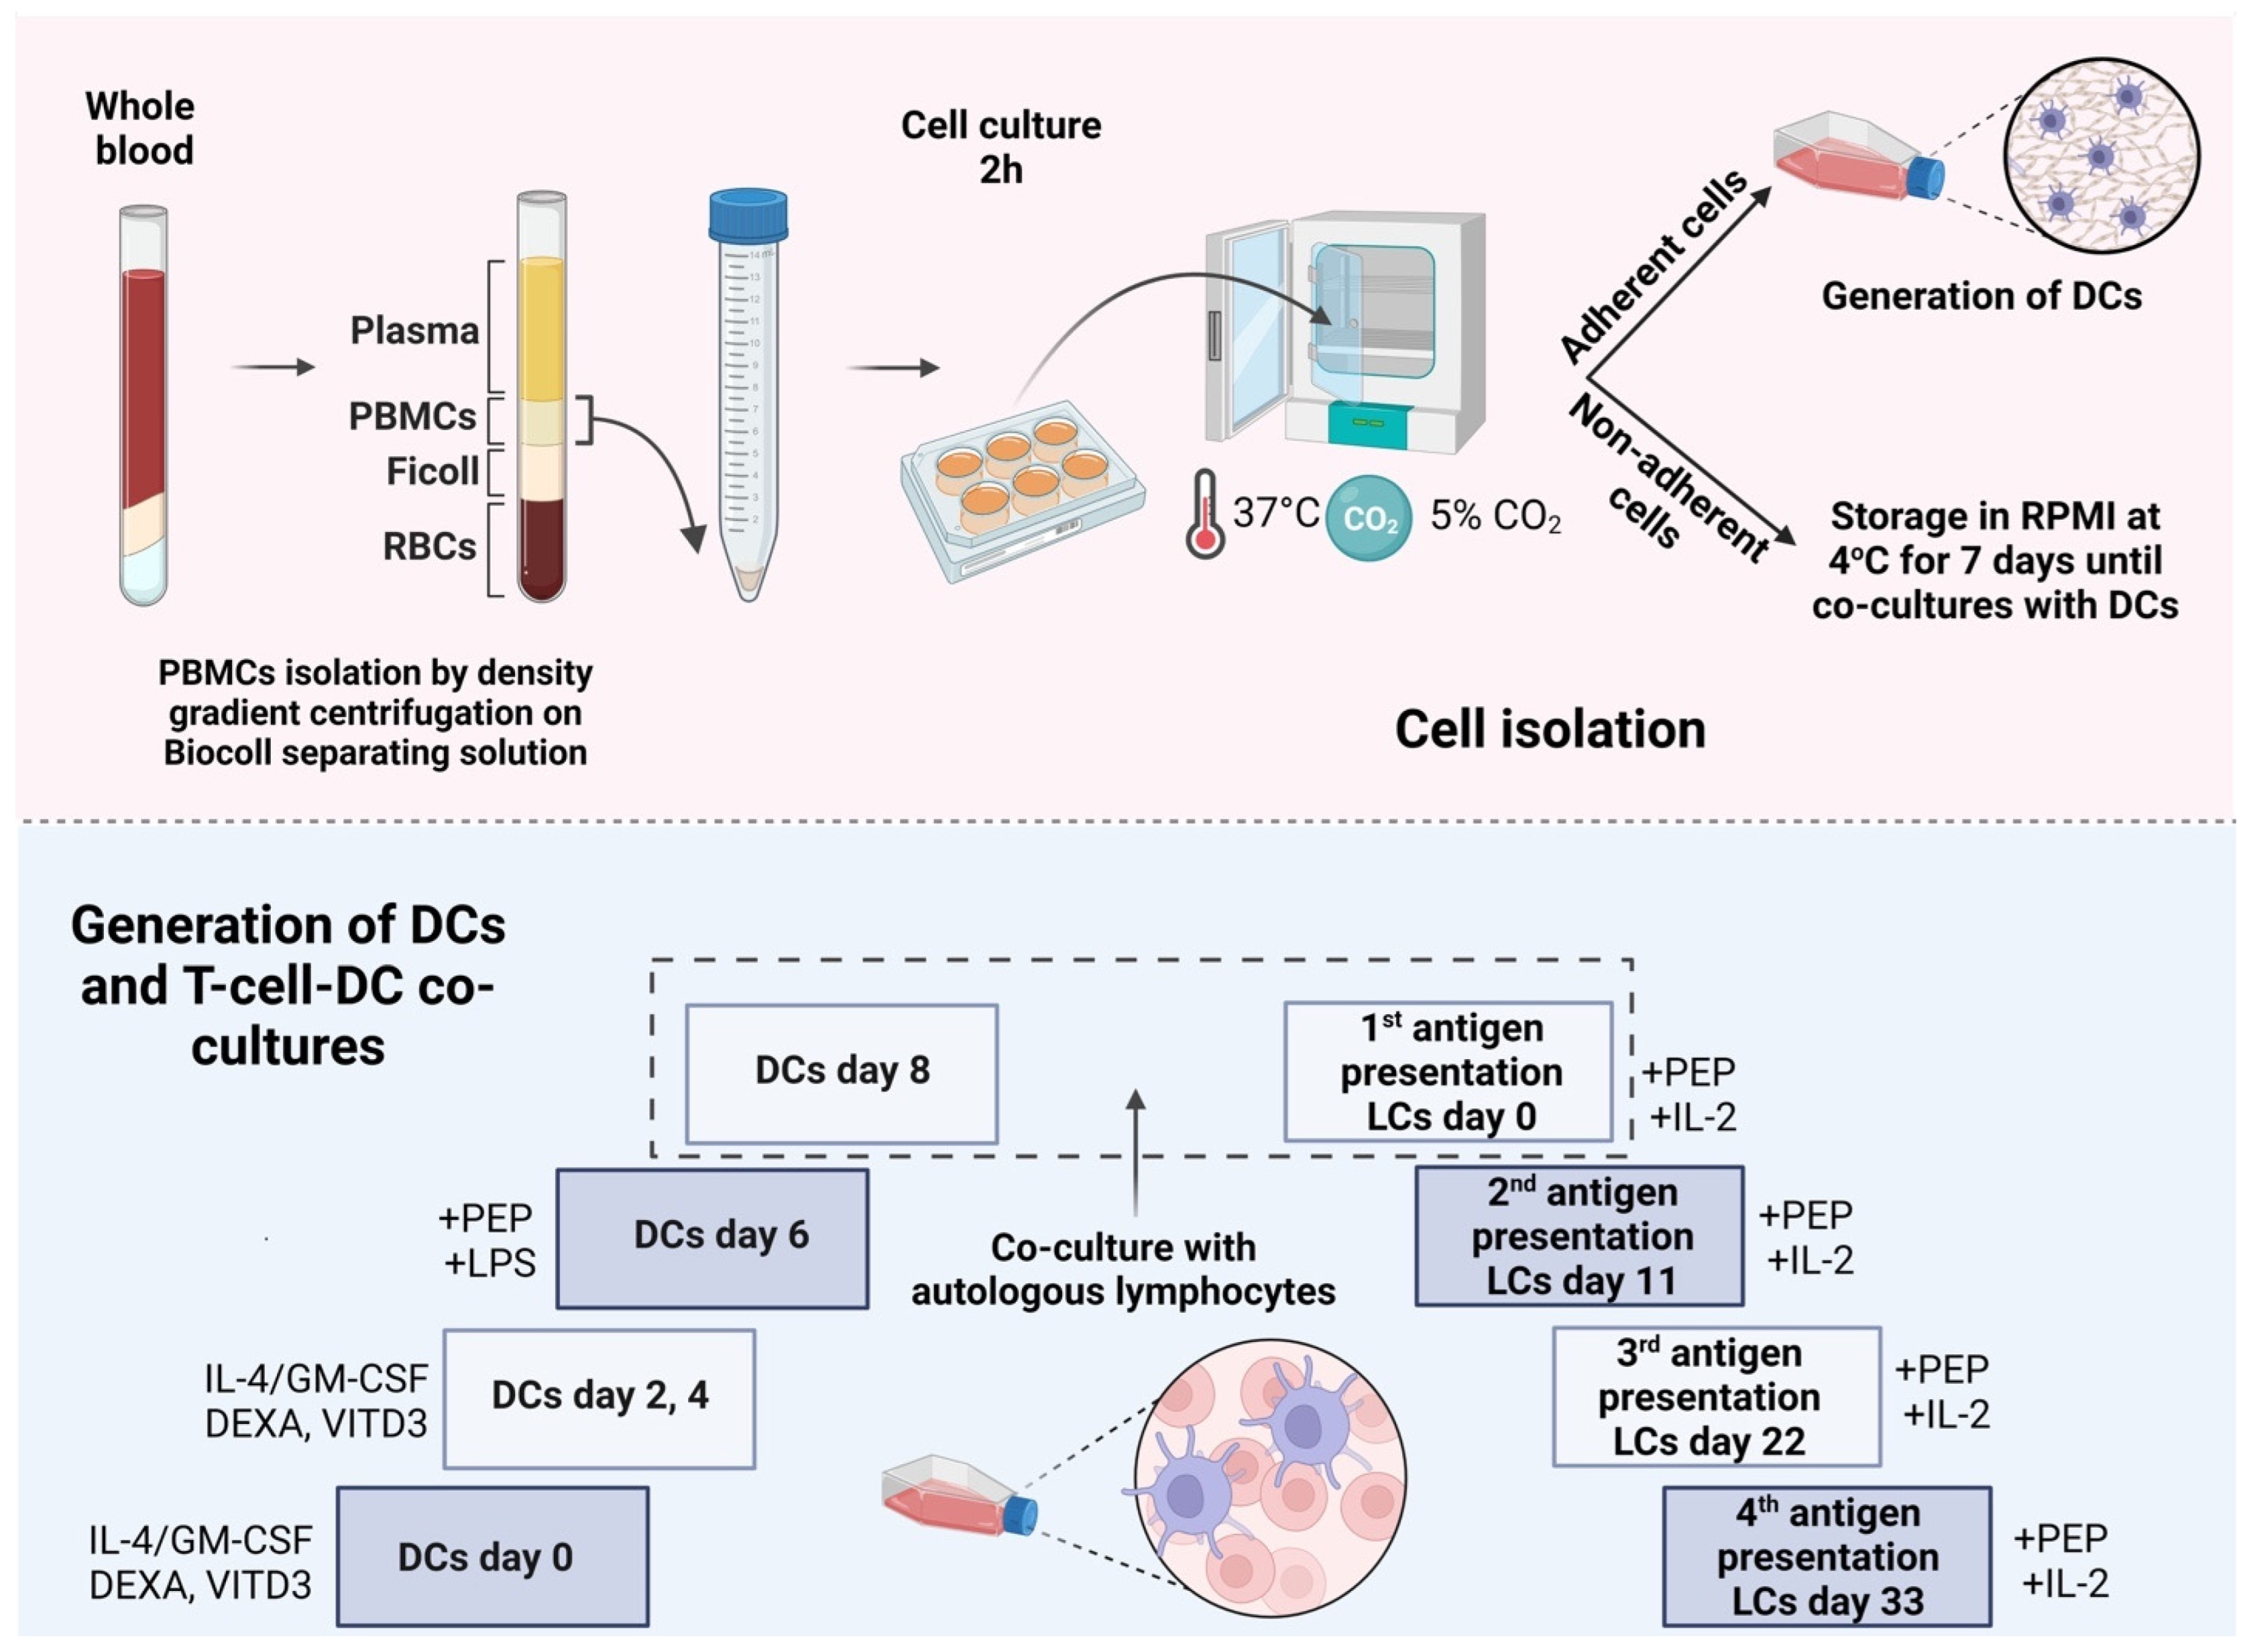
2.1. Development of DCs from Peripheral Blood Monocytes
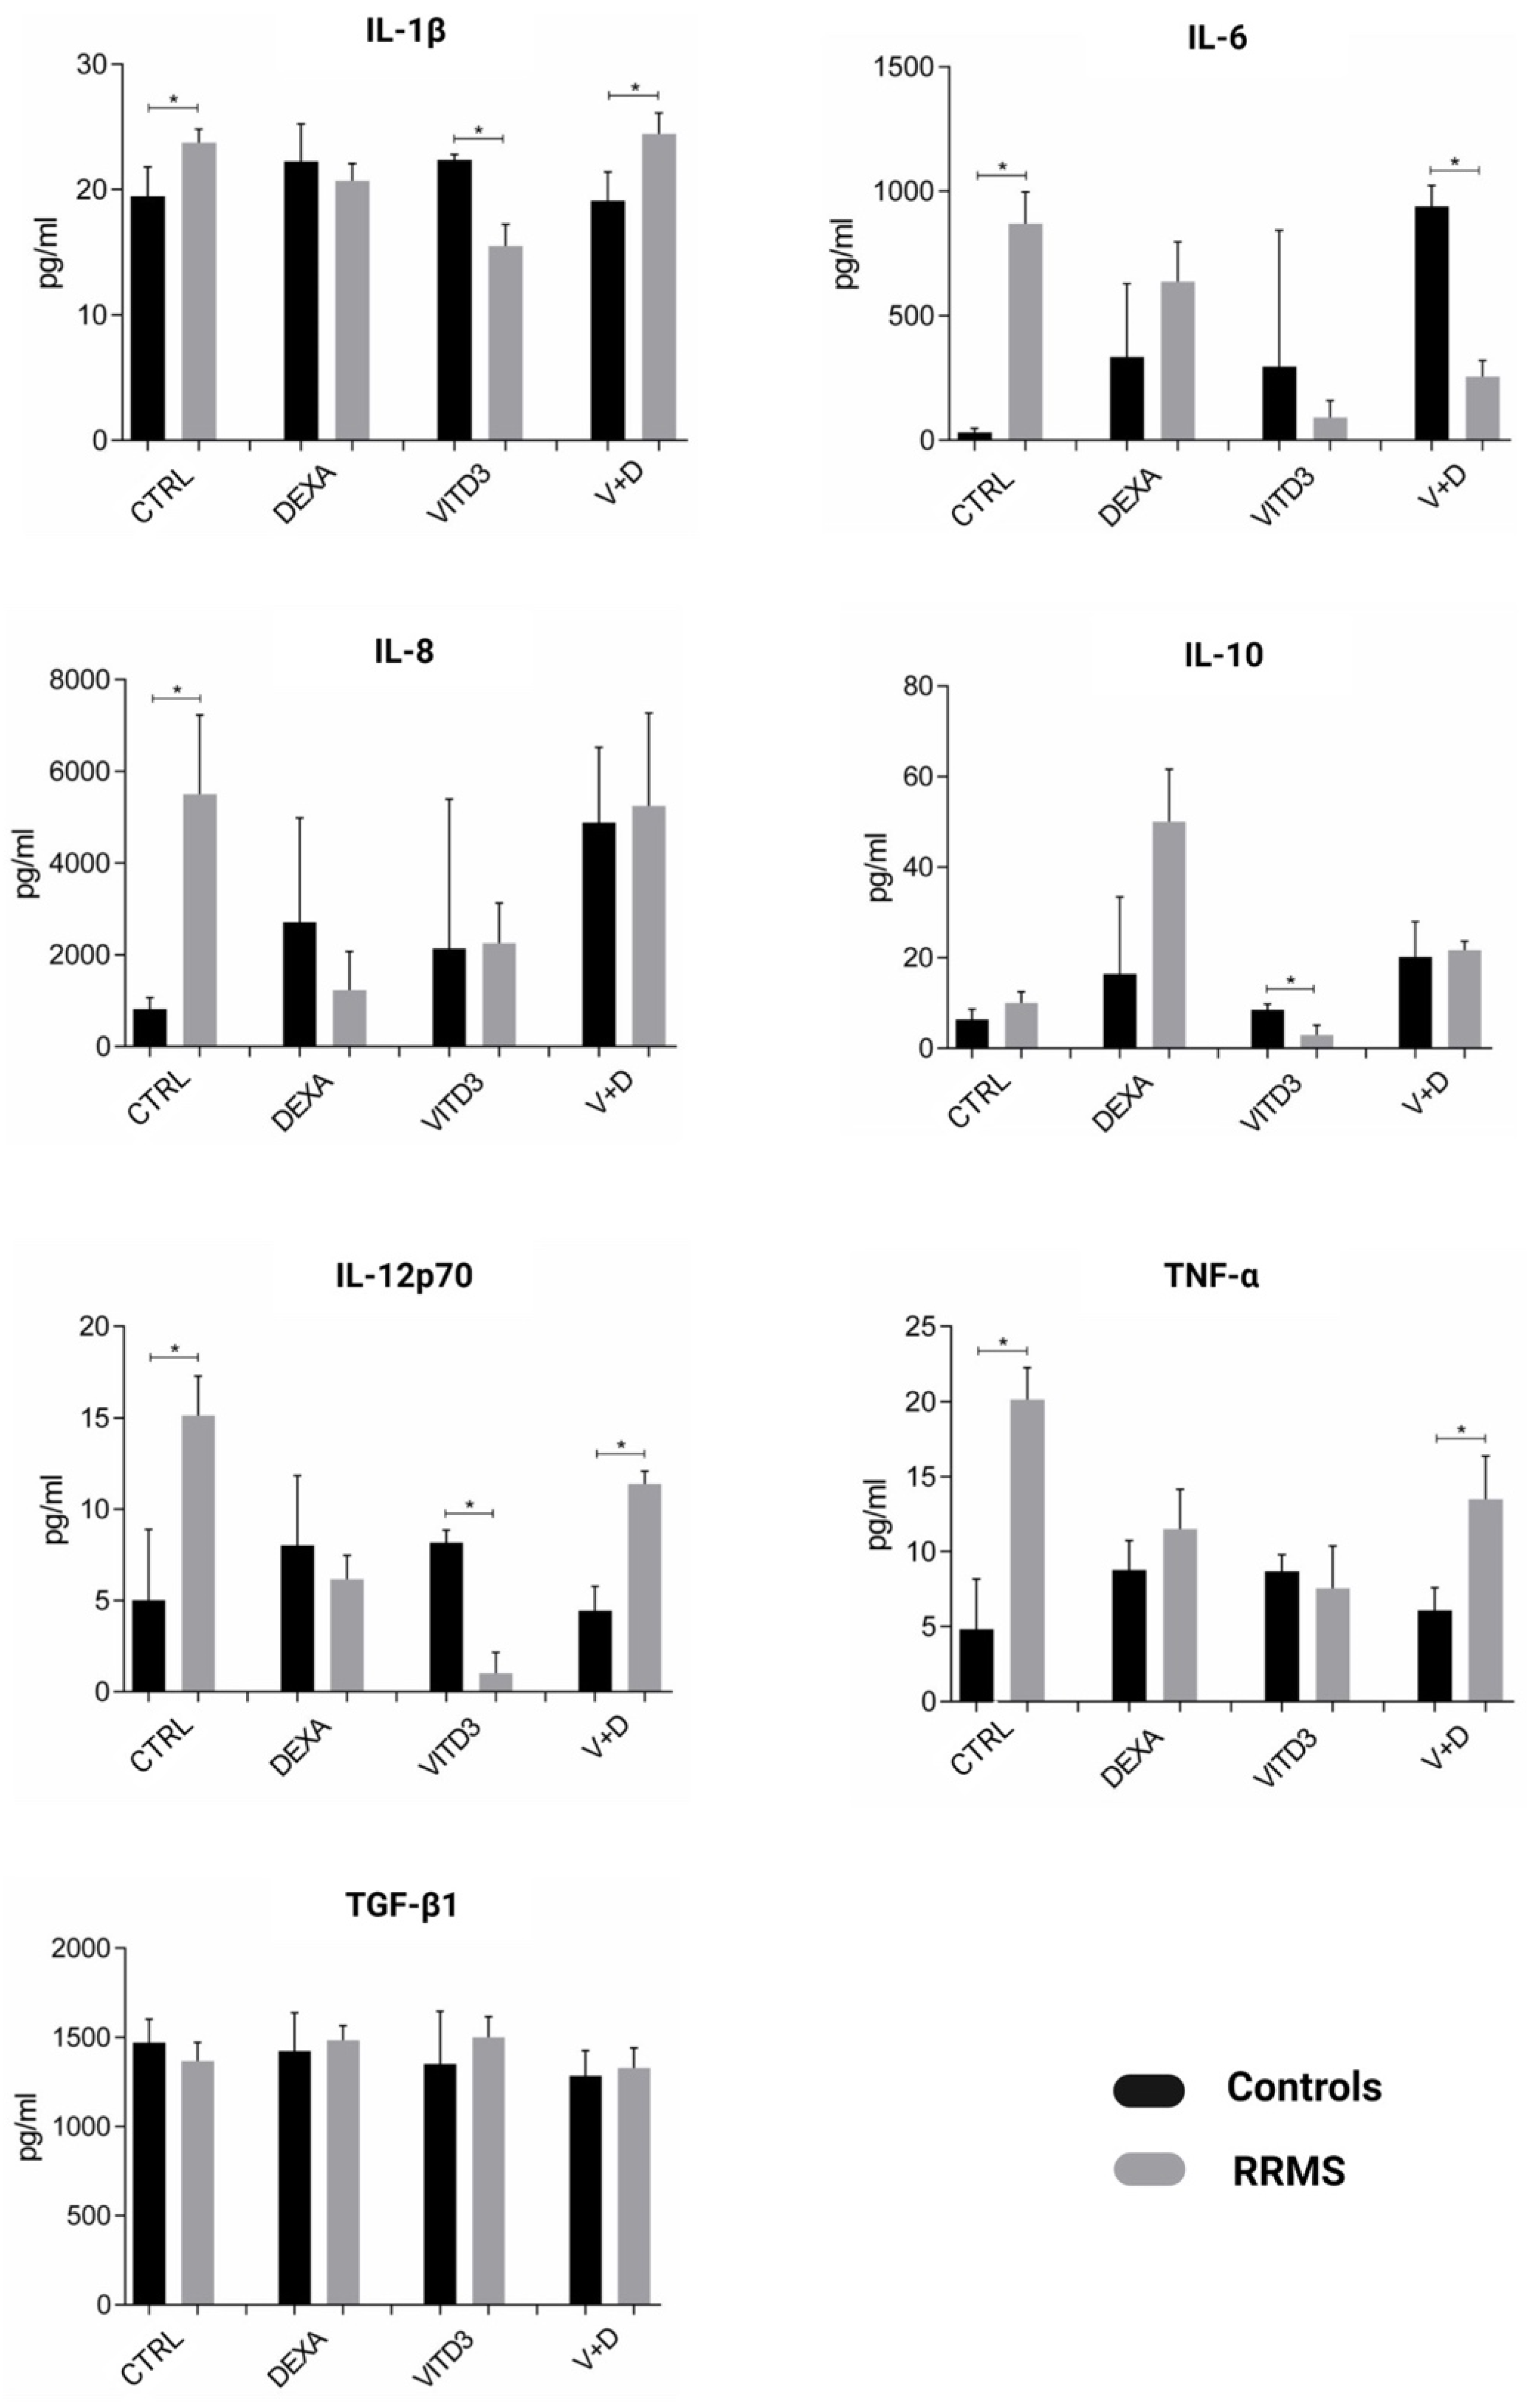
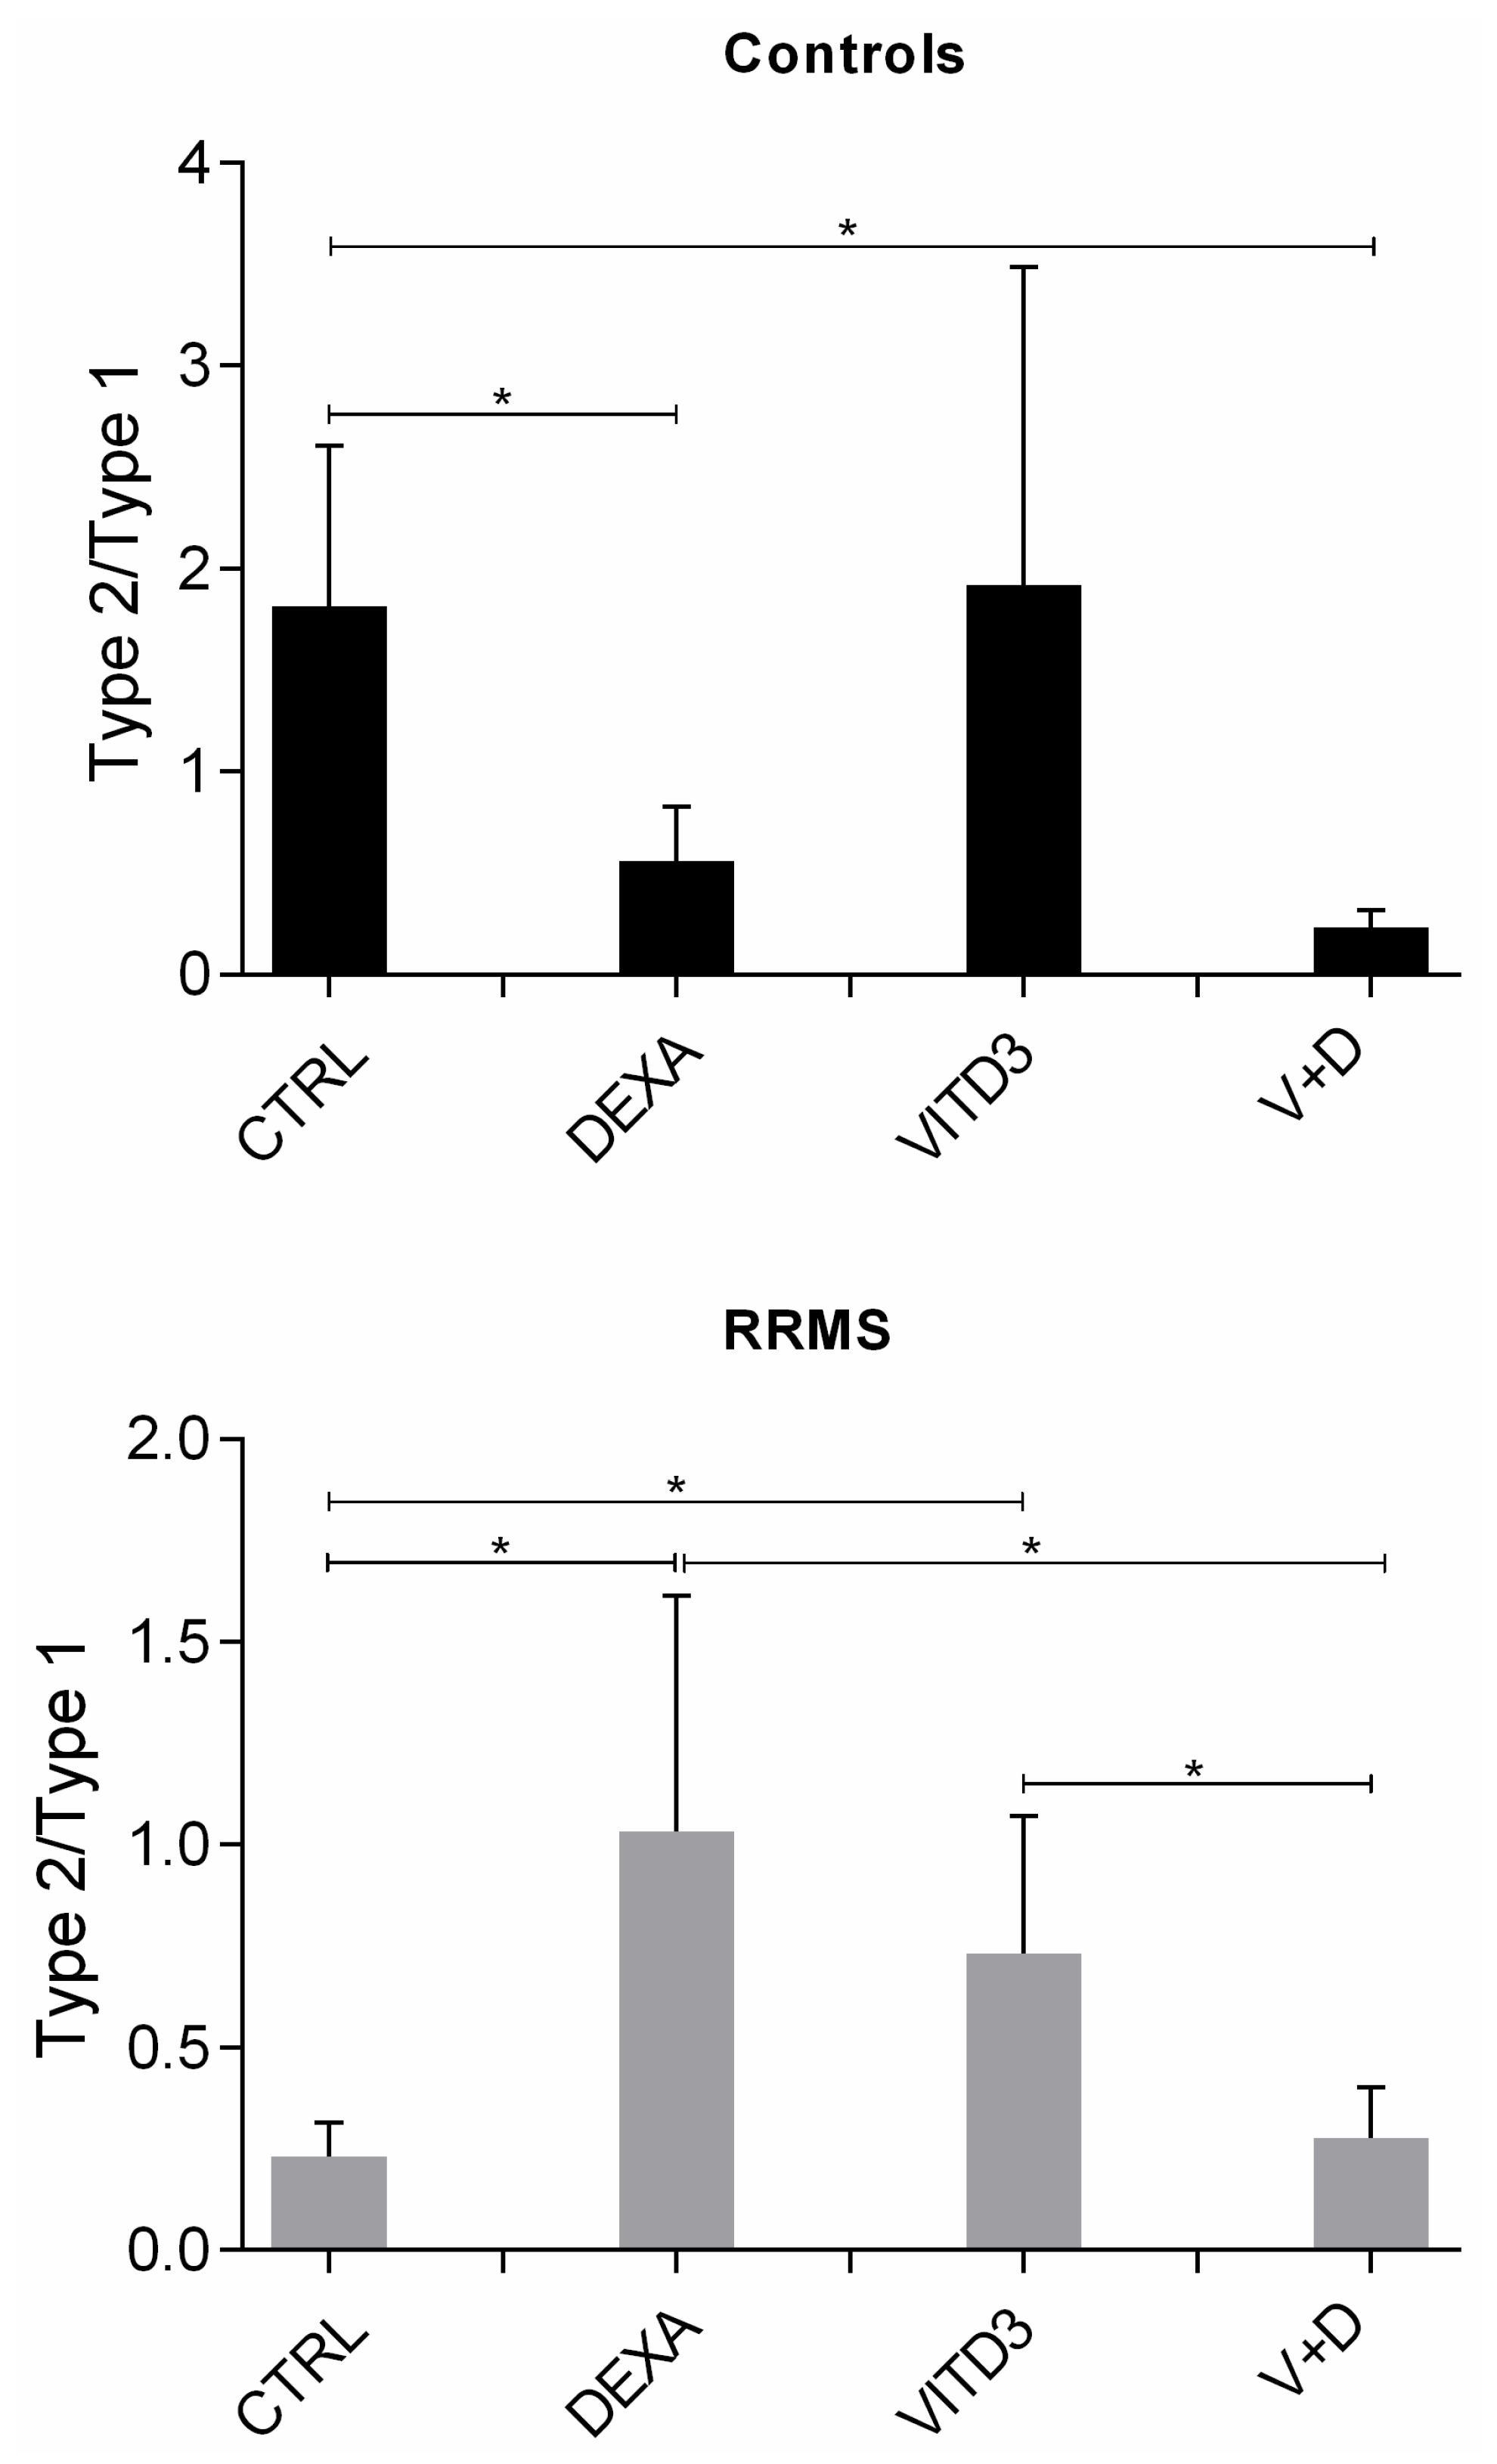
2.2. Cytokines Secreted by the Different DC Types
2.3. Effect of Antigen Presentation by DCs to Autologous T Cells
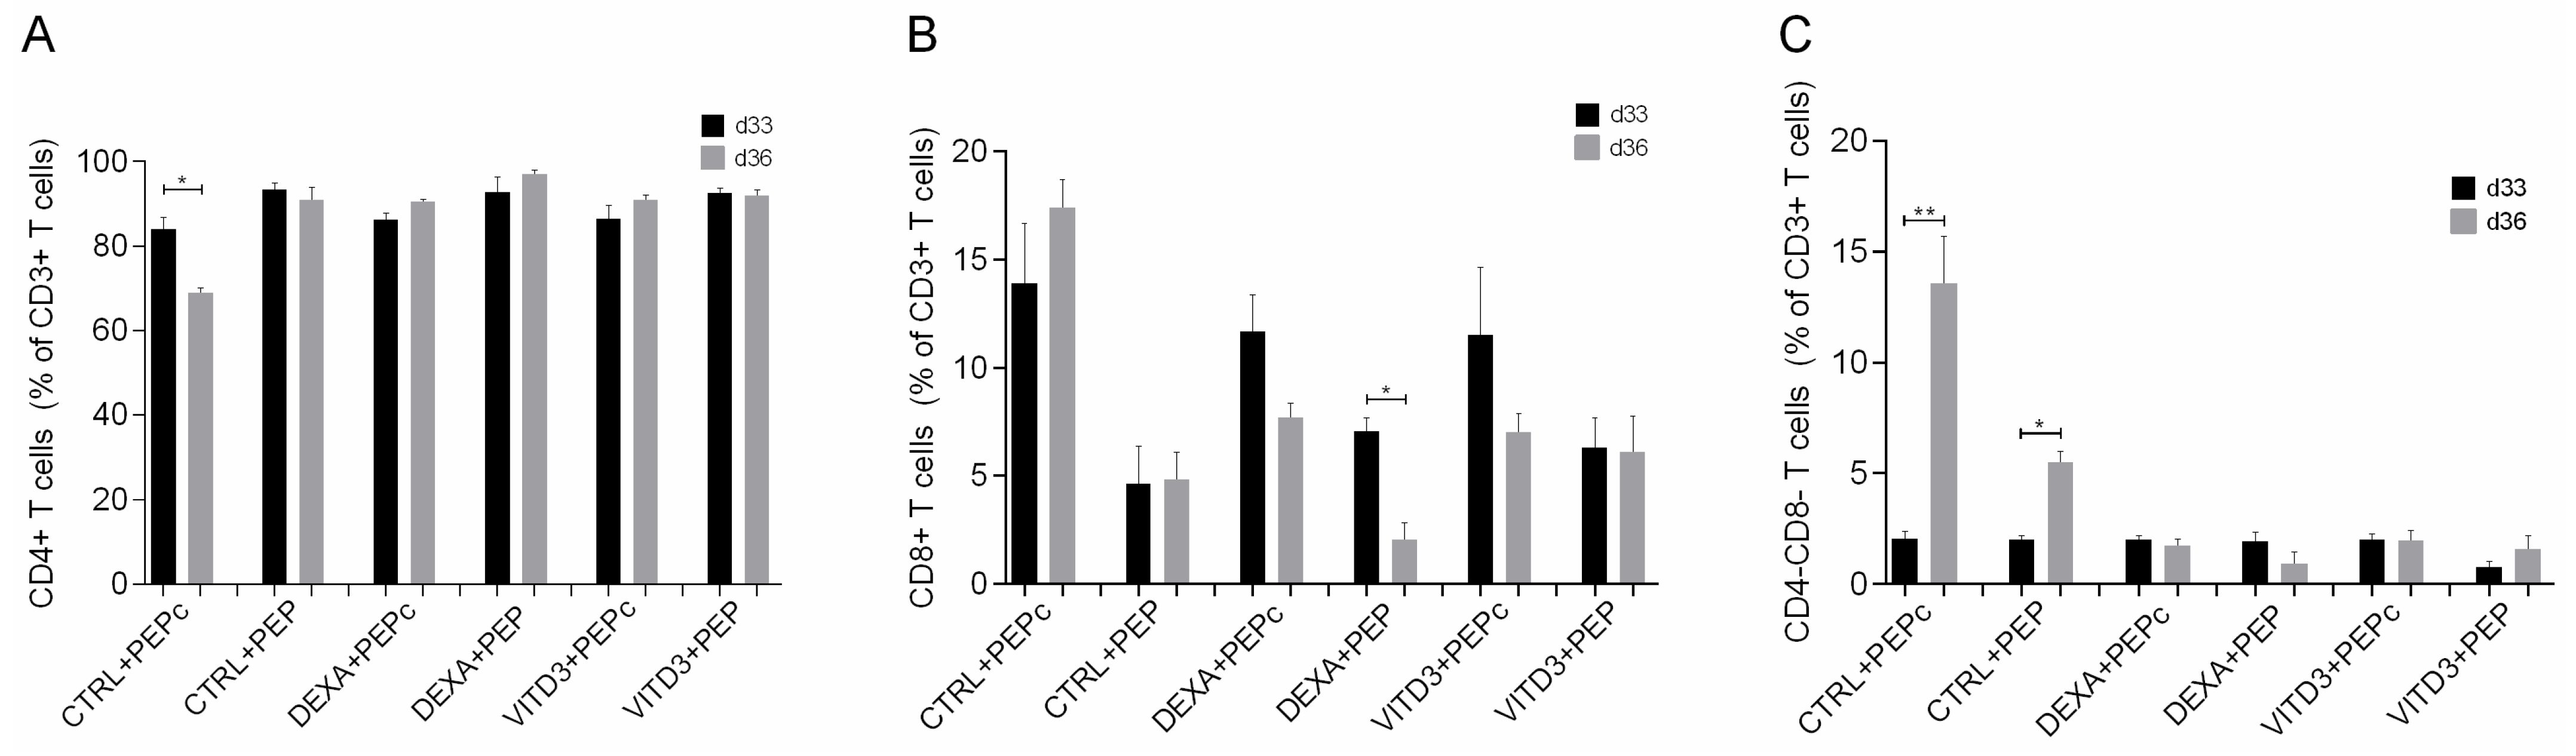
2.3.1. Beginning of Cultures
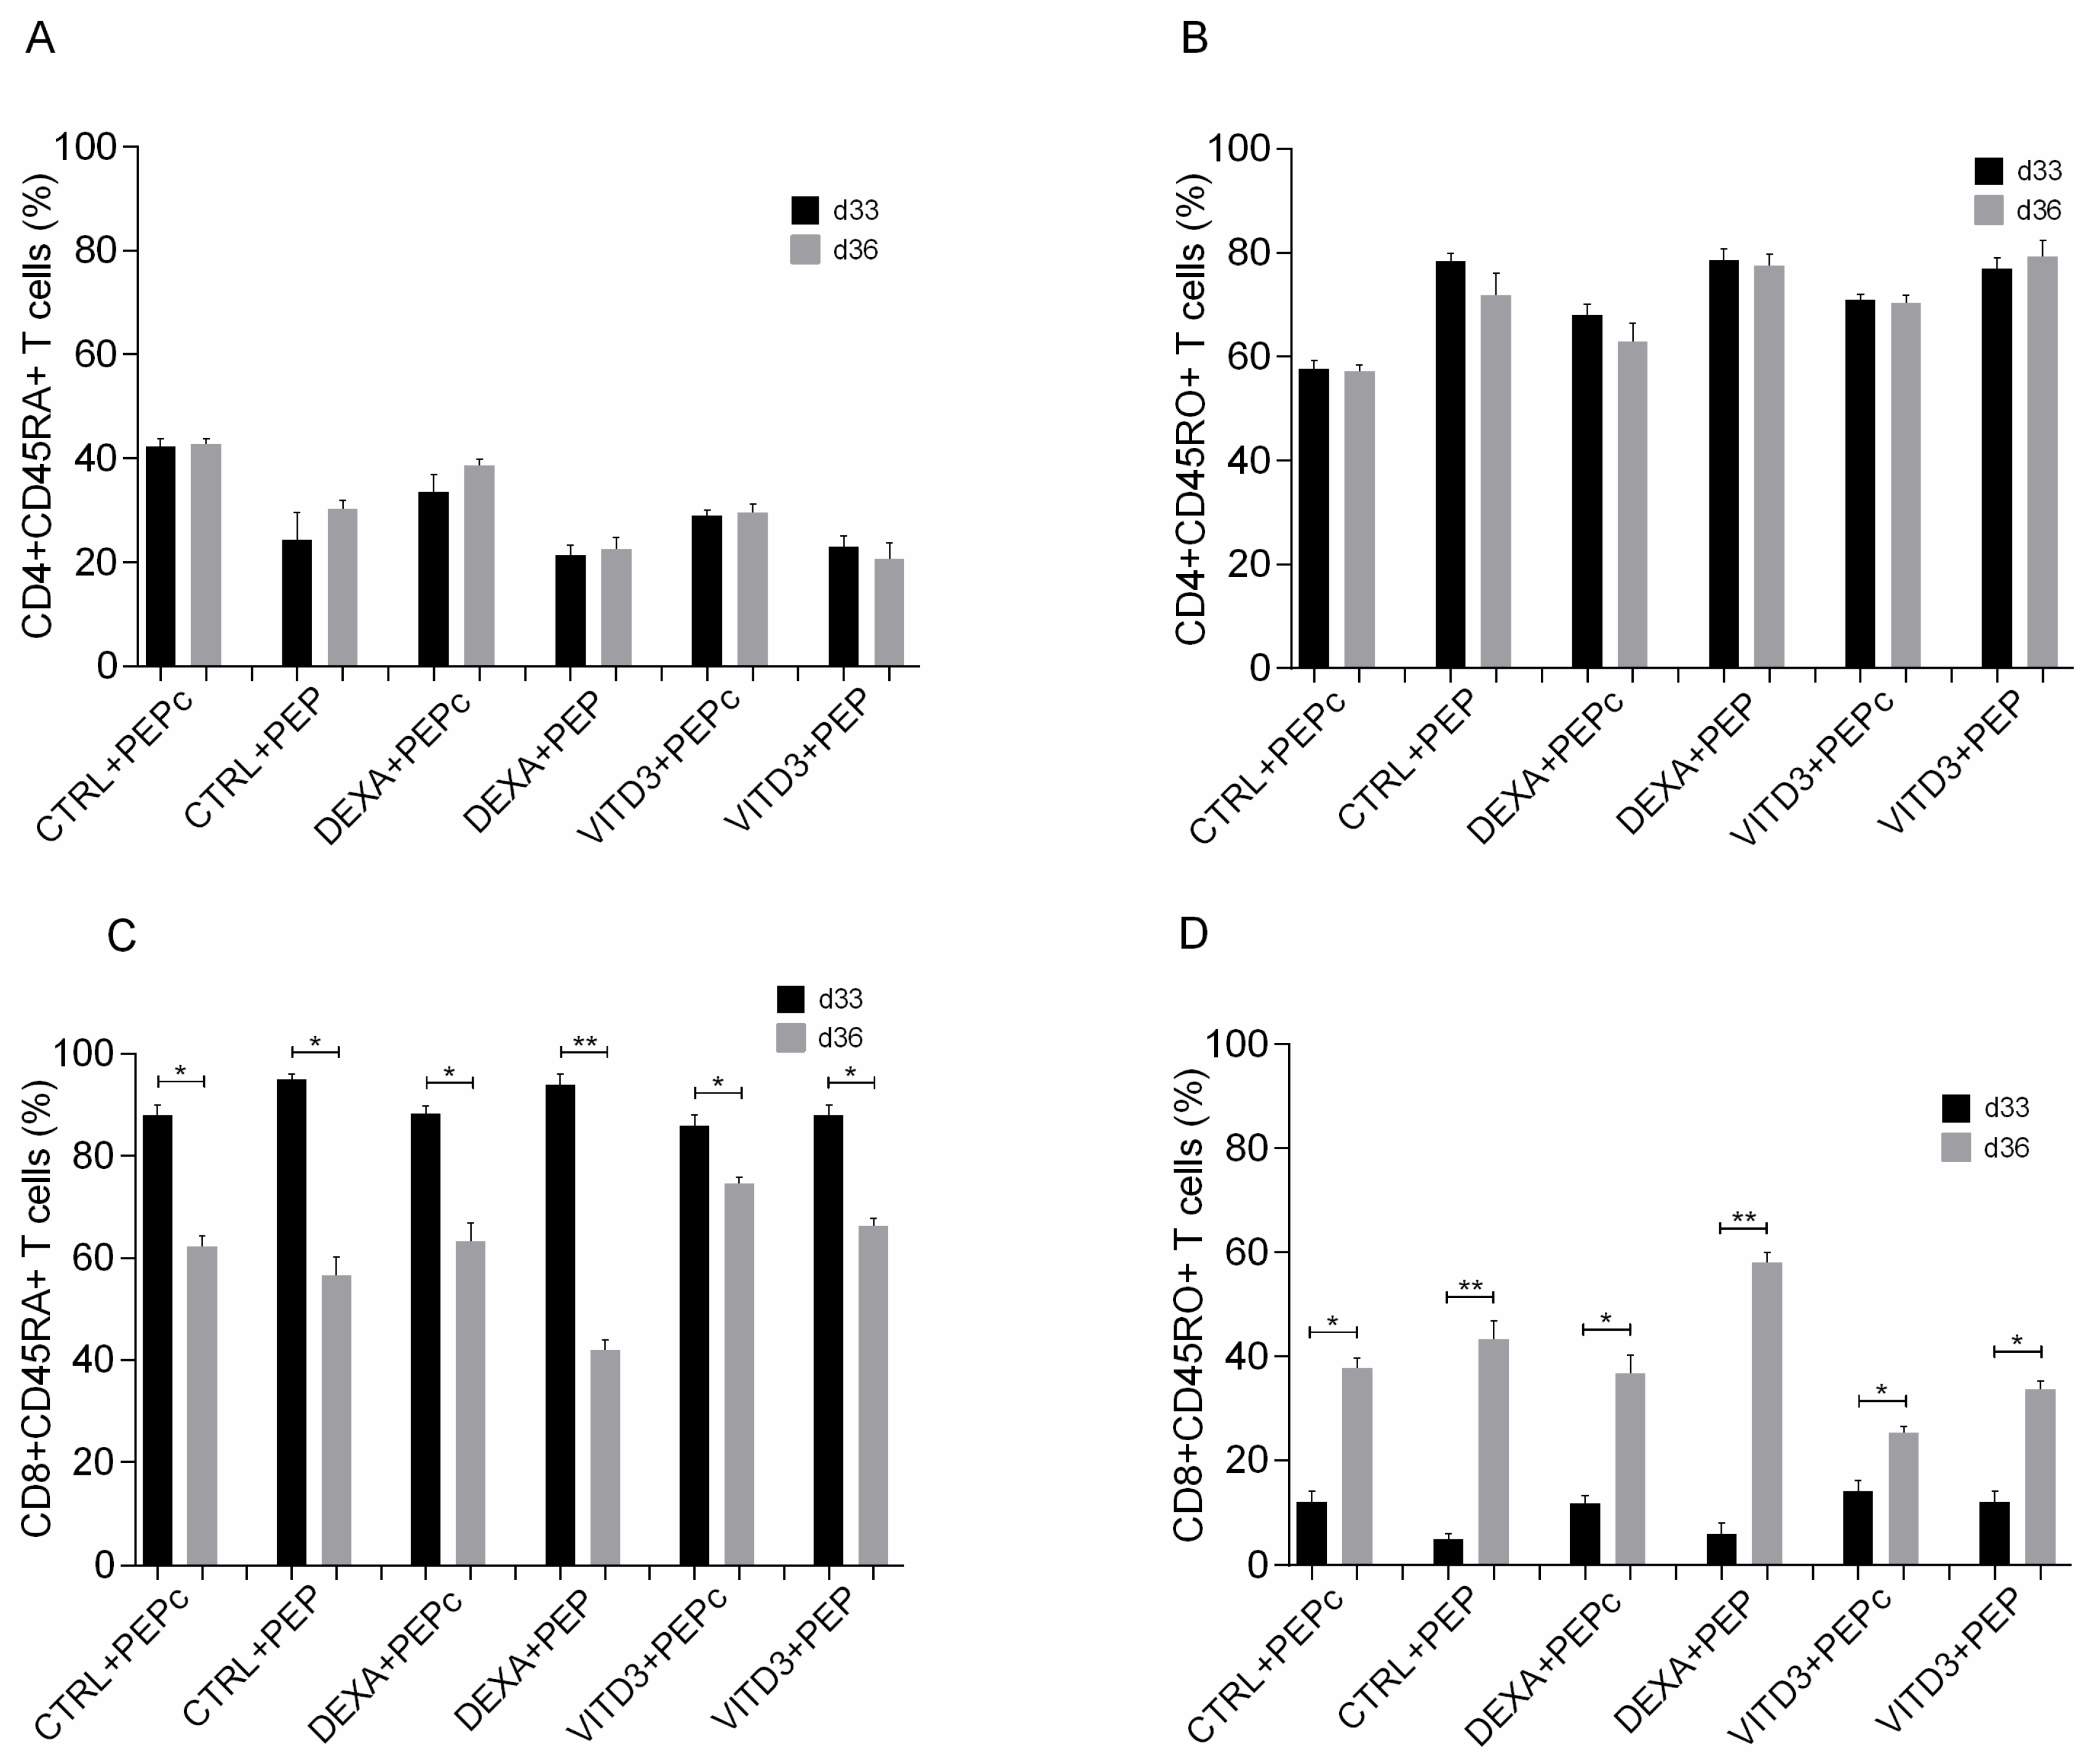
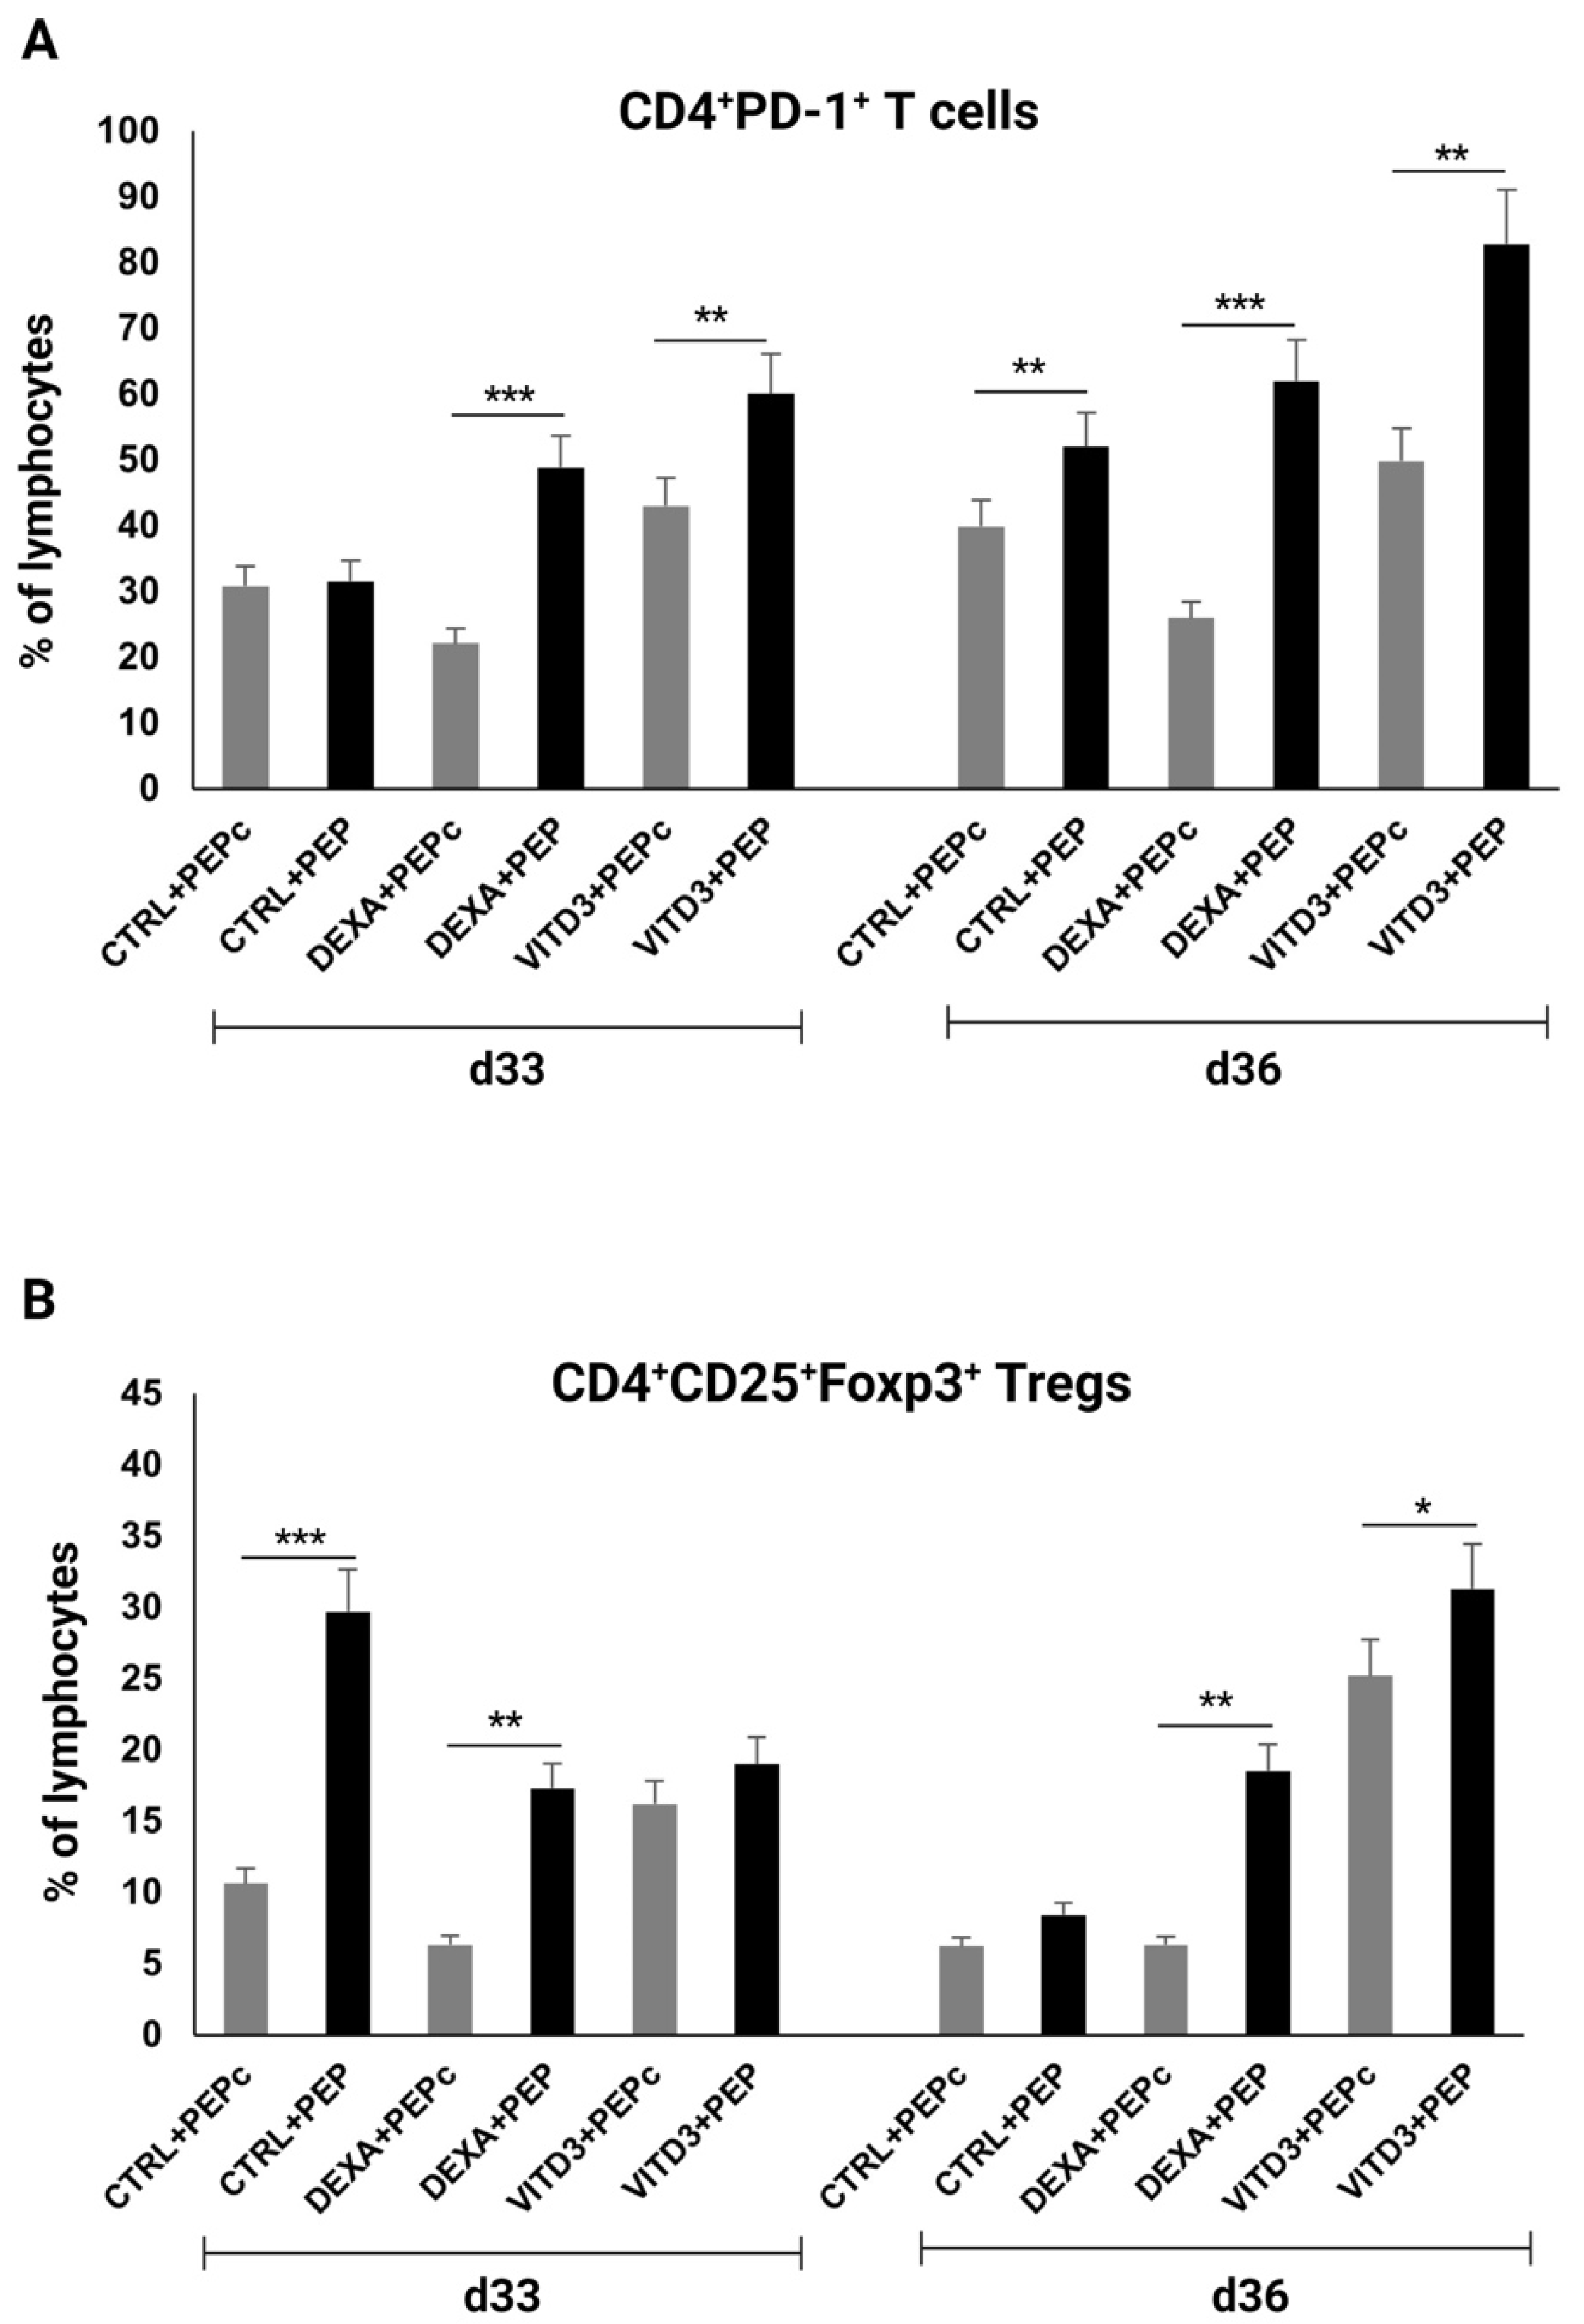
2.3.2. End of Cultures
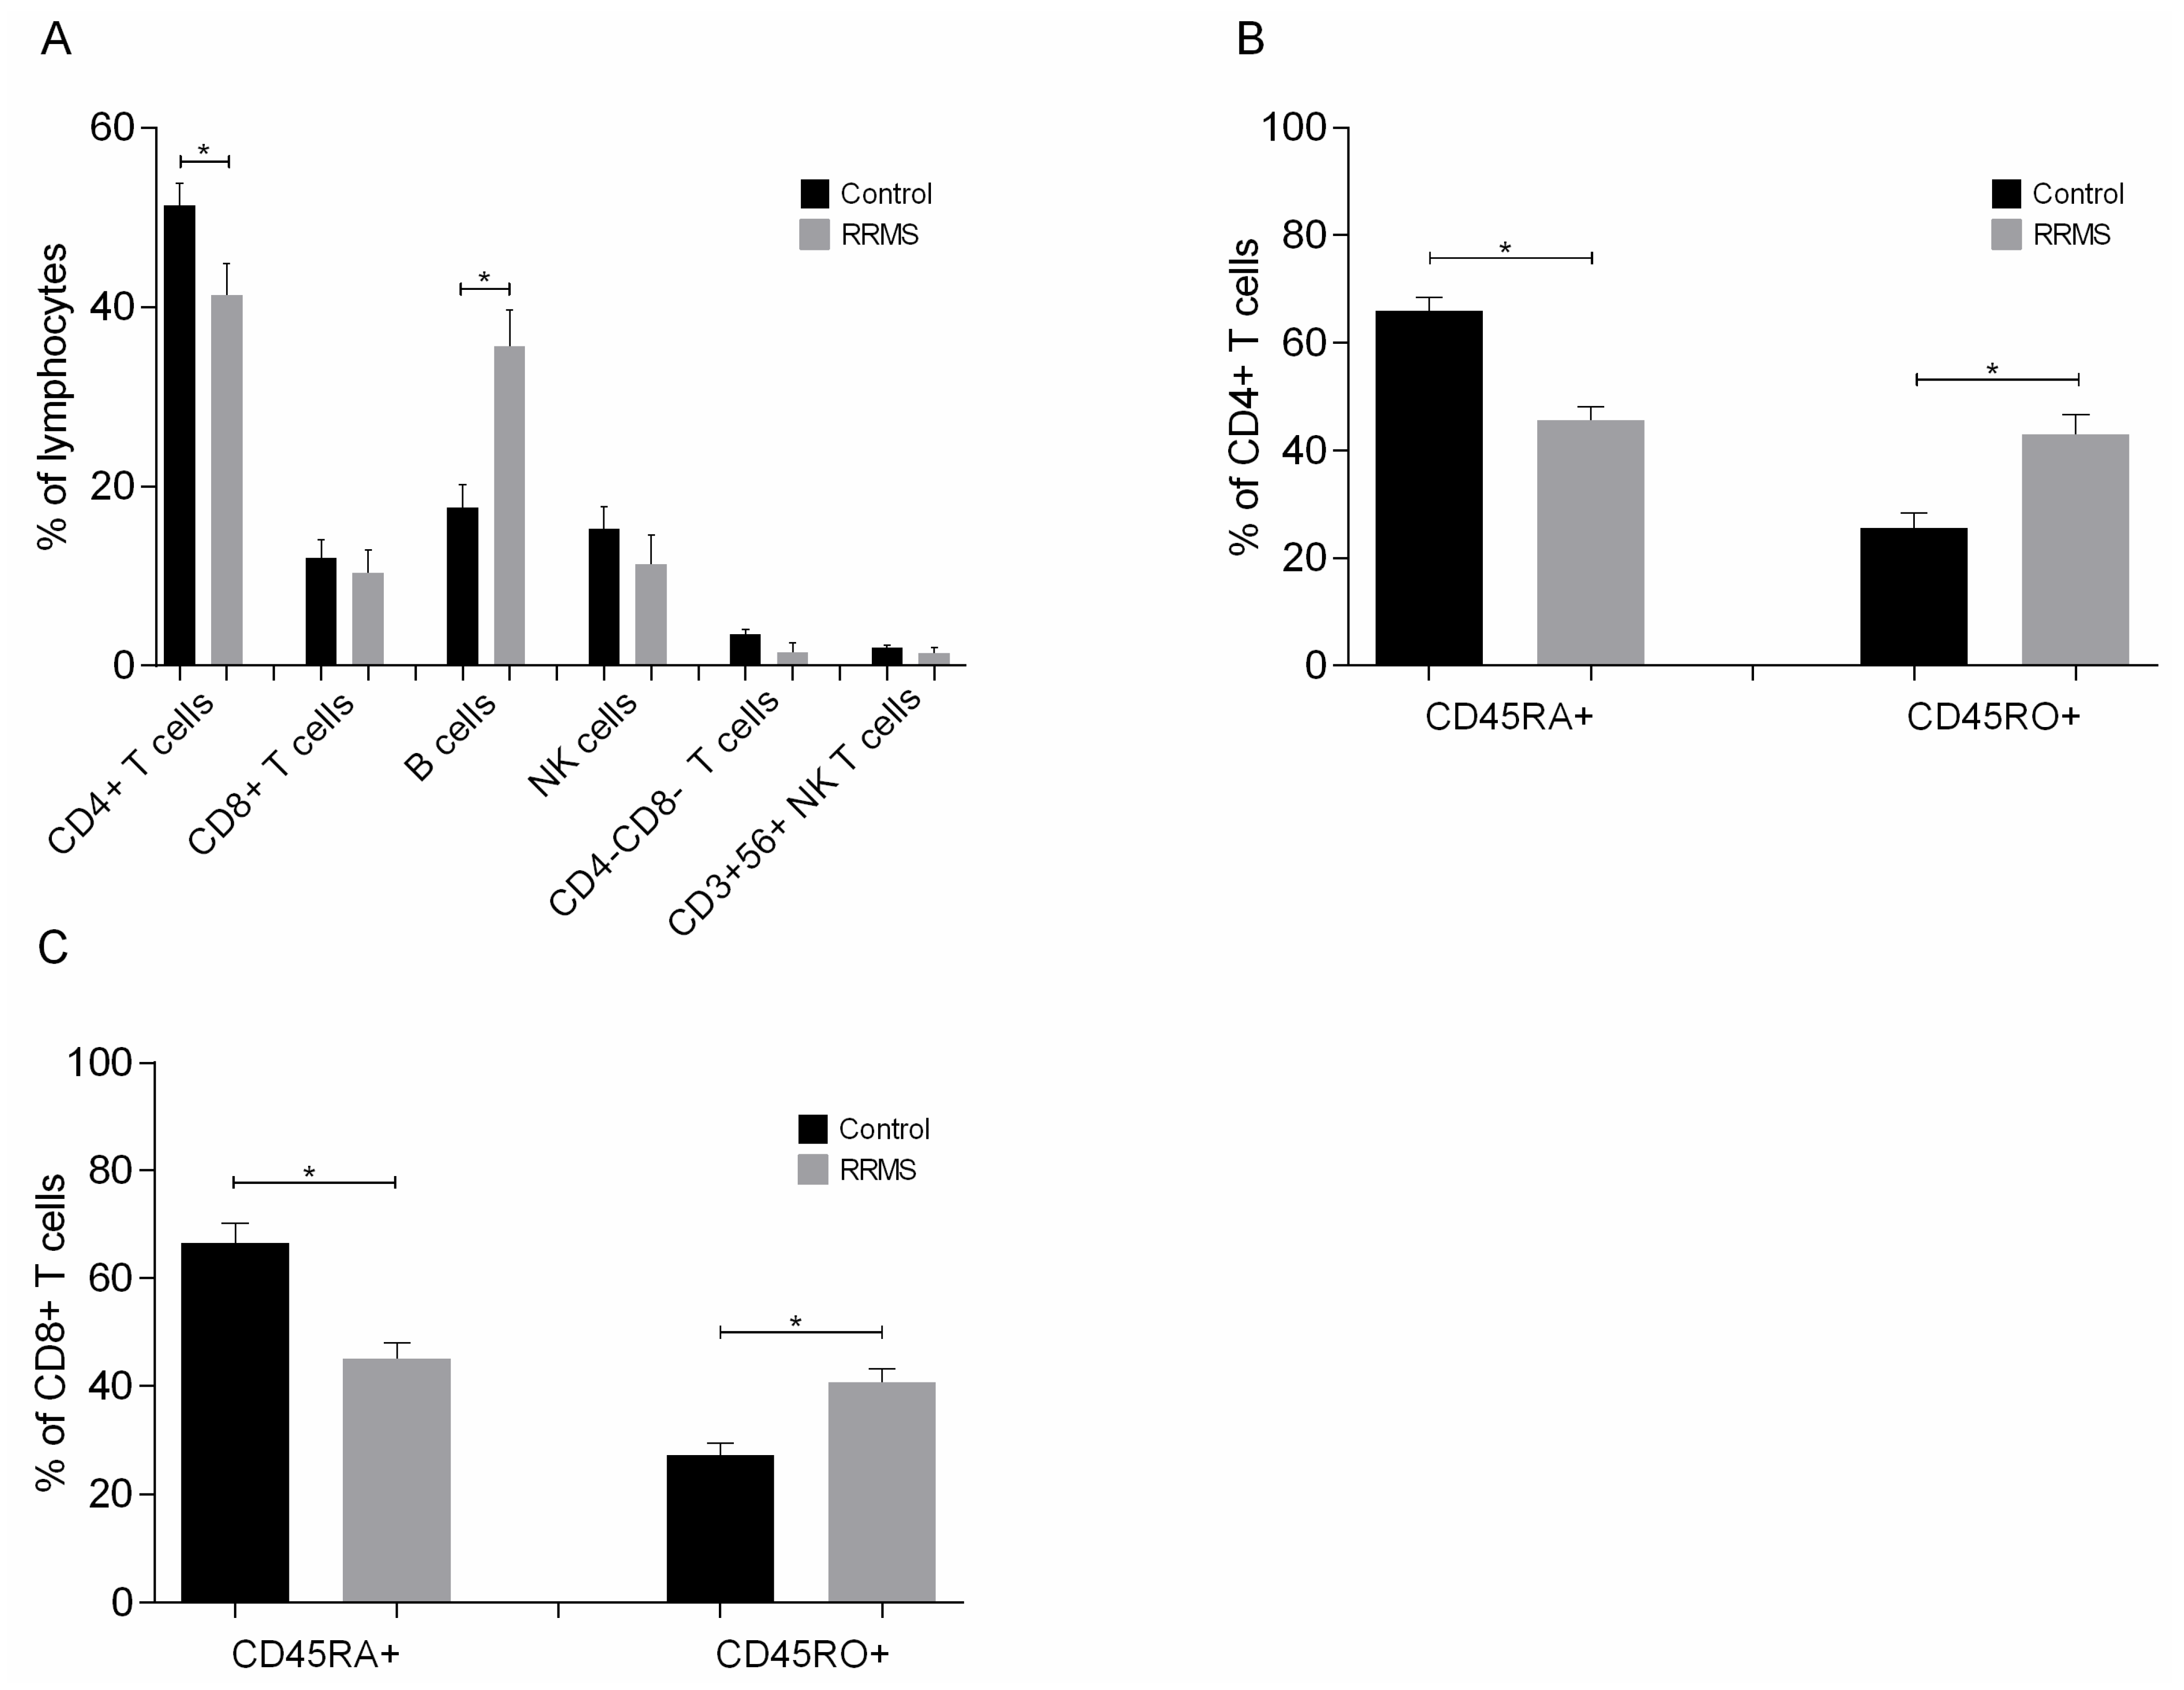
- Cells
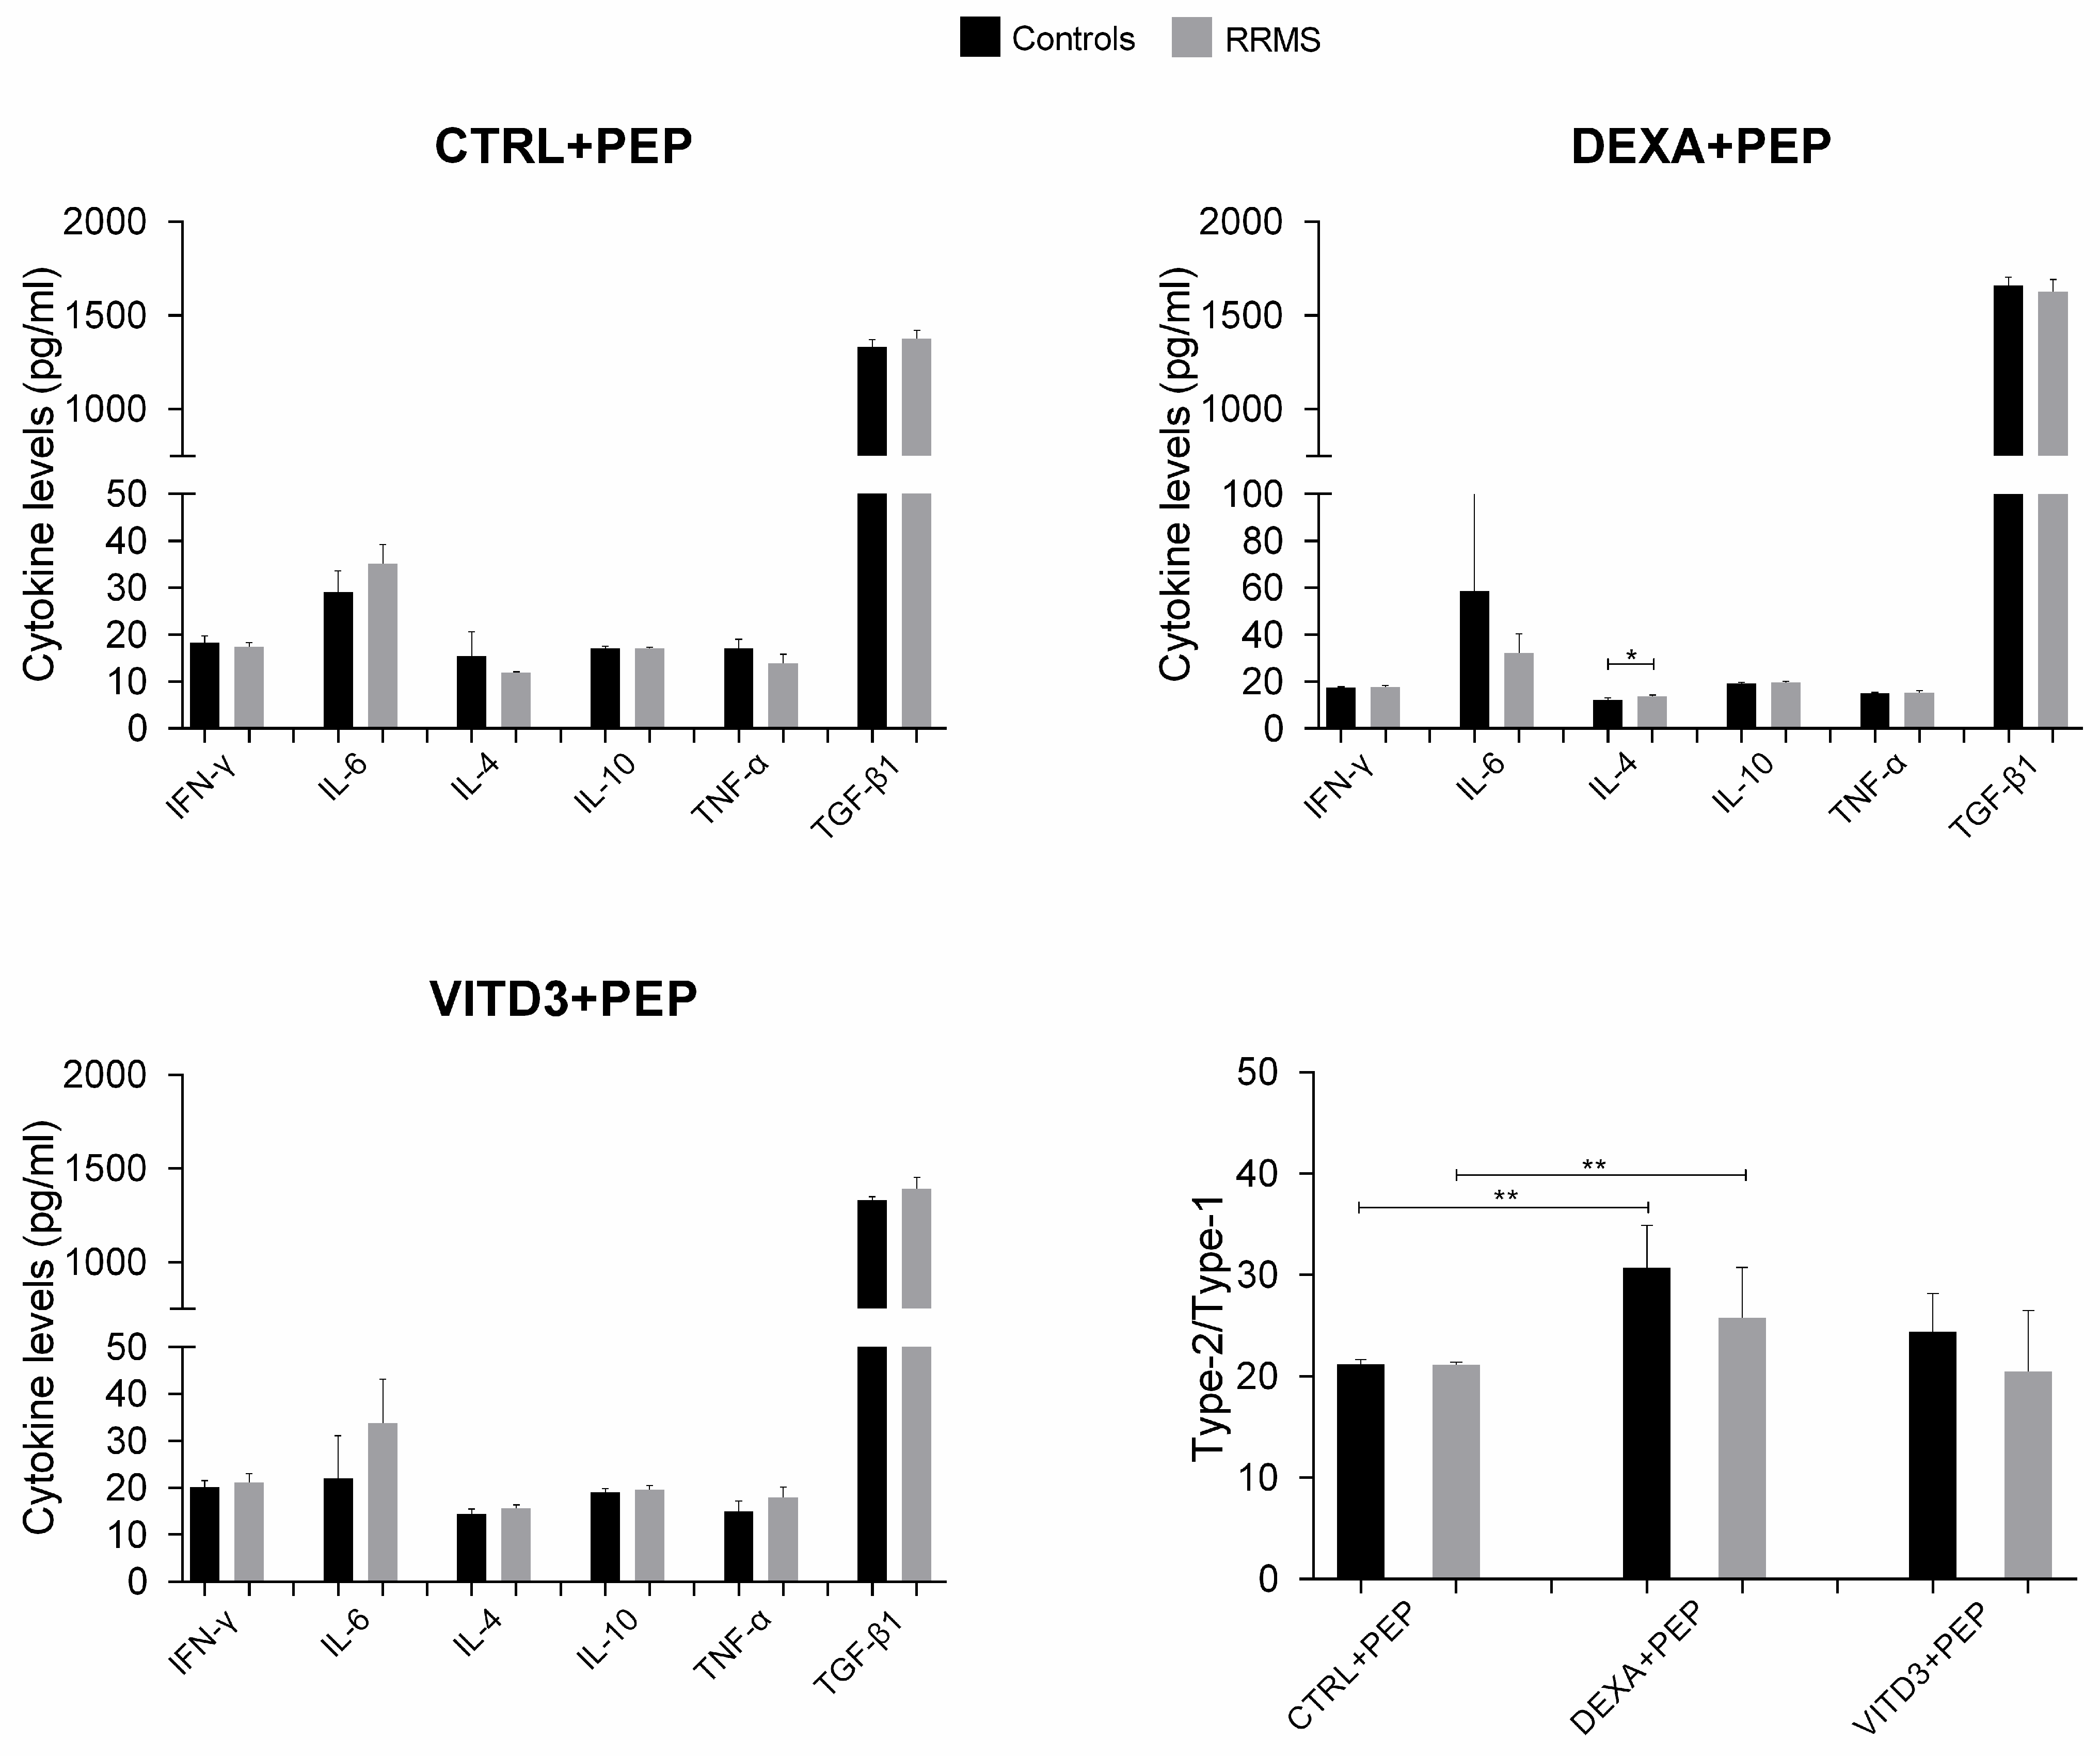
- Cytokines
3. Discussion
4. Materials and Methods
4.1. Study Subjects
4.2. Cells and Cultures
4.3. Flow Cytometry
4.4. Measurement of Cytokines
4.5. Statistical Analysis
Supplementary Materials
Author Contributions
Funding
Institutional Review Board Statement
Informed Consent Statement
Data Availability Statement
Acknowledgments
Conflicts of Interest
References
- Gakis, G.; Angelopoulos, I.; Panagoulias, I.; Mouzaki, A. Current knowledge on multiple sclerosis pathophysiology, disability progression assessment and treatment options, and the role of autologous hematopoietic stem cell transplantation. Autoimmun. Rev. 2023, 23, 103480. [Google Scholar] [CrossRef] [PubMed]
- Seil, F.J. Myelin Antigens and Antimyelin Antibodies. In Advances in Clinical Immunology, Medical Microbiology, COVID-19, and Big Data 2021; Jenny Stanford Publishing: New York, NY, USA, 2021; Chapter 5. [Google Scholar] [CrossRef]
- Matsoukas, J.; Apostolopoulos, V.; Kalbacher, H.; Papini, A.M.; Tselios, T.; Chatzantoni, K.; Biagioli, T.; Lolli, F.; Deraos, S.; Papathanassopoulos, P.; et al. Design and synthesis of a novel potent myelin basic protein epitope 87–99 cyclic analogue: Enhanced stability and biological properties of mimics render them a potentially new class of immunomodulators. J. Med. Chem. 2005, 48, 1470–1480. [Google Scholar] [CrossRef] [PubMed]
- Lourbopoulos, A.; Deraos, G.; Matsoukas, M.T.; Touloumi, O.; Giannakopoulou, A.; Kalbacher, H.; Grigoriadis, N.; Apostolopoulos, V.; Matsoukas, J. Cyclic MOG35–55 ameliorates clinical and neuropathological features of experimental autoimmune encephalomyelitis. Bioorg. Med. Chem. 2017, 25, 4163–4174. [Google Scholar] [CrossRef] [PubMed]
- Lourbopoulos, A.; Matsoukas, M.T.; Katsara, M.; Deraos, G.; Giannakopoulou, A.; Lagoudaki, R.; Grigoriadis, N.; Matsoukas, J.; Apostolopoulos, V. Cyclization of PLP139–151 peptide reduces its encephalitogenic potential in experimental autoimmune encephalomyelitis. Bioorg. Med. Chem. 2018, 26, 2221–2228. [Google Scholar] [CrossRef] [PubMed]
- Deraos, G.; Kritsi, E.; Matsoukas, M.T.; Christopoulou, K.; Kalbacher, H.; Zoumpoulakis, P.; Apostolopoulos, V.; Matsoukas, J. Design of Linear and Cyclic Mutant Analogues of Dirucotide Peptide (MBP82–98) against Multiple Sclerosis: Conformational and Binding Studies to MHC Class II. Brain Sci. 2018, 8, 213. [Google Scholar] [CrossRef] [PubMed]
- Kappos, L.; Comi, G.; Panitch, H.; Oger, J.; Antel, J.; Conlon, P.; Steinman, L. Induction of a non-encephalitogenic type 2 T helper-cell autoimmune response in multiple sclerosis after administration of an altered peptide ligand in a placebo-controlled, randomized phase II trial. Nat. Med. 2000, 6, 1176–1182. [Google Scholar] [CrossRef] [PubMed]
- Bielekova, B.; Goodwin, B.; Richert, N.; Cortese, I.; Kondo, T.; Afshar, G.; Gran, B.; Eaton, J.; Antel, J.; Frank, J.A.; et al. Encephalitogenic potential of the myelin basic protein peptide (amino acids 83–99) in multiple sclerosis: Results of a phase II clinical trial with an altered peptide ligand. Nat. Med. 2000, 6, 1167–1175. [Google Scholar] [CrossRef] [PubMed]
- Warren, K.G.; Catz, I.; Ferenczi, L.Z.; Krantz, M.J. Intravenous synthetic peptide MBP8298 delayed disease progression in an HLA Class II-defined cohort of patients with progressive multiple sclerosis: Results of a 24-month double-blind placebo-controlled clinical trial and 5 years of follow-up treatment. Eur. J. Neurol. 2006, 13, 887–895. [Google Scholar] [CrossRef] [PubMed]
- Freedman, M.S.; Bar-Or, A.; Oger, J.; Traboulsee, A.; Patry, D.; Young, C.; Olsson, T.; Li, D.; Hartung, H.P.; Krantz, M.; et al. A phase III study evaluating the efficacy and safety of MBP8298 in secondary progressive MS. Neurology 2011, 77, 1551–1560. [Google Scholar] [CrossRef]
- Sheng, K.C.; Kalkanidis, M.; Pouniotis, D.S.; Wright, M.D.; Pietersz, G.A.; Apostolopoulos, V. The adjuvanticity of a mannosylated antigen reveals TLR4 functionality essential for subset specialization and functional maturation of mouse dendritic cells. J. Immunol. 2008, 181, 2455–2464. [Google Scholar] [CrossRef]
- Vassilaros, S.; Tsibanis, A.; Tsikkinis, A.; Pietersz, G.A.; McKenzie, I.F.; Apostolopoulos, V. Up to 15-year clinical follow-up of a pilot Phase III immunotherapy study in stage II breast cancer patients using oxidized mannan-MUC1. Immunotherapy 2013, 5, 1177–1182. [Google Scholar] [CrossRef] [PubMed]
- Apostolopoulos, V.; Pietersz, G.A.; Tsibanis, A.; Tsikkinis, A.; Stojanovska, L.; McKenzie, I.F.; Vassilaros, S. Dendritic cell immunotherapy: Clinical outcomes. Clin. Transl. Immunol. 2014, 3, e21. [Google Scholar] [CrossRef] [PubMed]
- Day, S.; Tselios, T.; Androutsou, M.E.; Tapeinou, A.; Frilligou, I.; Stojanovska, L.; Matsoukas, J.; Apostolopoulos, V. Mannosylated Linear and Cyclic Single Amino Acid Mutant Peptides Using a Small 10 Amino Acid Linker Constitute Promising Candidates Against Multiple Sclerosis. Front. Immunol. 2015, 6, 136. [Google Scholar] [CrossRef] [PubMed]
- Tseveleki, V.; Tselios, T.; Kanistras, I.; Koutsoni, O.; Karamita, M.; Vamvakas, S.S.; Apostolopoulos, V.; Dotsika, E.; Matsoukas, J.; Lassmann, H.; et al. Mannan-conjugated myelin peptides prime non-pathogenic Th1 and Th17 cells and ameliorate experimental autoimmune encephalomyelitis. Exp. Neurol. 2015, 267, 254–267. [Google Scholar] [CrossRef]
- Dagkonaki, A.; Avloniti, M.; Evangelidou, M.; Papazian, I.; Kanistras, I.; Tseveleki, V.; Lampros, F.; Tselios, T.; Jensen, L.T.; Möbius, W.; et al. Mannan-MOG35–55 Reverses Experimental Autoimmune Encephalomyelitis, Inducing a Peripheral Type 2 Myeloid Response, Reducing CNS Inflammation, and Preserving Axons in Spinal Cord Lesions. Front. Immunol. 2020, 11, 575451. [Google Scholar] [CrossRef] [PubMed]
- Rodi, M.; Dimisianos, N.; de Lastic, A.L.; Sakellaraki, P.; Deraos, G.; Matsoukas, J.; Papathanasopoulos, P.; Mouzaki, A. Regulatory Cell Populations in Relapsing-Remitting Multiple Sclerosis (RRMS) Patients: Effect of Disease Activity and Treatment Regimens. Int. J. Mol. Sci. 2016, 17, 1398. [Google Scholar] [CrossRef] [PubMed]
- Matsoukas, J.; Deraos, G.; Kelaidonis, K.; Hossain, M.K.; Feehan, J.; Tzakos, A.G.; Matsoukas, E.; Topoglidis, E.; Apostolopoulos, V. Myelin Peptide-Mannan Conjugate Multiple Sclerosis Vaccines: Conjugation Efficacy and Stability of Vaccine Ingredient. Vaccines 2021, 9, 1456. [Google Scholar] [CrossRef] [PubMed]
- Gkika, A.; Androutsou, M.E.; Aletras, A.J.; Tselios, T. Competitive ELISA for the identification of 35–55 myelin oligodendrocyte glycoprotein immunodominant epitope conjugated with mannan. J. Pept. Sci. 2023, 29, e3493. [Google Scholar] [CrossRef]
- Raϊch-Regué, D.; Grau-López, L.; Naranjo-Gómez, M.; Ramo-Tello, C.; Pujol-Borrell, R.; Martínez-Cáceres, E.; Borràs, F.E. Stable antigen-specific T-cell hyporesponsiveness induced by tolerogenic dendritic cells from multiple sclerosis patients. Eur. J. Immunol. 2012, 42, 771–782. [Google Scholar] [CrossRef]
- Anderson, A.E.; Swan, D.J.; Wong, O.Y.; Buck, M.; Eltherington, O.; Harry, R.A.; Patterson, A.M.; Pratt, A.G.; Reynolds, G.; Doran, J.P.; et al. Tolerogenic dendritic cells generated with dexamethasone and vitamin D3 regulate rheumatoid arthritis CD4+ T cells partly via transforming growth factor-β1. Clin. Exp. Immunol. 2017, 187, 113–123. [Google Scholar] [CrossRef]
- Ardeshna, K.M.; Pizzey, A.R.; Devereux, S.; Khwaja, A. The PI3 kinase, p38 SAP kinase, and NF-kappaB signal transduction pathways are involved in the survival and maturation of lipopolysaccharide-stimulated human monocyte-derived dendritic cells. Blood 2000, 96, 1039–1046. [Google Scholar] [CrossRef] [PubMed]
- Hubo, M.; Trinschek, B.; Kryczanowsky, F.; Tuettenberg, A.; Steinbrink, K.; Jonuleit, H. Costimulatory molecules on immunogenic versus tolerogenic human dendritic cells. Front. Immunol. 2013, 4, 82. [Google Scholar] [CrossRef] [PubMed]
- Mellman, I.; Steinman, R.M. Dendritic cells: Specialized and regulated antigen processing machines. Cell 2001, 106, 255–258. [Google Scholar] [CrossRef] [PubMed]
- Vanherwegen, A.S.; Eelen, G.; Ferreira, G.B.; Ghesquière, B.; Cook, D.P.; Nikolic, T.; Roep, B.; Carmeliet, P.; Telang, S.; Mathieu, C.; et al. Vitamin D controls the capacity of human dendritic cells to induce functional regulatory T cells by regulation of glucose metabolism. J. Steroid Biochem. Mol. Biol. 2019, 187, 134–145. [Google Scholar] [CrossRef] [PubMed]
- Mohammadzadeh, A.; Rad, I.A.; Ahmadi-Salmasi, B. CTLA-4, PD-1 and TIM-3 expression predominantly downregulated in MS patients. J. Neuroimmunol. 2018, 323, 105–108. [Google Scholar] [CrossRef] [PubMed]
- Galoppin, M.; Kari, S.; Soldati, S.; Pal, A.; Rival, M.; Engelhardt, B.; Astier, A.; Thouvenot, E. Full spectrum of vitamin D immunomodulation in multiple sclerosis: Mechanisms and therapeutic implications. Brain Commun. 2022, 4, fcac171. [Google Scholar] [CrossRef] [PubMed]
- Triantos, C.; Aggeletopoulou, I.; Thomopoulos, K.; Mouzaki, A. Vitamin D-Liver Disease Association: Biological Basis and Mechanisms of Action. Hepatology 2021, 74, 1065–1073. [Google Scholar] [CrossRef] [PubMed]
- Triantos, C.; Aggeletopoulou, I.; Mantzaris, G.J.; Mouzaki, A. Molecular basis of vitamin D action in inflammatory bowel disease. Autoimmun. Rev. 2022, 21, 103136. [Google Scholar] [CrossRef] [PubMed]
- Apostolopoulos, V.; Chavda, V.P.; Feehan, J. Targeting dendritic cells for antigen delivery in vaccine design. In Advanced Vaccination Technologies for Infectious and Chronic Diseases; Academic Press: Cambridge, MA, USA, 2024; pp. 153–165. [Google Scholar] [CrossRef]
- Kurtzke, J.F. Rating neurologic impairment in multiple sclerosis: An expanded disability status scale (EDSS). Neurology 1983, 33, 1444–1452. [Google Scholar] [CrossRef]
- How to Isolate PBMCs from Whole Blood Using Density Gradient Centrifugation (Ficoll™ or Lymphoprep™). Available online: https://www.stemcell.com/how-to-isolate-mononuclear-cells-from-whole-blood-by-density-gradient-centrifugation.html (accessed on 27 May 2024).
- De Lastic, A.L.; Rodi, M.; Mouzaki, A. Effect of dendritic cell state and antigen-presentation conditions on resulting T-cell phenotypes and Th cytokine profiles. Immunobiology 2016, 221, 862–870. [Google Scholar] [CrossRef]


| Study Subjects | RRMS | Controls |
|---|---|---|
| n (M/F) | 10 (4/6) | 10 (5/5) |
| Age (range, y) | 24–38 | 24–38 |
| Disease duration (range, y) | 2–7 | na |
| EDSS (range) | 1–2.5 | na |
| Treatment with IFNβ (n) | 6 | na |
| % of lymphocytes in peripheral blood (mean (SD)) | 35.19 (9.14) | 28.97 (10.19) |
| % of monocytes in peripheral blood (mean (SD)) | 7.25 (1.53) | 6.86 (1.49) |
| Target Antigen | Company | Clone | Fluorochrome |
|---|---|---|---|
| CD3 | Beckman Coulter | UCHT1 | PC5 |
| CD4 | Beckman Coulter | 13B8.2 | FITC |
| CD8 | Beckman Coulter | B9.11 | FITC |
| CD8 | Becton Dickinson | PRA-T8 | PE |
| CD14 | Becton Dickinson | M5E2 | FITC |
| CD25 | Becton Dickinson | M-A251 | PE |
| CD40 | Becton Dickinson | 5C3 | PE |
| CD45-RA | Becton Dickinson | HI100 | PE |
| CD45-RO | Becton Dickinson | UCHL1 | PE |
| CD56 | Beckman Coulter | N901 | PE |
| CD69 | Becton Dickinson | FN50 | PE |
| CD80 | Becton Dickinson | L307.4 | PE |
| CD83 | Becton Dickinson | HB15e | PC5 |
| CD86 | Becton Dickinson | IT2.2 | PE |
| CD279 (PD-1) | Beckman Coulter | PD1.3 | PE |
| HLA-DR | Becton Dickinson | TU36 | PE |
| HLA-DR | Becton Dickinson | TU36 | PC5 |
| Foxp3 | eBioscience | PCH101 | PC5 |
Disclaimer/Publisher’s Note: The statements, opinions and data contained in all publications are solely those of the individual author(s) and contributor(s) and not of MDPI and/or the editor(s). MDPI and/or the editor(s) disclaim responsibility for any injury to people or property resulting from any ideas, methods, instructions or products referred to in the content. |
© 2024 by the authors. Licensee MDPI, Basel, Switzerland. This article is an open access article distributed under the terms and conditions of the Creative Commons Attribution (CC BY) license (https://creativecommons.org/licenses/by/4.0/).
Share and Cite
Rodi, M.; de Lastic, A.-L.; Panagoulias, I.; Aggeletopoulou, I.; Kelaidonis, K.; Matsoukas, J.; Apostolopoulos, V.; Mouzaki, A. Myelin Oligodendrocyte Glycoprotein (MOG)35–55 Mannan Conjugate Induces Human T-Cell Tolerance and Can Be Used as a Personalized Therapy for Multiple Sclerosis. Int. J. Mol. Sci. 2024, 25, 6092. https://doi.org/10.3390/ijms25116092
Rodi M, de Lastic A-L, Panagoulias I, Aggeletopoulou I, Kelaidonis K, Matsoukas J, Apostolopoulos V, Mouzaki A. Myelin Oligodendrocyte Glycoprotein (MOG)35–55 Mannan Conjugate Induces Human T-Cell Tolerance and Can Be Used as a Personalized Therapy for Multiple Sclerosis. International Journal of Molecular Sciences. 2024; 25(11):6092. https://doi.org/10.3390/ijms25116092
Chicago/Turabian StyleRodi, Maria, Anne-Lise de Lastic, Ioannis Panagoulias, Ioanna Aggeletopoulou, Kostas Kelaidonis, John Matsoukas, Vasso Apostolopoulos, and Athanasia Mouzaki. 2024. "Myelin Oligodendrocyte Glycoprotein (MOG)35–55 Mannan Conjugate Induces Human T-Cell Tolerance and Can Be Used as a Personalized Therapy for Multiple Sclerosis" International Journal of Molecular Sciences 25, no. 11: 6092. https://doi.org/10.3390/ijms25116092
APA StyleRodi, M., de Lastic, A.-L., Panagoulias, I., Aggeletopoulou, I., Kelaidonis, K., Matsoukas, J., Apostolopoulos, V., & Mouzaki, A. (2024). Myelin Oligodendrocyte Glycoprotein (MOG)35–55 Mannan Conjugate Induces Human T-Cell Tolerance and Can Be Used as a Personalized Therapy for Multiple Sclerosis. International Journal of Molecular Sciences, 25(11), 6092. https://doi.org/10.3390/ijms25116092