Abstract
The Sirtuin (SIRT1-7) family comprises seven evolutionary-conserved enzymes that couple cellular NAD availability with health, nutrition and welfare status in vertebrates. This study re-annotated the sirt3/5 branch in the gilthead sea bream, revealing three paralogues of sirt3 (sirt3.1a/sirt3.1b/sirt3.2) and two of sirt5 (sirt5a/sirt5b) in this Perciform fish. The phylogeny and synteny analyses unveiled that the Sirt3.1/Sirt3.2 dichotomy was retained in teleosts and aquatic-living Sarcopterygian after early vertebrate 2R whole genome duplication (WGD). Additionally, only certain percomorphaceae and gilthead sea bream showed a conserved tandem-duplicated synteny block involving the mammalian-clustered sirt3.1 gene (psmd13-sirt3.1a/b-drd4-cdhr5-ctsd). Conversely, the expansion of the Sirt5 branch was shaped by the teleost-specific 3R WGD. As extensively reviewed in the literature, human-orthologues (sirt3.1/sirt5a) showed a high, conserved expression in skeletal muscle that increased as development advanced. However, recent sirt3.2 and sirt5b suffered an overall muscle transcriptional silencing across life, as well as an enhanced expression on immune-relevant tissues and gills. These findings fill gaps in the ontogeny and differentiation of Sirt genes in the environmentally adaptable gilthead sea bream, becoming a good starting point to advance towards a full understanding of its neo-functionalization. The mechanisms originating from these new paralogs also open new perspectives in the study of cellular energy sensing processes in vertebrates.
1. Introduction
Sirtuins (SIRTs) are a family of evolutionarily conserved enzymes that couple protein deacylation with the energy status of the cell via the cellular NAD+/NADH ratio [1]. These NAD+-dependent enzymes share different cellular locations (nucleus, cytoplasm, and mitochondria), and a wide tissue-specific gene expression pattern that reflects their involvement in a variety of fundamental biological processes [2,3,4]. Indeed, targets of SIRTs include regulators of DNA repair, inflammation, and energy metabolism [5]. In mammals, this protein family is composed of seven paralog counterparts (SIRT1-7), and their down-regulated expression has been associated with the pathophysiology of aging [6]. Certainly, there is now evidence that SIRTs regulate multiple processes associated with the pathogenesis of Alzheimer’s disease; therefore, the therapeutic activation of SIRTs is emerging as an active area of research in the field of age-related disorders in humans [7]. However, a comprehensive evolutionary survey of the SIRT family remains unclear, though a recent study recognized the expansion of “Class I SIRT (SIRT1-3)” and “Class IV SIRT (SIRT6 and 7)” around the origin of animal branching, raising up to nine the number of SIRT paralogs [8]. Moreover, recent studies have highlighted the occurrence of an additional SIRT isotype in the genome of non-amniote vertebrates (cartilaginous fish, bony fish, coelacanth, lungfish, and amphibians) that was annotated as Sirt3.2 [9]. However, a universal taxonomy assignment remains difficult, being of relevance to untangle the evolutionary history and functional shift of the SIRT/Sirt gene family across the evolution of the vertebrate lineage.
In gilthead sea bream (Sparus aurata), an extensively cultivated fish in the Mediterranean basin, transcriptional studies revealed a ubiquitous sirt gene expression that was tissue-specific for each sirt isotype [10,11,12]. According to this, sirt1, but also sirt2 and sirt5, are expressed at relatively high levels. In contrast, sirt3, sirt4, sirt6, and sirt7 have been categorized as sirt isotypes with relatively low transcriptional activity. The exon–intron organization is also specific to each sirt paralog, ranging the number of exons from 3 in sirt4 to 16 in sirt2, though the gene organization (length and number of exons) seems to be relatively conserved for each SIRT ortholog through the vertebrate evolution. Conversely, the number and location of CpG islands (CGIs) are quite variable among fish genomes [13], and sirt genes in particular, despite their recognized role as an evolutionarily conserved mechanism that protects DNA from methylation, shaping the epigenome and the cell- and tissue-specific transcriptional patterns through development [14]. Thus, CGIs in close association with SP1 binding sites were predicted in the sirt1 promoter of several fish, including gilthead sea bream (gene ID: 1847824780), fugu (gene ID: 101061405), zebrafish (gene ID: 797132), tilapia (gene ID: 100700447), and Atlantic salmon (gene ID: 106576833). However, the CGIs of the sirt3 promoter do not appear to be conserved in all teleostean fish, which will be indicative of different permissive transcriptional rates, though it is not always true that genes with CGI promoters shaped a ubiquitous gene expression [15].
The aim of this study was to examine further the function and regulation of Sirt family in fish with a special focus on the farmed gilthead sea bream, a eurytherm, euryhaline, and protandrous hermaphrodite species with a well-recognized capacity to adapt to intensive aquaculture practices and alternative fish feeds [16,17,18,19,20]. The ultimate mechanisms responsive to this high functional plasticity remain elusive, though it can be favored by a high rate of short segmental duplications (SSDs) in a fish species with a third round (3R) of whole genome duplication (WGD) [21]. Certainly, WGD events result in hundreds to thousands of retained gene duplications, with great potential for the acquisition of new functions or sub-functionalizations of duplicates by the co-evolution of functionally related genes [22]. Indeed, the genome of gilthead sea bream (1.24 Gb) spans more than the genome of turbot (Scophthalmus maxima) (0.54 Gb) [23] or the European sea bass (Dicentrarchus labrax) (0.68 Gb) [24], but less than that of the common carp (Cyprinus carpio) (1.7 Gb) [25] and Atlantic salmon (Salmo salar) (2.90 Gb) [26] with a recent tetraploidization event (4R) [27]. The role of the components of the Sirt family could be of importance for the remarkable adaptive plasticity of this valuable cultured fish. Thus, we have re-examined the two already assembled gilthead sea bream genomes [21,28] in order to uncover new sirt isotypes, and to further classify and reannotate the components of this family by means of a combined approach based on structural genomics, phylogenetic, and synteny analyses. Furthermore, comprehensive transcriptomic profiling to identify the most abundant sirt isotypes per tissue was conducted. Finally, we monitored in fish development, from 60 days to 3 years of age, the expression patterns of relevant sirt isotypes and other syntenic genes focusing on insulin-like growth factor-binding proteins (igfbp1, igfbp3) in metabolically and growth-relevant tissues such as white skeletal muscle and liver. Altogether, this work represents an initial step in revealing how the adaptive expansion/contraction of some gene families such as sirt can contribute to increasing fitness and adaption through the evolution and in a challenging environment.
2. Results
2.1. Updated Sirt Catalogue
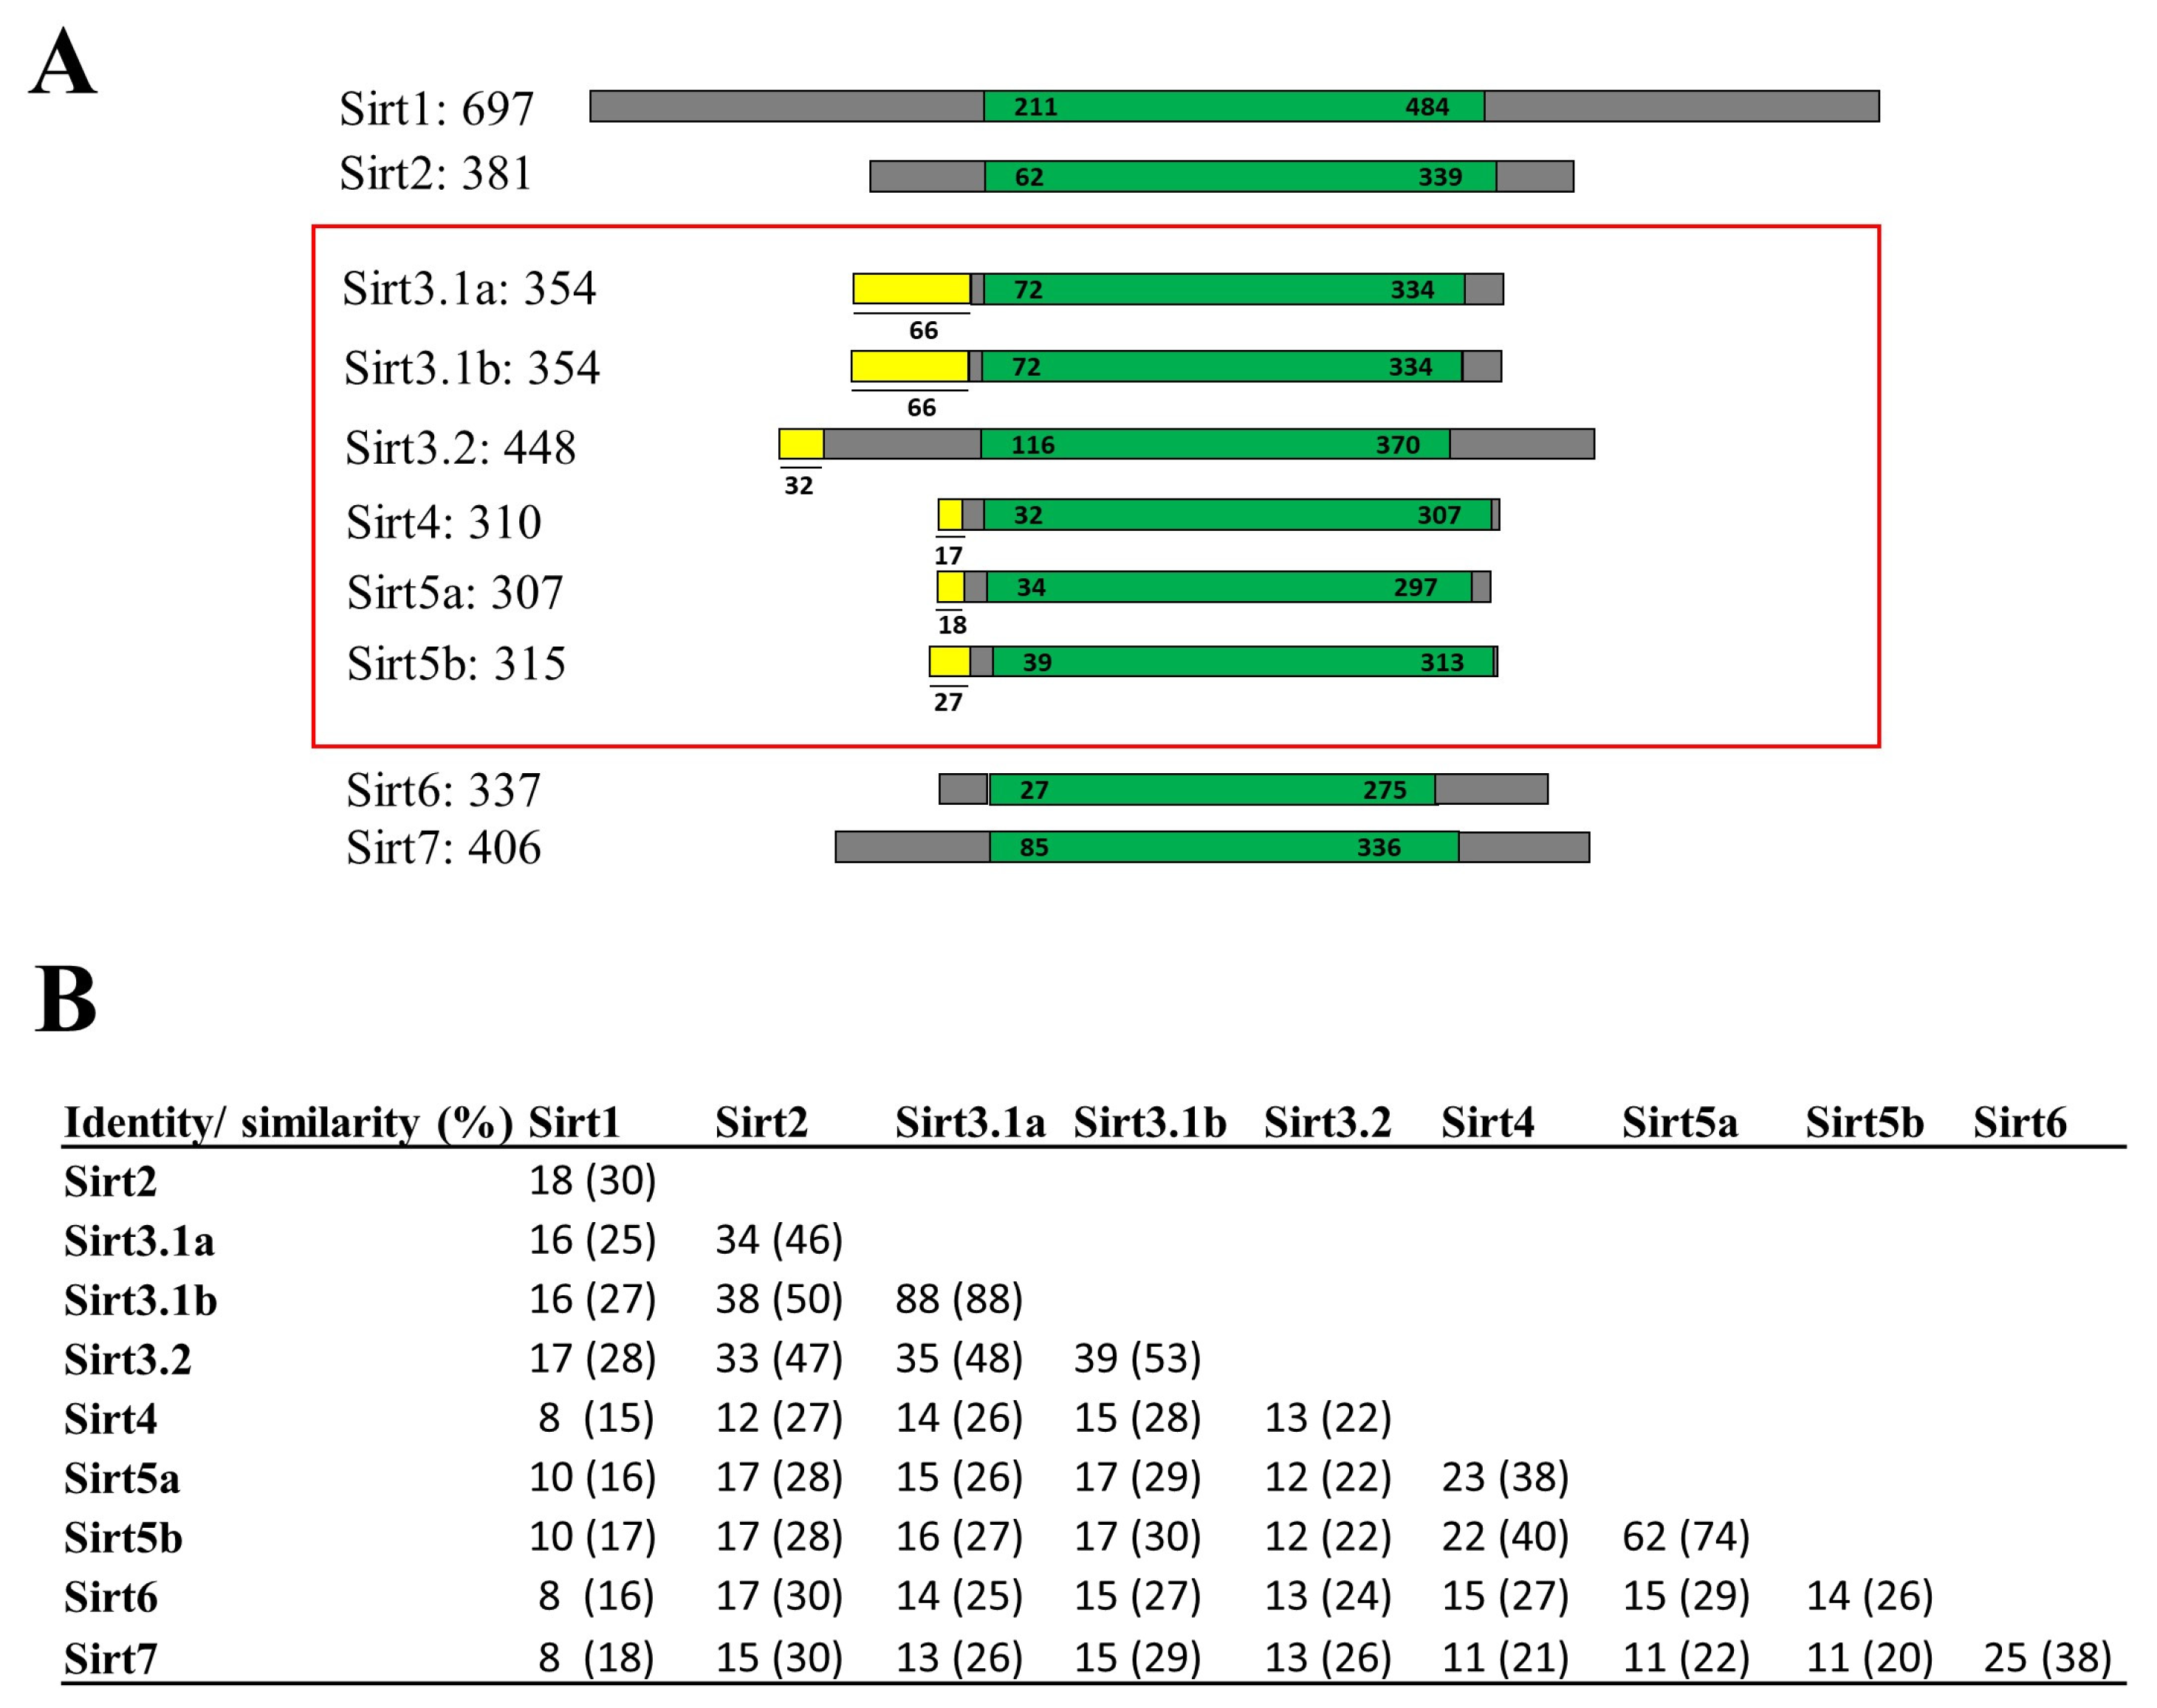
Data from PhylomeDB evidenced up to three new gilthead sea bream sirt gene isotypes that were embraced by SIRT3 and SIRT5 branches (Figures S1 and S2) (http://phylomedb.org (accessed on 23 May 2022); PHY00CLOW5_SPAAU and PHY00CKZTK_SPAAU accession numbers). These new sequences were uploaded to GenBank with accession numbers OR394775 (sirt3.1a), OR394776 (sirt3.1b), and OR394777 (sirt5b), being renamed their gilthead sea bream paralogs as sirt3.2 (AHX56275, before sirt3) and sirt5a (AHX56277, before sirt5) based on sequence, phylogeny, and synteny analyses. The graphical representation of all gilthead sea bream Sirt proteins with data on amino acid sequence identity and similarity are shown in Figure 1. A conserved catalytic domain of about 250 amino acids in length was evidenced in all the reported sequences, and mitochondrial peptide targets of 17–66 amino acids in length were identified in Sirt3, Sirt4, and Sirt5 paralogs (Figure 1A). According to the current SIRT classification of [29], the highest sequence conservation was found between Sirt1-3 (Class I), as well as Sirt4 (Class II) and Sirt5 (Class III), and Sirt6 and Sirt7 (Class IV). This rendered amino acid sequence similarities of 53–99% and 74% for the comparisons made within the expanded gene families of Sirt3 and Sirt5, respectively (Figure 1B).
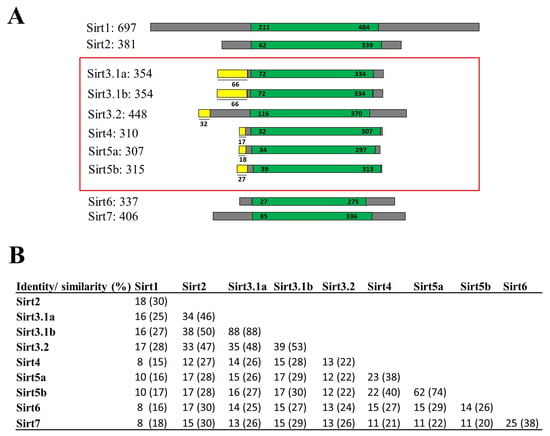
Figure 1.
(A) Graphical representation of all gilthead sea bream Sirt proteins. The catalytic core domain (in green) and the surrounding N- and C-terminal regions (in grey) are represented. The mitochondrial target peptides of mitochondrial Sirts (framed in red) are indicated in yellow. Numbers correspond to amino acid residues. Accession numbers of genes are listed below: sirt3.1a (OR394775; XP_030270596.1), sirt3.1b (OR394776), and sirt3.2 (AHX56275); human SIRT5 (Gene ID: 23408); GSB sirt5a (AHX56277); and sirt5b (OR394777). (B) Percentages of amino acid sequence identity and similarity (in parentheses) among gilthead sea bream Sirt family members.
2.2. Gene Structure and Organization
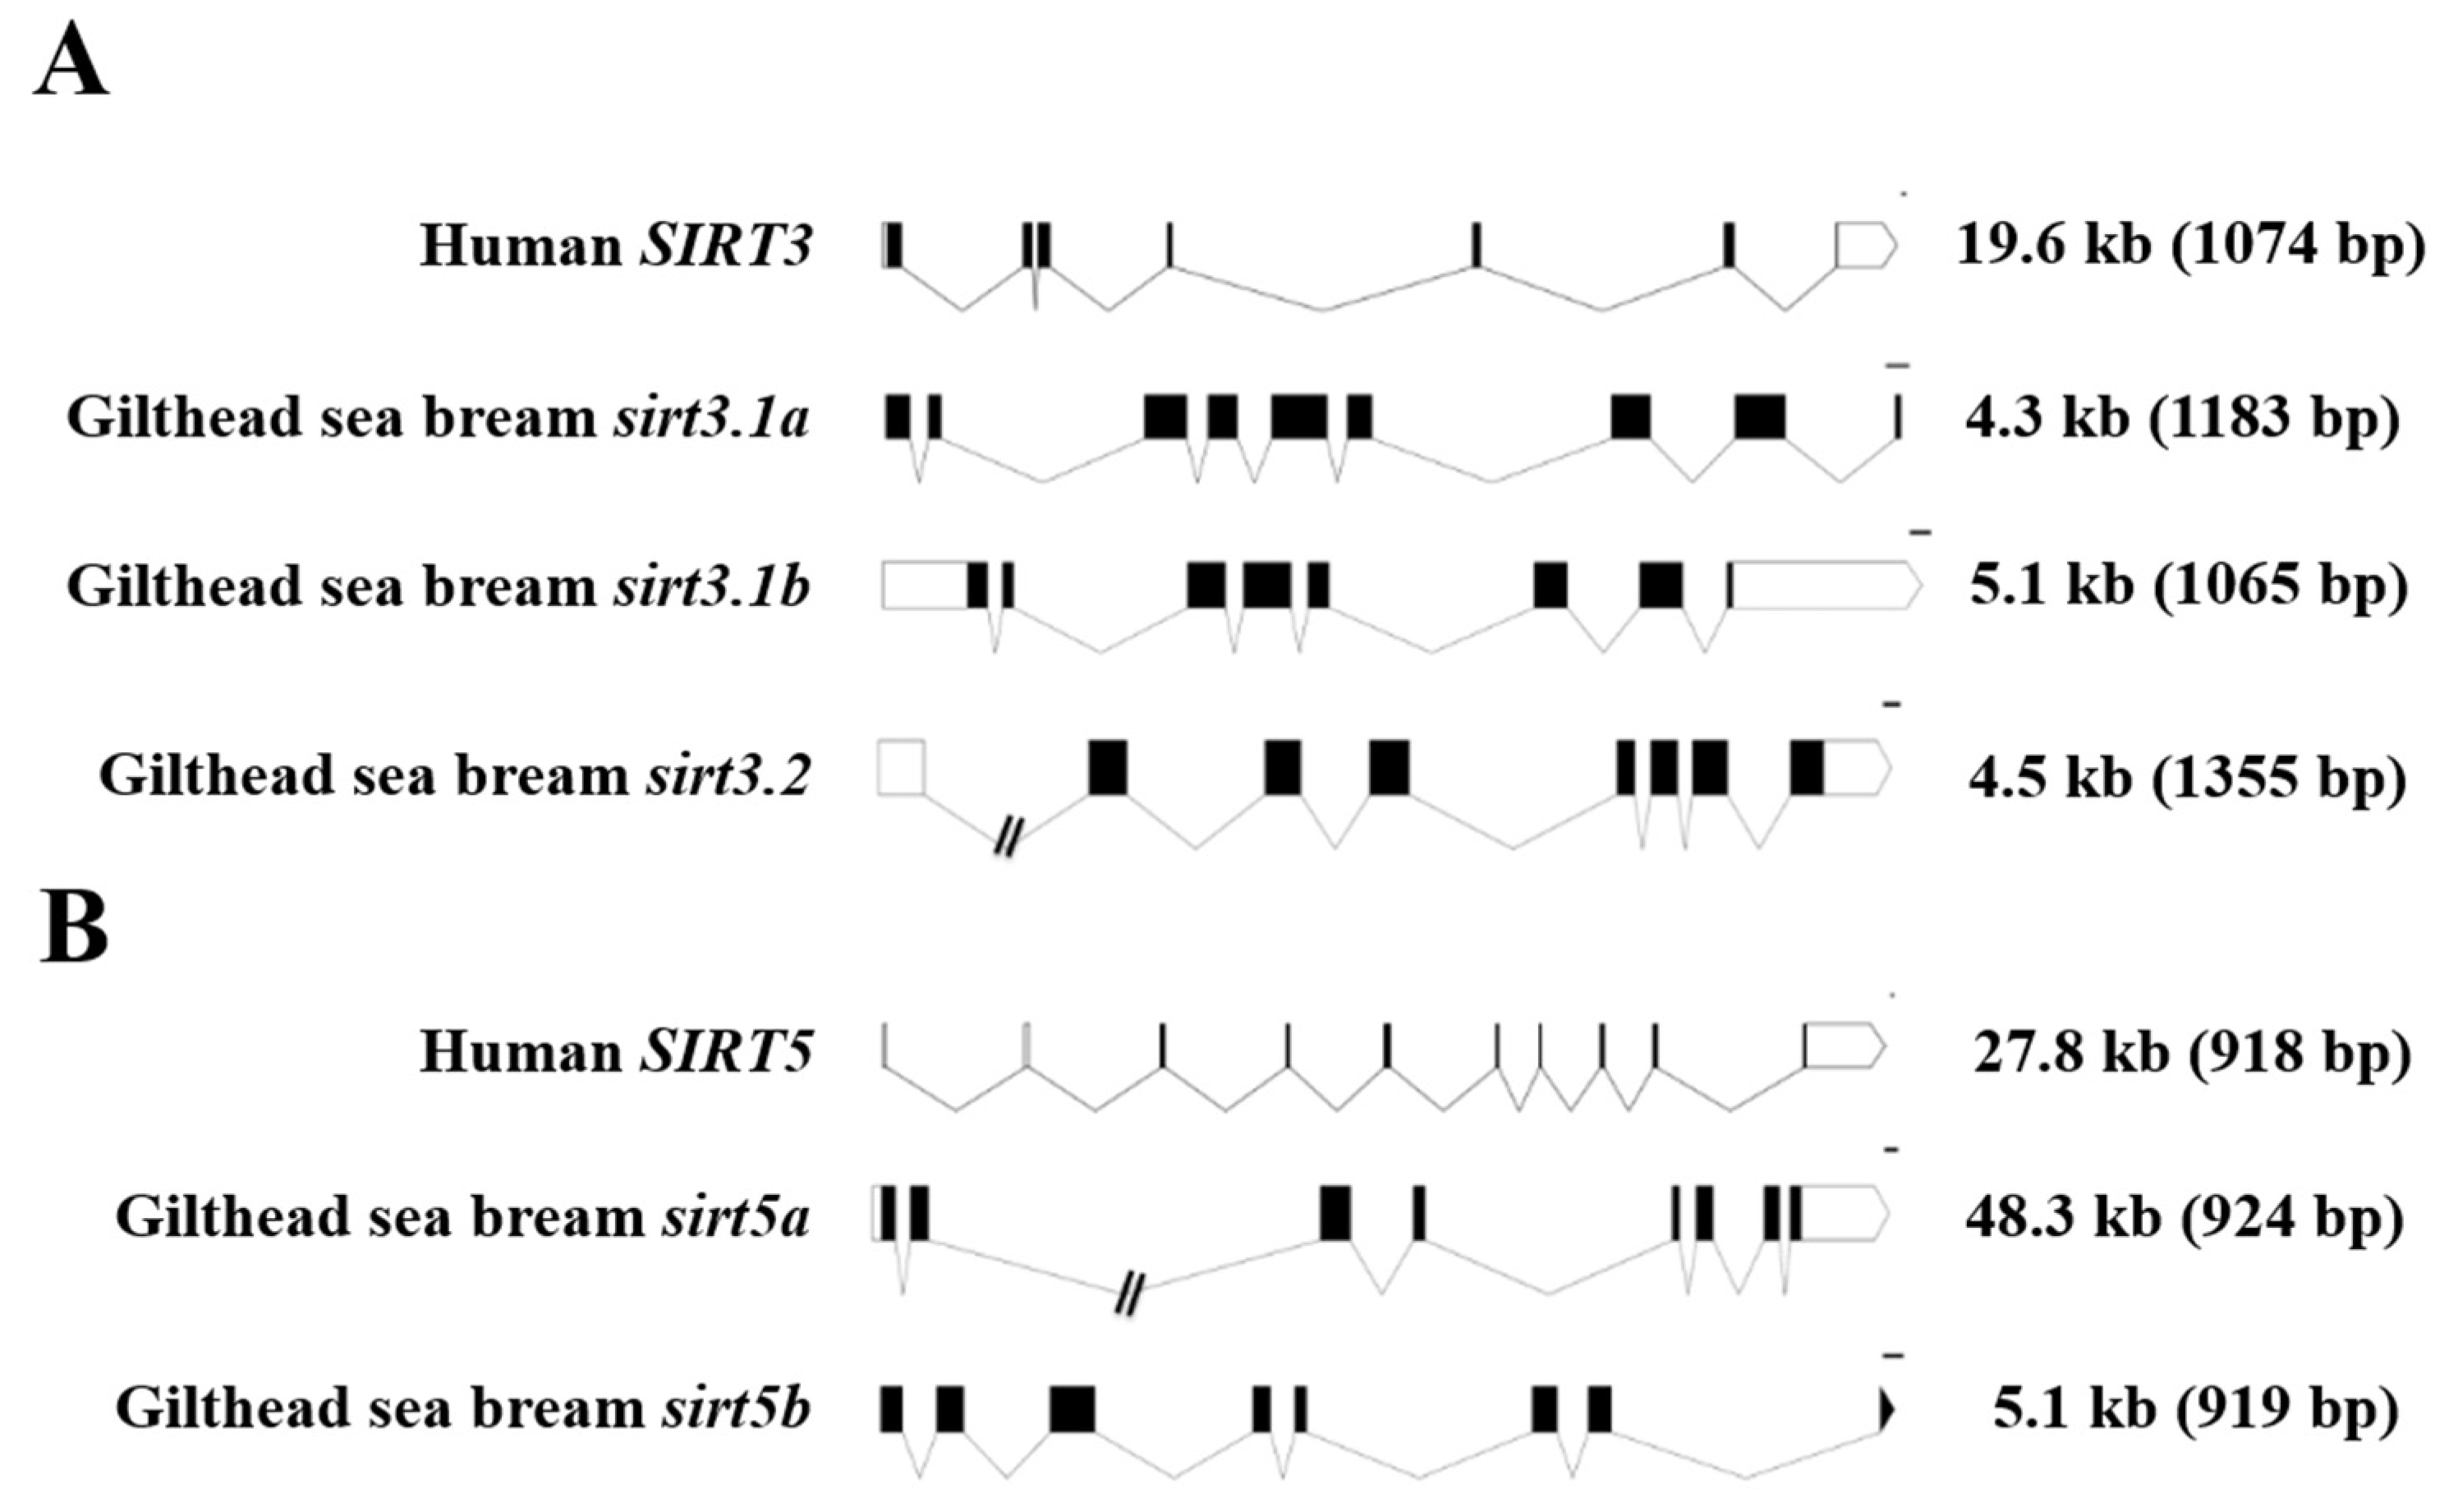
For comparative purposes, the exon–intron organization of human and gilthead sea bream SIRT3/sirt3 and SIRT5/sirt5 genes is shown in Figure 2. As a general feature, the retrieved gilthead sea bream sirt3 genes (sirt3.1a, sirt3.1b, sirt3.2) were shorter than the human SIRT3 counterpart (4.3–5.1 kb vs. 19.6 kb), changing the number of protein-coding exons from seven in the human SIRT3 to eight to nine in the duplicated gilthead sea bream sirt3.1 gene (Figure 2A). In contrast, the human and gilthead sea bream SIRT5/sirt5 genes showed the same number of protein-coding exons (8), but the gene length varied from 48.3 kb in sirt5a to 27.8 kb in SIRT5, and 5.1 kb in sirt5b (Figure 2B), conserving, more accurately than SIRT3/sirt3, the length of their coding region.

Figure 2.
Schematic representation of the exon–intron structure of the SIRT3 (A) and SIRT5 (B) paralogs of gilthead sea bream and human. White and black boxes represent the noncoding and coding exons, respectively. Introns are shown as connecting lines. Scale bars are 100 bp. Numbers indicate the total length of the sequences from ATG to the stop codon including and excluding (in brackets) introns.
2.3. Phylogenetic and Syntenic Analyses
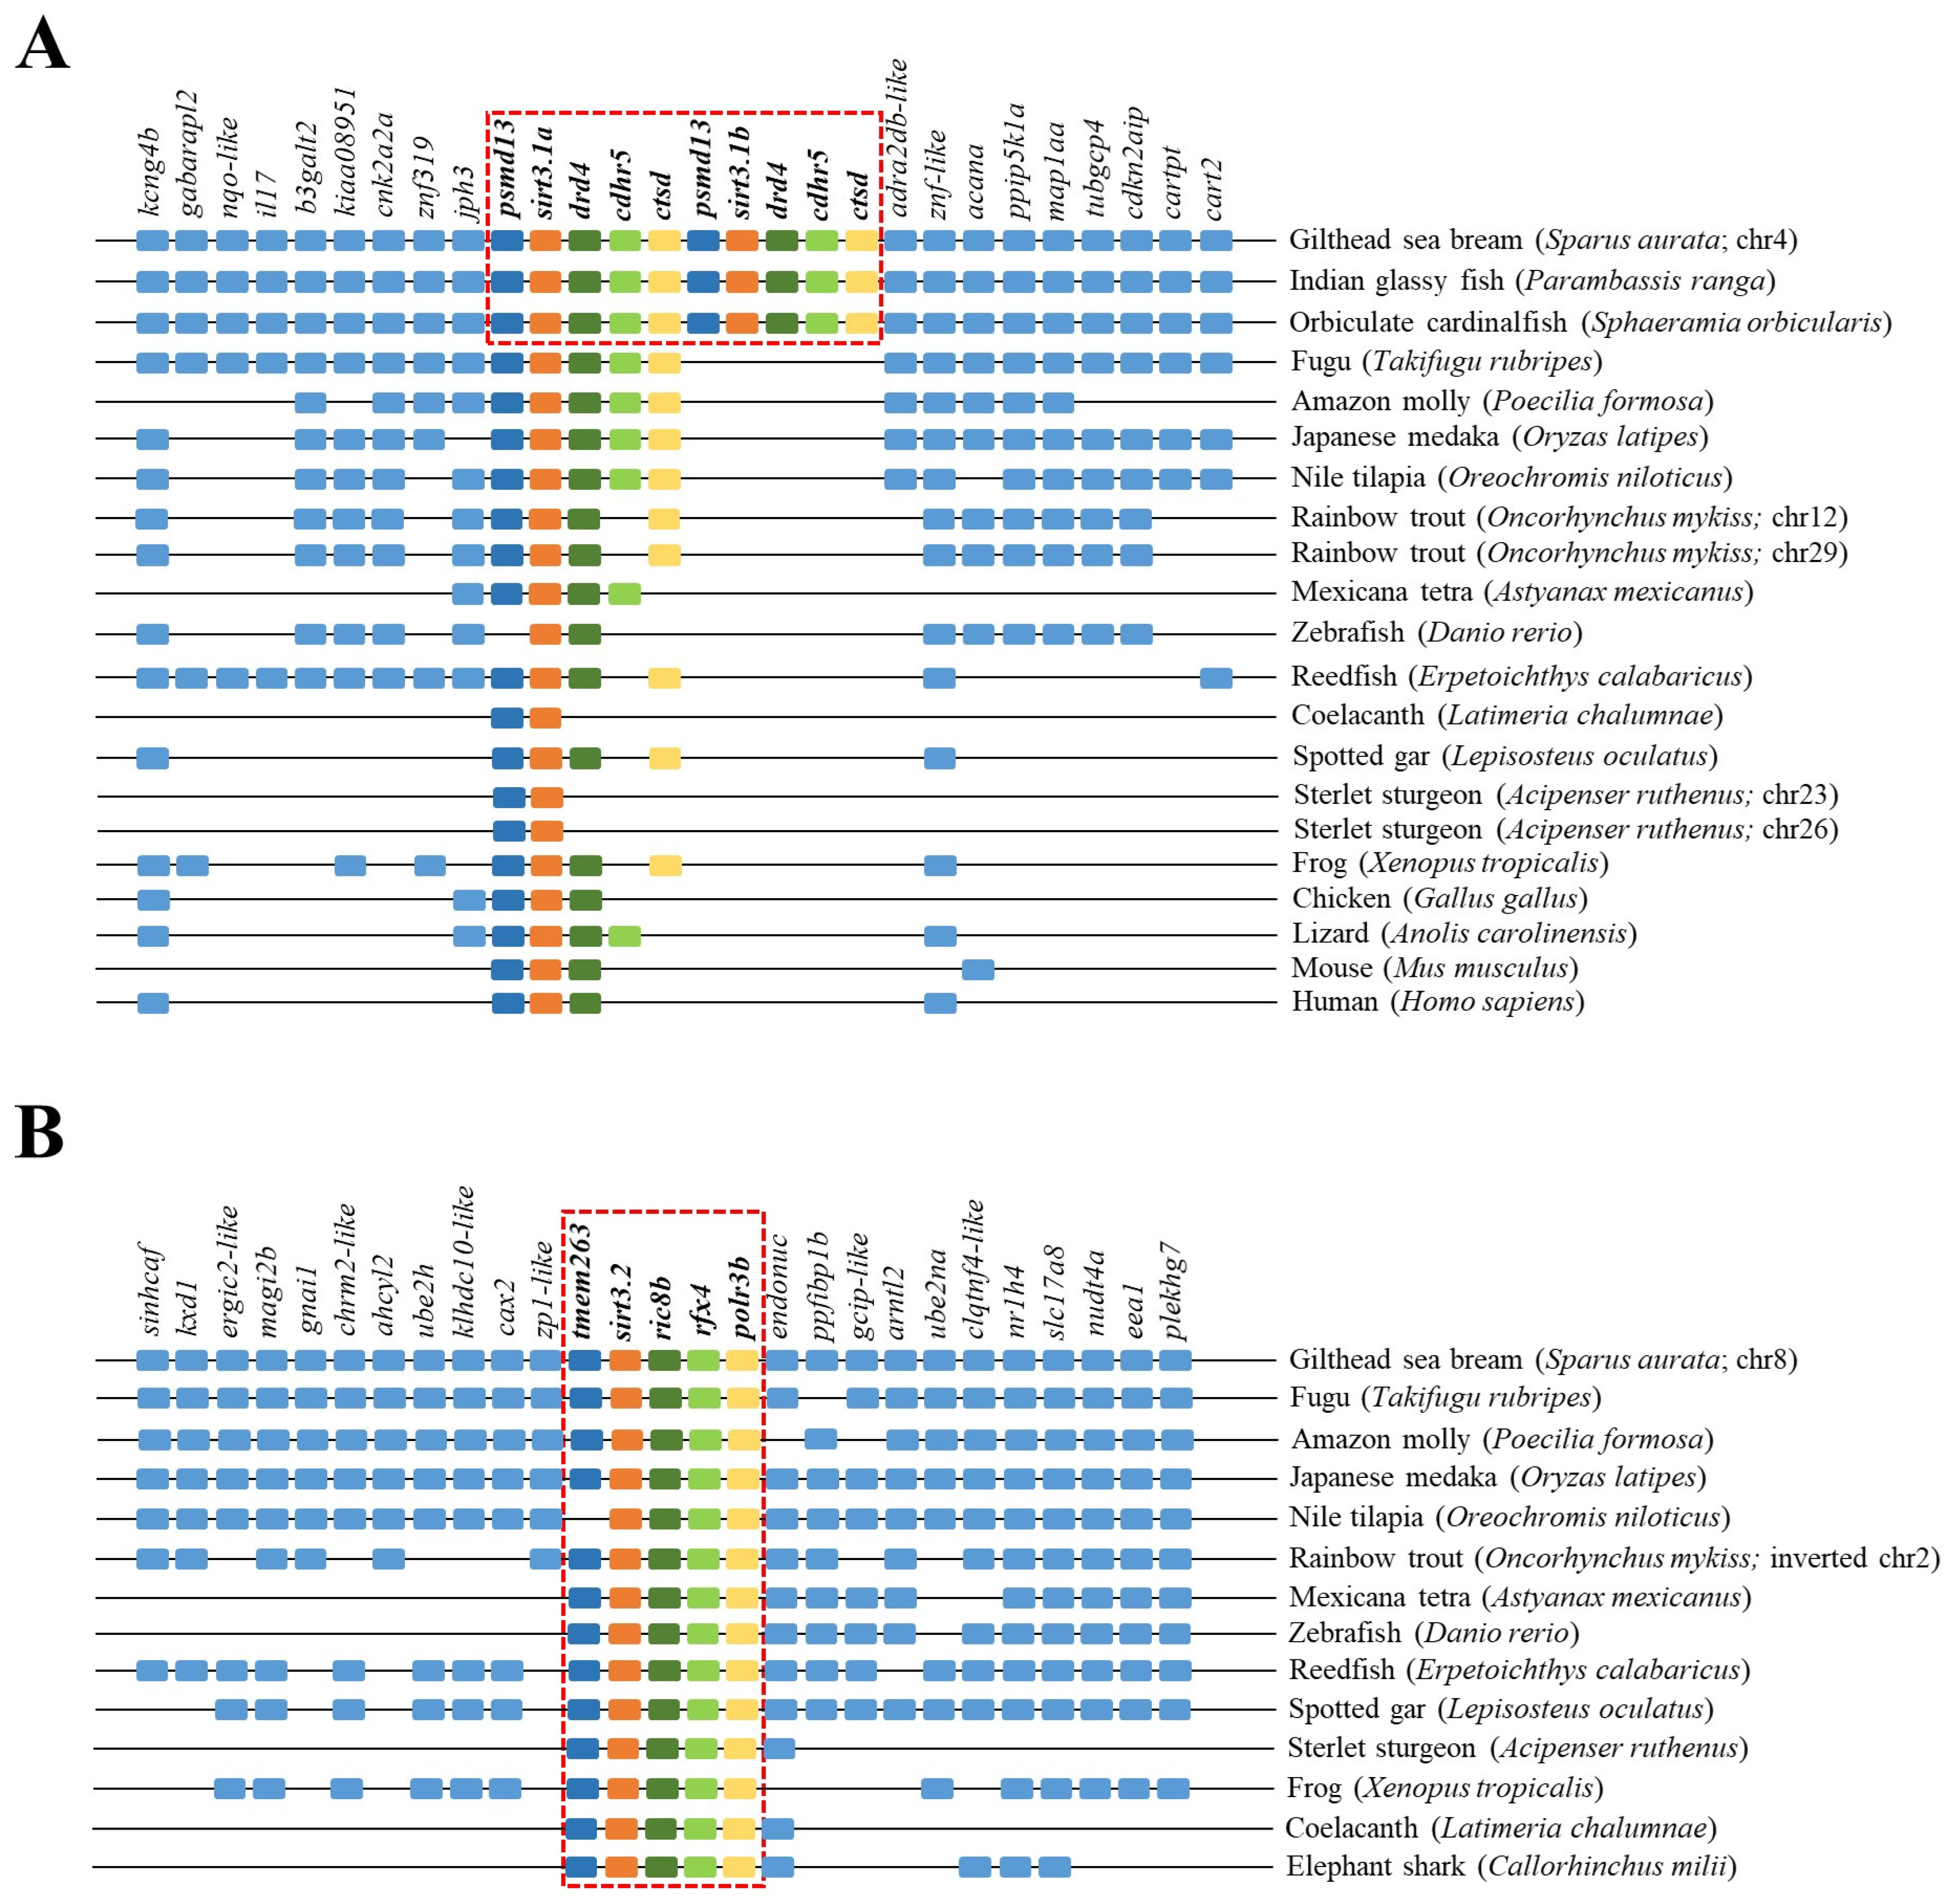
The reconstructed phylogeny of the SIRT3 family evidenced two main branches according each one with the present hierarchy of vertebrates (Figure 3). The branch named SIRT3/Sirt3.1 embraced the sarcopterygians (amniotes, amphibian, coelacanth), and the actinopterygians (ray-finned fish) that disclosed separately the node of primitive actinopterygii fish (polypteriformes/acipenseriformes/lepisosteiformes) and that of modern fish of the infra-class teleostei represented in the branch Sirt3.1. This last taxonomic group also disclosed two main monophyletic groups corresponding to Salmoniformes/Cypriniformes and Perciformes/Gadiformes, showing most species of this fish lineage duplicated sirt3.1 genes as a result of whole or segmental tandem genome duplications. In contrast, the node named Sirt3.2 was a long branch that encompassed a single copy of sirt3 paralogs from cartilaginous fish (chondrichthyes), lobe-finned fish (coelacanthiformes), and aquatic tetrapods (frogs) to primitive and modern fish (actinopterygii). The synteny analyses also rendered a different genome cartography for each one of these two SIRT3/Sirt3 branches. Thus, sirt3.1 has evolved in gilthead sea bream as a duplicated synteny block of five genes (psmd13/sirt3.1/drd4/cdhr5/ctsd) located in the super-scaffold/chromosome 4 (Figure 4A). This segmental tandem genome duplication also occurred in other percomorphaceae (Parambassis ranga, Sphaeramia orbicularis), and it persisted through the evolution of sarcopterygians as a well conserved psmd13/sirt3.1/drd4 single-synteny block. Likewise, the branch of Sirt3.2 evolved across amphibians, cartilaginous fish, and the actinopterygian fish class as a highly conserved single-synteny block (tmem263/sirt3.2/ric8b/rfx4/polr3b) that is located in the super-scaffold/chromosome 8 of gilthead sea bream (Figure 4B).
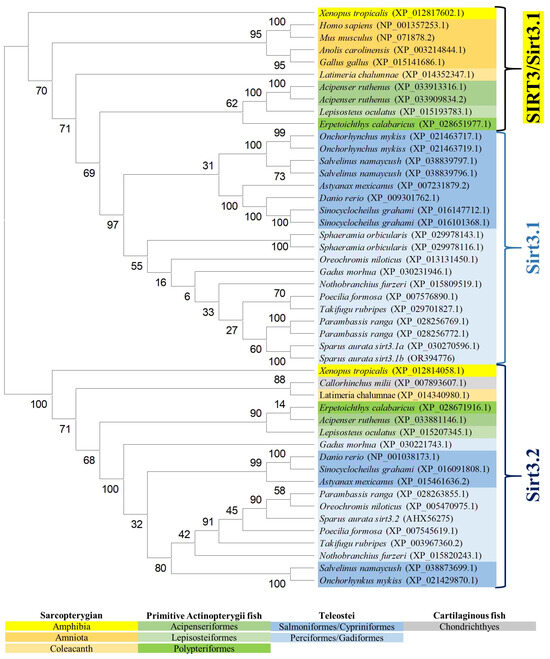
Figure 3.
Phylogenetic tree of vertebrate SIRT3, generated by maximum likelihood algorithm in Mega software version 11. The sequences included in the analysis correspond to full protein sequences from 23 vertebrate species. The accession numbers from GenBank, OrthoDB, and IATS-CSIC gilthead seabream genome are included in brackets. Numbers in branches indicate the bootstrap confidence in the resulting phylogenetic tree measured by auto-bootstrapping mode.
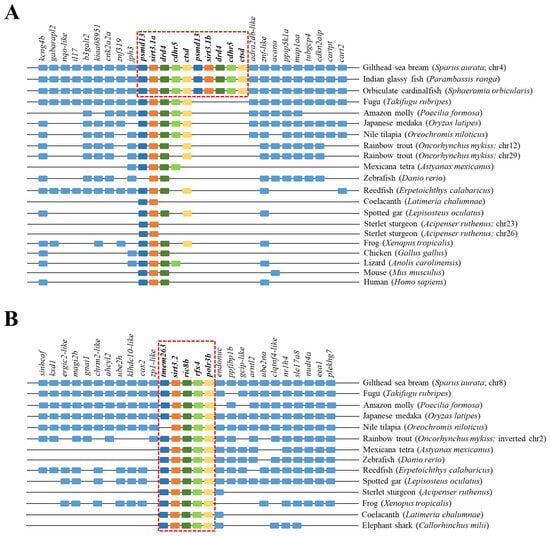
Figure 4.
Gene synteny of sirt3.1a/b (A) and sirt3.2 (B) in different vertebrate species. The synteny was analyzed with Genomicus v100.01 using the gene orders of gilthead seabream as reference. Orthologs of sirts in other species are shown in matching colors. A line between two genes is equivalent to a break in the continuity of the alignment. A red discontinuous square corresponds to the conserved syntenic block in different species.
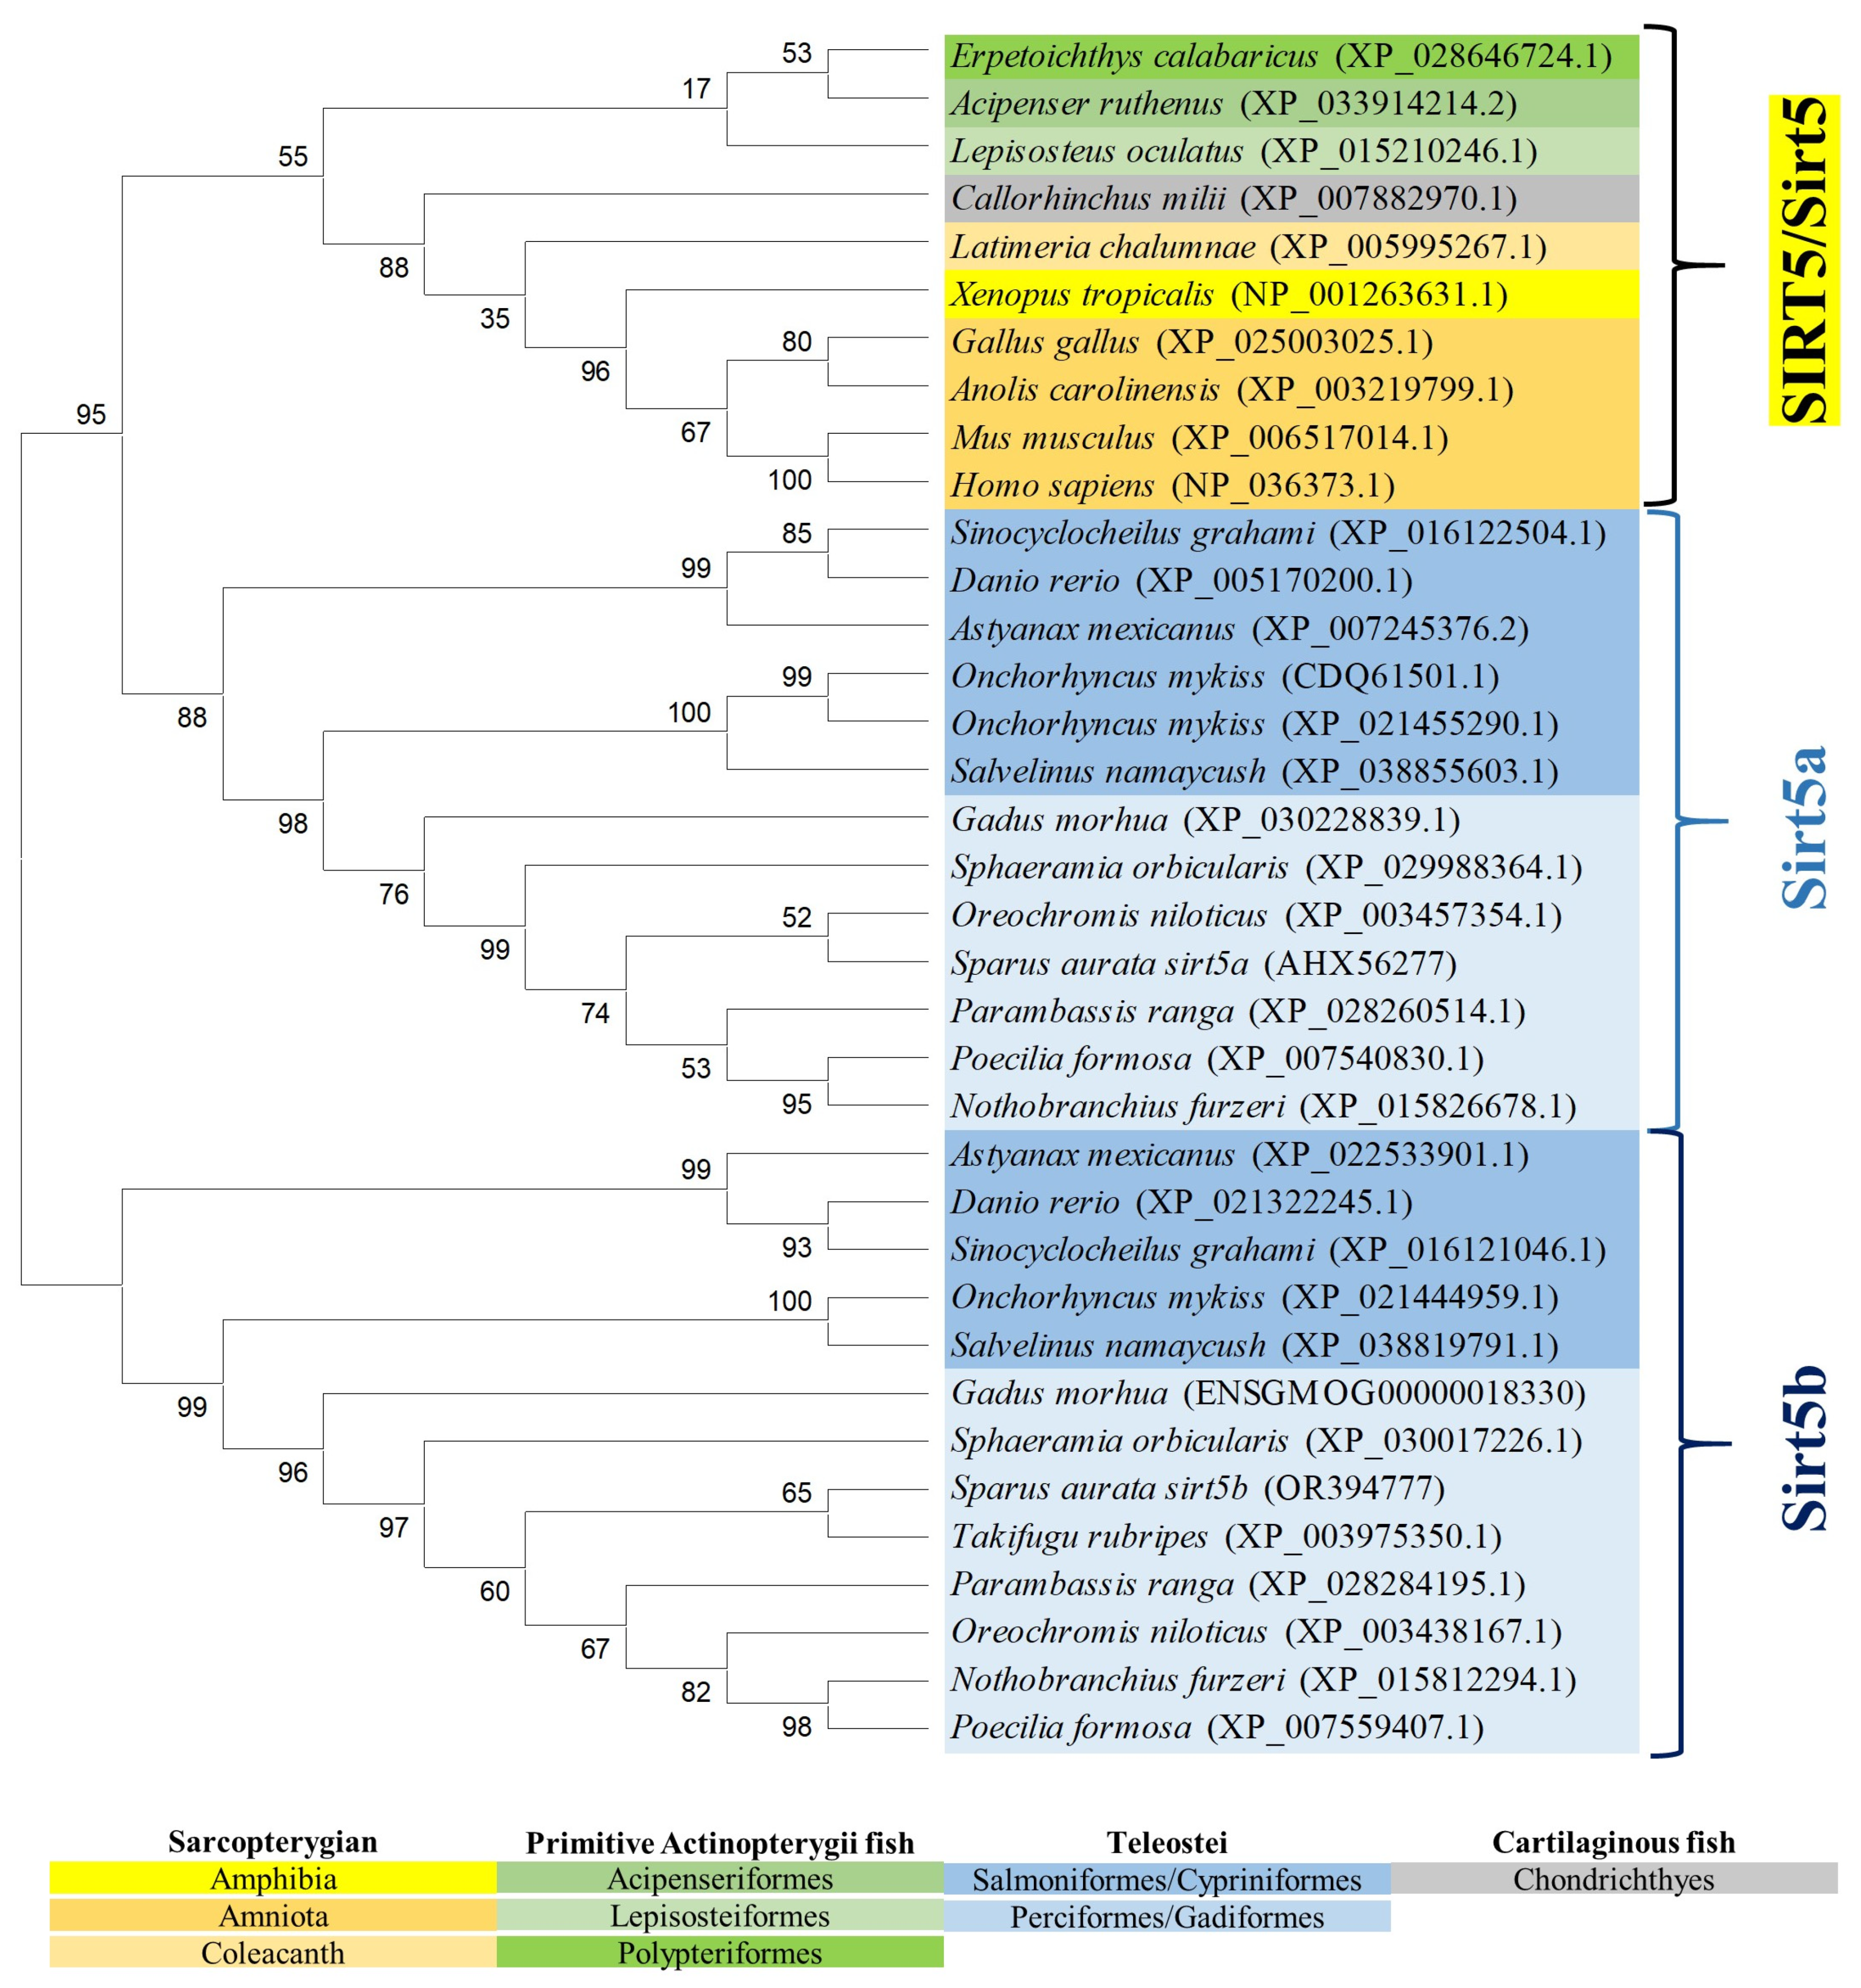
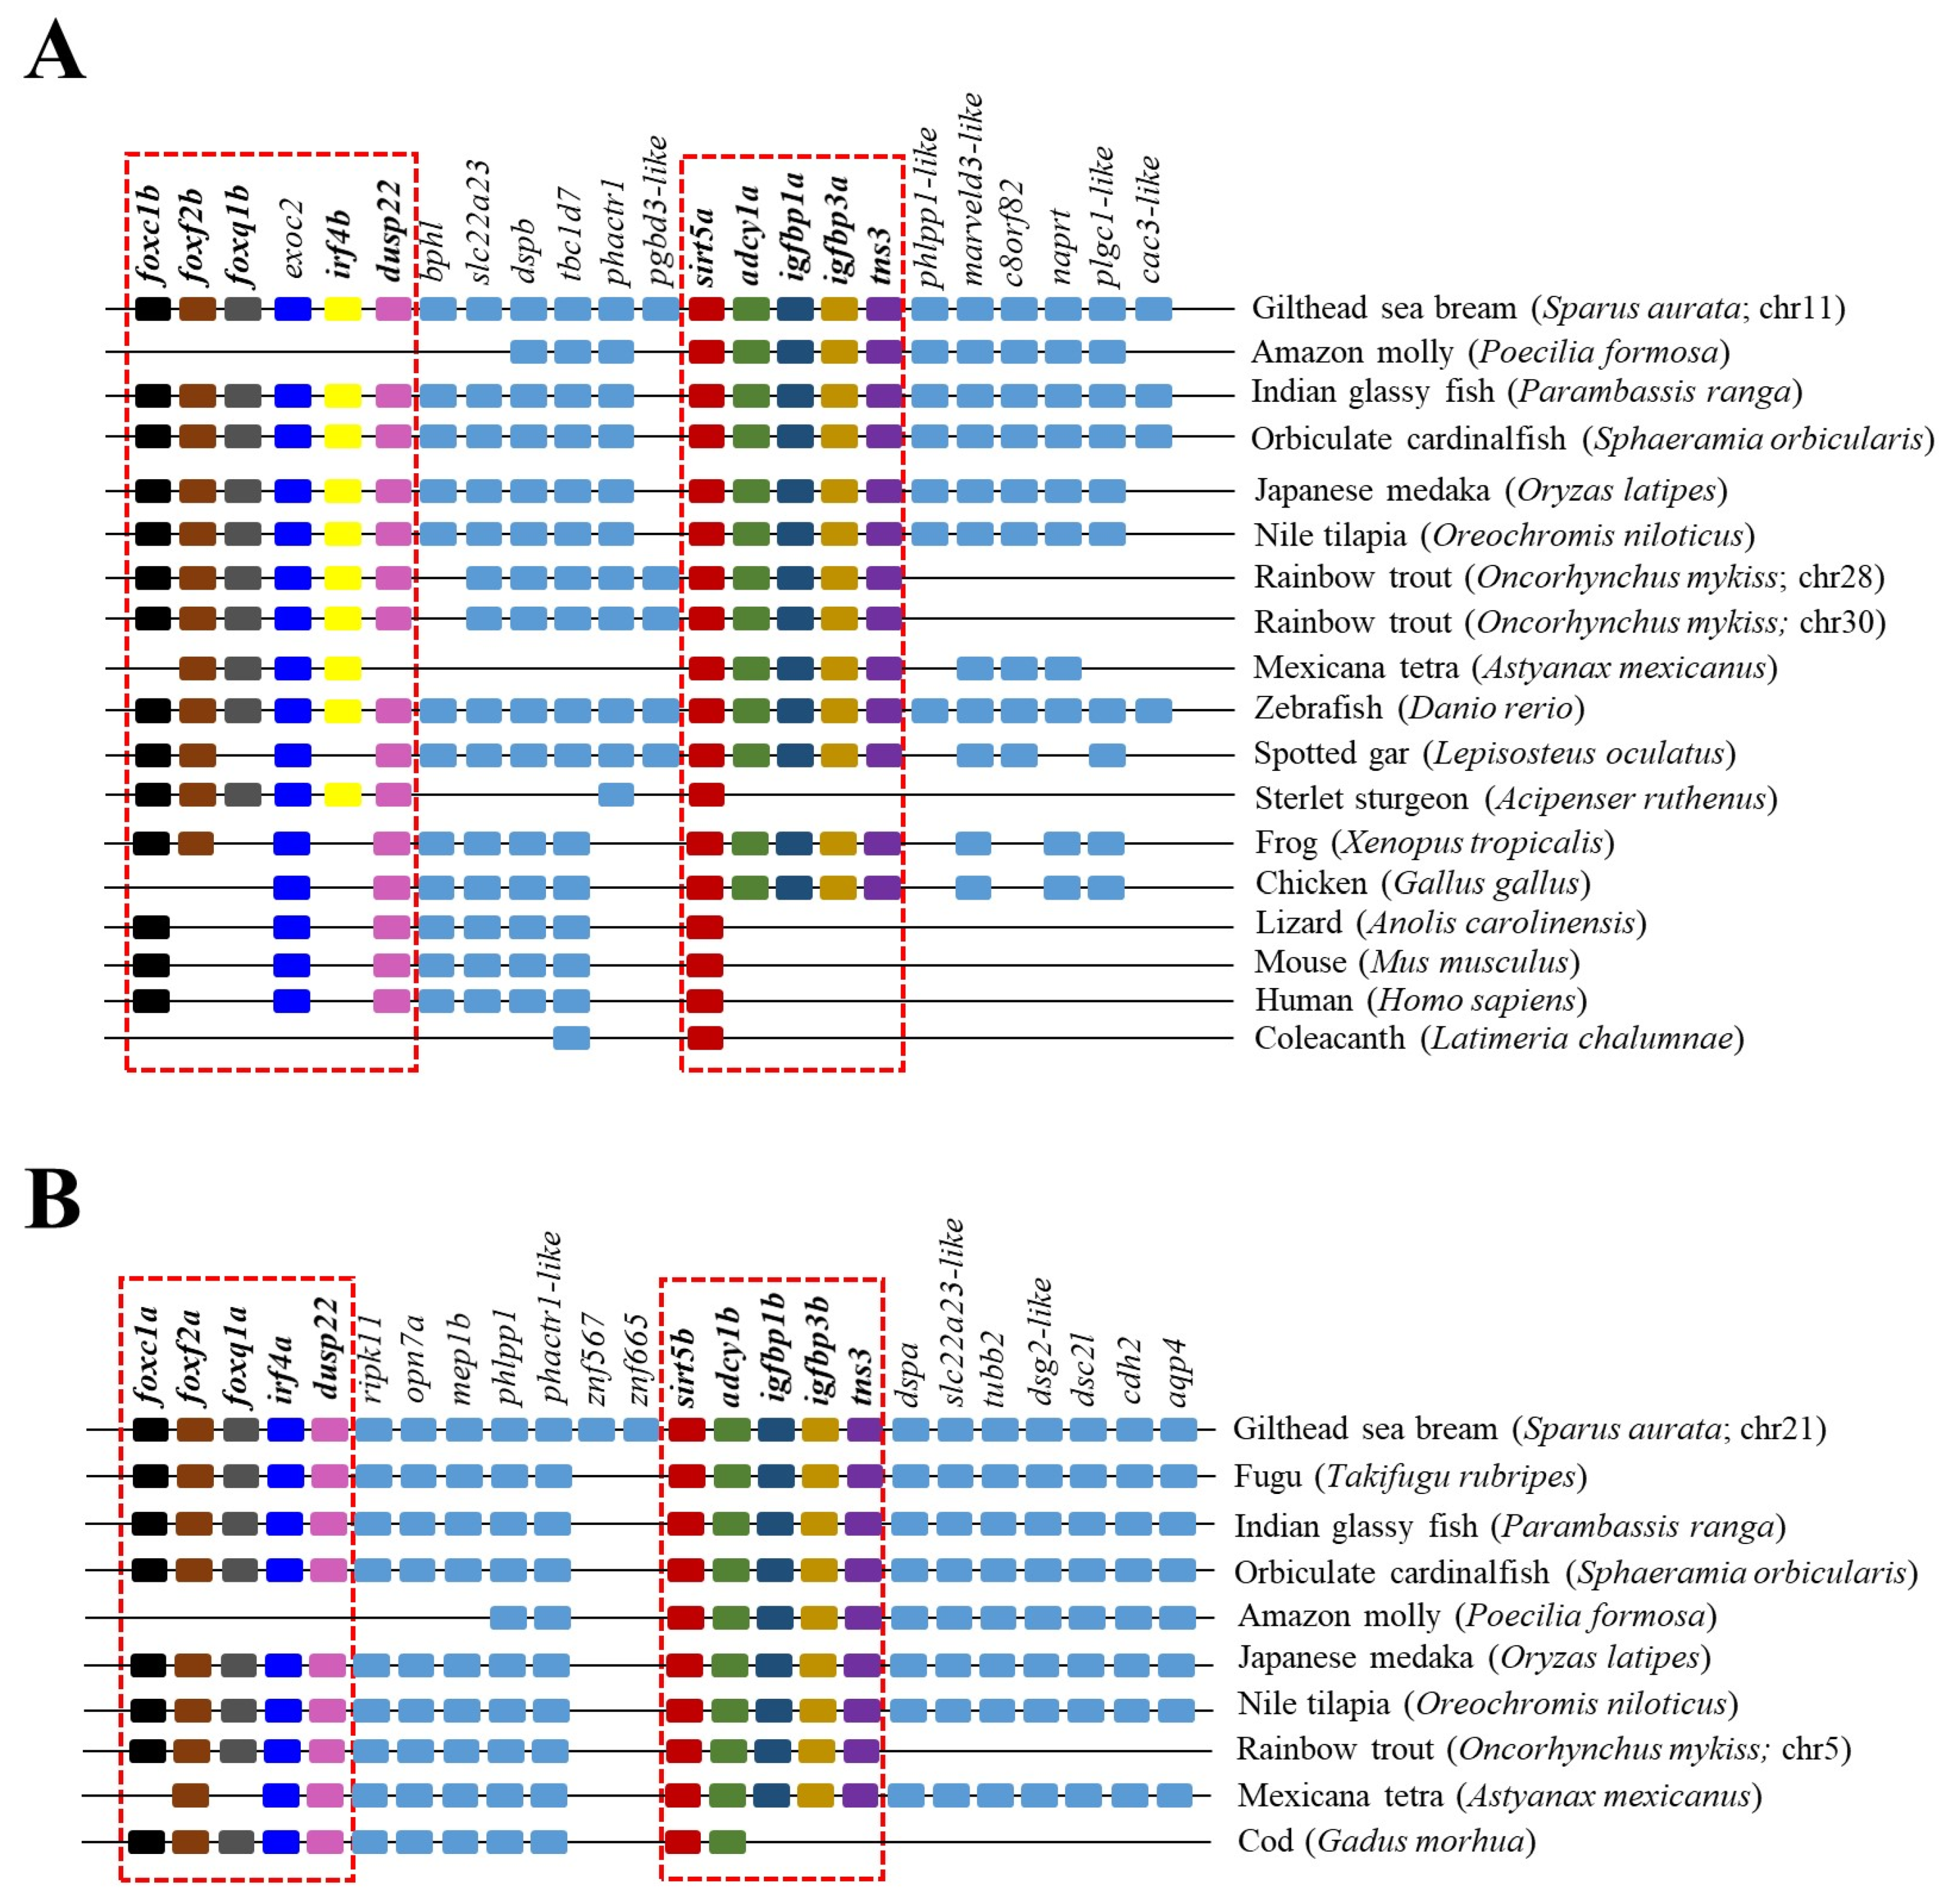
The reconstructed phylogenetic tree of SIRT5 also rendered a long branch that separately embraced sarcopterygians, primitive fish, and teleosts, according to the present hierarchy of vertebrates with the exception of chondrichthyes that were more related to sarcopterygians rather than to bony fish (Figure 5). On the other hand, most primitive fish (acipenseriformes/lepisosteiformes/polypteriformes) evolved as a main outgroup that constitutes, together with sarcopterygians, the clade SIRT5, whereas the teleostei disclosed two additional nodes (Sirt5a, Sirt5b) due to the conservation of two gene copies of sirt5 (super-scaffold/chromosome 11 and 21 in gilthead sea bream) in almost all the members of this fish lineage. The analysis of synteny also supported this dichotomous trend with two highly conserved synteny blocks (foxc1/foxf2/foxq1/irf4/dusp22; adcy1/igfbp1/igfbp3/tns3) in each one of these two teleostean Sirt5a/Sirt5b nodes (Figure 6). One or both of these gene synteny blocks were lost in the primitive actinopterygii (Sterlet sturgeon) and sarcopterygian fish (coelacanth), being weakened through the evolution of tetrapods (except in Gallus gallus and Xenopus tropicalis), which becomes especially evident for the conserved order of aligned genomic blocks of sirt5b (Figure 6B).

Figure 5.
Phylogenetic tree of vertebrate SIRT5, generated by maximum likelihood algorithm in Mega 11 software. The sequences included in the analysis correspond to full protein sequences from 23 vertebrate species. The accession numbers from GenBank, OrthoDB, and IATS-CSIC gilthead seabream genome are included in brackets. Numbers in branches indicate the bootstrap confidence in the resulting phylogenetic tree measured by auto-bootstrapping mode.
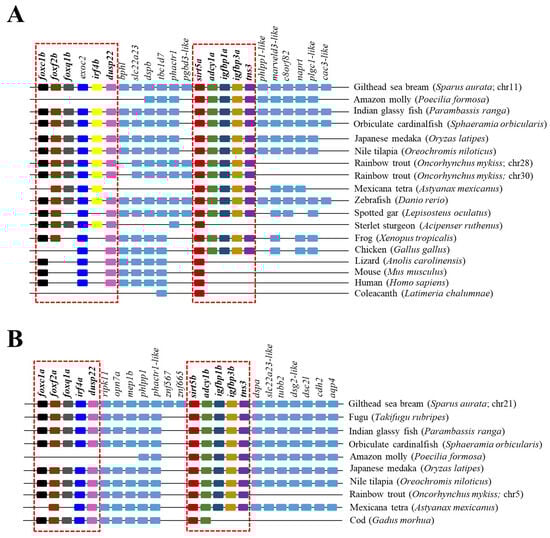
Figure 6.
Gene synteny of Sirt5a (A) and Sirt5b (B) copies in different vertebrate species. The synteny was analyzed with Genomicus v100.01 using the gene orders of gilthead seabream as reference. Orthologs of sirts in other species are shown in matching colors. A line between two genes is equivalent to a break in the continuity of the alignment. The red discontinuous square corresponds to the conserved syntenic blocks in different species.
2.4. Tissue-Specific Gene Expression
The gene expression pattern of the complete catalogue of gilthead sea bream sirts was assessed in a wide range of tissue of adult fish with different metabolic and physiological features (Figure 7A). Specific PCR primers were designed for each sirt paralog, with the exception of sirt3.1 primers that amplified both the sirt3.1a and sirt3.1b transcripts due to the difficulty in designing specific primers for each one of these duplicated genes (codifying sequence, 99% nucleotide identity, see Figure 1B). Overall sirt1, sirt2, and the now named sirt5a and sirt3.1 were the most ubiquitously expressed sirts across all the analyzed tissues; meanwhile, low expression levels were reported for sirt4 and sirt6 in almost all the analyzed tissues. Relatively low expression levels were also disclosed for sirt7 in almost all tissues, except for the liver and hypothalamus. The same for the novel sirt5b, which only shared relatively high levels of expression in liver and gills in comparison to the other sirt counterparts. Likewise, the now named sirt3.2 showed a relatively high expression level in head kidney (HK) and adipose tissue (AT), whereas the sirt3.1 paralogs (sirt3.1a + sirt3.1b) displayed high expression levels in liver and muscle tissues (white skeletal muscle, WSM; red muscle, RM; and heart). On closer examination, the different expression pattern of duplicated genes of sirt3 and sirt5 paralogs is disclosed as a quotient expression ratio of sirt3.1/sirt3.2 and sirt5a/sirt5b (Figure 7B,C).
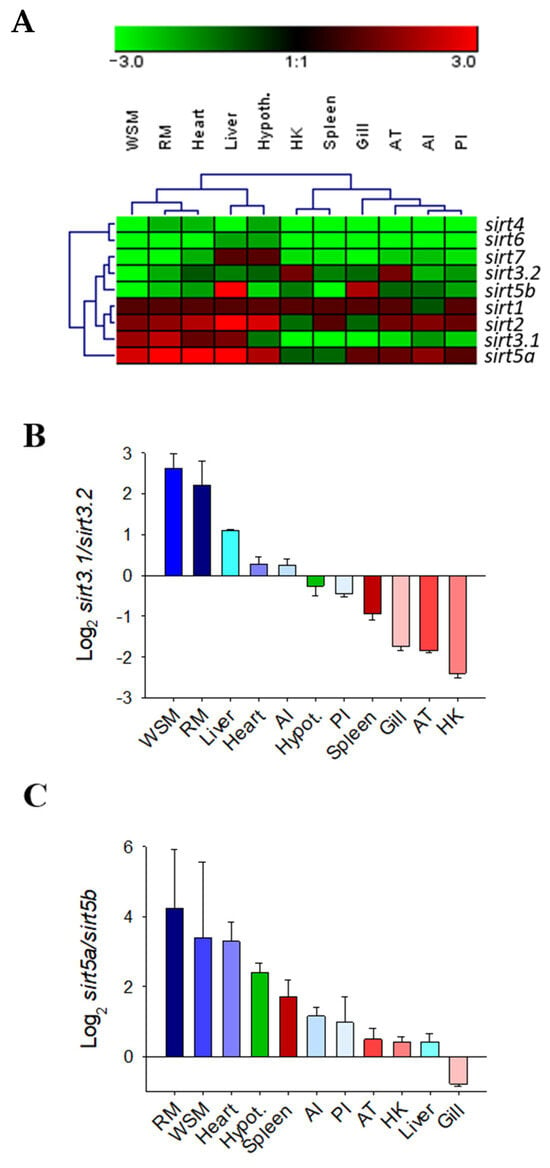
Figure 7.
Hierarchical heatmap of the gene expression pattern of sirts in 11 tissues with different metabolic capabilities (A). Ratio between sirt3.1 and sirt3.2 (B) or sirt5a and sirt5b (C) gene duplications in 11 tissues of gilthead sea bream.
2.5. Differential Expression Patterns of Sirts and Syntenic Igfbps across Development
Gene expression across development with whole larvae, WSM, and the liver as targeted tissues was focused on sirt1, sirt2, sirt3, sirt5, and synteny igfbp genes of sirt5a (igbp1a, igbpb3a) and sirt5b (igfbp1b, igfbp3b). As shown in Table 1, the expression level of all the analyzed genes was changed through the development. As a general feature, the expression level of sirt3.1 increased consistently with advancing age. In contrast, the expression levels of sirt1, sirt3.2, and sirt5b decreased markedly. Less clear is the pattern in fish development of sirt2 and sirt5a, which achieved the maximum expression level in three-year-old fish after an invariable or decreasing trend during early life stages. This also resulted in a pronounced increase in the expression ratio of sirt3 (sirt3.1/sirt3.2) and sirt5 (sirt5a/sirt5b) paralogs in advanced development. In parallel, the expression level of igfbps was markedly decreased (igfbp1a) or almost silenced (igfbp1b, igfbp3b) through the development, whereas a pronounced up-regulation was evidenced in the case of igfbp3a. In comparison to WSM, the developmental changes in the hepatic gene expression signature were less pronounced (Table 2). In any case, the hepatic expression of sirt1 and sirt3.2 was decreased significantly through development, which in turn increased the expression ratio of sirt3.1/sirt3.2. In parallel, the hepatic gene expression of igfbp1 paralogs (igfbp1a, igfbp1b) decreased with advancing age, but always remained detectable with a relatively high level of expression in the case of igfbp1b. In contrast, the gene expression of igbp3 paralogs (igfbp3a, igfbp3b) was almost silenced through the development in the liver tissue.

Table 1.
Relative gene expression of whole body (60 days post-hatching, dph) and white skeletal muscle (WSM) of gilthead sea bream across the development process. Data are the mean ± SEM of 6–10 fish. Data values are referenced to the expression level of sirt1 in whole larvae (60 dph), for which a value of 1 was assigned. p-values are the result of one-way analysis of variance and different superscript letters indicate significant differences (Holm–Sidak test, p < 0.05, bold). For each gene, gradation of black filling in circles indicates the expression levels across the development process.
Table 2.
Relative gene expression of liver of gilthead sea bream across the development process. Data are the mean ± SEM of 6–10 fish. Expression values are referenced to the expression level of sirt1 at 81 dph (days post-hatching), for which a value of 1 was assigned. p-values are the result of one-way analysis of variance and different superscript letters indicate significant differences (Holm–Sidak test, p < 0.05, bod). For each gene, gradation of black filling in circles indicates the expression levels along development.
3. Discussion
SIRTs build a gene family of deacylases with a complex evolutionary history across eukaryotic organisms that makes it difficult to establish a common SIRT repertoire; however, at least seven paralogs can be traced back to the last common ancestor of vertebrates [9]. The present study confirmed this statement, increasing the number of Sirt family members from seven to ten in a Perciform fish, the gilthead sea bream (Figure 1A), which served to disclose up to three gene copies of sirt3 (sirt3.1a, sirt3.1b, sirt3.2) and two copies of sirt5 (sirt5a, sirt5b). All of them were nuclear-encoded mitochondrial proteins as evidenced in the conservation of a mitochondrial targeting sequence of 17–66 amino acids in length that would direct the newly synthetized proteins towards the mitochondria (Figure 1A). From an evolutionary perspective, phylogenomic approaches indicate that the mitochondrial proteome expanded through vertebrate evolution not only by gene/genome duplications of mitochondrial proteins, but also by the re-localization of the paralogs to the organelle in a tissue-specific manner [30]. The most common process is the intra-mitochondrial duplication, but regardless of this, the establishment of new gene balances is always challenging, and the polyploids that survive a WGD event typically undergo a rediploidization process that leads to genome fractionation. Conversely, the preservation of duplicated genes can signify an increase in its activity (gene dosage), a novel acquired function (neo-functionalization), or the division among the copies of the functions of the ancestral gene (sub-functionalization) [31]. This is the basis of the evolution of the teleostean lineage that experienced a third WGD event (3R), followed by a 4R WGD in the branch belonging to the modern lineage of cyprinids and salmonids [27,32,33]. Conversely, alternative splicing arises in terrestrial vertebrates as the preferred mechanism for increasing gene diversity [34,35]. Thus, recent human genomic searches disclosed up to 38 and 43 protein isoforms of SIRT3 (https://www.ncbi.nlm.nih.gov/gene/23410; last accessed: 17 January 2024) and SIRT5 (https://www.ncbi.nlm.nih.gov/gene/23408; last accessed: 17 January 2024), respectively. These alternative variants often show a tissue-specific gene expression pattern, extending the way in which mitochondrial, cellular, and organism homeostasis can be regulated in an effective manner [36,37]. Certainly, meta-analytical approaches have identified the mitochondria as a key player in stress adaptive responses in a wide range of living organisms, including fish [38]. With these considerations in mind, we aimed to better understand the evolution and functional significance of the expanding Sirt3 and Sirt5 family in a farmed fish model, with a well-recognized predisposition of gene expansion [21,39].
On closer examination, phylogenetic attempts disclosed two SIRT3 orthologs (2R WGD) at the early vertebrate evolution [8] with vestiges remaining in the genome of the modern sarcopterygians (Figure 3) that support the Sirt3 division into Sirt3.1/Sirt3.2 in non-amniote aquatic-living vertebrates [9]. The Sirt3.1 branch also discerned sirt3.1a and sirt3.1b duplicates in gilthead sea bream and in two other percomorphaceae (S. orbicularis, P. ranga), which might indicate a gene retention after the 3R WGD (Figure 3). However, these paralogs accumulated very low intra-sequence polymorphisms (Figure 1B), which can lead to theories that the sirt3.1 duplication had occurred recently in the evolution [40]. This is further supported by the conservation in these fish species of a duplicated tandem repeat of five genes (psmd13-sirt3.1a/3.1b-drd4-cdhr5-ctsd) in each one of these two sirt3.1 paralogs (Figure 4A), which differ largely from the synteny block (tmem263/sirt3.2/ric8b/rfx4/polr3b) of the sirt3.2 paralog retained through the evolution as a unique gene copy (Figure 4B).
The importance of SIRT3 in metabolic homeostasis is widely documented in the skeletal muscle of humans and rodents, in which the TRF2–SIRT3 axis connects telomere shortening with muscle adaptive metabolism, development, and aging [41,42]. Thus, not surprisingly, TRF2 (telomeric repeat-binding factor 2) ablation in mouse skeletal muscle leads to Sirt3 down-regulation, highlighting the functional importance of the TRF2-mediated chromatin loop in regulating Sirt3 gene expression, and subsequently oxidative metabolism and cellular senescence. Mechanistically, most of these processes remain elusive, though it is known that the anti-aging effects of the adjudin drug are exerted by elevating the expression level of SIRT3, which in turn reduces cellular levels of reactive oxygen species (ROS) by deacetylating forkhead box O3a (FOXO3a), a transcription factor that transactivates antioxidant genes, such as catalase (CAT) and manganese superoxide dismutase (SOD2) [43,44]. In agreement with this, in gilthead sea bream, the expression level of sirt3.1 reached its highest expression level in RM and WSM (Figure 7B), with an enhanced expression through development in the case of WSM (Table 1 and Table 2) that becomes largely constitutive in the liver (Table 2). Otherwise, it must be noted that the sirt3.1 gene lies very close to pmsd13 (proteasome 26S subunit, non-ATPase 13) through almost all the vertebrate evolution (Figure 4A), with the occurrence in humans of a bidirectional promoter that reinforces the link of metabolic condition and mitochondrial and cellular stress responses with the proteolysis of unfolded proteins [45,46]. If this is the case in other organisms, such an observation gives support to a subrogate marker of deviations in biological age in a wide range of living organisms, including farmed fish. In order to ensure this hypothesis, further research becomes necessary for determining the effect of ecological and physiological factors over this gene.
Unlike sirt3.1, both in this (Figure 7B) and a previous study [10], the regulation of sirt3.2 was driven towards an active gene expression in mucosal and immuno-relevant tissues of gilthead sea bream (HK, spleen, gills, intestine), which was concurrent herein with a developmentally regulated gene silencing in both liver and WSM (Table 1 and Table 2), also reported for the ortholog of Xenopus tropicalis (https://www.bgee.org/gene/ENSXETG00000014800; last accessed: 17 January 2024; [47]) (Figure 4B). Since SIRTs are considered to have anti-inflammatory properties due to their regulatory effects on several transcription factors and their downstream pro-inflammatory effectors [48], such a gene expression pattern can be viewed as a negative feedback regulation of inflammation. Certainly, SIRTs are highly activated during a number of conditions known to enhance NAD+ bioavailability including nutrient restriction (fasting), exercise, and late acute inflammation. On the contrary, aging, nutrient overload, and activation of the hypoxia–ROS–early inflammation triad lead to decreased cellular NAD+ levels, which translate into the reduced gene expression and enzymatic activity of SIRTs. This was supported by recent observations in gilthead sea bream, where the ectoparasite Sparicotyle chrysophrii, parasitizing the gill epithelium, triggered the up-regulation of apoptotic markers in combination with a down-regulation of sirt3.2 and hypoxia-related genes [49]. Likewise, also in gilthead sea bream, there is now experimental evidence that high stocking density and mild-hypoxia pre-conditioning down-regulated sirt3.2 expression in the heart [50] and WSM [18]. Altogether, the interest in targeting sirt3 on livestock-fish-farming and its function acquisition in the context of climate change with an increase in water temperature and reduced oxygen availability merits further research.
As reported for SIRT3/Sirt3, the SIRT5/Sirt5 branch also expanded through the evolution of vertebrates, rendering two Sirt5 isotypes that remained conserved in the lineage of the modern teleost as two separated Sirt5a and Sirt5b clusters (Figure 5). The Sirt5a branch was phylogenetically closer to its human ortholog, forming a conjoint clade composed of teleost and non-teleost organisms. In contrast, the Sirt5b branch was exclusive to bony fish and persisted as a separate node with no vestiges of it in sarcopterygians. This, together with a relatively low phylogenetic divergence of Sirt5a/Sirt5b (74% amino acid similarity) in comparison to Sirt3.1/Sirt3.2 (53% amino acid similarity), supported the acquisition of a novel Sirt5b isotype as a teleost-specific Sirt after the 3R WGD event of teleosts, rather than a duplication event at the early vertebrate evolution (2R WGD). In addition, the sirt5a was expressed more actively than sirt5b across a large range of tissues, with the exception of the gills where the expression of sirt5b was at least two-fold higher than that of sirt5a (Figure 7). If this is indicative of a tissue-specific activity related to aquatic life remains elusive, though it has been suggested that the Sirt5 counterpart of marine mussels would drive different cellular stress responses to alleviate signs of heat stress [51]. In particular, in gilthead sea bream, sirt5a becomes expressed actively in both anaerobic (WSM) and aerobic (RM, heart) muscle tissues. Furthermore, the expression level of sirt5a was maintained high in WSM through development, whereas it was almost suppressed in the case of sirt5b a few days after hatching. The close association of sirt5a and muscle growth and metabolism was also reported in previous gilthead sea bream studies, in which growth suppression with fasting [10] and advancing age [15] was associated with a pronounced increase in sirt5a gene expression. In both cases, this occurred in coincidence with a reduced energy wastage, evidenced by the down-regulation of muscle mitochondrial uncoupling proteins and changes in the gene expression patterns of markers of lipid metabolism and oxidative phosphorylation, according to the general idea that SIRTs restrain any energy-consuming cellular activity, including growth and inflammation, until the abatement of metabolic stress disturbances [48,52].
Early studies have also supported a crosstalk between SIRTs and the GH/IGF axis, a key endocrine system regulating growth in vertebrates. Attention has been focused on SIRT1, and studies in mice have evidenced that the in vivo knockdown of hepatic SIRT1 restores the fasting-induced decrease in circulating levels of IGF-I [53]. Additionally, SIRT1 acts at the brain level as a link between somatotropic signaling and calorie restriction [54], and brain SIRT1 knockouts displayed dwarfism and reduced plasma GH and IGF-I levels [55]. According to this, SIRT1 activation contributes to suppress the GH/IGF tonus, which would serve to drive a decreased supply of energy for growth purposes in a cellular milieu with a reduced availability of metabolic fuels [53]. The relationship of the GH/IGF axis with other SIRT paralogs remains mostly understood, but intriguingly, our synteny analysis highlighted a high conservation through all the vertebrate evolution of a genomic synteny block with SIRT5 and IGBP1/3 as neighboring genes (Figure 6). This offers the possibility of the maintenance of genomic regulatory blocks, where the regulatory domain of a regulatory gene can extend into and beyond adjacent transcriptional units to shape the co-regulated expression of neighboring genes [56,57]. Focusing on IGFBPs, it is now recognized that the ancestral IGFBP gene was duplicated at an early animal stage to produce a pair of IGFBPs that gave rise in subsequent duplication events to the two IGFBP clades in modern vertebrates (IGFBP1/2/4; IGBP3/5/6), with a differentially regulated expression in liver and skeletal muscle that is accomplished early in the development of gilthead sea bream [18,52]. In adult fish, such a regulatory feature rendered a clear dominance of the igbp3a expression in the WSM of adult fish, which might depict a co-regulated expression of sirt5a and igbp3a as a synteny block in this muscle tissue (Table 1). Conversely, the silencing of sirt5b should be shaped by a genomic regulatory block involving the co-regulated inhibition of igfbp1b. However, less clear are these types of associations at the liver level, in which other regulatory mechanisms might serve to preserve a more constitutive gene expression of all sirt3 and sirt5 paralog pairs (Table 1 and Table 2).
In summary, this research highlighted the expansion of the Sirt3 and Sirt5 family in gilthead sea bream at different times through evolution, increasing the repertoire of Sirt genes from seven to nine in our farmed fish model. As their mammalian SIRT counterparts, the named sirt3.1a/b and sirt5a were mostly expressed at a relatively high level in muscle tissues, with perhaps a different contribution to proteolysis of unfolded proteins and muscle growth regulation via the Gh/Igf system, as inferred from the gene synteny block analysis. In contrast, the named Sirt3.2 evolved as an exclusive isotype of aquatic organisms with a mainly envisaged immunoregulatory role based on gilthead sea bream tissue-specific gene expression patterns. Likewise, Sirt5b emerged as an exclusive teleostean Sirt isotype with an enhanced expression in gills that might support some specific adaptive features like osmoregulation and heat stress. Overall, these findings confirm this first approach into the origin and evolution of the sirtuin family in gilthead sea bream. However, although gene expression data included in this analysis provide crucial insights into the potential tissue- and developmental-specialization of Sirts, it represents just one layer of the complex regulatory networks in living organisms. Integrating gene expression data with additional molecular, cellular, and phenotypic information is further required for a comprehensive understanding of the adaptive strategies of fish across development and in response to environmental challenges, reinforcing the importance of gene duplication shaping the landscape of the adaptable gilthead sea bream.
4. Materials and Methods
4.1. Ethics Statement
All procedures involving experimental animals were approved by the Ethics and Animal Welfare Committee of IATS, CSIC Ethics Committee (permission 1295/2022) and Generalitat Valenciana (permission 2022-VSC-PEA-0230). Such interventions were carried out in a registered installation facility (code ES120330001055) in accordance with the principles published in the European Animal Directive (2010/63/EU) and Spanish laws (Royal Decree RD53/2013) for the protection of animals used in scientific experimentation.
4.2. Fish Husbandry and Tissue Sampling
Fish were raised from early life stages to harvest with commercial pellets (0.2–0.8 mm Skretting, Burgos, Spain; 1.5–6.5 mm Biomar, Burgos, Spain) at the indoor experimental facilities of the Institute of Aquaculture Torre de la Sal (IATS, CSIC) under natural photoperiods and temperature conditions at our latitude (40°5 N; 0°10 E). Feed was offered daily near to visual satiety or on alternate days (3–7 times per week) depending on season and fish size. Water temperature ranged from 10 °C in winter to 27 °C in summer. The water oxygen concentration was always higher than 75% saturation, and unionized ammonia remained below toxic levels (<0.02 mg/L) irrespective of season. For the tissue-specific gene expression profiling, one-year-old fish (120 g average body weight) were fasted overnight in summer and representative tissues (liver, white skeletal muscle, red muscle, heart, gills, perivisceral adipose tissue, anterior intestine, posterior intestine, head kidney, spleen, and hypothalamus) with different metabolic capabilities were rapidly excised from five individuals, frozen in liquid nitrogen, and stored at −80 °C until RNA extraction. Additionally, six samples of whole body (larval stages), liver, and white skeletal muscle were taken through fish development (May–July) at 60-, 81-, and 127-days post-hatching (dph) from individuals with an averaged body weight of 137 mg, 1 g, and 4 g, respectively. At the last sampling point, liver and muscle tissues were also taken from 9–10 individual fish of 100 g (one-year old fish) and 1 kg (three-year old fish).
4.3. Phylogenetic and Synteny Analyses
The reconstructed gilthead sea bream PhylomeDB with protein-coding sequences from the IATS-CSIC assembled genome [21] was interrogated for sirt paralogs. This rendered up to three new sequences that were recognized as sirt3 and sirt5 gene isotypes that were manually curated by homology searches in the genome draft of [28]. This was followed by extensive searches for orthologs of Sirt3/Sirt5 genes across the vertebrate lineage in the OrthoDB v11 database [58]. Multiple sequence alignments and similarity/identity calculations were carried out using GeneDoc v2.7 [59]. Mitochondrial target sites and sirt domains were predicted using the TargetP-2.0 (https://services.healthtech.dtu.dk/services/TargetP-2.0/, accessed on 23 November 2023) and PROSITE-Expasy (https://prosite.expasy.org/, accessed on 23 July 2023) online tools, respectively. Separate phylogenetic trees for SIRT3/Sirt3 and SIRT5/Sirt5 clades were constructed with the maximum likelihood algorithm in MEGA v11 [60], using JTT [61] substitution matrix based on the lowest Bayesian information criterion (BIC) score. Non-uniformity of evolutionary rates among sites were modeled by using a discrete Gamma distribution (+G) and bootstrap values were calculated by auto-bootstrapping method. All positions containing gaps and missing data were eliminated (complete deletion). For syntenic studies, neighboring genomic regions of SIRT3/sirt3 and SIRT5/sirt5 paralogs were established by querying the IATS-CSIC genomic database and the Genomicus tool v100.01 [62]. The syntenic blocks were the result of gene order arrangements from representative species of sarcopterygians (order coelacanthiformes and Superclass tetrapoda) and actinopterygians (Chondrostei and Neopterygii Subclasses). The lineage-representative group of species used in each approach, as well as their corresponding NCBI protein ID, can be found in Table S1. The graphical representation of gene organization was carried out with the online tool Exon-Intron Graphic Maker (https://wormweb.org/exonintron, accessed on 5 June 2023). The manuscript followed the ZFIN Zebrafish Nomenclature Guidelines for gene and protein names and symbols, with a/b assigned suffixes based on the suffix of the already annotated surrounding genes (https://wiki.zfin.org/display/general/ZFIN+Zebrafish+Nomenclature+Conventions, accessed on 3 February 2023).
4.4. Gene Expression Profiling
4.4.1. RNA Extraction
RNA from individual samples was extracted using the MagMAX-96 total RNA isolation kit (Life Technologies, Carlsbad, CA, USA). The RNA yield was 50–100 μg, with absorbance ratios (A260/A280) of 1.9–2.1. The RNA integrity number (RIN) values of 8–10 (Agilent 2100 Bioanalyzer; Agilent, Santa Clara, CA, USA) were indicative of clean and intact RNA.
4.4.2. cDNA Synthesis
Reverse transcription of 500 ng of total RNA was performed with random decamers using a High-Capacity cDNA Archive Kit (Applied Biosystems, Foster City, CA, USA). Negative control reactions were run without reverse transcriptase.
4.4.3. qPCR-Array Setup
Different 96-well PCR arrays were designed for the simultaneous gene expression profiling of gilthead sea bream sirts and syntenic igfbp genes (igfbp1a, igfbp1b, igfbp3a, igfbp3b). Two housekeeping genes (β-actin and 18S rRNA) and controls of PCR performance were included in each array. In brief, 660 pg of total cDNA was used in 25 μL PCR reactions. PCR wells contained 2x SYBR Green Master Mix (Bio-Rad, Hercules, CA, USA) and specific primers at a final concentration of 0.9 μM (Table S2). All pipetting operations for the PCR arrays were performed by an EpMotion 5070 Liquid Handling Robot (Eppendorf, Hamburg, Germany) to improve data reproducibility. Real-time quantitative PCR was carried out in an Eppendorf Mastercycler Ep Realplex (Eppendorf, Hamburg, Germany). The PCR amplification program consisted of an initial denaturation step at 95 °C for 3 min, followed by 40 cycles of denaturation for 15 s at 95 °C, and annealing/extension for 60 s at 60 °C. The efficiency of the PCR reactions was consistently higher than 90% and was similar among all the genes. The specificity of the reactions was verified by melting curve analysis (ramping rates of 0.5 °C/10 s over a temperature range of 55–95 °C). Negative controls without a template were performed for each primer set. Gene expression was calculated using the delta-delta Ct method [63]. For multigene analysis, all values for whole larvae and muscle tissue were referenced to the expression level of sirt1 in whole larvae (60 dph). Liver gene expression levels were referenced to the expression of sirt1 at 81 dph, for which a value of 1 was arbitrarily assigned.
4.5. Updated Sirt Catalogue
Hierarchical clustering was performed using the Genesis software v9.1 [64] to assess the tissue-specific gene expression pattern of the complete catalogue of sirt genes in gilthead sea bream. Statistical analyses were performed using SigmaPlot version 14.0 (Systat Software, San Jose, CA, USA) with all p-values set to 0.05. Normality and equal variance of data were tested using Shapiro–Wilk and Levene tests, respectively. Developmental and tissue-specific differences in gene expression were analyzed by one-way ANOVA followed by Holm–Sidak test.
Supplementary Materials
The following supporting information can be downloaded at: https://www.mdpi.com/article/10.3390/ijms25116273/s1.
Author Contributions
Conceptualization, J.P.-S.; methodology, P.S.-M., F.N.-C., J.A.C.-G. and J.P.-S.; software, P.S.-M. and F.N.-C.; validation, P.S.-M., J.A.C.-G. and J.P.-S.; formal analysis, P.S.-M., F.N.-C. and J.P.-S.; investigation, P.S.-M., F.N.-C. and J.P.-S.; resources, P.S.-M., F.N.-C., J.A.C.-G. and J.P.-S.; data curation, P.S.-M. and F.N.-C.; writing—original draft preparation, P.S.-M. and J.P.-S.; writing—review and editing, P.S.-M., F.N.-C., J.A.C.-G. and J.P.-S.; visualization, P.S.-M., F.N.-C., J.A.C.-G. and J.P.-S.; supervision, J.P.-S.; project administration, J.P.-S.; funding acquisition, J.P.-S. All authors have read and agreed to the published version of the manuscript.
Funding
This study forms part of the ThinkInAzul program and was supported by MCIN with funding from European Union NextGenerationEU (PRTR-C17.I1) and by Generalitat Valenciana (THINKINAZUL/2021/024) to J.P.-S.
Institutional Review Board Statement
Not applicable.
Informed Consent Statement
Not applicable.
Data Availability Statement
Data of PhylomeDB evidencing up to three new gilthead sea bream sirt gene isotypes that were embraced by SIRT3 and SIRT5 branches (Figures S1 and S2) (http://phylomedb.org (accessed on 23 May 2022); PHY00CLOW5_SPAAU and PHY00CKZTK_SPAAU accession numbers). Novel sirt sequences were uploaded to GenBank with accession numbers OR394775 (sirt3.1a), OR394776 (sirt3.1b) and OR394777 (sirt5b), with their gilthead sea bream paralogs also renamed as sirt3.2 (AHX56275, before sirt3) and sirt5a (AHX56277, before sirt5).
Conflicts of Interest
The authors declare no conflicts of interest.
References
- Schwer, B.; Verdin, E. Conserved metabolic regulatory functions of sirtuins. Cell Metab. 2008, 7, 104–112. [Google Scholar] [CrossRef] [PubMed]
- Chang, H.C.; Guarente, L. SIRT1 and other sirtuins in metabolism. Trends Endocrin. Met. 2014, 25, 138–145. [Google Scholar] [CrossRef] [PubMed]
- Imai, S.I.; Guarente, L. It takes two to tango: NAD+ and sirtuins in aging/longevity control. NPJ Aging Mech. Dis. 2016, 2, 16017. [Google Scholar] [CrossRef] [PubMed]
- Van de Ven, R.A.; Santos, D.; Haigis, M.C. Mitochondrial sirtuins and molecular mechanisms of aging. Trends Mol. Med. 2017, 23, 320–331. [Google Scholar] [CrossRef] [PubMed]
- Zhu, X.; Chen, Z.; Shen, W.; Huang, G.; Sedivy, J.M.; Wang, H.; Ju, Z. Inflammation, epigenetics, and metabolism converge to cell senescence and ageing: The regulation and intervention. Signal Transduct. Target Ther. 2021, 6, 245. [Google Scholar] [CrossRef] [PubMed]
- Zhao, L.; Cao, J.; Hu, K.; He, X.; Yun, D.; Tong, T.; Han, L. Sirtuins and their biological relevance in aging and age-related diseases. Aging Dis. 2020, 11, 927–945. [Google Scholar] [CrossRef]
- Fernando, K.K.M.; Wijayasinghe, Y.S. Sirtuins as potential therapeutic targets for mitigating neuroinflammation associated with Alzheimer’s disease. Front. Cell Neurosci. 2021, 15, 746631. [Google Scholar] [CrossRef] [PubMed]
- Gold, D.A.; Sinclair, D.A. Sirtuin evolution at the dawn of animal life. Mol. Biol. Evol. 2022, 39, msac192. [Google Scholar] [CrossRef] [PubMed]
- Opazo, J.C.; Vandewege, M.W.; Hoffmann, F.G.; Zavala, K.; Meléndez, C.; Luchsinger, C.; Cavieres, V.A.; Vargas-Chacoff, L.; Morera, F.J.; Burgos, P.V.; et al. How many sirtuin genes are out there? Evolution of sirtuin genes in vertebrates with a description of a new family member. Mol. Biol. Evol. 2023, 40, msad014. [Google Scholar] [CrossRef]
- Simó-Mirabet, P.; Bermejo-Nogales, A.; Calduch-Giner, J.A.; Pérez-Sánchez, J. Tissue-specific gene expression and fasting regulation of sirtuin family in gilthead sea bream (Sparus aurata). J. Comp. Physiol. B 2017, 187, 153–163. [Google Scholar] [CrossRef]
- Simó-Mirabet, P.; Piazzon, M.C.; Calduch-Giner, J.A.; Ortiz, Á.; Puyalto, M.; Sitjà-Bobadilla, A.; Pérez-Sánchez, J. Sodium salt medium-chain fatty acids and Bacillus-based probiotic strategies to improve growth and intestinal health of gilthead sea bream (Sparus aurata). PeerJ 2017, 5, e4001. [Google Scholar] [CrossRef] [PubMed]
- Simó-Mirabet, P.; Perera, E.; Calduch-Giner, J.A.; Afonso, J.M.; Pérez-Sánchez, J. Co-expression analysis of sirtuins and related metabolic biomarkers in juveniles of gilthead sea bream (Sparus aurata) with differences in growth performance. Front. Physiol. 2018, 9, 608. [Google Scholar] [CrossRef] [PubMed]
- Han, L.; Su, B.; Li, W.H.; Zhao, Z. CpG island density and its correlations with genomic features in mammalian genomes. Genome Biol. 2008, 9, 1–12. [Google Scholar] [CrossRef] [PubMed]
- Long, H.K.; King, H.W.; Patient, R.K.; Odom, D.T.; Klose, R.J. Protection of CpG islands from DNA methylation is DNA-encoded and evolutionarily conserved. Nucleic Acids Res. 2016, 44, 6693–6706. [Google Scholar] [CrossRef] [PubMed]
- Simó-Mirabet, P.; Perera, E.; Calduch-Giner, J.A.; Pérez-Sánchez, J. Local DNA methylation helps to regulate muscle sirtuin 1 gene expression across seasons and advancing age in gilthead sea bream (Sparus aurata). Front. Zool. 2020, 17, 15. [Google Scholar] [CrossRef] [PubMed]
- Benedito-Palos, L.; Ballester-Lozano, G.F.; Simó, P.; Karalazos, V.; Ortiz, Á.; Calduch-Giner, J.; Pérez-Sánchez, J. Lasting effects of butyrate and low FM/FO diets on growth performance, blood haematology/biochemistry and molecular growth-related markers in gilthead sea bream (Sparus aurata). Aquaculture 2016, 454, 8–18. [Google Scholar] [CrossRef]
- Perera, E.; Simó-Mirabet, P.; Shin, H.S.; Rosell-Moll, E.; Naya-Catalá, F.; de las Heras, V.; Martos-Sitcha, J.A.; Karalazos, V.; Armero, E.; Arizcun, M.; et al. Selection for growth is associated in gilthead sea bream (Sparus aurata) with diet flexibility, changes in growth patterns and higher intestine plasticity. Aquaculture 2019, 507, 349–360. [Google Scholar] [CrossRef]
- Naya-Català, F.; Martos-Sitcha, J.A.; de Las Heras, V.; Simó-Mirabet, P.; Calduch-Giner, J.À.; Pérez-Sánchez, J. Targeting the mild-hypoxia driving force for metabolic and muscle transcriptional reprogramming of gilthead sea bream (Sparus aurata) juveniles. Biology 2021, 10, 416. [Google Scholar] [CrossRef]
- Naya-Català, F.; Piazzon, M.C.; Torrecillas, S.; Toxqui-Rodríguez, S.; Calduch-Giner, J.À.; Fontanillas, R.; Sitjà-Bobadilla, A.; Montero, D.; Pérez-Sánchez, J. Genetics and nutrition drive the gut microbiota succession and host-transcriptome interactions through the gilthead sea bream (Sparus aurata) production cycle. Biology 2022, 11, 1744. [Google Scholar] [CrossRef]
- Holhorea, P.G.; Felip, A.; Calduch-Giner, J.À.; Afonso, J.M.; Pérez-Sánchez, J. Use of male-to-female sex reversal as a welfare scoring system in the protandrous farmed gilthead sea bream (Sparus aurata). Front. Vet. Sci. 2023, 9, 1083255. [Google Scholar] [CrossRef]
- Pérez-Sánchez, J.; Naya-Català, F.; Soriano, B.; Piazzon, M.C.; Hafez, A.; Gabaldón, T.; Llorens, C.; Sitjà-Bobadilla, A.; Calduch-Giner, J.A. Genome sequencing and transcriptome analysis reveal recent species-specific gene duplications in the plastic gilthead sea bream (Sparus aurata). Front. Mar. Sci. 2019, 6, 00760. [Google Scholar] [CrossRef]
- Otto, S.P. The evolutionary consequences of polyploidy. Cell 2007, 131, 452–462. [Google Scholar] [CrossRef] [PubMed]
- Figueras, A.; Robledo, D.; Corvelo, A.; Hermida, M.; Pereiro, P.; Rubiolo, J.A.; Gómez-Garrido, J.; Carreté, L.; Bello, X.; Gut, M.; et al. Whole genome sequencing of turbot (Scophthalmus maximus; Pleuronectiformes): A fish adapted to demersal life. DNA Res. 2016, 23, 181–192. [Google Scholar] [CrossRef] [PubMed]
- Tine, M.; Kuhl, H.; Gagnaire, P.A.; Louro, B.; Desmarais, E.; Martins, R.S.T.; Hecht, J.; Knaust, F.; Belkhir, K.; Klages, S.; et al. European sea bass genome and its variation provide insights into adaptation to euryhalinity and speciation. Nat. Commun. 2014, 5, 5770. [Google Scholar] [CrossRef] [PubMed]
- Xu, P.; Zhang, X.; Wang, X.; Li, J.; Liu, G.; Kuang, Y.; Xu, J.; Zheng, X.; Ren, L.; Wang, G.; et al. Genome sequence and genetic diversity of the common carp, Cyprinus carpio. Nat. Gen. 2014, 46, 1212–1219. [Google Scholar] [CrossRef] [PubMed]
- Yuan, Z.; Liu, S.; Zhou, T.; Tian, C.; Bao, L.; Dunham, R.; Liu, Z. Comparative genome analysis of 52 fish species suggests differential associations of repetitive elements with their living aquatic environments. BMC Genom. 2018, 19, 141. [Google Scholar] [CrossRef] [PubMed]
- Macqueen, D.J.; Johnston, I.A. A well-constrained estimate for the timing of the salmonid whole genome duplication reveals major decoupling from species diversification. Proc. R. Soc. B Biol. Sci. 2014, 281, 2881. [Google Scholar] [CrossRef] [PubMed]
- Pauletto, M.; Manousaki, T.; Ferraresso, S.; Babbucci, M.; Tsakogiannis, A.; Louro, B.; Vitulo, N.; Quoc, V.H.; Carraro, R.; Bertotto, D.; et al. Genomic analysis of Sparus Aurata reveals the evolutionary dynamics of sex-biased genes in a sequential hermaphrodite fish. Commun. Biol. 2018, 1, 119. [Google Scholar] [CrossRef] [PubMed]
- Frye, R.A. Phylogenetic classification of prokaryotic and eukaryotic Sir2-like proteins. Biochem. Biophys. Res. Commun. 2000, 273, 793–798. [Google Scholar] [CrossRef]
- Lama, S.; Broda, M.; Abbas, Z.; Vaneechoutte, D.; Belt, K.; Säll, T.; Vandepoele, K.; Van Aken, O. Neofunctionalization of mitochondrial proteins and incorporation into signaling networks in plants. Mol. Biol. Evol. 2019, 36, 974–989. [Google Scholar] [CrossRef]
- Voordeckers, K.; Verstrepen, K.J. Experimental evolution of the model eukaryote Saccharomyces cerevisiae yields insight into the molecular mechanisms underlying adaptation. Curr. Opin. Microbiol. 2015, 28, 1–9. [Google Scholar] [CrossRef] [PubMed]
- Jatllon, O.; Aury, J.M.; Brunet, F.; Petit, J.L.; Stange-Thomann, N.; Maucell, E.; Bouneau, L.; Fischer, C.; Ozouf-Costaz, C.; Bernot, A.; et al. Genome duplication in the Teleost fish Tetraodon Nigroviridis reveals the early vertebrate proto-karyotype. Nature 2004, 431, 946–957. [Google Scholar] [CrossRef] [PubMed]
- Kasahara, M.; Naruse, K.; Sasaki, S.; Nakatani, Y.; Qu, W.; Ahsan, B.; Yamada, T.; Nagayasu, Y.; Doi, K.; Kasai, Y.; et al. The medaka draft genome and insights into vertebrate genome evolution. Nature 2007, 447, 714–719. [Google Scholar] [CrossRef] [PubMed]
- Nilsen, T.W.; Graveley, B.R. Expansion of the eukaryotic proteome by alternative splicing. Nature 2010, 463, 457–463. [Google Scholar] [CrossRef] [PubMed]
- Jiang, W.; Chen, L. Alternative splicing: Human disease and quantitative analysis from high-throughput sequencing. Comput. Struct. Biotechnol. J. 2021, 19, 183–195. [Google Scholar] [CrossRef] [PubMed]
- Matsushita, N.; Yonashiro, R.; Ogata, Y.; Sugiura, A.; Nagashima, S.; Fukuda, T.; Inatome, R.; Yanagi, S. Distinct regulation of mitochondrial localization and stability of two human sirt5 Isoforms. Genes Cells 2011, 16, 190–202. [Google Scholar] [CrossRef] [PubMed]
- Zhang, X.; Ameer, F.S.; Azhar, G.; Wei, J.Y. Alternative splicing increases sirtuin gene family diversity and modulates their subcellular localization and function. Int. J. Mol. Sci. 2021, 22, 473. [Google Scholar] [CrossRef] [PubMed]
- Calduch-Giner, J.A.; Echasseriau, Y.; Crespo, D.; Baron, D.; Planas, J.V.; Prunet, P.; Pérez-Sánchez, J. Transcriptional assessment by microarray analysis and large-scale meta-analysis of the metabolic capacity of cardiac and skeletal muscle tissues to cope with reduced nutrient availability in gilthead sea bream (Sparus aurata L.). Mar. Biotechnol. 2014, 16, 423–435. [Google Scholar] [CrossRef] [PubMed]
- Natsidis, P.; Tsakogiannis, A.; Pavlidis, P.; Tsigenopoulos, C.S.; Manousaki, T. Phylogenomics investigation of Sparids (Teleostei: Spariformes) using high-quality proteomes highlights the importance of taxon sampling. Commun. Biol. 2019, 2, 400. [Google Scholar] [CrossRef]
- Duchêne, S.; Geoghegan, J.L.; Holmes, E.C.; Ho, S.Y.W. Estimating evolutionary rates using time-structured data: A general comparison of phylogenetic methods. Bioinformatics 2016, 32, 3375–3379. [Google Scholar] [CrossRef]
- Robin, J.D.; Burbano, M.S.J.; Peng, H.; Croce, O.; Thomas, J.L.; Laberthonniere, C.; Renault, V.; Lototska, L.; Pousse, M.; Tessier, F.; et al. Mitochondrial function in skeletal myofibers is controlled by a TRF2-SIRT3 axis over lifetime. Aging Cell 2020, 19, e13097. [Google Scholar] [CrossRef] [PubMed]
- Maissan, P.; Mooij, E.J.; Barberis, M. Sirtuins-mediated system-level regulation of mammalian tissues at the interface between metabolism and cell cycle: A systematic review. Biology 2021, 10, 194. [Google Scholar] [CrossRef] [PubMed]
- Rangarajan, P.; Karthikeyan, A.; Lu, J.; Ling, E.A.; Dheen, S.T. Sirtuin 3 regulates Foxo3a-mediated antioxidant pathway in microglia. Neuroscience 2015, 311, 398–414. [Google Scholar] [CrossRef]
- Geng, K.; Fu, N.; Yang, X.; Xia, W. Adjudin delays cellular senescence through Sirt3-mediated attenuation of ROS production. Int. J. Mol. Med. 2018, 42, 3522–3529. [Google Scholar] [CrossRef] [PubMed]
- Bellizzi, D.; Dato, S.; Cavalcante, P.; Covello, G.; Di Cianni, F.; Passarino, G.; Rose, G.; De Benedictis, G. Characterization of a bidirectional promoter shared between two human genes related to aging: SIRT3 and PSMD13. Genomics 2007, 89, 143–150. [Google Scholar] [CrossRef] [PubMed]
- Iwahara, T.; Bonasio, R.; Narendra, V.; Reinberg, D. SIRT3 functions in the nucleus in the control of stress-related gene expression. Mol. Cell. Biol. 2012, 32, 5022–5034. [Google Scholar] [CrossRef] [PubMed]
- Owens, N.D.; Blitz, I.L.; Lane, M.A.; Patrushev, I.; Overton, J.D.; Gilchrist, M.J.; Cho, K.W.; Khokha, M.K. Measuring absolute RNA copy numbers at high temporal resolution reveals transcriptome kinetics in development. Cell Rep. 2016, 14, 632–647. [Google Scholar] [CrossRef] [PubMed]
- Shahgaldi, S.; Kahmini, F.R. A comprehensive review of Sirtuins: With a major focus on redox homeostasis and metabolism. Life Sci. 2021, 282, 119803. [Google Scholar] [CrossRef] [PubMed]
- Piazzon, M.C.; Mladineo, I.; Naya-Català, F.; Dirks, R.P.; Jong-Raadsen, S.; Vrbatović, A.; Hrabar, J.; Pérez-Sánchez, J.; Sitjà-Bobadilla, A. Acting locally-affecting globally: RNA sequencing of gilthead sea bream with a mild Sparicotyle chrysophrii infection reveals effects on apoptosis, immune and hypoxia related genes. BMC Genom. 2019, 20, 200. [Google Scholar] [CrossRef]
- Martos-Sitcha, J.A.; Simó-Mirabet, P.; de las Heras, V.; Calduch-Giner, J.À.; Pérez-Sánchez, J. Tissue-specific orchestration of gilthead sea bream resilience to hypoxia and high stocking density. Front. Physiol. 2019, 10, 00840. [Google Scholar] [CrossRef]
- Vasquez, M.C.; Martinez, D.A.; Tomanek, L. Multiple stressor responses are regulated by sirtuins in Mytilus congeners. Comp. Biochem. Physiol. A Mol. Integr. Physiol. 2020, 246, 110719. [Google Scholar] [CrossRef]
- Pérez-Sánchez, J.; Simó-Mirabet, P.; Naya-Català, F.; Martos-Sitcha, J.A.; Perera, E.; Bermejo-Nogales, A.; Calduch-Giner, J.A. Somatotropic axis regulation unravels the differential effects of nutritional and environmental factors in growth performance of marine farmed fishes. Front. Endocrinol. 2018, 9, 687. [Google Scholar] [CrossRef]
- Yamamoto, M.; Iguchi, G.; Fukuoka, H.; Suda, K.; Bando, H.; Takahashi, M.; Nishizawa, H.; Seino, S.; Takahashi, Y. SIRT1 regulates adaptive response of the growth hormone—Insulin-like growth factor-I axis under fasting conditions in liver. Proc. Natl. Acad. Sci. 2013, 110, 14948–14953. [Google Scholar] [CrossRef]
- Satoh, A.; Brace, C.S.; Ben-Josef, G.; West, T.; Wozniak, D.F.; Holtzman, D.M.; Herzog, E.D.; Imai, S. SIRT1 promotes the central adaptive response to diet restriction through activation of the dorsomedial and lateral nuclei of the hypothalamus. J. Neurosci. 2010, 30, 10220–10232. [Google Scholar] [CrossRef]
- Cohen, E.; Paulsson, J.F.; Blinder, P.; Burstyn-Cohen, T.; Du, D.; Estepa, G.; Adame, A.; Pham, H.M.; Holzenberger, M.; Kelly, J.W.; et al. Reduced IGF-1 signaling delays age-associated proteotoxicity in mice. Cell 2009, 139, 1157–1169. [Google Scholar] [CrossRef] [PubMed]
- Kikuta, H.; Laplante, M.; Navratilova, P.; Komisarczuk, A.Z.; Engström, P.G.; Fredman, D.; Akalin, A.; Caccamo, M.; Sealy, I.; Howe, K.; et al. Genomic regulatory blocks encompass multiple neighboring genes and maintain conserved synteny in vertebrates. Genome Res. 2007, 17, 545–555. [Google Scholar] [CrossRef] [PubMed]
- Farré, M.; Kim, J.; Proskuryakova, A.A.; Zhang, Y.; Kulemzina, A.I.; Li, Q.; Zhou, Y.; Xiong, Y.; Johnson, J.L.; Perelman, P.L.; et al. Evolution of gene regulation in ruminants differs between evolutionary breakpoint regions and homologous synteny blocks. Genome Res. 2019, 29, 576–589. [Google Scholar] [CrossRef]
- Kuznetsov, D.; Tegenfeldt, F.; Manni, M.; Seppey, M.; Berkeley, M.; Kriventseva, E.V.; Zdobnov, E.M. OrthoDB v11: Annotation of orthologs in the widest sampling of organismal diversity. Nucleic Acids Res. 2023, 51, D445–D451. [Google Scholar] [CrossRef] [PubMed]
- Nicholas, K.B.; Nicholas, H.B.; Deerfield, D.W. GeneDoc: Analysis and visualization of genetic variation. Embnew News 1997, 4, 14. [Google Scholar]
- Tamura, K.; Stecher, G.; Kumar, S. MEGA11: Molecular evolutionary genetics analysis version 11. Mol. Biol. Evol. 2021, 38, 3022–3027. [Google Scholar] [CrossRef]
- Jones, D.T.; Taylor, W.R.; Thornton, J.M. The rapid generation of mutation data matrices from protein sequences. Comp. Appl. Biosci. 1992, 8, 275–282. [Google Scholar] [CrossRef]
- Nguyen, N.T.T.; Vincens, P.; Dufayard, J.F.; Roest Crollius, H.; Louis, A. Genomicus in 2022: Comparative tools for thousands of genomes and reconstructed ancestors. Nucleic Acids Res. 2022, 50, D1025–D1031. [Google Scholar] [CrossRef]
- Livak, K.J.; Schmittgen, T.D. Analysis of relative gene expression data using real-time quantitative PCR and the 2(-Delta Delta C(T)) method. Methods 2001, 25, 402–408. [Google Scholar] [CrossRef]
- Sturn, A.; Quackenbush, J.; Trajanoski, Z. Genesis: Cluster analysis of microarray data. Bioinformatics 2002, 18, 207–208. [Google Scholar] [CrossRef] [PubMed]


Disclaimer/Publisher’s Note: The statements, opinions and data contained in all publications are solely those of the individual author(s) and contributor(s) and not of MDPI and/or the editor(s). MDPI and/or the editor(s) disclaim responsibility for any injury to people or property resulting from any ideas, methods, instructions or products referred to in the content. |
© 2024 by the authors. Licensee MDPI, Basel, Switzerland. This article is an open access article distributed under the terms and conditions of the Creative Commons Attribution (CC BY) license (https://creativecommons.org/licenses/by/4.0/).