
Using Hybrid PDI-Fe3O4 Nanoparticles for Capturing Aliphatic Alcohols: Halogen Bonding vs. Lone Pair–π Interactions


Abstract
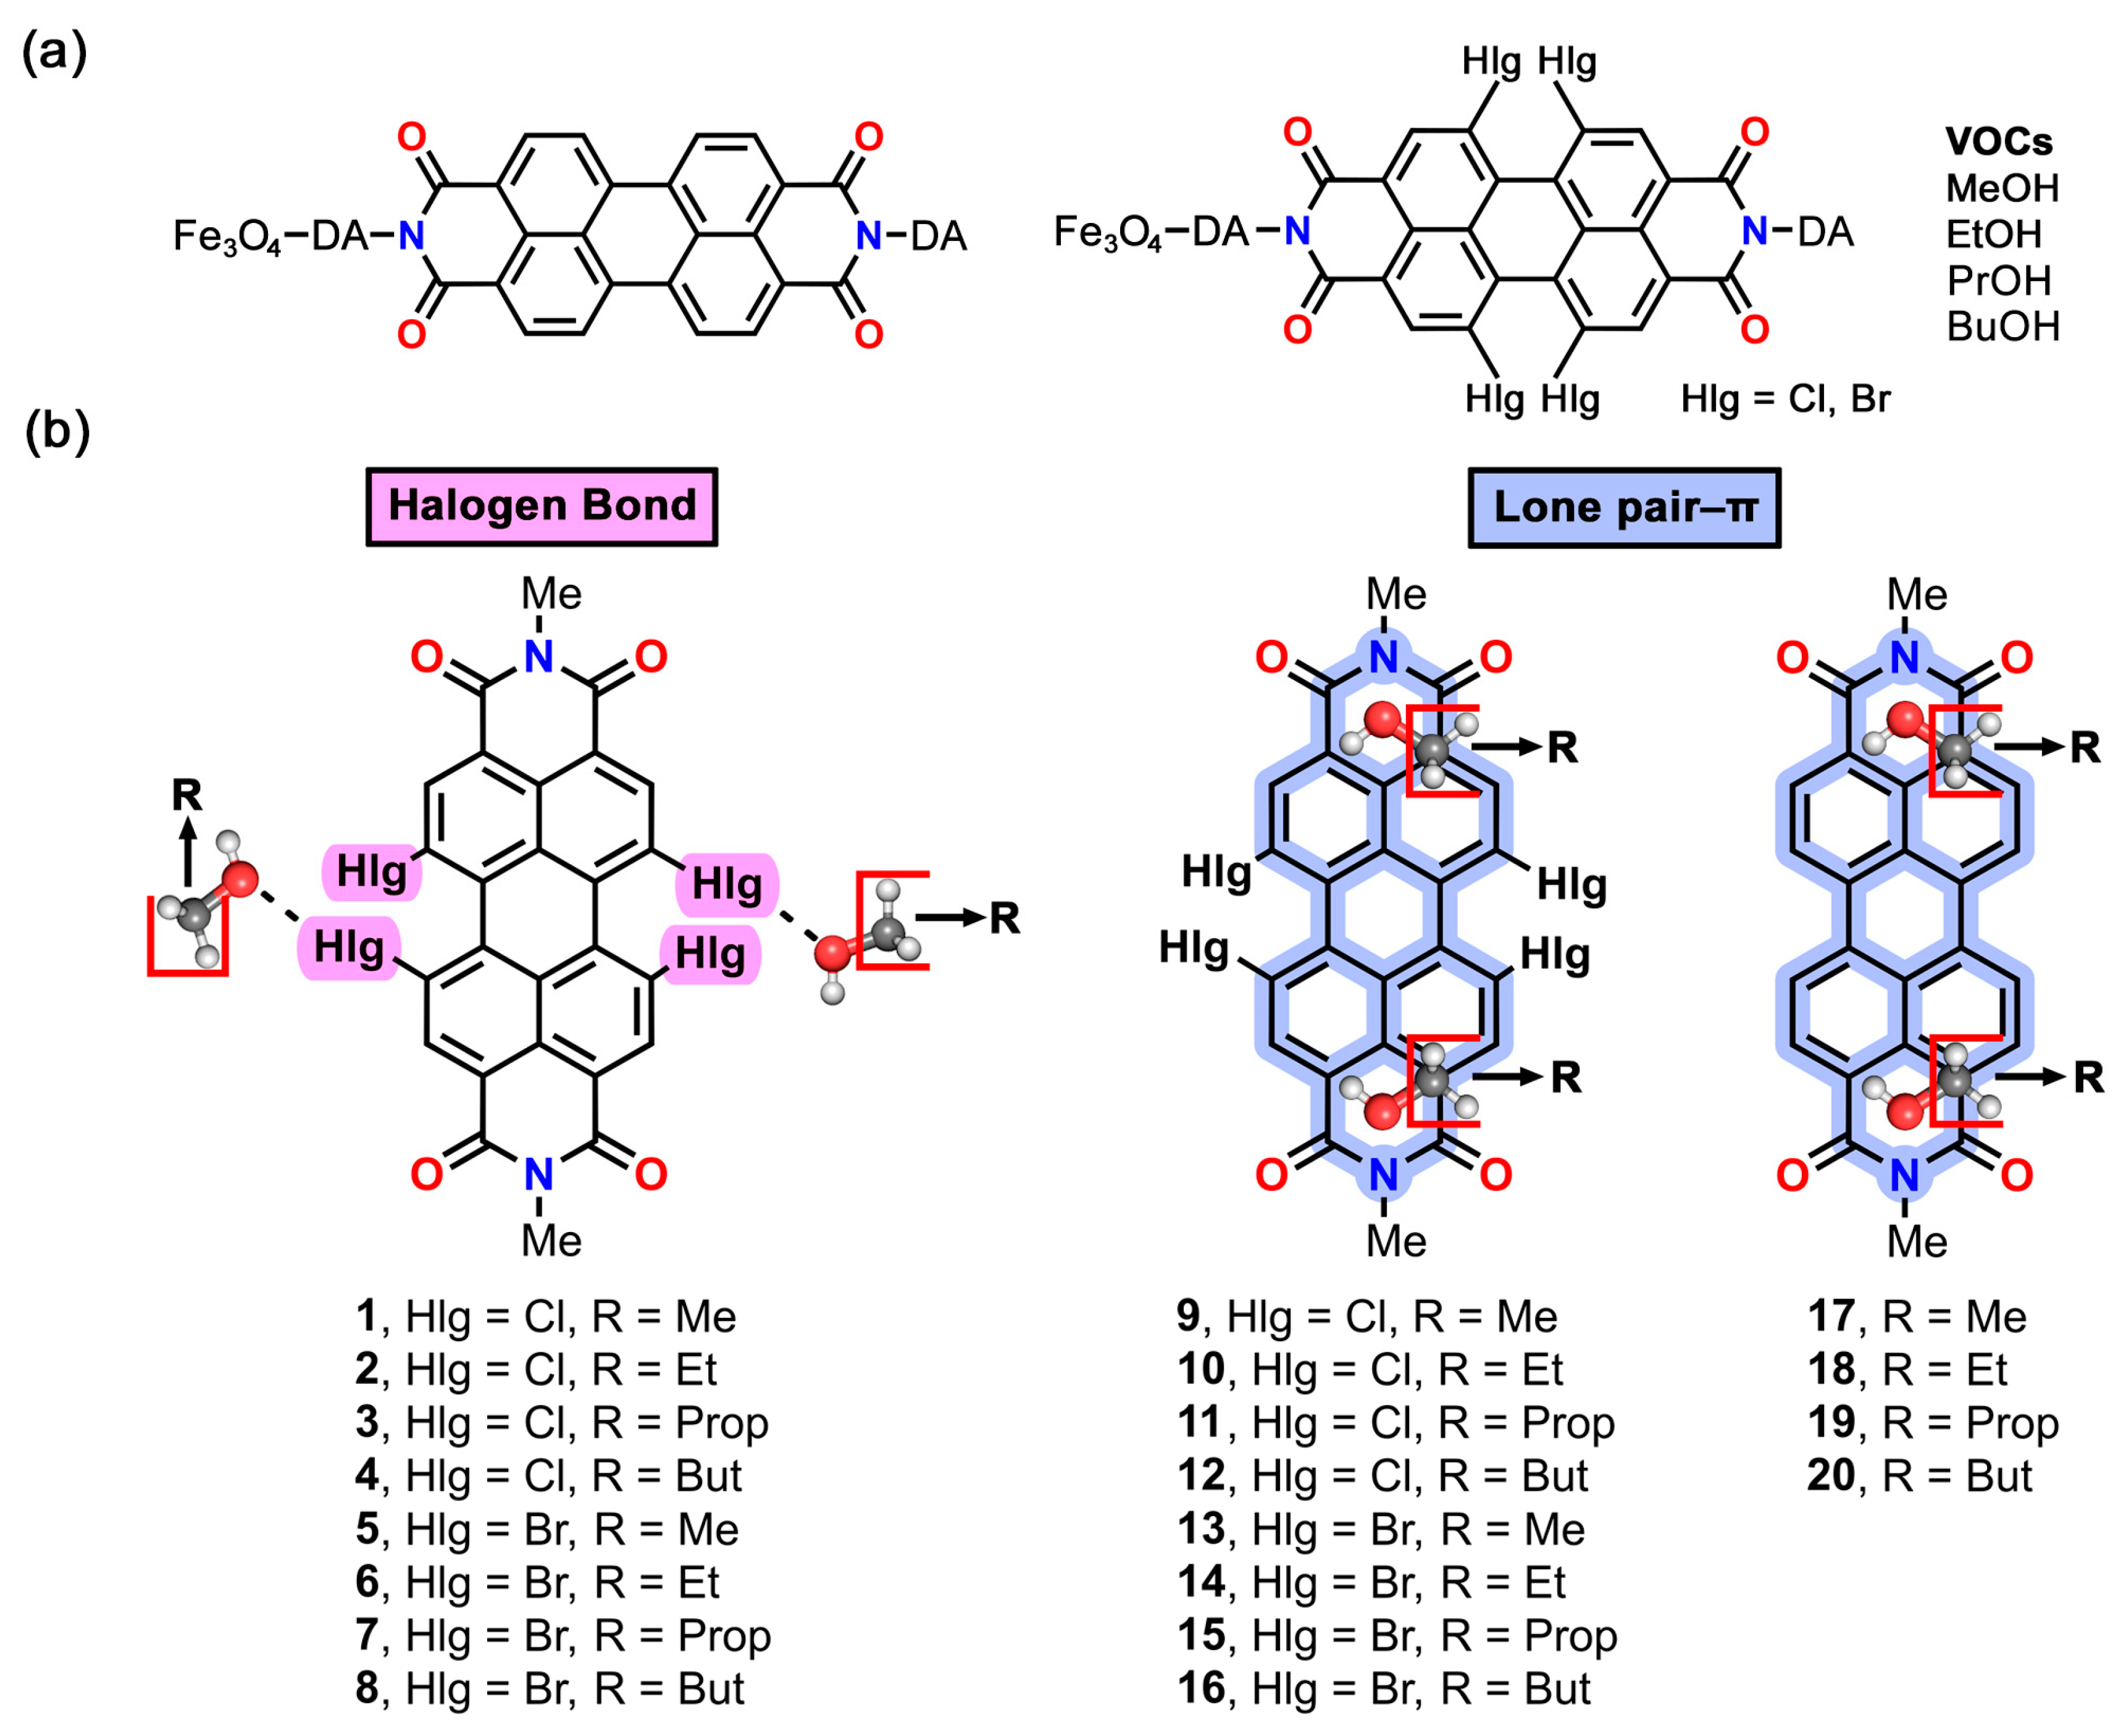
1. Introduction
2. Results and Discussion
2.1. Synthesis and Characterization of the Nanoparticles, Fabrication of the Sorbent Tubes, and Adsorption/Desorption Experiments
2.2. Adsorption Results
2.3. Theoretical Calculations
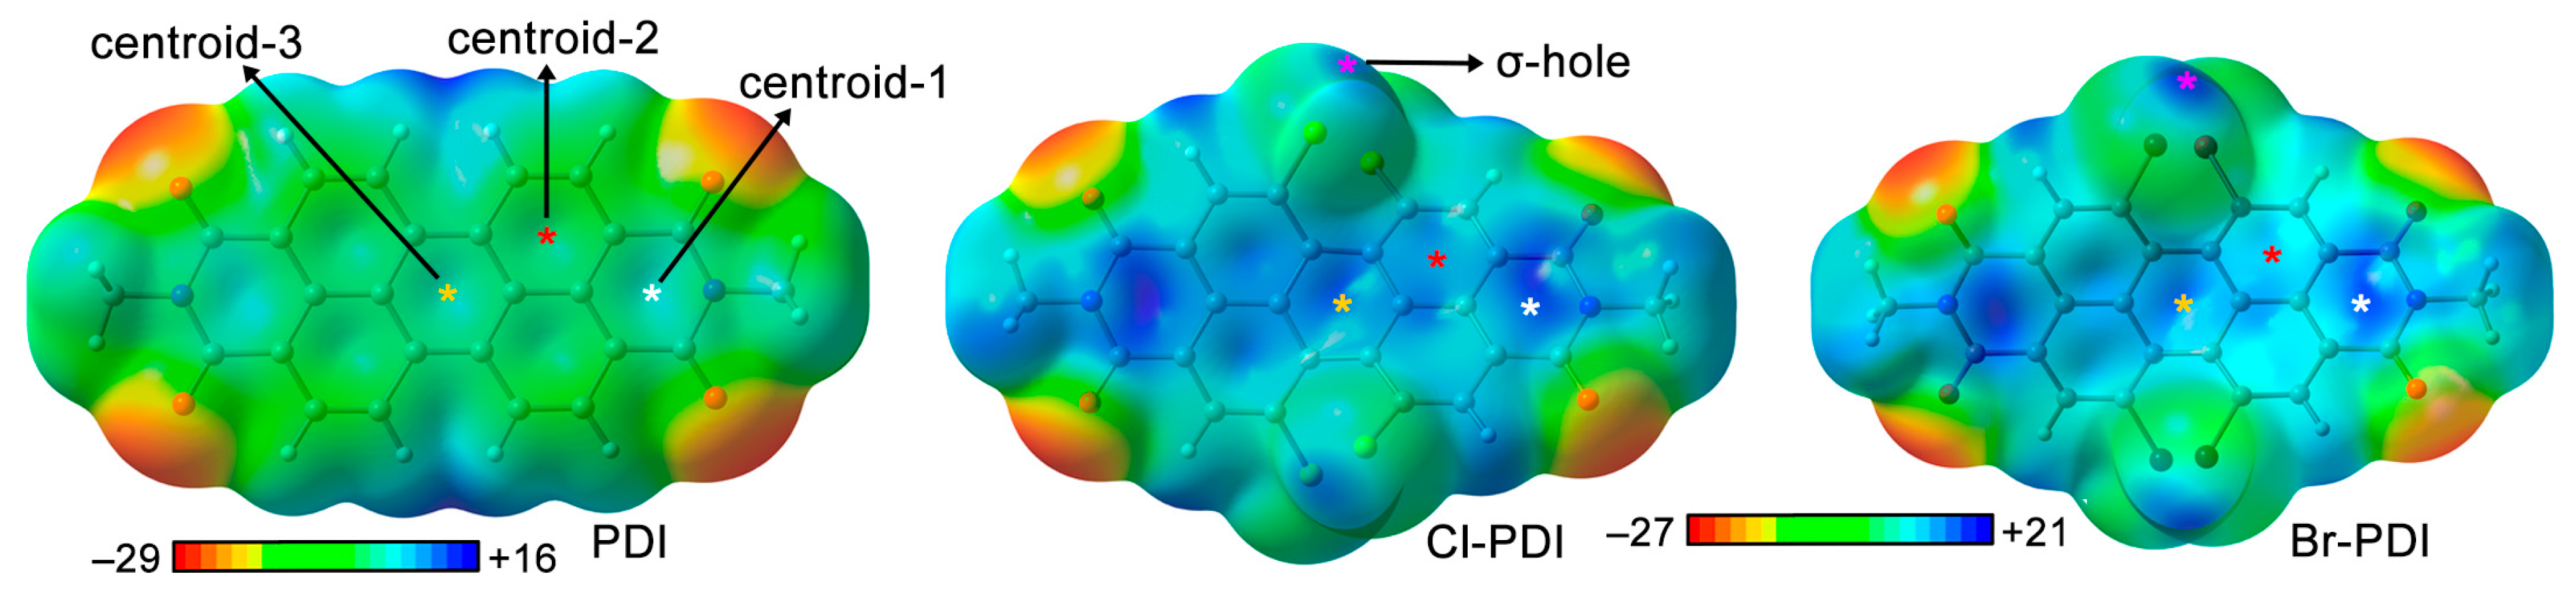
2.4. Molecular Electrostatic Potential Surface Study
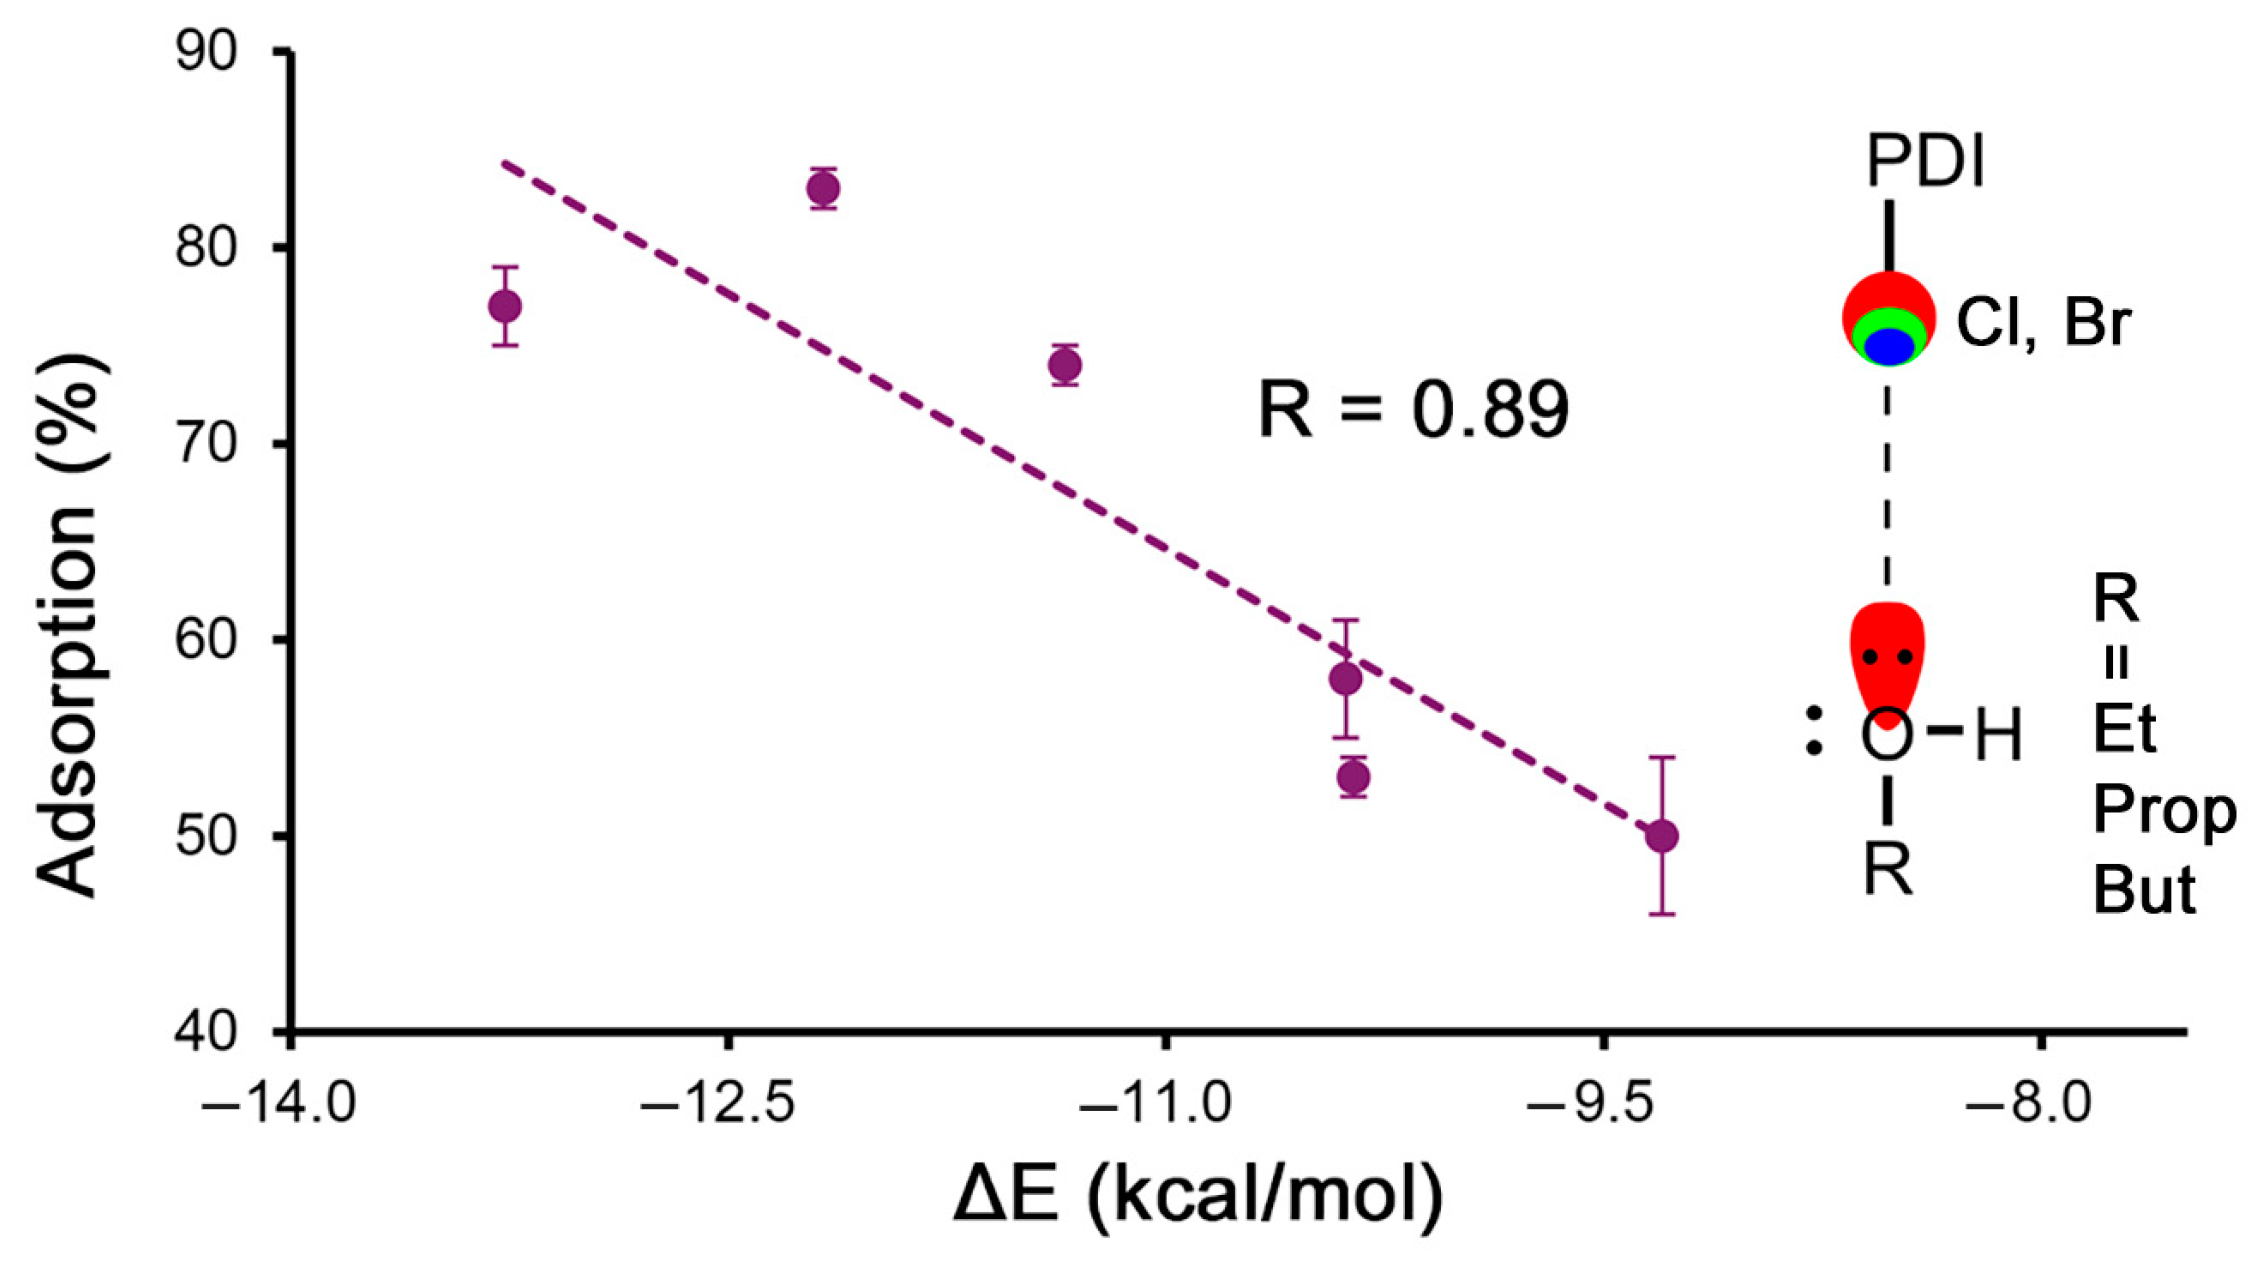
2.5. Energetic Study
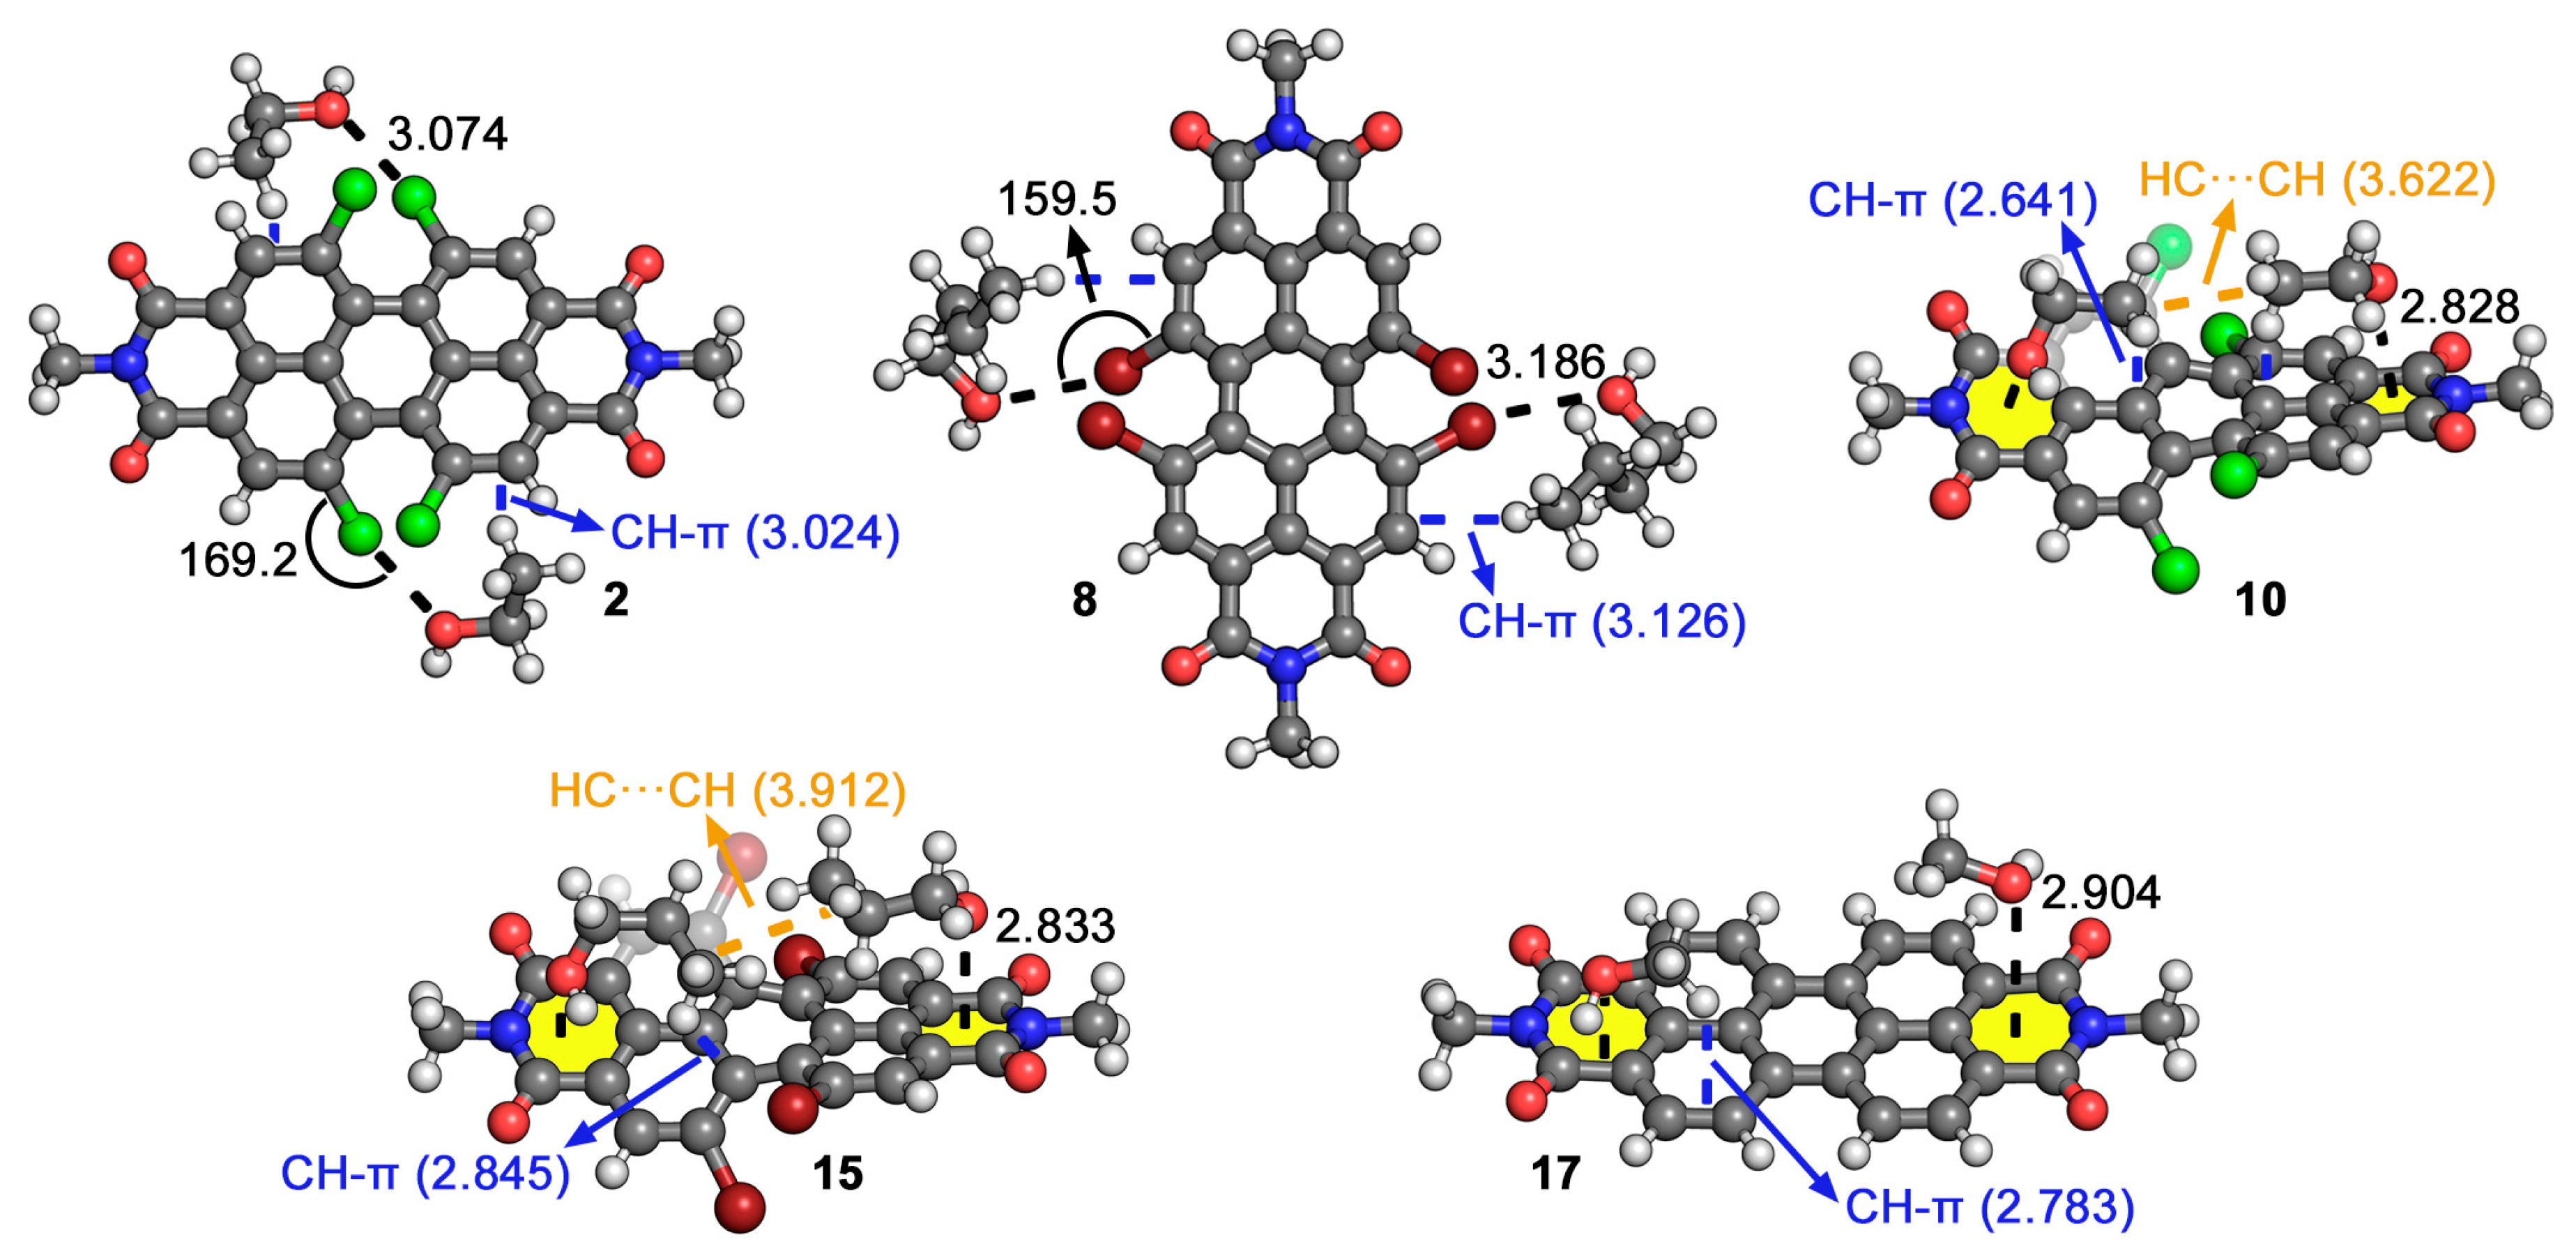
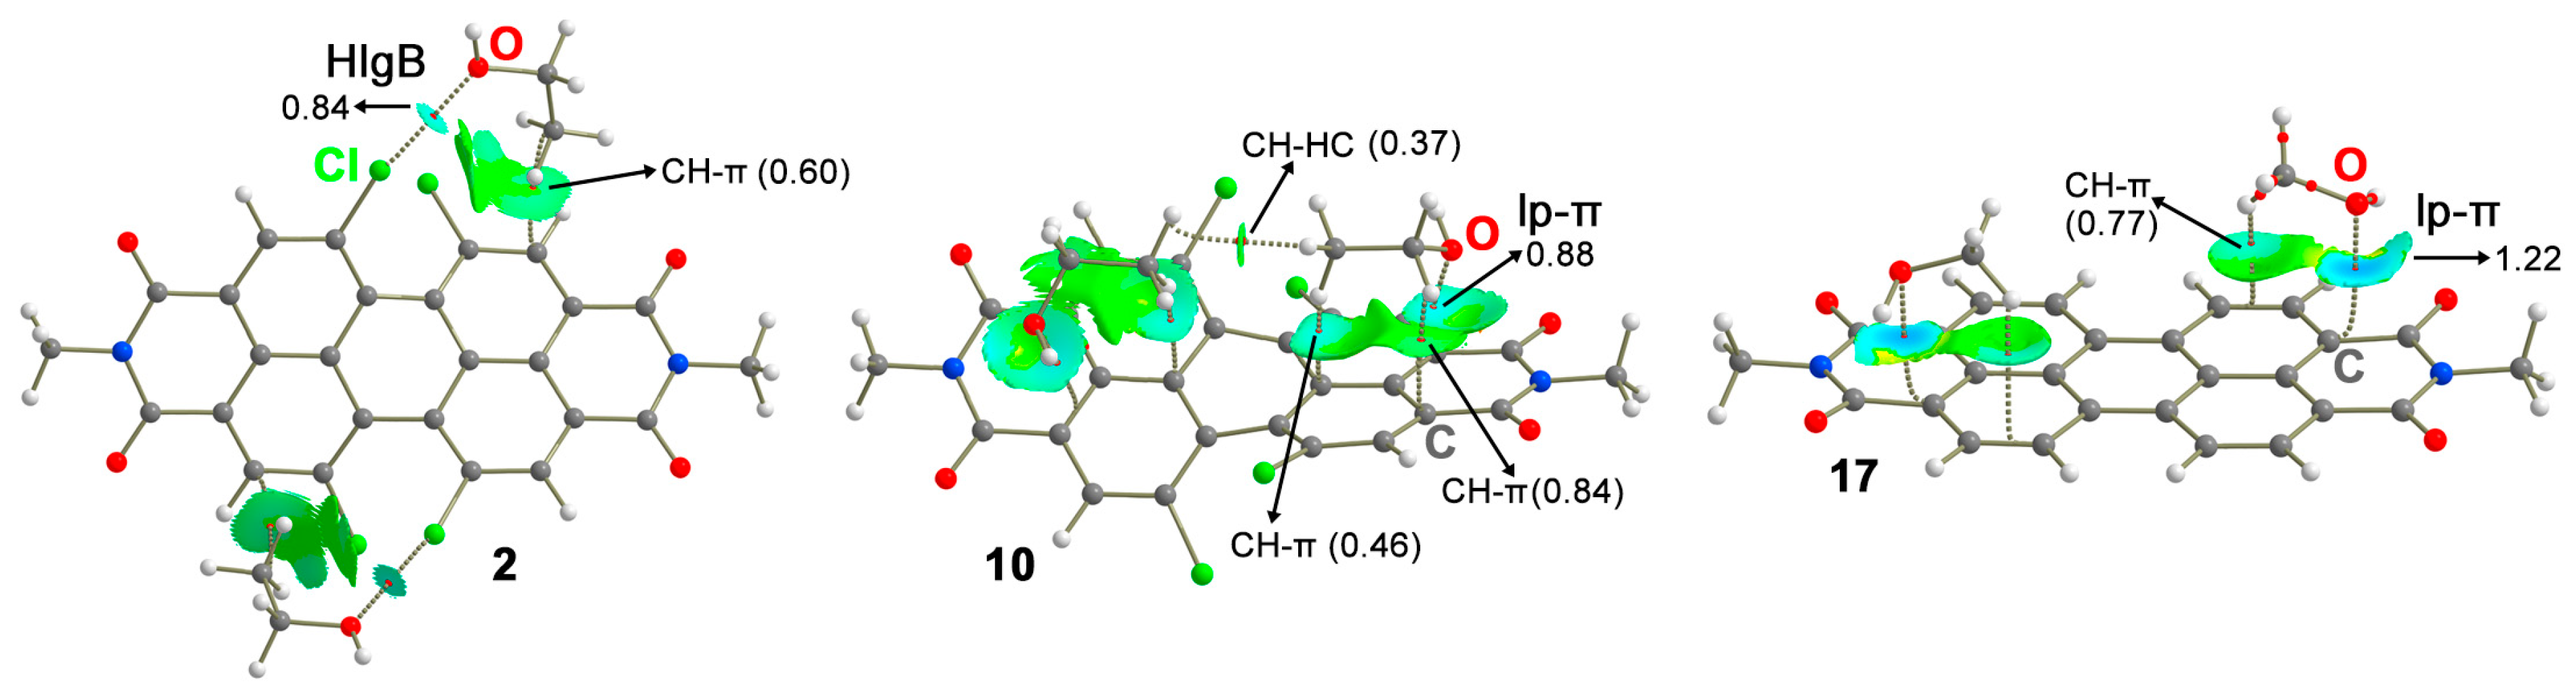
2.6. QTAIM and NCIplot Analyses
3. Materials and Methods
3.1. Experimental Methods
3.1.1. General
3.1.2. Instrumentation
3.1.3. Preparation of 2,9-Bis(3,4-Dihydroxyphenethyl)-1,6,7,12-Tetrachloroperylene Tetracarboxylic Diimide (Cl-PDI)
3.1.4. Preparation of Functionalized Magnetite Nanoparticles Cl-PDI-NP
3.1.5. Standard Solutions
3.1.6. Tubes Filled with Hybrid Nanoparticles
3.1.7. Analytical Instrumentation and Procedure
3.2. Computational Methods
4. Conclusions
Supplementary Materials
Author Contributions
Funding
Institutional Review Board Statement
Informed Consent Statement
Data Availability Statement
Acknowledgments
Conflicts of Interest
References
- Nozière, B.; Kalberer, M.; Claeys, M.; Allan, J.; D’Anna, B.; Decesari, S.; Finessi, E.; Glasius, M.; Grgić, I.; Hamilton, J.F.; et al. The molecular identification of organic compounds in the atmosphere: State of the art and challenges. Chem. Rev. 2015, 115, 3919–3983. [Google Scholar] [CrossRef] [PubMed]
- Mahilang, M.; Deb, M.D.; Pervez, S. Biogenic secondary organic aerosols: A review on formation mechanism, analytical challenges and environmental impacts. Chemosphere 2021, 262, 127771. [Google Scholar] [CrossRef] [PubMed]
- Forbers, P. Atmospheric Chemistry Analysis: A. Review. Anal. Chem. 2020, 92, 455–472. [Google Scholar] [CrossRef] [PubMed]
- Pozzer, A.C.; Gómez, P.A.; Weiss, J. Volatile organic compounds in aquatic ecosystems–Detection, origin, significance and applications. Sci. Total Environ. 2022, 838, 156155. [Google Scholar] [CrossRef] [PubMed]
- Tumlinson, J.H. The importance of volatile organic compounds in ecosystem functioning. J. Chem. Ecol. 2014, 40, 212–213. [Google Scholar] [CrossRef] [PubMed]
- Zhou, X.; Zhou, X.; Wang, C.; Zhou, H. Environmental and human health impacts of volatile organic compounds: A perspective review. Chemosphere 2023, 313, 137489. [Google Scholar] [CrossRef] [PubMed]
- Duan, C.; Liao, H.; Wang, K.; Ren, Y. The research hotspots and trends of volatile organic compound emissions from anthropogenic and natural sources: A systematic quantitative review. Environ. Res. 2023, 216, 114386. [Google Scholar] [CrossRef] [PubMed]
- Piccot, S.D.; Watson, J.J.; Jones, J.W. A global inventory of volatile organic compound emissions from anthropogenic sources. Geophys. Res. Atmos. 1992, 97, 9897–9912. [Google Scholar] [CrossRef]
- Vichi, F.; Ianniello, A.; Frattoni, M.; Imperiali, A.; Esposito, G.; Scianò, M.C.T.; Perilli, M.; Cecinato, A. Air quality assessment in the central mediterranean sea (Tyrrhenian Sea): Anthropic impact and miscellaneous natural sources, including volcanic contribution, on the budget of Volatile Organic Compounds (VOCs). Atmosphere 2021, 12, 1609. [Google Scholar] [CrossRef]
- Khare, P.; Gentner, D.R. Considering the future of anthropogenic gas-phase organic compound emissions and the increasing influence of non-combustion sources on urban air quality. Atmos. Chem. Phys. 2018, 18, 5391–5413. [Google Scholar] [CrossRef]
- Hernández-Fernández, J.; Lopez-Martinez, J.; Barceló, D. Quantification and elimination of substituted synthetic phenols and volatile organic compounds in the wastewater treatment plant during the production of industrial scale polypropylene. Chemosphere 2021, 263, 128027. [Google Scholar] [CrossRef]
- Kim, B.R. VOC emissions from automotive painting and their control: A review. Environ. Eng. Res. 2011, 16, 1–9. [Google Scholar] [CrossRef]
- Do, D.H.; Langenhove, H.V.; Chigbo, S.I.; Amare, A.N.; Demeestere, K.; Walgraeve, C. Exposure to volatile organic compounds: Comparison among different transportation modes. Atmos. Environ. 2014, 94, 53–62. [Google Scholar] [CrossRef]
- Legreid, G.; Reimann, S.; Steinbacher, M.; Staehelin, J.; Young, D.; Stemmler, K. Measurements of OVOCs and NMHCs in a swiss highway tunnel for estimation of road transport emissions. Environ. Sci. Technol. 2007, 41, 7060–7066. [Google Scholar] [CrossRef]
- König, G.; Brunda, M.; Puxbaum, H.; Hewitt, C.N.; Duckham, S.C.; Rudolph, J. Relative contribution of oxygenated hydrocarbons to the total biogenic VOC emissions of selected mid-European agricultural and natural plant species. Atmos. Environ. 1995, 29, 861–874. [Google Scholar] [CrossRef]
- Contarino, R.; Brighina, S.; Fallico, B.; Cirvilleri, G.; Parafati, L.; Restuccia, C. Volatile organic compounds (VOCs) produced by biocontrol yeasts. Food Microbiol. 2019, 82, 70–74. [Google Scholar] [CrossRef]
- Heeley-Hill, A.C.; Grange, S.K.; Ward, M.W.; Lewis, A.C.; Owen, N.; Jordan, C.; Hodgson, G.; Adamson, G. Frequency of use of household products containing VOCs and indoor atmospheric concentrations in homes. Environ. Sci. Process. Impacts 2021, 23, 699–713. [Google Scholar] [CrossRef]
- Arata, C.; Misztal, P.K.; Tian, Y.; Lunderberg, D.M.; Kristensen, K.; Novoselac, A.; Vance, M.E.; Farmer, D.K.; Nazaroff, W.W.; Goldstein, A.H. Volatile organic compound emissions during HOMEChem. Indoor Air 2021, 31, 2099–2117. [Google Scholar] [CrossRef]
- Fischer, E.V.; Jacob, D.J.; Yantosca, R.M.; Sulprizio, M.P.; Millet, D.B.; Mao, J.; Paulot, F.; Singh, H.B.; Roiger, A.; Ries, L.; et al. Atmospheric peroxyacetyl nitrate (PAN): A global budget and source attribution. Atmos. Chem. Phys. 2014, 14, 2679–2698. [Google Scholar] [CrossRef] [PubMed]
- Luecken, D.J.; Hutzell, W.T.; Strum, M.L.; Pouliot, G.A. Regional sources of atmospheric formaldehyde and acetaldehyde, and implications for atmospheric modeling. Atmos. Environ. 2012, 47, 477–490. [Google Scholar] [CrossRef]
- Xue, L.; Wang, T.; Wang, X.; Blake, D.R.; Gao, J.; Nie, W.; Gao, R.; Gao, X.; Xu, Z.; Ding, A.; et al. On the use of an explicit chemical mechanism to dissect peroxy acetyl nitrate formation. Environ. Pollut. 2012, 47, 477–490. [Google Scholar] [CrossRef]
- Zeng, L.; Fan, G.-J.; Lyu, X.; Guo, H.; Wang, J.-L.; Yao, D. Atmospheric fate of peroxyacetyl nitrate in suburban Hong Kong and its impact on local ozone pollution. Environ. Pollut. 2019, 252, 1910–1919. [Google Scholar] [CrossRef]
- Zhang, G.; Jing, S.; Xu, W.; Gao, Y.; Yan, G.; Liang, L.; Huang, C.; Wang, H. Simultaneous observation of atmospheric peroxyacetyl nitrate and ozone in the megacity of Shanghai, China: Regional transport and thermal decomposition. Environ. Pollut. 2021, 274, 116570. [Google Scholar] [CrossRef]
- Chen, X.; Millet, D.B.; Singh, H.B.; Wisthaler, A.; Apel, E.C.; Atlas, E.L.; Blake, D.R.; Bourgeois, I.; Brown, S.S.; Crounse, J.D.; et al. On the sources and sinks of atmospheric VOCs: An integrated analysis of recent aircraft campaigns over North America. Atmos. Chem. Phys. 2019, 19, 9097–9123. [Google Scholar] [CrossRef]
- Mellouki, A.; Wallington, T.J.; Chen, J. Atmospheric chemistry of oxygenated volatile organic compounds: Impacts on air quality and climate. Chem. Rev. 2015, 115, 3984–4014. [Google Scholar] [CrossRef]
- Yang, K.; Llusià, J.; Preece, C.; Tan, Y.; Peñuelas, J. Exchange of volatile organic compounds between the atmosphere and the soil. Plant Soil 2024, 1–27. [Google Scholar] [CrossRef]
- Schade, G.W.; Goldstein, A.H. Fluxes of oxygenated volatile organic compounds from a ponderosa pine plantation. Geophys. Res. Atmos. 2001, 106, 3111–3123. [Google Scholar] [CrossRef]
- Rantala, P.; Taipale, J.A.R.; Ruuskanen, T.M.; Rinne, J. Annual cycle of volatile organic compound exchange between a boreal pine forest and the atmosphere. Biogeosciences 2015, 12, 5753–5770. [Google Scholar] [CrossRef]
- Piccardo, M.T.; Geretto, M.; Pulliero, A.; Izzotti, A. Odor emissions: A public health concern for health risk perception. Environ. Res. 2022, 204, 112121. [Google Scholar] [CrossRef]
- Bolla, K.I. Neuropsychological assessment for detecting adverse effects of volatile organic compounds on the central nervous system. Environ. Health Perspect. 1991, 95, 93–98. [Google Scholar] [CrossRef]
- Janfaza, S.; Khorsand, B.; Nikkah, M.; Zahiri, J. Digging deeper into volatile organic compounds associated with cancer. Biol. Methods Protoc. 2019, 4, bpz014. [Google Scholar] [CrossRef]
- Calvo Olivares, R.D.; Rivera, S.S.; Núñez Mc Leod, J.E.J. Database for accidents and incidents in the fuel ethanol industry. Loss Prev. Process Ind. 2015, 38, 276–297. [Google Scholar] [CrossRef]
- Calvo Olivares, R.D.; Rivera, S.S.; Núñez Mc Leod, J.E.J. Database for accidents and incidents in the biodiesel industry. Loss Prev. Process Ind. 2014, 29, 245–261. [Google Scholar] [CrossRef]
- Piña, M.N.; Rodríguez, P.; Gutiérrez, M.S.; Quiñonero, D.; Morey, J.; Frontera, A. Adsorption and Quantification of Volatile Organic Compounds (VOCs) by using Hybrid Magnetic Nanoparticles. Chem. Eur. J. 2018, 24, 12820–12826. [Google Scholar] [CrossRef]
- Piña, M.N.; Gutiérrez, M.S.; Panagos, M.; Duel, P.; León, P.; Morey, J.; Quiñonero, D.; Frontera, A. Influence of the aromatic surface on the capacity of adsorption of VOCs by magnetite supported organic–inorganic hybrids. RSC Adv. 2019, 9, 24184–24191. [Google Scholar] [CrossRef]
- López, K.A.; Piña, M.N.; Quiñonero, D.; Ballester, P.; Morey, J. Highly efficient coordination of Hg2+ and Pb2+ metals in water with squaramide-coated Fe3O4 nanoparticles. J. Mat. Chem. A 2014, 2, 8796–8803. [Google Scholar] [CrossRef]
- Gutiérrez, M.S.; Duel, P.; Hierro, F.; Morey, J.; Piña, M.N. A very highly efficient magnetic nanomaterial for the removal of PAHs from aqueous media. Small 2017, 14, 1702573. [Google Scholar] [CrossRef]
- Yazdani, F.; Seddigh, M. Magnetite nanoparticles synthesized by co-precipitation method: The effects of various iron anions on specifications. Mater. Chem. Phys. 2016, 184, 318–323. [Google Scholar] [CrossRef]
- Gutiérrez, M.S.; León, A.J.; Duel, P.; Bosch, R.; Piña, M.N.; Morey, J. Effective elimination and biodegradation of polycyclic aromatic hydrocarbons from seawater through the formation of magnetic microfibres. Int. J. Mol. Sci. 2021, 22, 17. [Google Scholar] [CrossRef]
- Gutiérrez, M.S.; Piña, M.N.; Morey, J. Fast microwave-assisted conjugation of magnetic nanoparticles with carboxylates of biological interest. RSC Adv. 2017, 7, 19385–19390. [Google Scholar] [CrossRef]
- Cavallo, G.; Metrangolo, P.; Milani, R.; Pilati, T.; Priimagi, A.; Resnati, G.; Terraneo, G. The Halogen Bond. Chem. Rev. 2016, 116, 2478–2601. [Google Scholar] [CrossRef] [PubMed]
- Tsuzuki, S.; Fujii, A. Nature and physical origin of CH/π interaction: Significant difference from conventional hydrogen bonds. Phys. Chem. Chem. Phys. 2008, 10, 2584–2594. [Google Scholar] [CrossRef] [PubMed]
- Becke, A.D. Density-functional exchange-energy approximation with correct asymptotic behavior. Phys. Rev. A 1988, 38, 3098–3100. [Google Scholar] [CrossRef] [PubMed]
- Grimme, S.; Antony, J.; Ehrlich, S.; Krieg, H. A consistent and accurate ab initio parametrization of density functional dispersion correction (DFT-D) for the 94 elements H-Pu. J. Chem. Phys. 2010, 132, 154104. [Google Scholar] [CrossRef]
- Weigend, F.; Ahlrichs, R. Balanced basis sets of split valence, triple zeta valence and quadruple zeta valence quality for H to Rn: Design and assessment of accuracy. Phys. Chem. Chem. Phys. 2005, 7, 3297–3305. [Google Scholar] [CrossRef] [PubMed]
- Balasubramani, S.G.; Chen, G.P.; Coriani, S.; Diedenhofen, M.; Frank, M.S.; Franzke, Y.J.; Furche, F.; Grotjahn, R.; Harding, M.E.; Hättig, C.; et al. TURBOMOLE: Modular program suite for ab initio quantum-chemical and condensed-matter simulations. J. Chem. Phys. 2020, 152, 184107. [Google Scholar] [CrossRef]
- Frisch, M.J.; Trucks, G.W.; Schlegel, H.B.; Scuseria, G.E.; Robb, M.A.; Cheeseman, J.R.; Scalmani, G.; Barone, V.; Petersson, G.A.; Nakatsuji, H.; et al. Gaussian 16, Revision B.01; Gaussian, Inc.: Wallingford, CT, USA, 2016.
- Dennington, R.; Keith, T.A.; Millam, J.M. GaussView, Version 5; Semichem Inc.: Shawnee Mission, KS, USA, 2016.
- Todd, A.; Keith, T.K. AIMAll, Version 13.05.06; Gristmill Software: Overland Park, KS, USA, 2013.
- Contreras-García, J.; Johnson, E.R.; Keinan, S.; Chaudret, R.; Piquemal, J.-P.; Beratan, D.N.; Yang, W. NCIPLOT: A Program for Plotting Noncovalent Interaction Regions. J. Chem. Theory Comput. 2011, 7, 625–632. [Google Scholar] [CrossRef]
- Johnson, E.R.; Keinan, S.; Mori-Sanchez, P.; Contreras-Garcia, J.; Cohen, A.J.; Yang, W. Revealing noncovalent interactions. J. Am. Chem. Soc. 2010, 132, 6498–6506. [Google Scholar] [CrossRef]

| Material | VOC | RT (min) | VOC in Front Tube (mg) | Adsorption (%) |
|---|---|---|---|---|
| PDI-NP | MeOH | 6.98 | 0.139 ± 0.019 | 58 ± 5 |
| Cl-PDI-NP | MeOH | 6.98 | 0.106 ± 0.016 | 68 ± 5 |
| Br-PDI-NP | MeOH | 6.98 | 0.093 ± 0.016 | 72 ± 5 |
| PDI-NP | EtOH | 8.33 | 0.248 ± 0.009 | 25 ± 3 |
| Cl-PDI-NP | EtOH | 8.33 | 0.165 ± 0.013 | 50 ± 4 |
| Br-PDI-NP | EtOH | 8.33 | 0.086 ± 0.003 | 74 ± 1 |
| PDI-NP | PrOH | 11.3 | 0.232 ± 0.009 | 29 ± 3 |
| Cl-PDI-NP | PrOH | 11.3 | 0.155 ± 0.007 | 53 ± 1 |
| Br-PDI-NP | PrOH | 11.3 | 0.076 ± 0.007 | 77 ± 2 |
| PDI-NP | BuOH | 14.8 | 0.227 ± 0.008 | 31 ± 3 |
| Cl-PDI-NP | BuOH | 14.8 | 0.139 ± 0.011 | 58 ± 3 |
| Br-PDI-NP | BuOH | 14.8 | 0.056 ± 0.004 | 83 ± 1 |
| Material | Vσ-hole | Vcentroid-1 * | Vcentroid-2 * | Vcentroid-3 * | Vmin | Vmax |
|---|---|---|---|---|---|---|
| Cl-PDI | +16.1 | +19.9 | +17.3 | +14.1 | −27 | +21 |
| Br-PDI | +19.8 | +20.5 | +16.4 | +14.0 | −27 | +21 |
| PDI | - | +15.5 | +12.8 | +9.3 | −29 | +16 |
| Complex (Material@VOC) | ΔE | ΔE per HlgB | d * | d *CH-π (HC···CH) | α | ρ × 100 | ρ × 100 CH-π (CH···HC) |
|---|---|---|---|---|---|---|---|
| 1 (Cl-PDI@MeOH) | −8.1 | −4.1 | 3.053 | 3.074 | 160.3 | 0.99 | 0.49 |
| 2 (Cl-PDI@EtOH) | −9.3 | −4.7 | 3.074 | 3.024 | 169.2 | 0.84 | 0.60 |
| 3 (Cl-PDI@PrOH) | −10.4 | −5.2 | 2.976 | 3.138 | 171.3 | 1.08 | 0.54 |
| 4 (Cl-PDI@BuOH) | −10.4 | −5.2 | 3.290 | 2.806 | 146.6 | 0.58 | 0.60 |
| 5 (Br-PDI@MeOH) | −8.4 | −4.2 | 3.054 | 2.849 | 159.9 | 1.07 | 0.58 |
| 6 (Br-PDI@EtOH) | −11.3 | −5.7 | 3.073 | 3.048 | 167.5 | 1.04 | 0.59 |
| 7 (Br-PDI@PrOH) | −13.3 | −6.7 | 2.953 | 3.183 | 174.2 | 1.38 | 0.52 |
| 8 (Br-PDI@BuOH) | −12.2 | −6.1 | 3.186 | 3.126 | 159.5 | 0.85 | 0.34 |
| Complex | ΔE * | ΔE per lp-π | d * | d *CH-π (HC···CH) | ρ × 100 | ρ × 100 CH-π (CH···HC) | |
| 9 (Cl-PDI@MeOH) | −15.0 | −7.5 | 2.918 | 3.120 | 1.07 | 0.65 | |
| 10 (Cl-PDI@EtOH) | −16.9 | −8.5 | 2.828 | 2.641 (3.622) | 0.88 | 0.46 (0.37) | |
| 11 (Cl-PDI@PrOH) | −22.5 | −11.3 | 2.842 | 3.075 (3.907) | 0.76 | 0.81 (0.51) | |
| 12 (Cl-PDI@BuOH) | −23.0 | −11.5 | 2.787 | 2.765 (3.598) | 1.00 | 0.75 (0.58) | |
| 13 (Br-PDI@MeOH) | −15.5 | −7.8 | 2.924 | 2.915 | 1.08 | 0.60 | |
| 14 (Br-PDI@EtOH) | −19.7 | −9.9 | 3.070 | 2.863 (3.460) | 0.84 | 0.64 (0.68) | |
| 15 (Br-PDI@PrOH) | −22.8 | −11.4 | 2.833 | 2.845 (3.912) | 0.76 | 0.87 (0.51) | |
| 16 (Br-PDI@BuOH) | −22.8 | −11.4 | 2.781 | 2.794 (3.595) | 0.98 | 0.71 (0.53) | |
| 17 (PDI@MeOH) | −7.2 | −3.6 | 2.904 | 2.783 | 1.22 | 0.77 | |
| 18 (PDI@EtOH) | −15.1 | −7.6 | 2.878 | 2.873 | 1.13 | 0.57 | |
| 19 (PDI@PrOH) | −18.9 | −9.5 | 3.066 | 2.829 (3.875) | 0.87 | 0.71 (0.59) | |
| 20 (PDI@BuOH) | −21.3 | −10.7 | 2.960 | 2.704 (3.730) | 1.04 | 0.77 (0.53) | |
Disclaimer/Publisher’s Note: The statements, opinions and data contained in all publications are solely those of the individual author(s) and contributor(s) and not of MDPI and/or the editor(s). MDPI and/or the editor(s) disclaim responsibility for any injury to people or property resulting from any ideas, methods, instructions or products referred to in the content. |
© 2024 by the authors. Licensee MDPI, Basel, Switzerland. This article is an open access article distributed under the terms and conditions of the Creative Commons Attribution (CC BY) license (https://creativecommons.org/licenses/by/4.0/).
Share and Cite
Piña, M.d.l.N.; León, A.; Frontera, A.; Morey, J.; Bauzá, A. Using Hybrid PDI-Fe3O4 Nanoparticles for Capturing Aliphatic Alcohols: Halogen Bonding vs. Lone Pair–π Interactions. Int. J. Mol. Sci. 2024, 25, 6436. https://doi.org/10.3390/ijms25126436
Piña MdlN, León A, Frontera A, Morey J, Bauzá A. Using Hybrid PDI-Fe3O4 Nanoparticles for Capturing Aliphatic Alcohols: Halogen Bonding vs. Lone Pair–π Interactions. International Journal of Molecular Sciences. 2024; 25(12):6436. https://doi.org/10.3390/ijms25126436
Chicago/Turabian StylePiña, María de las Nieves, Alberto León, Antonio Frontera, Jeroni Morey, and Antonio Bauzá. 2024. "Using Hybrid PDI-Fe3O4 Nanoparticles for Capturing Aliphatic Alcohols: Halogen Bonding vs. Lone Pair–π Interactions" International Journal of Molecular Sciences 25, no. 12: 6436. https://doi.org/10.3390/ijms25126436
APA StylePiña, M. d. l. N., León, A., Frontera, A., Morey, J., & Bauzá, A. (2024). Using Hybrid PDI-Fe3O4 Nanoparticles for Capturing Aliphatic Alcohols: Halogen Bonding vs. Lone Pair–π Interactions. International Journal of Molecular Sciences, 25(12), 6436. https://doi.org/10.3390/ijms25126436