Article

A Novel 10-Base Pair Deletion in the First Exon of GmHY2a Promotes Hypocotyl Elongation, Induces Early Maturation, and Impairs Photosynthetic Performance in Soybean

1
Key Laboratory of Soybean Molecular Design Breeding, State Key Laboratory of Black Soils Conservation and Utilization, Northeast Institute of Geography and Agroecology, Chinese Academy of Sciences, Harbin 150081, China
2
University of Chinese Academy of Sciences, Beijing 100049, China
3
Soybean Research Institute, Jilin Academy of Agricultural Sciences, Changchun 132102, China
4
Institute of Industrial Crops, Jiangsu Academy of Agricultural Sciences, Nanjing 210014, China
*
Author to whom correspondence should be addressed.
Int. J. Mol. Sci. 2024, 25(12), 6483; https://doi.org/10.3390/ijms25126483
Submission received: 24 April 2024 / Revised: 3 June 2024 / Accepted: 7 June 2024 / Published: 12 June 2024
(This article belongs to the Section Molecular Plant Sciences)

Abstract

:
Plants photoreceptors perceive changes in light quality and intensity and thereby regulate plant vegetative growth and reproductive development. By screening a γ irradiation-induced mutant library of the soybean (Glycine max) cultivar “Dongsheng 7”, we identified Gmeny, a mutant with elongated nodes, yellowed leaves, decreased chlorophyll contents, altered photosynthetic performance, and early maturation. An analysis of bulked DNA and RNA data sampled from a population segregating for Gmeny, using the BVF-IGV pipeline established in our laboratory, identified a 10 bp deletion in the first exon of the candidate gene Glyma.02G304700. The causative mutation was verified by a variation analysis of over 500 genes in the candidate gene region and an association analysis, performed using two populations segregating for Gmeny. Glyma.02G304700 (GmHY2a) is a homolog of AtHY2a in Arabidopsis thaliana, which encodes a PΦB synthase involved in the biosynthesis of phytochrome. A transcriptome analysis of Gmeny using the Kyoto Encyclopedia of Genes and Genomes (KEGG) revealed changes in multiple functional pathways, including photosynthesis, gibberellic acid (GA) signaling, and flowering time, which may explain the observed mutant phenotypes. Further studies on the function of GmHY2a and its homologs will help us to understand its profound regulatory effects on photosynthesis, photomorphogenesis, and flowering time.

1. Introduction

Light is the energy source for photosynthesis. Plants can perceive changes in light quality and intensity through photoreceptors and can respond to these environmental signals by regulating their photomorphogenesis, growth, and reproductive development. In general, under dense planting conditions, plants compete for light and grow tall, but also become spindly and prone to lodging. This response, known as the shade-avoidance syndrome [1], is induced by specific aspects of the light quality under shaded conditions. Red light (R) can be absorbed by the plants, but most far-red light (FR) is transmitted or reflected, resulting in a reduced R/FR ratio under dense planting. There are four main types of photoreceptors in plants: phytochromes (R and FR receptors), UVB receptors, cryptochromes (blue/UVA receptors), and phototropins [2].
Phytochrome apoproteins are encoded by a small multigene family, which comprises five members of Phytochromes (PHYA–PHYE) in Arabidopsis thaliana [3]. In general, phytochromes are proteins of around 125 kDa that exist in two forms: one form absorbs R (Pr, λmax = 660 nm) and the other absorbs FR (Pfr, λmax = 730 nm). Phytochromes are biosynthesized in the inactive Pr conformation and converted to the active Pfr conformation upon absorbing R. Pfr can be converted back to the Pr conformation by the absorption of FR, in a process called photoreversion. Reversion of Pfr to Pr can occur spontaneously in the dark (dark reversion) and is strongly influenced by temperature in both the light and the dark (thermal reversion) [3]. When a plant is exposed to R, the phytochrome changes from the inactive Pr to the biologically active Pfr and enters the nucleus from the cytoplasm. In the nucleus, Pfr interacts with phytochrome-interacting factors (PIFs) and the PHOTOMORPHOGENIC/DE-ETIOLATED/FUSCA (COP/DET/FUS) complex, thereby regulating the expression of genes involved in plant growth and development [2,3,4]. PHYA and PHYB play the most significant roles [3]. When grown under FR, phyA mutants display aberrant skotomorphogenesis (etiolation) [5], whereas under R and white light, phyB mutants show an elongated hypocotyl and reduced chlorophyll contents instead of the typical de-etiolation response [6].
Phytochromes detect light via a covalently bound linear tetrapyrrole chromophore (phytochromobilin; 3E-PΦB) and function as a dimer [7]. Each phytochrome apoprotein contains two modules, the N-terminal photosensory module (PSM) and the C-terminal module (CTM), connected by a hinge region [8]. The PSM is mainly responsible for the perception of light signals, while the CTM forms dimers to regulate the nuclear localization of the protein and transmit light signals to downstream components [8]. PΦB is biosynthesized in plastids by a series of enzymatic reactions, a pathway which shares a precursor (5-aminolevulinic acid; 5-ALA) with the biosynthesis of chlorophyll. Heme is converted by heme oxygenase (HO) into biliverdin IX (BV), which is then reduced to 3Z-PΦB by phytochromobilin synthase. 3Z-PΦB and its isomer 3E-PΦB are the functional precursors of the chromophore of phytochromes [9,10]. PΦB is transported into the cytoplasm, where it covalently binds to the cysteine residues of phytochrome apoproteins to form phytochrome holoproteins.
PΦB synthase is the last enzyme in the chromophore biosynthetic pathway and is a member of the ferredoxin-dependent bilin reductase (FDBR) family. Mutations in PΦB synthase affect the biosynthesis and function of the photochrome chromophore [10]. Kohchi et al. (2001) initially reported the long-hypocotyl mutation of the HY2 gene encoding PΦB synthetase in Arabidopsis [10]. Subsequently, abnormal PΦB synthase function was reported in various other species, including the pcd2 mutant in pea (Pisum sativum L.) [11], the se13 mutant in rice (Oryza sativa L.) [12], the elh1 mutant in cucumber (Cucumis sativus L.) [13], the Gmlin1 mutant in soybean [14], and the Mtpφbs mutant in alfalfa (Medicago truncatula) [15]. Studies have shown that chromophore-deficient mutants generally have a light green or yellowish leaf phenotype, accompanied by a reduction in chlorophyll. This can be attributed to the mutation of key enzymes in the PΦB biosynthesis pathway, which cause the accumulation of heme and inhibit the biosynthesis of 5-ALA in a regulatory feedback loop [16].
Phytochromes play important roles in the photoperiodic response of plants, with their disruption altering flowering or maturity times [14,17]. During photomorphogenesis, PIF3 and PIF4 interact with DELLA proteins, negative regulators of gibberellic acid (GA) signaling, highlighting the regulatory interactions between the light and GA pathways [18,19]. Under darkness, an increased GA content can release the inhibitory effect on PIF3 and PIF4 as GA can bind to and degrade DELLA proteins; under light, phyB in the nucleus inhibits GA signaling, allowing DELLA to interact with PIF3 and PIF4 and preventing the expression of downstream skotomorphogenesis genes [20,21].
Soybean (Glycine max (L.) Merrill) is an important crop that provides high-quality vegetable protein and oil for human and animal consumption [22]. In this study, we identified a soybean mutant, Gmeny, with elongated nodes and yellowing leaves. It was determined to have a decreased chlorophyll content and altered photosynthetic performance. Through the analysis of bulked DNA and RNA data using the BVF-IGV pipeline established in our laboratory, we established that a 10 bp deletion in the first exon of Glyma.02G304700, which was the causal mutation for Gmeny. Glyma.02G304700 encodes a PΦB synthase. A transcriptome analysis revealed altered gene expressions related to photosynthesis, GA signaling, and flowering time in the mutant, which may explain the observed physiological and phenotypical changes. Building on previous characterizations of this gene, we revealed that the variations in Glyma.02G304700 and its homologs can lead to profound changes in leaf color, chlorophyll, and the elongation of the hypocotyl and epicotyl. These insights open a new avenue for dissecting the complex regulatory network of GmHY2a in the control of vegetative and reproductive plant growth.

2. Results

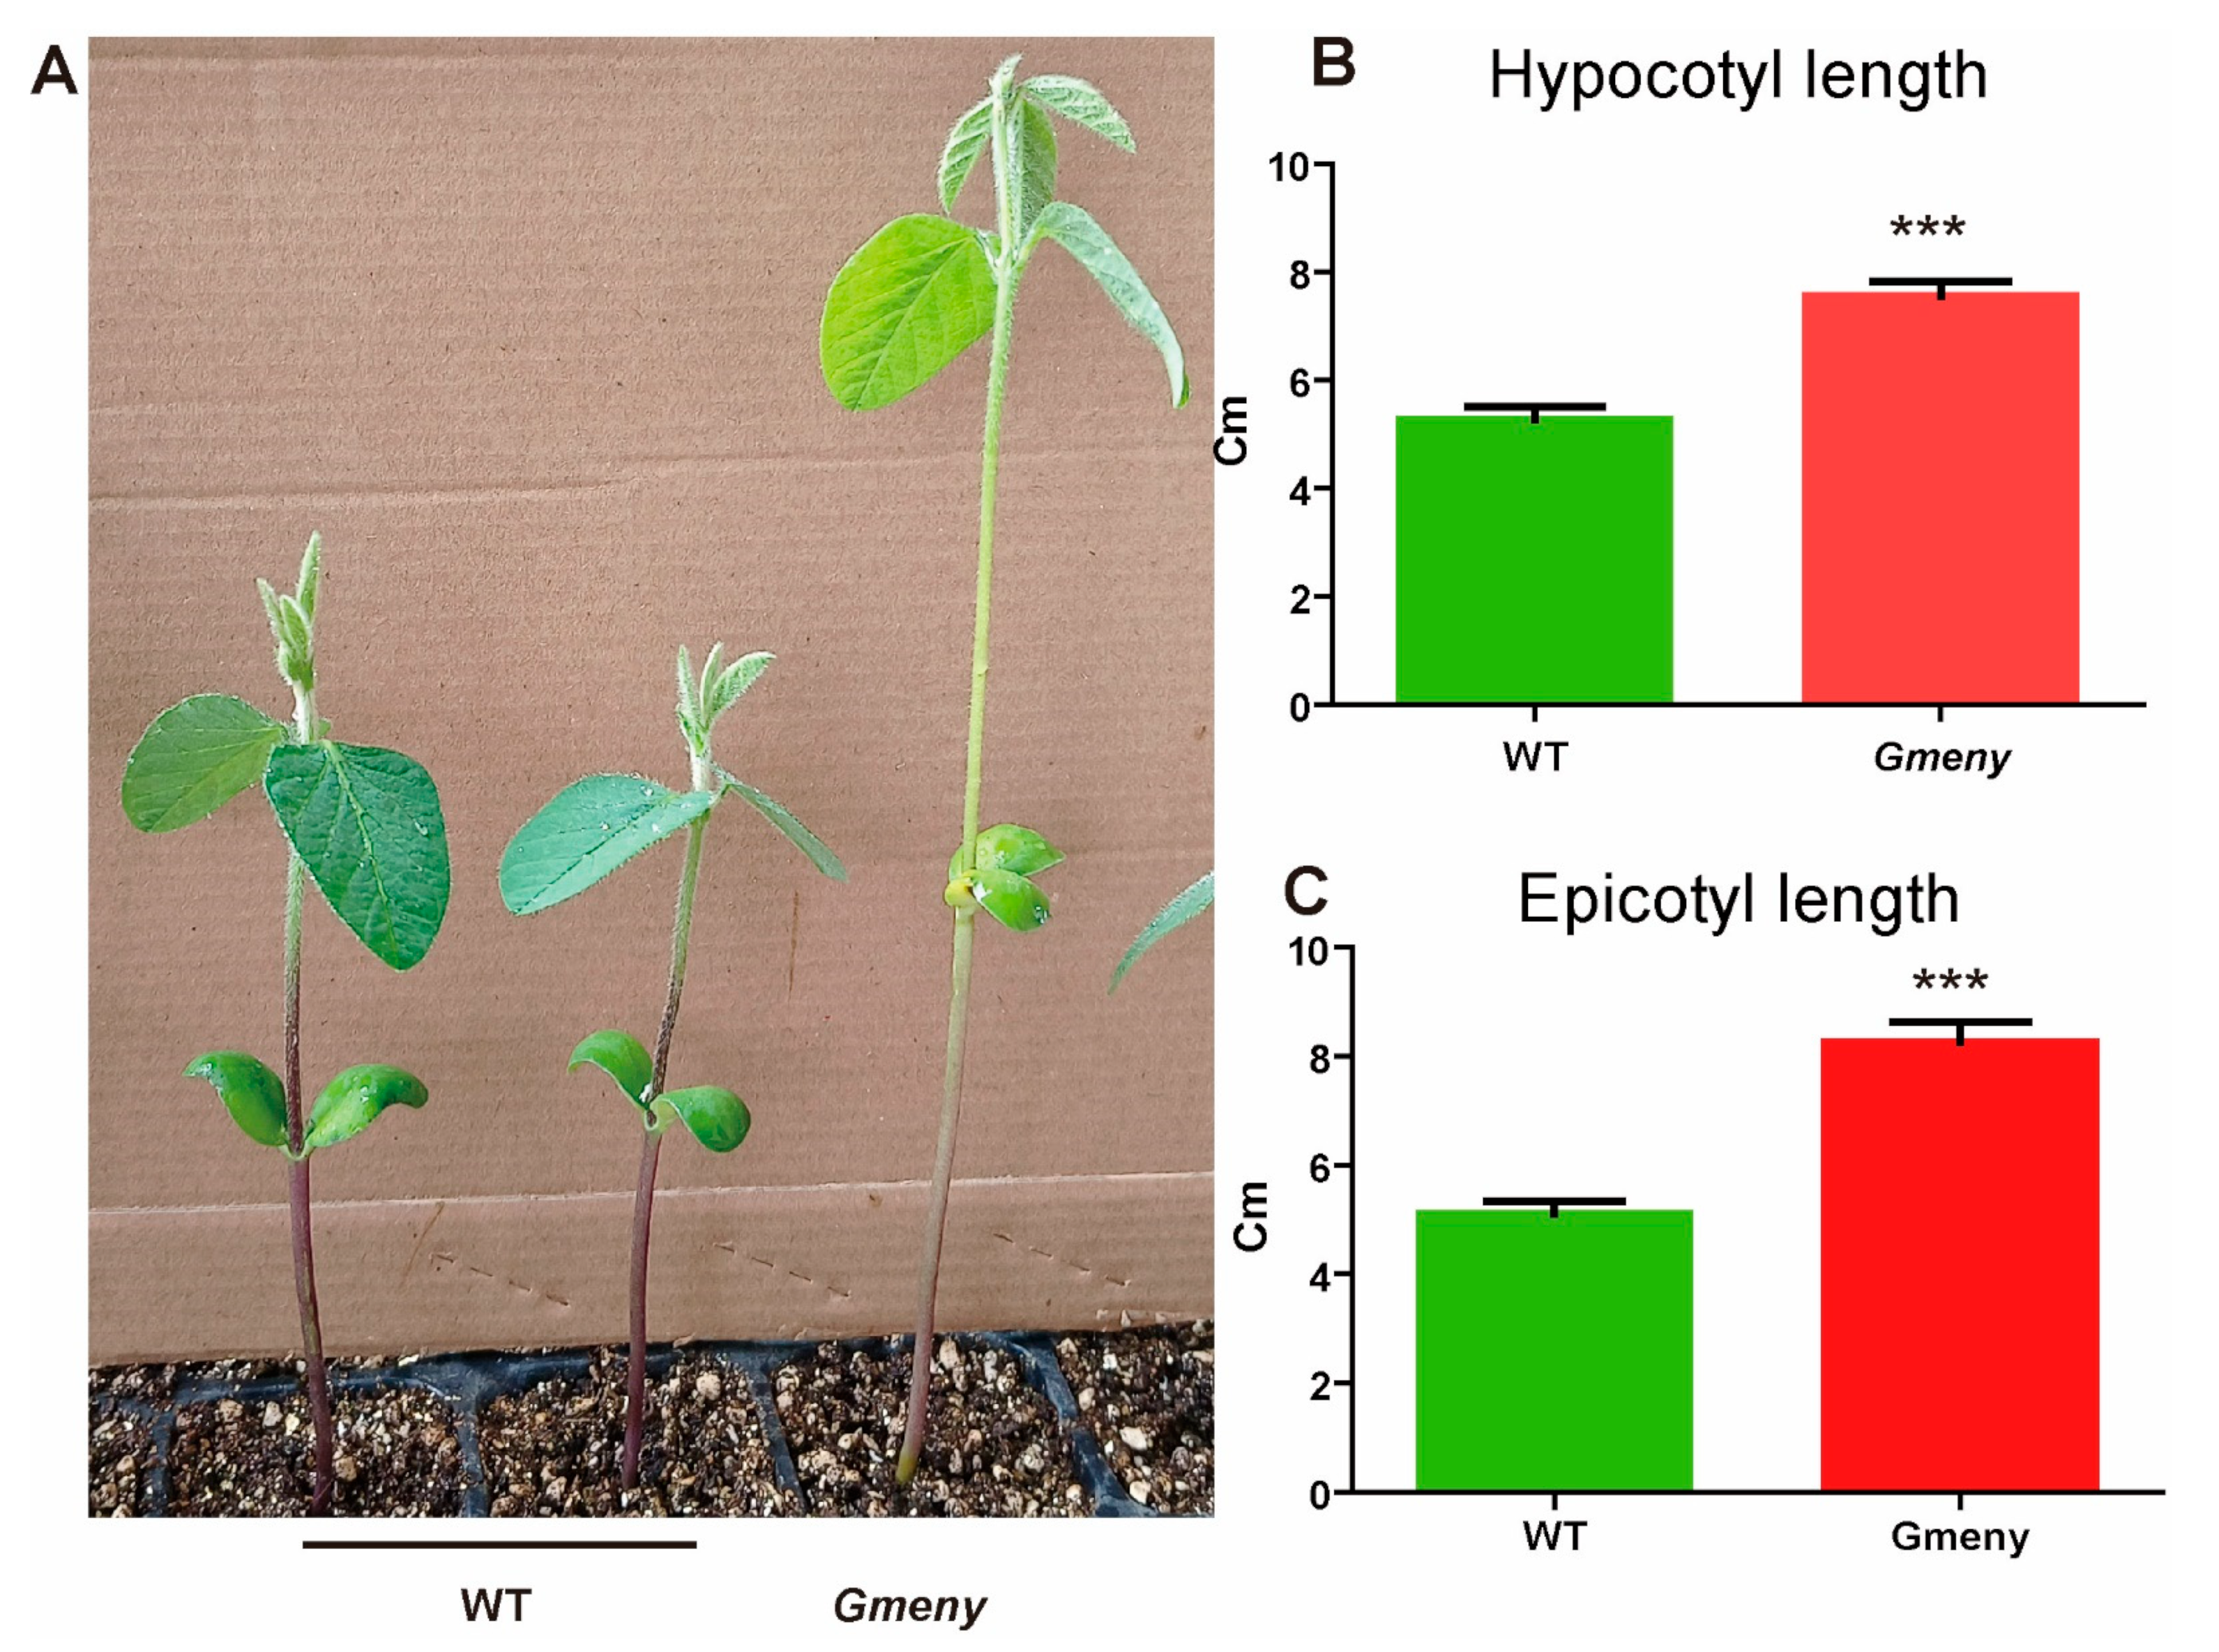
2.1. The Gmeny Mutant Displays Yellowing Leaves and Elongated Nodes

We generated a mutant library of the soybean cultivar “Dongsheng 7” using gamma ray (60Co) irradiation. Each line of the M3 population was derived from a single M2 plant. The line T372 showed segregation in leaf color and the hypocotyl and node lengths, with a total of 28 plants showing the WT phenotype and 12 plants displaying the mutant phenotype of yellowing leaves with elongated hypocotyl and nodes. These mutants were subsequently referred to as Gmeny. In M4, the four lines derived from Gmeny plants showed a homozygous Gmeny phenotype. Of the 10 lines derived from the WT plants, four showed homozygous WT phenotypes and six displayed segregation, with a total of 111 Gmeny plants and 361 WT phenotypes, fitting a 3:1 Mendelian segregation ratio for a single recessive gene. In the F2 population of Gmeny × Hefeng55, the segregation of 206 Gmeny plants and 675 WT plants is also consistent with the 3:1 Mendelian segregation ratio.
When grown in a greenhouse under natural sunlight, the Gmeny mutant displayed yellowing leaves and elongated nodes at the vegetative stage (Figure 1A). The hypocotyl length (7.550 ± 0.76 cm) and epicotyl length (8.261 ± 1.032 cm) of Gmeny were both significantly greater than those of the WT (5.259 ± 0.793 cm and 5.104 ± 0.739 cm) (Figure 1B,C). At the R2 stage in the natural field, Gmeny showed yellowing leaves when compared with the WT (Supplemental Figure S1A,B). Gmeny also matured about 10 days earlier than the WT plants (Supplemental Figure S1C). At the R8 stage, the node number on the main stem and the total number of pods per plant were both significantly lower in Gmeny than in the WT; however, Gmeny and WT displayed similar plant heights and effective branches (Supplemental Figure S1D–H). This inconsistency between the different growth characteristics could be attributed to Gmeny stopping vegetative growth prematurely but producing fewer but elongated epicotyl and basal nodes and an elongated hypocotyl.

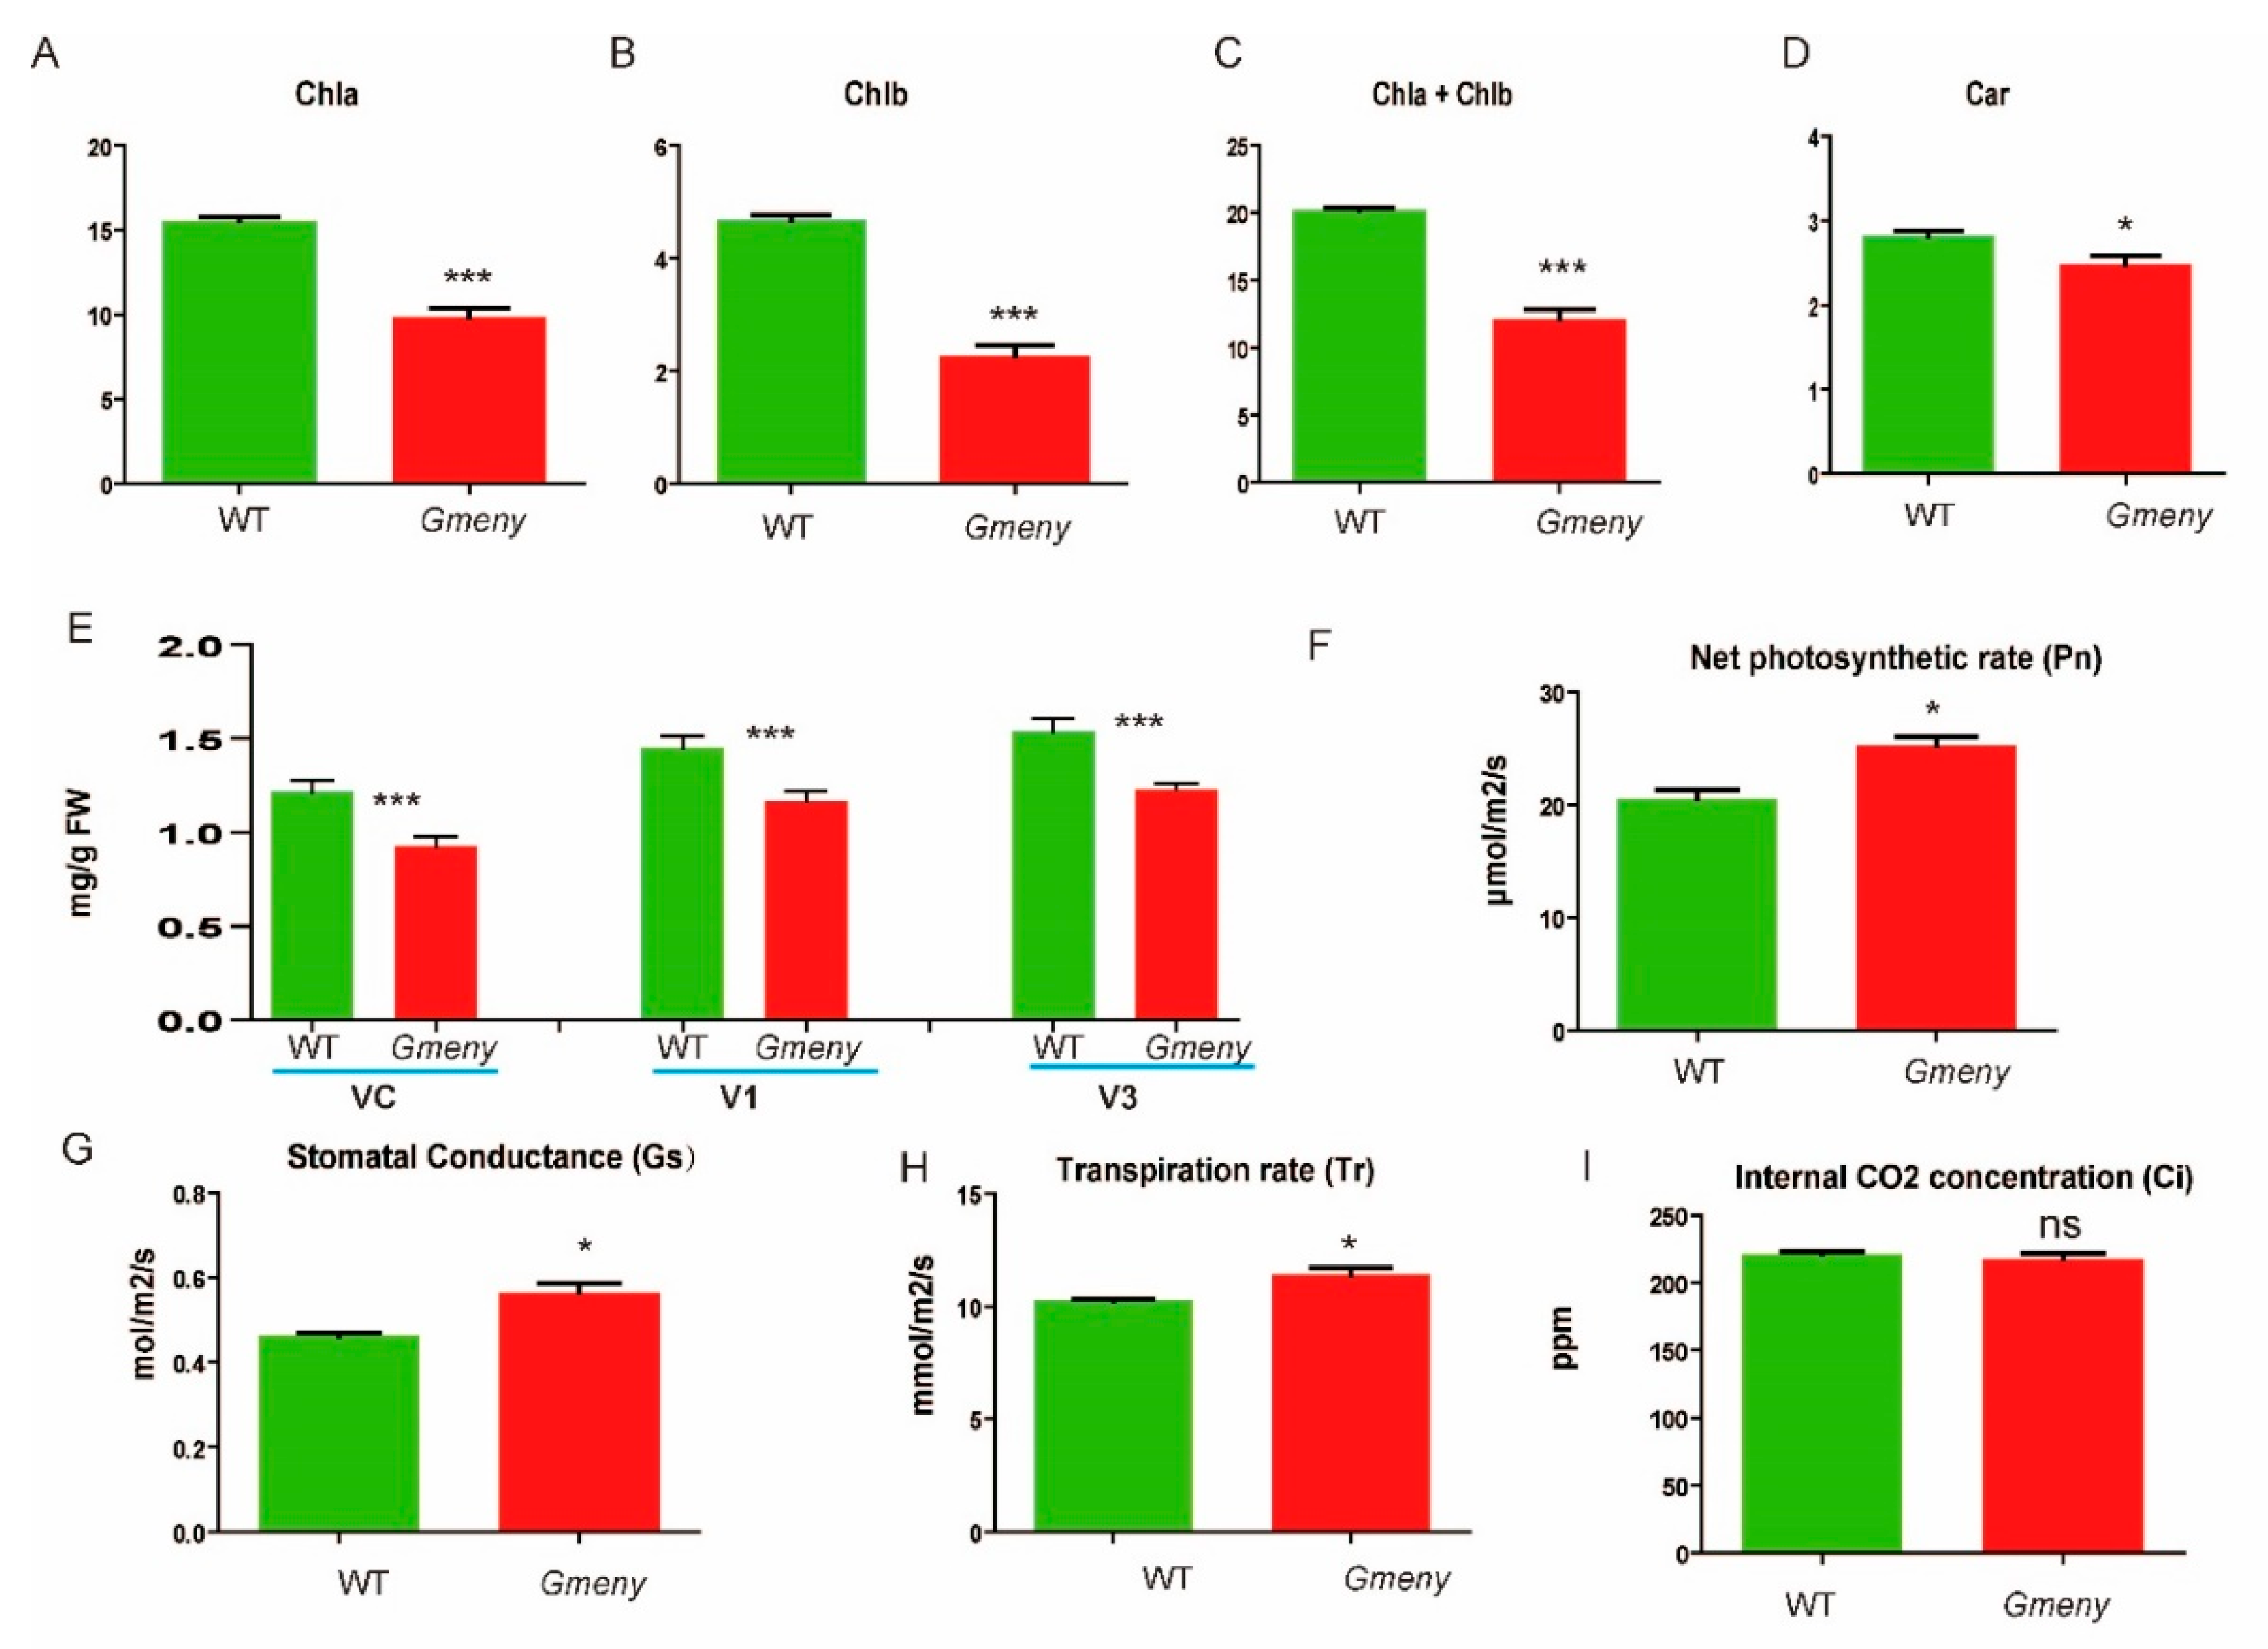
2.2. Yellowing Leaves of Gmeny Have Decreased Chlorophyll Contents and Changes in Photosynthetic Capacity

In the field, Gmeny leaves had significantly lower levels of chlorophyll a (9.854 ± 0.5190 mg/g of fresh weight), chlorophyll b (2.269 ± 0.182 mg/g), and chlorophyll a + chlorophyll b (12.12 ± 0.692 mg/g) than those of the WT plants (15.530 ± 0.245 mg/g, 4.668 ± 0.101 mg/g, and 20.20 ± 0.195 mg/g, respectively) at p < 0.001 (Figure 2A–C). In contrast, the carotenoid content (2.487 ± 0.0956 mg/g) in the leaves of Gmeny was lower than in the WT (2.813 ± 0.058 mg/g) (Figure 2D) at p < 0.05. Similarly, the total pigment content in Gmeny was consistently lower than that of the WT plants at three developmental stages (VC, V1, and V3) (Figure 2E).
The Gmeny leaf showed a significantly higher net photosynthetic rate (25.25 ± 0.800 μmol/m2/s) (Figure 2F), stomatal conductance (0.4634 ± 0.006 mol/m2/s) (Figure 2G), and transpiration rate (10.25 ± 0.098 mmol/m2/s) (Figure 2H) than the WT plants (20.54 ± 0.809 μmol/m2/s, 0.5644 ± 0.0225 mol/m2/s, and 11.430 ± 0.276 mmol/m2/s, respectively) at p < 0.05. In contrast, the mutant’s internal CO2 concentration of 221.4 (±1.739) ppm was not significantly different from that of the WT (217.4 ± 4.305 ppm) (Figure 2I).
In addition to the decreased chlorophyll content, transmission electron microscopy also revealed a noticeable difference in the chloroplast structure between the WT (Figure 2J–L) and the Gmeny plants (Figure 2M–O). The thylakoid membranes of the Gmeny chloroplasts were not as well organized as in the WT (Figure 2J,K,M,N). The lamellar structure of the Gmeny chloroplasts was dark, fuzzy, and had fewer layers when compared with that of the WT (Figure 2L,O). Taken together, these results demonstrate that the chloroplast structure in the Gmeny mutant was not fully developed or was disrupted, leading to profound changes in the photosynthetic parameters.

2.3. The BVF-IGV Pipeline Identified Glyma.02G304700 as the Candidate Gene for the Gmeny Phenotype

The initial analysis of the resequencing data using MutMap [23] is presented in Supplemental Figure S2. Due to the limitations of MutMap revealed in this study, BVF-IGV pipeline was subsequently used [24] (Figure 3). Two pools of genomic DNA were extracted from the leaves of 12 plants with the Gmeny mutant phenotype and 28 plants with the WT phenotype from the line Dongsheng T372. The 150 bp paired-end resequencing was performed on an Illumina platform at Annoroad Gene Technology (Beijing, China). For the Gmeny pool, the total number of reads was 234,497,694, the total number of bases in high-quality (HQ) reads was 34,446,549,900, and the total number of HQ bases in HQ reads was 33,382,537,952. For the WT pools, the total number of reads was 245,738,426, while the total number of HQ bases in HQ reads was 36,096,678,600.
We included only allelic variations annotated as a “missense variation” or “frameshift variation” in the first round of the analysis. A total of 32,869 allelic variations for the Gmeny bulk and 30,783 for the WT bulk were identified when compared with the V275 reference genome. By manipulating the VCF data in Excel, we eliminated the common allelic variations between the Gmeny and WT bulks, leaving 1427 loci (772 genes) specific to Gmeny and 983 loci (383 genes) specific to the WT. These genes were manually assessed individually or in batches by taking snapshots of each gene using the function “Run Batch Script” built into IGV. In our laboratory, this processing pipeline was named the BVF-IGV pipeline [24].
After an initial check, we identified a 10 bp deletion (47,983,485–47,983,494) in Glyma.02G204700, with the Gmeny bulk showing a homozygous deletion across all reads. The WT bulk displayed a heterozygous sequence, with the 10 bp deletion observed in an average of 9 reads of the 27–28 reads spanning the mutated region. This segregation pattern was in good accordance with the fact that half of the WT plants were heterozygous at Gmeny (Figure 3). Glyma.02G204700 was therefore considered a strong candidate gene for Gmeny based on using the BVF-IGV pipeline.
To validate the authenticity of the candidate gene, we examined the polymorphisms in the region of Glyma.02G204700 between Gmeny and the WT. This gene is situated close to the telomere of chromosome 2 and is located on the minus strand; therefore, we investigated 500 genes on the 3′ untranslated region side and all 76 genes on the 5′ UTR side. Although a few variants other than the 10 bp deletion in Glyma.02G204700 were detected using IGV, the segregation ratio among the reads of the variants between the Gmeny and WT bulks greatly deviated from the expected ratio. Furthermore, we analyzed the bulked RNA-seq data taken from the Gmeny and homozygous WT plants using the BVF-IGV pipeline. The variants in the candidate gene and other locations further supported the conclusion that Glyma.02G204700 is the mutated gene in the Gmeny mutant (Figure 3). Also, the 10 bp deletion in Gmeny was validated by performing PCR and sequencing the resulting products using the primer pairs listed in Supplemental Table S1.
We performed an association analysis using phenotype and genotyping data using the 10 bp deletion-derived Eny_HM1 and Eny_L1 primer pairs (Supplemental Table S1). To increase the genotyping efficiency, we bulked 10 plants with the Gmeny phenotype for genotyping either by direct PCR using the Eny_HM1 primer pair (Supplemental Table S1) or by sequencing PCR products amplified from the Eny_L1 primer pair. Of the 40 samples of the T372 line, all Gmeny plants possessed the 10 bp deletion genotype, while WT plants were either homozygous WT genotypes or heterozygous. In the M4 generation, all tested Gmeny plants, either from the homozygous Gmeny plants or from six segregation lines, demonstrated a homozygous 10 bp deletion genotype. Of the 361 WT plants tested, 90 showed a homozygous WT genotype, while 271 had heterozygous genotypes.
In the F2 population of Gmeny × Hefeng55, all 206 Gmeny plants possessed the 10 bp deletion, while of the 675 WT plants, 190 displayed homozygous WT genotypes and 485 plants were heterozygous.

2.4. Functional Prediction and Evolutionary Analysis of Glyma.02G204700 in Soybean

On the reference genome of Wm82.a2.v1, Glyma.02G304700 is situated between positions 47,976,140 and 47,983,615 on the reverse strand of chromosome 2. Glyma.02G304700 was functionally annotated as a GmHY2a gene encoding a 1.3.7.4 PΦB synthase with an FDBR domain (Wm82.a2.v1). The full length of Glyma.02G304700 is 7352 bp, including a 990 bp coding region which encodes 329 amino acids. Notably, Glyma.02G304800 is located from position 47,980,214 to position 47,980,782 on the forward strand of chromosome 2 and therefore overlaps Glyma.02G304700. Physically, Glyma.02G304800 is positioned within the fourth intron of Glyma.02G304700 on the opposite strand, but no polymorphism was observed in this region between Gmeny and the WT. The 10 bp deletion in the first exon of Glyma.02G304700 leads to a 12 amino acid change, including a deletion of nine amino acids, in the N-terminal of its protein in the Gmeny mutant compared with the WT protein (Figure 4A).
A phylogenetic analysis revealed two highly similar homologs of Glyma.02G304700 in soybean: Glyma.14G009100 (score of 307, similarity of 95.4%) and Glyma.14G136300 (score of 136, similarity of 85.4%). Several homologs were identified in other leguminous species, including Phvul.008G284200 (score of 551, similarity of 90.2%) from the common bean. In the model plants, highly homologous sequences were identified in Arabidopsis (AT3G09150; score of 354, similarity of 76.9%) and rice (LOC_Os01g72090; score of 332, similarity of 74.1%) (Figure 4B).
The changes in 3D structures between the Gmeny and WT Glyma.02G304700 protein can be clearly visualized when using the SWISS-MODEL online modeling server and PyMOL (Figure 4C,D).
Based on over 5000 RNA-seq data sets downloaded from http://soyatlas.venanciogroup.uenf.br (accessed on 26 December 2023), the three homologous genes Glyma.02G304700, Glyma.14G009100, and Glyma.14G136300 displayed constitutively high expression in all tissues, especially in the shoot, seedling, leaf, and reproductive tissues, such as the flower and seed pod (Figure 4E). The expression patterns of Glyma.02G304700 and Glyma.14G009100 among the different tissues were particularly similar.

2.5. Haplotypes of Glyma.02G204700

A total of 1308 genomic sequences from 1308 cultivars were subjected to a haplotype analysis [26,27]. The genomic variants corresponding to the putative coding region of Glyma.02G204800 were precluded. The resultant 10 single-nucleotide polymorphism (SNP) loci are listed in Supplemental Table S2. A haplotype possessed by two or more cultivars or accessions was retained for further analysis, resulting in 30 haplotypes (Supplemental Table S2).
According to the functional annotation, the C-to-T mutation at position 47,977,585 is the key allelic variation; the C-type haplotype was dominant in America (6/134), while the T-type haplotype is proportionally higher in Asia (319/982) and Europe (18/49), far higher than in America (6/131) (Supplemental Figure S3). Also, the nonsynonymous C-to-G mutation at position 47,977,626 was detected in only one cultivar, ZYD3938 (PI549017), of Asian origin (Supplemental Table S3). The other eight SNPs are 3′UTR synonymous variants or 5′UTR variants. Also, there was no significant correlation between haplotypes with different maturity groups (MGs) (Supplemental Table S4).

2.6. Transcriptome Analysis

We next extracted RNA from leaf samples of Gmeny and the wild type, and the RNA quality was presented in Supplemental Table S5. RNA-seq analysis was performed to explore the diversified molecular functions of Glyma.02G304700, using the RNA-seq workflow pipeline (https://github.com/twbattaglia/RNAseq-workflow, accessed on 1 May 2020) (Figure 3). We manually assessed the authenticity of the genotype at the Gmeny locus for each sample on the IGV.
Of a total of 40,235 non-zero read counts, 7945 genes (20%) were significantly upregulated and 7393 genes (18%) were significantly downregulated in the mutant relative to the WT. A total of 777 genes (1.9%) (adjusted p-value < 0.05) were classified as low counts, while 25 genes (0.062%) were outliers. We identified the differentially expressed genes (DEGs) displaying a two-fold difference in expression between the WT and the Gmeny mutant in V4-stage leaves using ClueGO. A gene ontology (GO) enrichment analysis of these DEGs revealed the enrichment of 53 functions (Supplemental Figure S4A), including zeatin biosynthesis (eight DEGs); phenylpropanoid biosynthesis (30 DEGs); cutin, suberin, and wax biosynthesis (12 DEGs); the AGE-RAGE signaling pathway in diabetic complications (seven DEGs); DNA replication (29 genes); and mismatch repair (12 genes). The networks between these molecular functions are presented in Supplemental Figure S4B.
To test the reliability of the RNA-seq data, a real-time qPCR was performed. Eight DEGs (Glyma.15G029500, Glyma.14G003200, Glyma.10G142600, Glyma.18G021500, Glyma.04G124300, Glyma.03G170300, Glyma.04G205600, and Glyma.11G003200) with putative functions in the GA signaling pathway and in photosynthesis were randomly selected. Glyma.15G029500, Glyma.03G170300, Glyma.04G205600, and Glyma.11G003200 were significantly upregulated in the Gmeny mutant, whereas the expression levels of Glyma.14G003200, Glyma.10G142600, Glyma.18G021500, and Glyma.04G124300 were significantly downregulated in comparison with the WT. The RT-qPCR results were consistent with the trends revealed by the RNA-seq analysis, demonstrating the reliability of the RNA-seq analysis (Figure 5A–H).
Given that changes in Glyma.02G304700 can lead to changes in leaf color and chlorophyll content, photosynthetic parameters, photomorphogenesis, and flowering time, we performed a detailed analysis of genes potentially involved in photosynthesis [28] and flowering time [29]. We used the 254 Chlamydomonas reinhardtii genes with potential functions in photosynthesis [28] as queries in a BLAST search of the soybean V275 genome, which led to the identification of 158 putative homologs. Of the 146 genes with a non-zero total read count, 39 were upregulated, including Glyma.20G210400 (RAA17), Glyma.17G052700 (CPL12), Glyma.13G106600 (CPL12), Glyma.07G027000 (PSR17), and Glyma.09G187800 (HCF101) (Figure 5I, Supplemental Table S6). In addition, 41 genes were downregulated, including Glyma.09G132300 (HCF101), Glyma.16G179200 (HCF101), and Glyma.17G205700 (PIIR1). Glyma.12G030800 (PIR2), Glyma.03G117500 (PIR3), Glyma.07G109600 (PIR3), Glyma.07G102100 (PSR15), Glyma.17G097200 (PSR15), Glyma.12G212000 (PSR17), Glyma.03G161300 (RAA12), and Glyma.04G193700 (RAA17) (Figure 5I, Supplemental Table S6).
Of the 701 potential flowering-related genes, including those involved in the GA pathway [29,30], 153 genes (22%) were downregulated in the mutant, such as those encoding TCP (TEOSINTE BRANCHED1, CYCLOIDEA, PCF) transcription factors, e.g., Glyma.10G285900 and Glyma.09G284300, and others encoding SPL (SQUAMOSA PROMOTER BINDING PROTEIN LIKE) transcription factors, e.g., Glyma.03G117600 and Glyma.19G146000 (Figure 5J, Supplemental Table S7). A further 141 genes (20%) were upregulated, e.g., Glyma.16G044100 (FT), Glyma.19G260900 (LHY), Glyma.01G023500 (SVP), Glyma.02G121600 (AP1), Glyma.13G052100 (AGL), and Glyma.09G149000 (AGL) (Figure 5J, Supplemental Table S7). These changes in flowering time-related genes might be the cause of the early flowering and maturation phenotype of Gmeny.
In addition, the upregulation of the PIF gene Glyma.18G115700 and GA-related genes Glyma.17G178300 (GA2ox8) and Glyma.04G211100 (GA20ox2) (Figure 5J, Supplemental Table S7) might be directly responsible for the elongated nodes during photomorphogenesis at the early vegetative growth stages.

3. Discussion

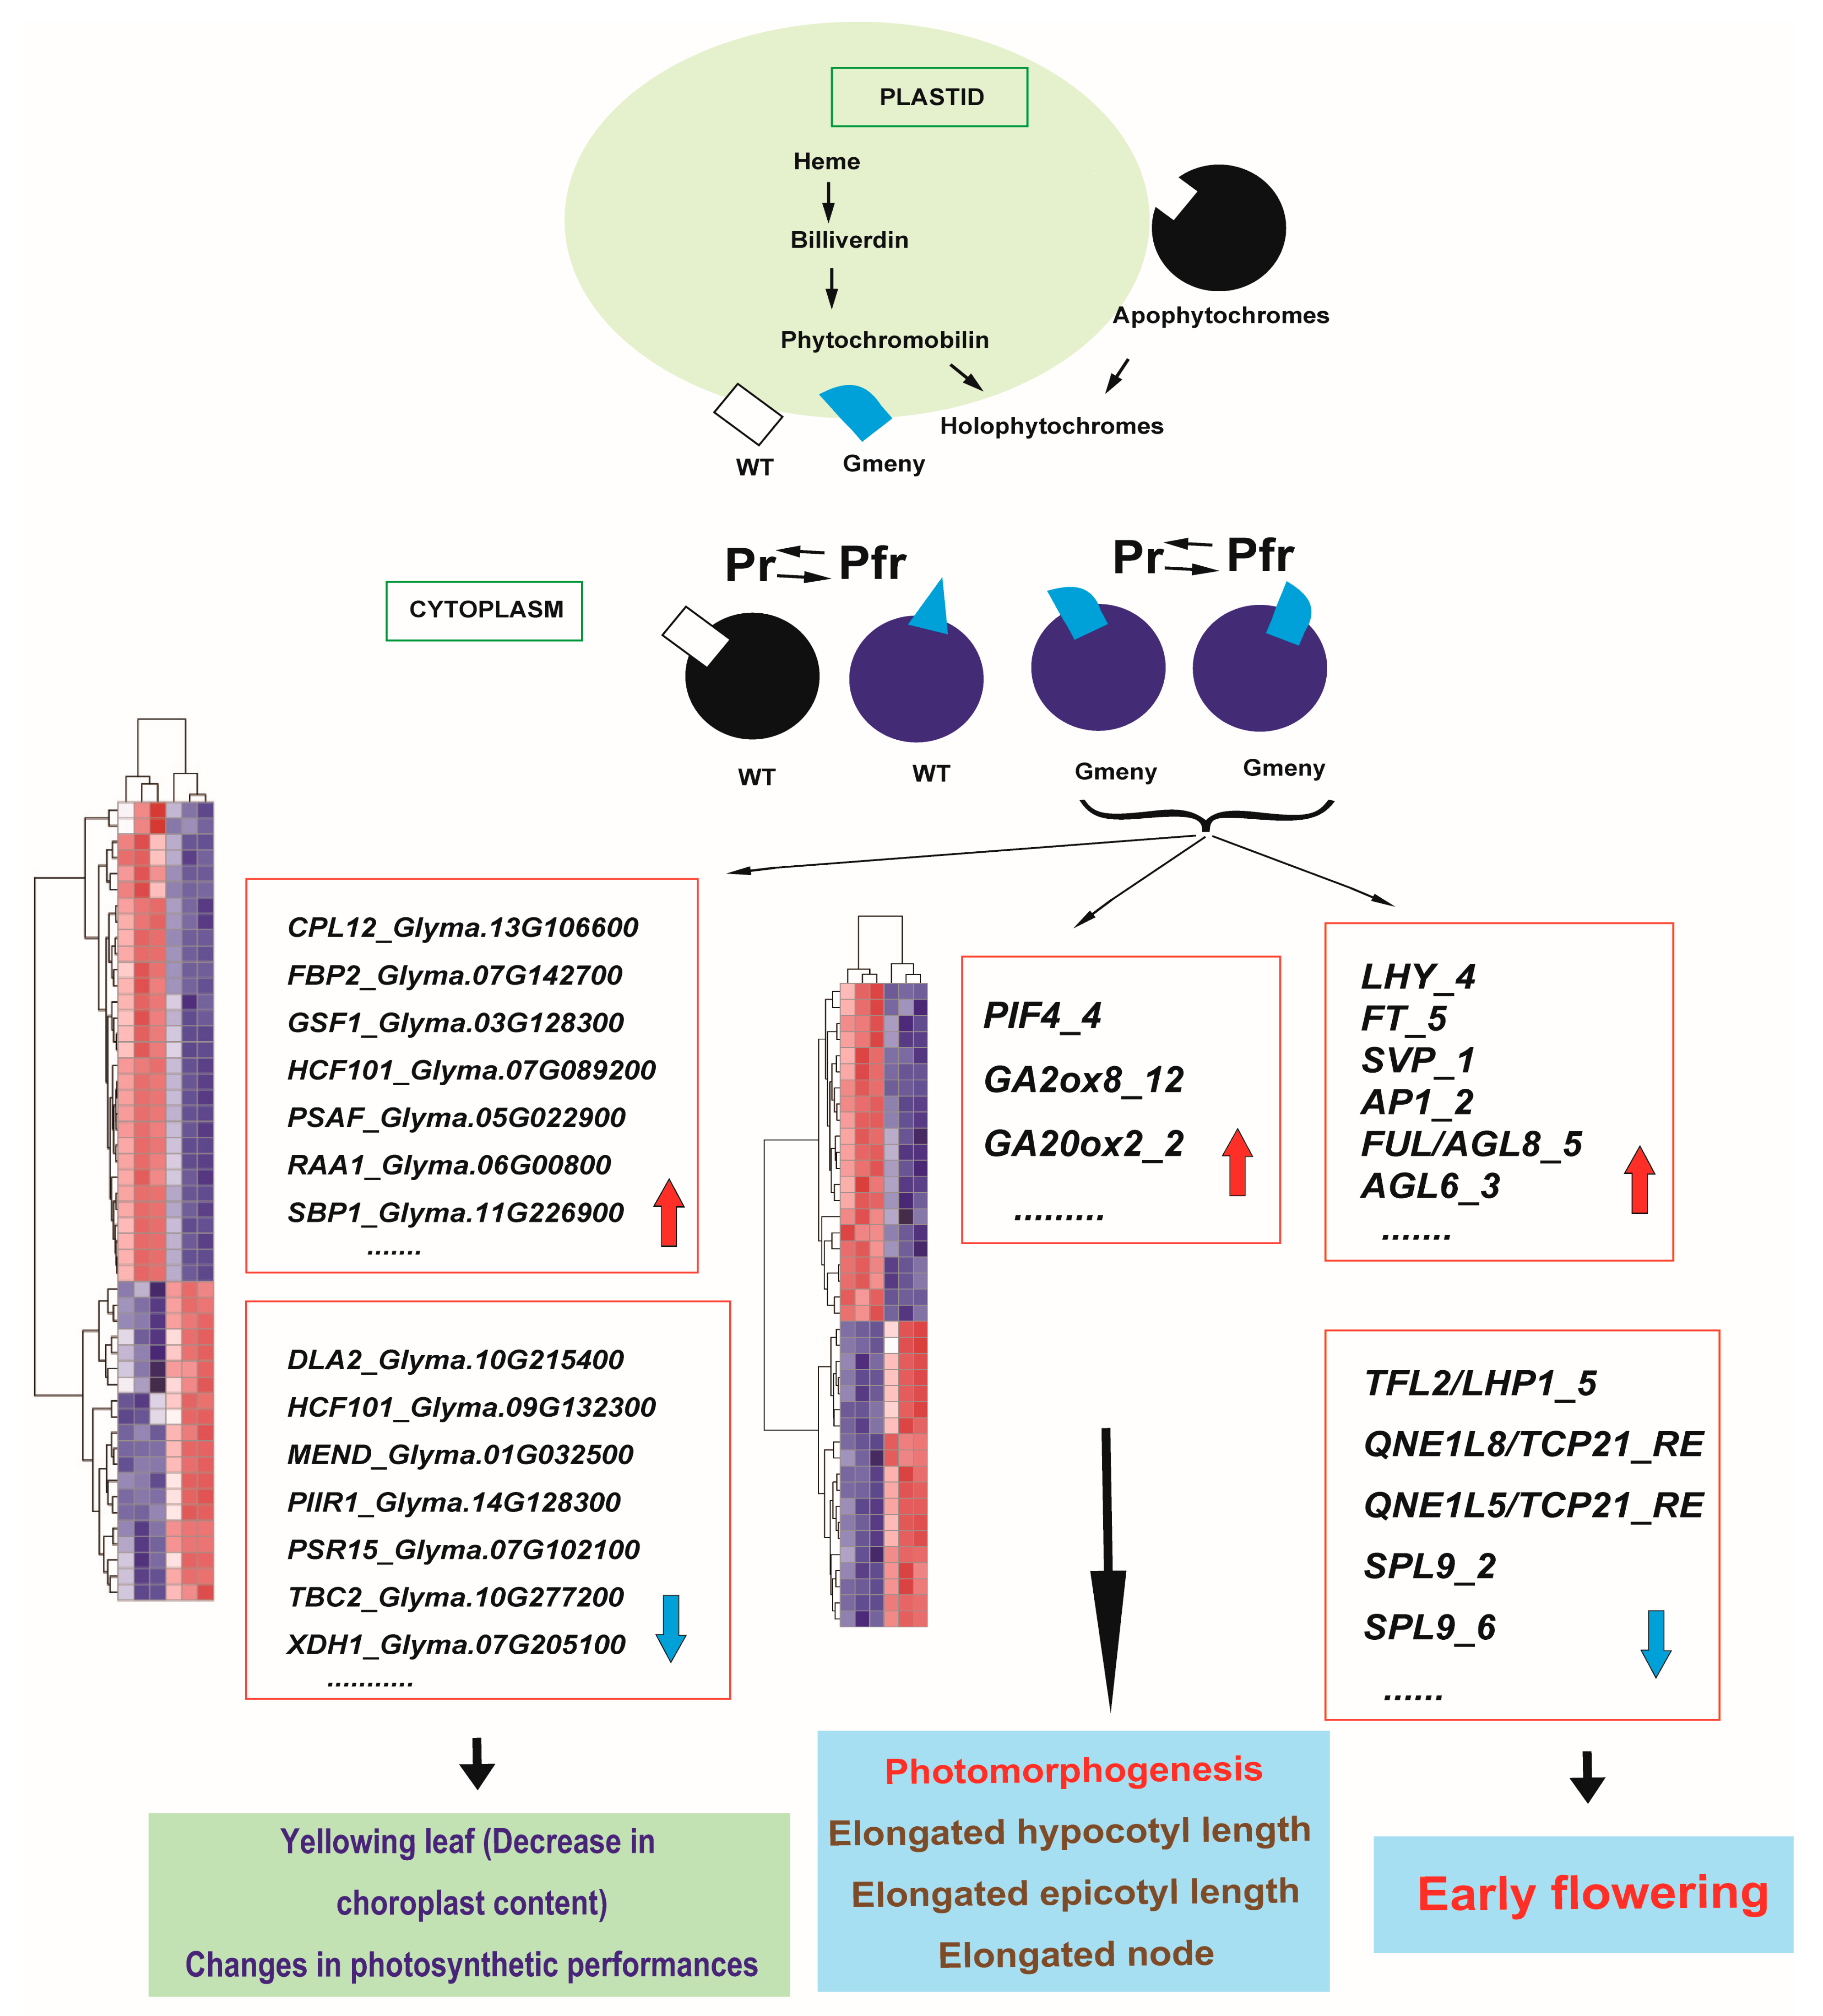
3.1. Mutation of a GmHY2a Gene Affects PΦB Biosynthesis, Inactivating the Photopigment System and Causing Diverse Changes in Photosynthesis, Photomorphogenesis, and Flowering Time

As shown in the transcriptome analysis, the mutation of the GmHY2a gene in Gmeny affects PΦB biosynthesis and consequently inactivates the entire photosensitive pigment system. The inactivation of phyB in particular stabilizes the PIFs, allowing them to bind to downstream target sites and exert their function. PIF1 regulates the expression of PROTOCHLOROPHYLLIDE OXIDOREDUCTASE (POR), FERROCHELATASE (FeChII), and HEME OXYGENASE (HO3) in the dark [31], while POR catalyzes the reduction of protochlorophyllide to chlorophyllide in magnesium branches under light. FeChII and HO3 catalyze the biosynthesis of heme from protoporphyrin IX and the conversion of heme to biliverdin IX-α in the iron branch, respectively (Figure 6). PIF3 inhibits the expression of Glu tRNA REDUCTASE (HEMA1), GENOMES UNCOUPLED 4 (GUN4), and Mg-CHELATASE SUBUNIT H (CHLH) [25,32]. HEMA1 is the rate-limiting enzyme for the catalysis of ALA biosynthesis, while GUN4 and CHLH promote the shunting of ALA into the chlorophyll biosynthesis pathway [33].
In this study, we identified putative photosynthesis-related genes that were downregulated in the Gmeny mutant, including Glyma.09G132300 (HCF101), Glyma.16G179200 (HCF101), Glyma.17G205700 (PIIR1), Glyma.12G030800 (PIR2), Glyma.03G117500 (PIR3), Glyma.07G109600 (PIR3), Glyma.07G102100, Glyma.17G097200 (PSR15), Glyma.12G212000 (PSR17), Glyma.03G161300 (RAA12), and Glyma.04G193700 (RAA17) (Figure 5I, Supplemental Table S6). These DEGs might be associated with the decrease in chlorophyll contents and changes in photosynthetic performance in the Gmeny mutant (Figure 6).
In addition, the inactivation of phyB stabilizes PIF3, PIF4, and PIF5, enabling them to bind and activate downstream genes, including the genes involved in promoting stem elongation [34]. PIF activity is also influenced by the negative regulators of the shade-avoidance response, such as LONG HYPOCOTYL IN FAR RED 1 (HFR1), PHYTOCHROME RAPIDLY REGULATED 1 (PAR1), and PAR2. These proteins inhibit the transcriptional activity of the PIFs by interacting with their DNA-binding domain [35,36]. Similarly, FAR-RED ELONGATED HYPOCOTYL 3 (FHY3) and FAR-RED IMPAIRED RESPONSE 1 (FAR1) have also been shown to interact with PIF5 and PIF3 as negative regulators of the shade-avoidance responses. They can also directly activate the expression of PAR1 and PAR2 to downregulate the shade-avoidance response [37].
DELLA proteins, key components in the GA signaling pathway, can interact with PIFs and affect their activity. The transcription factors B-BOX DOMAIN PROTEIN 24 (BBX24) and BBX25 can interact with DELLAs, preventing their interaction with PIF4 and thereby lifting the inhibition of PIF4 activity, which promotes GA-induced cell elongation [18,38]. CONSTITUTIVE PHOTOMORPHOGENIC 1 (COP1), a central suppressor of photomorphogenesis, can target and degrade the transcription activator HFR1 to maintain PIF stability [34]. BIN2 can mediate the phosphorylation and degradation of PIF3 and PIF5, while COP1 can maintain the stability of PIN3 and PIN5 by inhibiting BIN2 [34,39]. In addition, COP1 can directly regulate the stability of DELLA proteins in response to shade [40].
In this study, the PIF homolog Glyma.18G115700 and the GA-related genes Glyma.17G178300 (GA2ox8) and Glyma.04G211100 (GA20ox2) were upregulated in the Gmeny mutant (Figure 5J, Supplemental Table S7). This demonstrates that the mutation of the GmHY2a gene directly or indirectly affects the expression of key genes in the GA biosynthesis pathway, ultimately affecting the content of bioactive GA and possibly explaining the observed elongation of the hypocotyl and epicotyl in the Gmeny mutant.
The flowering time genes have been extensively studied since the successful cloning of the E1 gene [41]. The model E1–FT2a/5a–MDEs stands as the central model for the flowering time gene network [42]. In this study, the putative homolog of the key gene, FT5a (Glyma.16G044100), was upregulated in the leaves as early as the V4 stage. The LHY (Glyma.19G260900), SVP (Glyma.01G023500), AP1 (Glyma.02G121600), AGL homologs (Glyma.13G052100 and Glyma.09G149000) were also upregulated (Figure 5J, Supplemental Table S7). These genes have been demonstrated to be the florigen signal, which is produced in leaves and transmitted to the shoot apical meristem to initiate flowering [43]. Some of the downregulated genes, such as the TCP homologs (Glyma.10G285900 and Glyma.09G284300) and the SPL homologs (Glyma.03G117600 and Glyma.19G146000) (Figure 5J, Supplemental Table S7), might function as flowering repressors [29]. There were significant changes in the expression of E1b (Glyma.04G156400; log2FoldChange = −4.2075 at p = 0.006538). However, no significant changes were observed in the expression of the E1 and E1La putative homologs, which is slightly different from the previous report on the mutant of GmHY2a [14].
Notably, Glyma.02G304800 was identified on the opposite strand to Glyma.02G304700 within its fourth intron. We excluded the corresponding variants for the haplotype analysis as there was no polymorphism correlation between Gmeny, the WT, and Hefeng 55 at this region.
Based on the C-to-G nonsynonymous mutation at position 47,977,626 on chromosome 2, in the first exon of Glyma.02G304700, the cultivars from America were mainly Hap_1 (C type), while the proportion of T type was higher in Asia (319/982) and in Europe (18/49) (Supplemental Table S3). This phenomenon might be attributed to the fact that the American cultivars may have originated from C-type Chinese cultivars or landraces, while the modern cultivars in Europe may have originated from a T-type mutation in Asian cultivars. A rare variant, the C-to-T mutation at position 47,977,585, was present only in the cultivar ZYD3938 (PI549017) of Asian origin (Supplemental Table S2).
Other than a few cultivars or accessions from Africa and Australia (Supplemental Figure S3A, Supplemental Table S3), a total of 999 cultivars from Asia were analyzed, and these displayed a diverse distribution of almost all haplotypes. A total of 49 cultivars were from Europe: 31 were Hap_1, 16 were Hap_2, 1 was Hap_3, and 1 was Hap_13. Of the 137 cultivars from America, 123 were Hap_1, 5 were Hap_2, and 9 were distributed among the other seven haplotypes (Supplemental Figure S3A, Supplemental Table S3).
Because we do not have data relating to chlorophyll content or photosynthetic parameters for all cultivars, we cannot assess the effects of the different haplotypes or specific allelic variations on these phenotypes; however, the functional effects of these variations on photosynthesis, photomorphogenesis, and flowering time would certainly warrant further investigation.

3.2. The BVF-IGV Pipeline Is Capable of Identifying the Causal Mutation for the Gmeny Mutant in One Step

The BVF-IGV pipeline was established in our lab and was used to successfully identify the causal mutations [24]. Initially, we also used MutMap to analyze our bulk resequencing data, but it yielded too many peaks spanning a relatively large genomic region [23]. One such peak was detected at the end of chromosome 2, where Glyma.02G304700 is located. It would have been difficult to identify the candidate gene solely using MutMap as assessing each individual peak is time-consuming. With the BVF-IGV pipeline, we successfully identified Glyma.02G304700 as the candidate gene for Gmeny. The authenticity of the candidate gene was verified by an examination of the variants between WT and Gmeny and an association study using the heterozygous Gmeny-derived segregating populations of the M3 and M4 generations, as well as using F2 populations derived from a cross of Gmeny × Hefeng55. In this study, we used bulk sequence data at both the DNA and RNA levels in the BVF-IGV pipeline, the results of which could be verified. The BVF-IGV pipeline may therefore facilitate gene cloning in mutant libraries, recombinant inbred line populations, or near-isogenic isoclines, especially in segregating populations.
Taken together, we confirmed that a 10 bp deletion in the first exon of GmHY2a is the leading causal factor for the hypocotyl elongation, early maturation, and changes in photosynthetic performance observed in the Gmeny mutant, due to its altered regulation of the expression of genes involved in photosynthesis, GA signaling, and flowering time. This study extends our knowledge of how FDBRs affect the biosynthesis and function of the phytochrome chromophore.

4. Materials and Methods

4.1. Mutant Library Generation and Phenotyping

Two mutant libraries were constructed by the 60Co-γ-ray-induced mutagenesis of a modern soybean cultivar, “Dongsheng 7”, from Northern China. Each line of the third generation of the mutant population (M3) derived from a single self-pollinated M2 plant was grown in the field for phenotypic observation. The mutant with elongated nodes and yellowing leaves was defined as Gmeny. The line T372 exhibited a distinct segregation between Gmeny and the wild type (WT).

4.2. Measurement of Photosynthetic Pigments and Parameters

New fully expanded leaves of the Gmeny mutant and “Dongsheng 7” were collected at three growth stages: the cotyledon stage (VC), the first trifoliolate stage (V1), and the third trifoliolate stage (V3). Three replicates of approximately 0.2 g of leaf tissue were steeped in 80% acetone for two days to extract the photosynthetic pigments. The total photosynthetic pigment content was determined using a UV/VIS spectrophotometer [44,45]. The contents of chlorophyll a, chlorophyll b, and carotenoid were also measured using a spectrophotometer, according to the previously described protocol [46], with slight modifications. The equations for the calculation of photosynthetic pigments were chlorophyll a (mg/L) = 9.784 OD663 − 0.990 OD645; chlorophyll b (mg/L) = 21.426 OD645 − 4.650 OD663; and carotenoids (mg/L) = 4.695 OD440 − 0.268 (chlorophyll a + chlorophyll b). The final contents were expressed as unit of mg/g of fresh weight.
The photosynthetic parameters (e.g., net photosynthetic rate, stomatal conductance, transpiration rate, and internal CO2 concentration) were measured from the third leaf down from the top of the Gmeny and “Dongsheng 7” plants at the V7 stage using the LI-COR 6800 Portable Photosynthesis System (LI-COR Biosciences, Lincoln, NE, USA), as described by Zhang et al. [47].

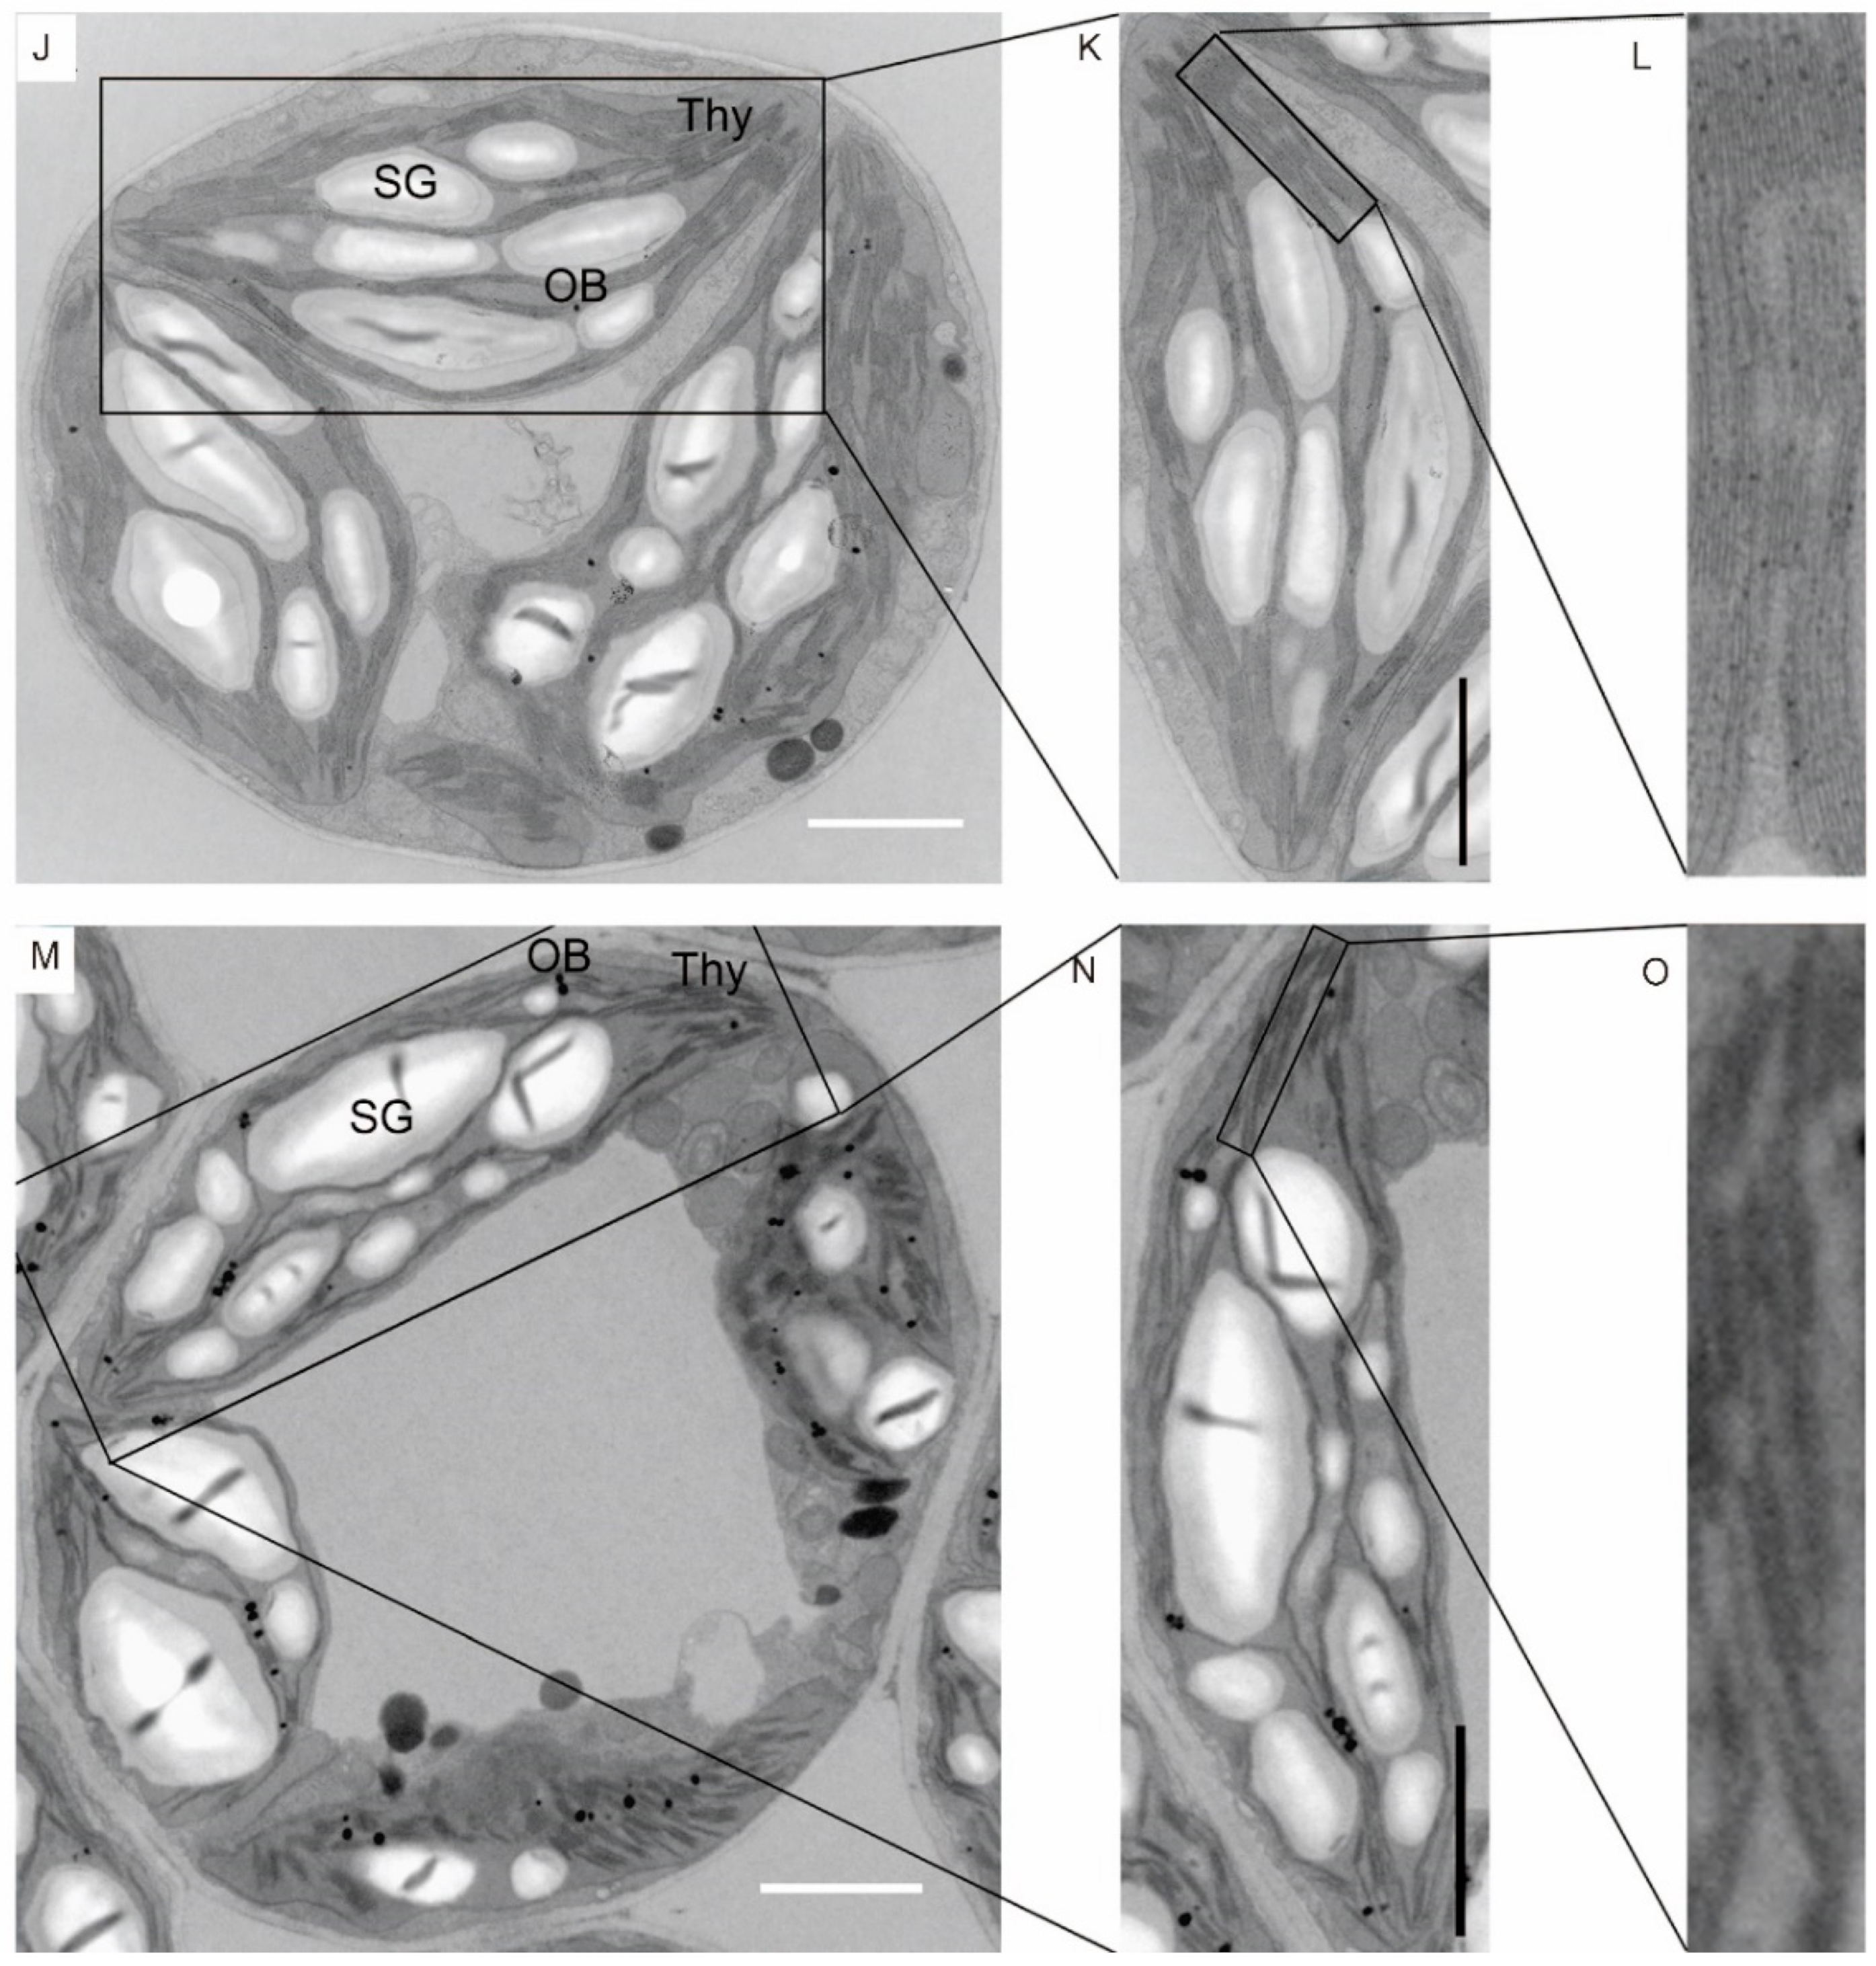
4.3. Transmission Electron Microscopy

An H-7650 transmission electron microscope (Hitachi, Tokyo, Japan) was used to investigate the ultrastructure of the chloroplast [48,49]. The leaf samples were collected from the same node of the Gmeny and “Dongsheng 7” plants at 20 days after germination in an experimental field in Harbin, Heilongjiang Province, China (45°41′ N, 126°38′ E).

4.4. Identification of the Causal Gene Using MutMap and BVF-IGV

The M3 generation of the T372 line was separated into two groups (bulks) based on phenotype. The mutant bulk comprised 12 Gmeny plants, while the WT bulk contained 28 WT plants. The genomic DNA and RNA of each bulk were extracted from leaf tissues of plants of the same size, and these samples were resequenced on an Illumina (San Diego, CA, USA) platform at Annoroad Gene Technology (Beijing, China). The reads were quality-trimmed using the NGS QC Toolkit (version 2.3.3) with default parameters [50]. The sequences of the two bulks were used to identify a causal region or peak using MutMap software with the default parameters [23]. Due to the limitations of MutMap revealed in this study, a manual BVF-IGV pipeline was subsequently developed, consisting of bulk sequencing, variant calling, functional annotation by SnpEFF, and batch integrative genomics viewer (IGV) observation for the identification of candidate genes [24] (Figure 3).
After the reads were quality-trimmed using the NGS QC Toolkit, the bulk sequences of the Gmeny mutants and WT plants were aligned to the reference genome Gmax_275_Wm82.a2.v1 (V275) using SpeedSeq [51]. Variants were obtained from BAM files using GATK version 2.3-3 with the parameters -stand_emit_conf 10 and -stand_call_conf 30. The VCF file was filtered using the FilterVcf function with parameters MIN_AB = 0.8, MIN_DP = 6, MIN_GQ = 0, and MIN_QD = 2. The resulting VCF file was functionally annotated using SnpEFF with default parameters [52] (Figure 3).

4.5. Generation of the F2 Population and Association Analysis

To verify the identification of the causal gene underlying the Gmeny mutation performed using BVF-IGV, Gmeny was crossed with Hefeng 55 to generate a segregating population. The segregation ratio of the Gmeny and WT phenotypes was analyzed, and association studies between the phenotype and genotype were conducted to confirm the causal mutation.

4.6. Multiple-Sequence Alignment and Phylogenetic Analysis

Proteins encoded by homologs of Glyma.02G304700 (used as a query) were identified in the Phytozome database (http://www.phytozome.net, accessed on 12 December 2023) for various plant species, including Arabidopsis thaliana, rice, common bean (Phaseolus vulgaris L.), Medicago truncatula, mung bean (Vigna radiata (L.) R. Wilczek), bitter blue lupin (Lupinus micranthus Guss.), and soybean. Multiple-sequence alignments of the amino acid sequences for the PΦB synthase proteins were performed using ClustalX (version 2.0.9) [53], and the phylogenetic tree was constructed in MEGA 7.0 using the neighbor-joining method [54].

4.7. Haplotype Analysis

A total of 1308 genomic sequences from 1308 cultivars were included in this analysis [26,27]. All variants within the Glyma.02G304700 gene region were retrieved first. A relatively large proportion of SNPs corresponding to Glyma.02G304800 were located on the plus strand of the fourth intron of Glyma.02G304700 were excluded before further analysis. Haplotypes were classified based on the variation profiles of 10 SNP loci. The geographic origin and proportion of the haplotypes were visualized using Popart (version 1.7) [55].

4.8. RNA Sequencing and Transcriptome Analysis

Leaf samples were collected from the same node of “Dongsheng 7” and Gmeny for transcriptome sequencing. Three replicates of each genotype were sent to Annoroad Gene Technology Corporation (Beijing, China) for RNA sequencing (RNA-seq). The RNA-seq data were analyzed through the RNA-seq workflow pipeline (https://github.com/twbattaglia/RNAseq-workflow, accessed on 1 May 2020) against the soybean reference genome (V275 of Wm82.a2.v1; https://phytozome-next.jgi.doe.gov, accessed on 23 April 2016). The differential gene expressions (DGEs) were further analyzed using ClueGo and cytoHubba to annotate their molecular functions [56,57], and the enriched functional pathways were visualized using Cytoscape version 3.9.1 [58].

4.9. Quantitative RT-PCR

A quantitative RT-PCR (qRT-PCR) analysis was performed to validate the RNA-seq results. The total RNA was extracted from the different tissues using an OmniPlant RNA Kit (DNase I) (CW25985; CWBIO, Taizhou, Jiangsu, China). A total of 500 ng of RNA was subjected to reverse transcription using TransScript One-Step gDNA Removal and cDNA Synthesis SuperMix (AT311-03; TransGen Biotech, Beijing, China). TransStart Top Green qPCR SuperMix (AQ131-04; TransGen Biotech) was used for the qRT-PCR analysis. The qRT-PCR reaction was performed on a LightCycler 96 (Roche, Basel, Switzerland). The measured Ct values were converted to relative copy numbers using the −∆∆Ct method [59].

4.10. Statistical Analysis

The Student t-test, analysis of variance (ANOVA), and chi-square test were performed using GraphPad Prism version 9.5.1 (GraphPad, San Diego, CA, USA).

Supplementary Materials

The following supporting information can be downloaded at: https://www.mdpi.com/article/10.3390/ijms25126483/s1.

Author Contributions

Conceptualization, Z.X.; methodology, W.Z. (Wei Zhang); investigation, X.Z., H.W., Y.L., D.R., F.W., Y.G., W.Z. (Weiyu Zhong) and Y.Z.; resources, X.C. and H.Q., Writing—original draft preparation, X.Z.; writing—review and editing, Z.X.; visualization, S.W.; funding acquisition, Z.X. All authors have read and agreed to the published version of the manuscript.

Funding

This work was supported by the Intergovernmental International Science, Technology, and Innovation Cooperation Key Project (Project No. 2022YFE0130300) of the National Key R&D Program (NKP), by the Natural Science Foundation of Heilongjiang Province of China (JQ2022C005), by grants (U21A20215 and 32272094) from the National Natural Science Foundation of China, and by the Strategic Priority Research Program (XDA24010105-4 and XDA28070404) from the Chinese Academy of Sciences.

Institutional Review Board Statement

Not applicable.

Informed Consent Statement

Not applicable.

Data Availability Statement

The original contributions presented in this study are publicly available. The raw sequence data reported in this article have been deposited in the Genome Sequence Archive (Genomics, Proteomics & Bioinformatics 2021) at the National Genomics Data Center (Nucleic Acids Res 2021), China National Center for Bioinformation/Beijing Institute of Genomics Chinese Academy of Sciences (subPRO037650), and are publicly accessible at https://ngdc.cncb.ac.cn/gsa (accessed on 26 December 2023).

Conflicts of Interest

The authors declare that the research was conducted in the absence of any commercial or financial relationships that could be construed as potential conflicts of interest.

References

  1. Lashkari, M.; Madani, H.; Ardakani, M.R.; Golzardi, F.; Zargari, K. Effect of plant density on yield and yield components of different corn (Zea mays L.) hybrids. Educ. Manag. Adm. Leadersh. 2011, 10, 450–457. [Google Scholar] [CrossRef] [PubMed]
  2. Casal, J.J. Photoreceptor Signaling Networks in Plant Responses to Shade. Annu. Rev. Plant Biol. 2013, 64, 403–427. [Google Scholar] [CrossRef] [PubMed]
  3. Wang, H.Y. Signaling Mechanisms of Higher Plant Photoreceptors: A Structure-Function Perspective. Curr. Top. Dev. Biol. 2005, 68, 227–261. [Google Scholar] [PubMed]
  4. Jing, Y.J.; Lin, R.C. Transcriptional Regulatory Network of the Light Signaling Pathways. New Phytol. 2020, 227, 683–697. [Google Scholar] [CrossRef] [PubMed]
  5. Whitelam, G.C.; Johnson, E.; Peng, J.R.; Carol, P.; Anderson, M.L.; Cowl, J.S.; Harberd, N.P. Phytochrome a Null Mutants of Arabidopsis Display a Wild-Type Phenotype in White Light. Plant Cell 1993, 5, 757–768. [Google Scholar] [PubMed]
  6. Reed, J.W.; Nagpal, P.; Poole, D.S.; Furuya, M.; Chory, J. Mutations in the Gene for the Red Far-Red Light Receptor Phytochrome B Alter Cell Elongation and Physiological Responses throughout Arabidopsis Development. Plant Cell 1993, 5, 147–157. [Google Scholar] [PubMed]
  7. Burgie, E.S.; Vierstra, R.D. Phytochromes: An Atomic Perspective on Photoactivation and Signaling. Plant Cell 2014, 26, 4568–4583. [Google Scholar] [CrossRef] [PubMed]
  8. Legris, M.; Ince, Y.Ç.; Fankhauser, C. Molecular Mechanisms Underlying Phytochrome-Controlled Morphogenesis in Plants. Nat. Commun. 2019, 10, 5219. [Google Scholar] [CrossRef] [PubMed]
  9. Terry, M.J.; Wahleithner, J.A.; Lagarias, J.C. Biosynthesis of the Plant Photoreceptor Phytochrome. Arch. Biochem. Biophys. 1993, 306, 1–15. [Google Scholar] [CrossRef]
  10. Kohchi, T.; Mukougawa, K.; Frankenberg, N.; Masuda, M.; Yokota, A.; Lagarias, J.C. The Arabidopsis HY2 Gene Encodes Phytochromobilin Synthase, a Ferredoxin-Dependent Biliverdin Reductase. Plant Cell 2001, 13, 425–436. [Google Scholar] [CrossRef]
  11. Weller, J.L.; Murfet, I.C.; Reid, J.B. Pea Mutants with Reduced Sensitivity to Far-Red Light Define an Important Role for Phytochrome a in Day-Length Detection. Plant Physiol. 1997, 114, 1225–1236. [Google Scholar] [CrossRef] [PubMed]
  12. Yoshitake, Y.; Yokoo, T.; Saito, H.; Tsukiyama, T.; Quan, X.; Zikihara, K.; Katsura, H.; Tokutomi, S.; Aboshi, T.; Mori, N.; et al. The Effects of Phyto-chrome-Mediated Light Signals on the Developmental Acquisition of Photoperiod Sensitivity in Rice. Sci. Rep. 2015, 5, 7709. [Google Scholar] [CrossRef]
  13. Hu, L.L.; Liu, P.; Jin, Z.S.; Sun, J.; Weng, Y.Q.; Chen, P.; Du, S.L.; Wei, A.M.; Li, Y.H. A mutation in CsHY2 encoding a phytochromobilin (PΦB) synthase leads to an elongated hypocotyl 1 (elh1) phenotype in Cucumber (Cucumis sativus L). Theor. Appl. Genet. 2021, 134, 2639–2652. [Google Scholar] [CrossRef]
  14. Zhang, Z.R.; Yang, S.X.; Wang, Q.S.; Yu, H.; Zhao, B.F.; Wu, T.; Tang, K.Q.; Ma, J.J.; Yang, X.J.; Feng, X.Z. Soybean Gmhy2a Encodes a Phytochromobilin Synthase That Regulates Internode Length and Flowering Time. J. Exp. Bot. 2022, 73, 6646–6662. [Google Scholar] [CrossRef] [PubMed]
  15. Perez-Santangelo, S.; Napier, N.; Robson, F.; Weller, J.L.; Bond, D.M.; Macknight, R.C. A Point Mutation in Phytochromobilin synthase Alters the Circadian Clock and Photoperiodic Flowering of Medicago truncatula. Plants 2022, 11, 239. [Google Scholar] [CrossRef]
  16. Terry, M.J.; Kendrick, R.E. Feedback inhibition of chlorophyll synthesis in the phytochrome chromophore-deficient aurea and yellow-green-2 mutants of tomato. Plant Physiol. 1999, 119, 143–152. [Google Scholar] [CrossRef]
  17. Xiong, S.S.; Guo, D.D.; Wan, Z.; Quan, L.; Lu, W.T.; Xue, Y.G.; Liu, B.H.; Zhai, H. Regulation of Soybean Stem Growth Habit: A Ten-Year Progress Report. Crop J. 2023, 11, 1642–1648. [Google Scholar] [CrossRef]
  18. De Lucas, M.; Davière, J.M.; Rodríguez-Falcón, M.; Pontin, M.; Iglesias-Pedraz, J.M.; Lorrain, S.; Fankhauser, C.; Blázquez, M.A.; Titarenko, E.; Prat, S. A Molecular Framework for Light and Gibberellin Control of Cell Elongation. Nature 2008, 451, 480–484. [Google Scholar] [CrossRef]
  19. Feng, S.H.; Martinez, C.; Gusmaroli, G.; Wang, Y.; Zhou, J.L.; Wang, F.; Chen, L.Y.; Yu, L.; Iglesias-Pedraz, J.M.; Kircher, S.; et al. Coordinated Regulation of Development by Light and Gibberellins. Nature 2008, 451, 475–479. [Google Scholar] [CrossRef]
  20. Achard, P.; Liao, L.L.; Jiang, C.F.; Desnos, T.; Bartlett, J.; Fu, X.D.; Harberd, N.P. Dellas Contribute to Plant Photomorphogenesis. Plant Physiol. 2007, 143, 1163–1172. [Google Scholar] [CrossRef]
  21. Li, K.L.; Yu, R.B.; Fan, L.M.; Wei, N.; Chen, H.D.; Deng, X.W. Della-Mediated Pif Degradation Contributes to Coordination of Light and Gibberellin Signalling In Arabidopsis. Nat. Commun. 2016, 7, 11868. [Google Scholar] [CrossRef] [PubMed]
  22. Hartman, G.L.; West, E.D.; Herman, T.K. Crops That Feed the World 2. Soybean—Worldwide Production, Use, and Constraints Caused by Pathogens and Pests. Food Secur. 2011, 3, 5–17. [Google Scholar] [CrossRef]
  23. Abe, A.; Kosugi, S.; Yoshida, K.; Natsume, S.; Takagi, H.; Kanzaki, H.; Matsumura, H.; Yoshida, K.; Mitsuoka, C.; Tamiru, M.; et al. Genome Sequencing Reveals Agronomically Important Loci in Rice Using Mutmap. Nat. Biotechnol. 2012, 30, 174–178. [Google Scholar] [CrossRef]
  24. Gao, Y.; Zhu, J.L.; Zhai, H.; Xu, K.; Zhu, X.B.; Wu, H.Y.; Zhang, W.J.; Wu, S.H.; Chen, X.; Xia, Z.J. Dysfunction of an Anaphase-Promoting Complex Subunit 8 Homolog Leads to Super-Short Petioles and Enlarged Petiole Angles in Soybean. Int. J. Mol. Sci. 2023, 24, 11024. [Google Scholar] [CrossRef] [PubMed]
  25. Monte, E.; Tepperman, J.M.; Al-Sady, B.; Kaczorowski, K.A.; Alonso, J.M.; Ecker, J.R.; Li, X.; Zhang, Y.L.; Quail, P.H. The Phytochrome-Interacting Transcription Factor, Pif3, Acts Early, Selectively, and Positively in Light-Induced Chloroplast Development. Proc. Natl. Acad. Sci. USA 2004, 101, 16091–16098. [Google Scholar] [CrossRef]
  26. Bayer, P.E.; Valliyodan, B.; Hu, H.F.; Marsh, J.I.; Yuan, Y.X.; Vuong, T.D.; Patil, G.; Song, Q.J.; Batley, J.; Varshney, R.K.; et al. Sequencing the Usda Core Soybean Collection Reveals Gene Loss During Domestication and Breeding. Plant Genome 2022, 15, e20109. [Google Scholar] [CrossRef] [PubMed]
  27. Zhang, H.Y.; Jiang, H.; Hu, Z.B.; Song, Q.J.; An, Y.Q.C. Development of a Versatile Resource for Post-Genomic Research through Consolidating and Characterizing 1500 Diverse Wild and Cultivated Soybean Genomes. BMC Genom. 2022, 23, 2. [Google Scholar] [CrossRef] [PubMed]
  28. Kafri, M.; Patena, W.; Martin, L.; Wang, L.Y.; Gomer, G.; Ergun, S.L.; Sirkejyan, A.K.; Goh, A.; Wilson, A.T.; Gavrilenko, S.E.; et al. Systematic Identification and Characterization of Genes in the Regulation and Biogenesis of Photosynthetic Machinery. Cell 2023, 186, 5638–5655.e25. [Google Scholar] [CrossRef]
  29. Xia, Z.J.; Zhai, H.; Zhang, Y.F.; Wang, Y.Y.; Wang, L.; Xu, K.; Wu, H.Y.; Zhu, J.L.; Jiao, S.; Wan, Z.; et al. QNE1 Is a Key Flowering Regulator Determining the Length of the Vegetative Period in Soybean Cultivars. Sci. China Life Sci. 2022, 65, 2472–2490. [Google Scholar] [CrossRef]
  30. Zhang, S.R.; Wang, H.; Wang, Z.Y.; Ren, Y.; Niu, L.F.; Liu, J.; Liu, B. Photoperiodism Dynamics during the Domestication and Improvement of Soybean. Sci. China Life Sci. 2017, 60, 1416–1427. [Google Scholar] [CrossRef]
  31. Moon, J.; Zhu, L.; Shen, H.; Huq, E. Pif1 Directly and Indirectly Regulates Chlorophyll Biosynthesis to Optimize the Greening Process In Arabidopsis. Proc. Natl. Acad. Sci. USA 2008, 105, 9433–9438. [Google Scholar] [CrossRef] [PubMed]
  32. Stephenson, P.G.; Fankhauser, C.; Terry, M.J. Pif3 Is a Repressor of Chloroplast Development. Proc. Natl. Acad. Sci. USA 2009, 106, 7654–7659. [Google Scholar] [CrossRef] [PubMed]
  33. Stephenson, P.G.; Terry, M.J. Light Signalling Pathways Regulating the Mg-Chelatase Branchpoint of Chlorophyll Synthesis During De-Etiolation In Arabidopsis thaliana. Photochem. Photobiol. Sci. 2008, 7, 1243–1252. [Google Scholar] [CrossRef] [PubMed]
  34. Liu, Y.; Jafari, F.; Wang, H. Integration of light and hormone signaling pathways in the regulation of plant shade avoidance syndrome. aBioTech 2021, 2, 131–145. [Google Scholar] [CrossRef] [PubMed] [PubMed Central]
  35. Galstyan, A.; Cifuentes-Esquivel, N.; Bou-Torrent, J.; Martinez-Garcia, J.F. The Shade Avoidance Syndrome in Arabidopsis: A Fundamental Role for Atypical Basic Helix-Loop-Helix Proteins as Transcriptional Cofactors. Plant J. 2011, 66, 258–267. [Google Scholar] [CrossRef] [PubMed]
  36. Hornitschek, P.; Lorrain, S.; Zoete, V.; Michielin, O.; Fankhauser, C. Inhibition of the Shade Avoidance Response by Formation of Non-DNA Binding Bhlh Heterodimers. Embo J. 2009, 28, 3893–3902. [Google Scholar] [CrossRef] [PubMed]
  37. Liu, Y.; Wei, H.B.; Ma, M.D.; Li, Q.Q.; Kong, D.X.; Sun, J.; Ma, X.J.; Wang, B.B.; Chen, C.X.; Xie, Y.R.; et al. Arabidopsis Fhy3 and Far1 Regulate the Balance between Growth and Defense Responses under Shade Conditions. Plant Cell 2019, 31, 2089–2106. [Google Scholar] [CrossRef]
  38. Crocco, C.D.; Locascio, A.; Escudero, C.M.; Alabadi, D.; Blázquez, M.A.; Botto, J.F. The Transcriptional Regulator Bbx24 Impairs Della Activity to Promote Shade Avoidance In Arabidopsis thaliana. Nat. Commun. 2015, 6, 6202. [Google Scholar] [CrossRef] [PubMed]
  39. Ling, J.J.; Li, J.; Zhu, D.M.; Deng, X.W. Noncanonical Role of Cop1/Spa Complex in Repressing Bin2-Mediated Pif3 Phosphorylation and Degradation in Darkness. Proc. Natl. Acad. Sci. USA 2017, 114, 3539–3544. [Google Scholar] [CrossRef]
  40. Blanco-Touriñán, N.; Legris, M.; Minguet, E.G.; Costigliolo-Rojas, C.; Nohales, M.A.; Iniesto, E.; García-León, M.; Pacin, M.; Heucken, N.; Bloemeir, T.; et al. Cop1 Destabilizes Della Proteins In Arabidopsis. Proc. Natl. Acad. Sci. USA 2020, 117, 13792–13799. [Google Scholar] [CrossRef]
  41. Xia, Z.J.; Watanabe, S.; Yamada, T.; Tsubokura, Y.; Nakashima, H.; Zhai, H.; Anai, T.; Sato, S.; Yamazaki, T.; Lü, S.X.; et al. Positional Cloning and Characterization Reveal the Molecular Basis for Soybean Maturity Locus E1 That Regulates Photoperiodic Flowering. Proc. Natl. Acad. Sci. USA 2012, 109, E2155–E2164. [Google Scholar] [CrossRef] [PubMed]
  42. Zhai, H.; Wan, Z.; Jiao, S.; Zhou, J.W.; Xu, K.; Nan, H.Y.; Liu, Y.X.; Xiong, S.S.; Fan, R.; Zhu, J.L.; et al. GmMDE Genes Bridge the Maturity Gene E1 and Florigens in Photoperiodic Regulation of Flowering in Soy-bean. Plant Physiol. 2022, 189, 1021–1036. [Google Scholar] [CrossRef]
  43. Jaeger, K.E.; Wigge, P.A. Ft Protein Acts as a Long-Range Signal In Arabidopsis. Curr. Biol. 2007, 17, 1050–1054. [Google Scholar] [CrossRef] [PubMed]
  44. Arnon, D.I. Copper Enzymes in Isolated Chloroplasts—Polyphenoloxidase in Beta vulgaris. Plant Physiol. 1949, 24, 1–15. [Google Scholar] [CrossRef]
  45. Feng, X.X.; Yang, S.X.; Tang, K.Q.; Zhang, Y.H.; Leng, J.T.; Ma, J.J.; Wang, Q.; Feng, X.Z. GmPGL1, a Thiamine Thiazole Synthase, Is Required for the Biosynthesis of Thiamine in Soybean. Front. Plant Sci. 2019, 10, 1546. [Google Scholar] [CrossRef]
  46. Tomsone, L.; Kruma, Z. Spectrophotometric Analysis of Pigments in Horseradish by Using Various Extraction Solvents. In Proceedings of the Foodbalt 2019: 13th Baltic Conference on Food Science and Technology, Jelgava, Latvia, 2–3 May 2019; pp. 210–215. [Google Scholar]
  47. Zhang, C.Y.; Li, Y.S.; Yu, Z.H.; Wang, G.H.; Liu, X.B.; Liu, J.J.; Liu, J.D.; Zhang, X.M.; Yin, K.D.; Jin, J. Co-Elevation of Atmospheric [CO2] and Temperature Alters Photosynthetic Capacity and Instantaneous Water Use Efficiency in Rice Cultivars in a Cold-Temperate Region. Front. Plant Sci. 2022, 13, 1037720. [Google Scholar] [CrossRef] [PubMed]
  48. Yu, H.; Wang, Q.S.; Zhang, Z.R.; Wu, T.; Yang, X.J.; Zhu, X.B.; Ye, Y.H.; Leng, J.T.; Yang, S.X.; Feng, X.Z. Genetic Mapping of the Gmpgl3 Mutant Reveals the Function of Gmtic110a in Soybean Chloroplast Development. Front. Plant Sci. 2022, 13, 892077. [Google Scholar] [CrossRef] [PubMed]
  49. Zhu, X.B.; Zheng, K.J.; Lu, L.; Yu, H.; Wang, F.W.; Yang, X.J.; Bhat, J.A.; Zhao, B.F.; Wang, Y.; Li, H.Y.; et al. Disruption of Chorismate Synthase1 Leads to Yellow-Green Variegation in Soybean Leaves. J. Exp. Bot. 2023, 74, 4014–4030. [Google Scholar] [CrossRef]
  50. Patel, R.K.; Jain, M. Ngs Qc Toolkit: A Toolkit for Quality Control of Next Generation Sequencing Data. PLoS ONE 2012, 7, e30619. [Google Scholar] [CrossRef]
  51. Chiang, C.; Layer, R.M.; Faust, G.G.; Lindberg, M.R.; Rose, D.B.; Garrison, E.P.; Marth, G.; Quinlan, A.; Hall, I.M. SpeedSeq: Ultra-fast personal genome analysis and interpretation. Nat. Methods 2015, 12, 966–968. [Google Scholar] [CrossRef]
  52. Cingolani, P.; Platts, A.; Wang, L.L.; Coon, M.; Nguyen, T.; Wang, L.; Land, S.J.; Lu, X.Y.; Ruden, D.M. A program for annotatingand predicting the effects of single nucleotide polymorphisms, SnpEff. Fly 2012, 6, 80–92. [Google Scholar] [CrossRef] [PubMed]
  53. Thompson, J.D.; Gibson, T.J.; Plewniak, F.; Jeanmougin, F.; Higgins, D.G. The Clustal_X Windows Interface: Flexible Strategies for Multiple Sequence Alignment Aided by Quality Analysis Tools. Nucleic Acids Res. 1997, 25, 4876–4882. [Google Scholar] [CrossRef] [PubMed]
  54. Kumar, S.; Stecher, G.; Tamura, K. Mega7: Molecular Evolutionary Genetics Analysis Version 7.0 for Bigger Datasets. Mol. Biol. Evol. 2016, 33, 1870–1874. [Google Scholar] [CrossRef] [PubMed]
  55. French, N.; Yu, S.; Biggs, P.; Holland, B.; Fearnhead, P.; Binney, B.; Fox, A.; Grove-White, D.; Leigh, J.W.; Miller, W.; et al. Evolution of Campylobacter species in New Zealand. In Campylobacter Ecology and Evolution; Sheppard, S.K., Méric, G., Eds.; Caister Academic Press: Norfolk, UK, 2014; pp. 221–240. [Google Scholar]
  56. Bindea, G.; Mlecnik, B.; Hackl, H.; Charoentong, P.; Tosolini, M.; Kirilovsky, A.; Fridman, W.H.; Pagès, F.; Trajanoski, Z.; Galon, J. Cluego: A Cytoscape Plug-in to Decipher Functionally Grouped Gene Ontology and Pathway Annotation Networks. Bioinformatics 2009, 25, 1091–1093. [Google Scholar] [CrossRef] [PubMed]
  57. Chin, C.H.; Chen, S.H.; Wu, H.H.; Ho, C.W.; Ko, M.T.; Lin, C.Y. cytoHubba: Identifying Hub Objects and Sub-Networks from Complex Interactome. BMC Syst. Biol. 2014, 8, S11. [Google Scholar] [CrossRef]
  58. Shannon, P.; Markiel, A.; Ozier, O.; Baliga, N.S.; Wang, J.T.; Ramage, D.; Amin, N.; Schwikowski, B.; Ideker, T. Cytoscape: A Software Environment for Integrated Models of Biomolecular Interaction Networks. Genome Res. 2003, 13, 2498–2504. [Google Scholar] [CrossRef]
  59. Schmittgen, T.D.; Livak, K.J. Analyzing Real-Time Pcr Data by the Comparative CT Method. Nat. Protoc. 2008, 3, 1101–1108. [Google Scholar] [CrossRef]
Figure 1. The Gmeny mutant displays yellowing leaves and elongated nodes at the vegetative stage. (A) Phenotypes. (B) Hypocotyl lengths. (C) Epicotyl lengths. *** represents Student t-test at p < 0.001. Error bar represents standard deviation.
Ijms 25 06483 g001
Figure 2. Chlorophyll contents and physiological and anatomical differences in photosynthesis between the Gmeny mutant and the wild type (WT). (A) Chlorophyll a contents. (B) Chlorophyll b contents. (C) Total chlorophyll a + chlorophyll b contents. (D) Carotenoid contents. (E) Total pigment contents at three growth stages. (FI) Photosynthetic parameters of plants grown in the field. (F) Net photosynthetic rate. (G) Stomatal conductance. (H) Transpiration rate. (I) Internal CO2 concentration. (JO) Transmission electron microscopy images showing the differences in chloroplast structure between the WT (JL) and Gmeny mutant (MO). OB: osmiophilic body; SG: starch granules; and Thy: thylakoid membrane. Bars = 2 μm; *, *** represent Student t-test at p < 0.05, and 0.001, respectively; ns, no significant difference. Error bar represents standard deviation.
Ijms 25 06483 g002aIjms 25 06483 g002b
Figure 3. Strategic approach for the identification and confirmation of the candidate gene mutated in the Gmeny mutant using the BVF-IGV pipeline. First, the bulk resequencing data were processed through the BVF-IGV pipeline, which includes bulk sequencing, variant calling, functional annotation using SnpEFF software (v4.0e), and the Integrative Genomics View [24,25]. The bulk transcriptome data were also analyzed using the BVF-IGV pipeline. The results of the bulk resequencing data and the transcriptome data were also used to verify each other. An F2 population and their derived sub-populations were made from a cross between Gmeny × Hefeng 55 to verify the authenticity of Glyma.02G304700 as the candidate predicted by BVF-IGV.
Ijms 25 06483 g003
Figure 4. Characterization of the candidate gene, Glyma.02G304700. (A) Alignment of the wild-type (WT) and Gmeny mutant Glyma.02G304700 proteins. The 10 bp deletion in the first exon of Glyma.02G304700 leads to a 12-amino acid change (9 amino acids shorter in the Gmeny mutant). (B) Phylogenetic tree of Glyma.02G304700 protein sequences from leguminous species and two model plants, Arabidopsis thaliana and rice (Oryza sativa). All sequences were retrieved from Phytozome (v13) and were aligned using the ClustalW program in the Bioedit software. (C,D) Predicted 3D protein structures for Glyma.02G304700 in the WT (C) and Gmeny mutant (D) using a SWISS-MODEL online modeling server and visualized with PyMOL. (E) The expression of Glyma.02G304700 and its homologous genes in different soybean tissues. The expression data were downloaded from http://soyatlas.venanciogroup.uenf.br (accessed on 26 December 2023).
Ijms 25 06483 g004
Figure 5. Gene expression profiles and heat maps of the genes involved in photosynthesis and flowering time regulation. (AH) Expression of selected genes determined using RT-qPCR to validate the RNA sequencing results. WT: wild type. (A) Glyma.15G029500. (B) Glyma.14G003200. (C) Glyma.10G142600. (D) Glyma.18G021500. (E) Glyma.04G124300. (F) Glyma.03G170300. (G) Glyma.04G205600. (H) Glyma.11G003200. (I,J) Heat maps of the expression levels of genes involved in photosynthesis (I) and flowering time (J). *, **, and *** represent Student t-test at p < 0.05, 0.01, and 0.001, respectively. Error bar represents standard deviation.
Ijms 25 06483 g005
Figure 6. Diagram of the possible functional mechanism of GmHY2a. In plastids, the Gmeny mutant and wild-type (WT) GmHY2a proteins are structurally different. When transferred into the cytoplasm, the WT and Gmeny proteins differed in their shifts between the Pr and Pfr forms, which might result in the dynamic differences in photosynthesis, photomorphogenesis, and flowering time observed in these genotypes due to differences in the regulation of downstream gene expression levels. Red arrows represent the up-regulation, while blue arrows stand the down-regulation.
Ijms 25 06483 g006
Disclaimer/Publisher’s Note: The statements, opinions and data contained in all publications are solely those of the individual author(s) and contributor(s) and not of MDPI and/or the editor(s). MDPI and/or the editor(s) disclaim responsibility for any injury to people or property resulting from any ideas, methods, instructions or products referred to in the content.

