Abstract
The FUT2 gene encodes an enzyme called α-1,2-fucosyltransferase, which is involved in the formation of blood group antigens AB0(H) and is also involved in the processes of vitamin B12 absorption and its transport between cells. FUT2 gene polymorphisms are associated with vitamin B12 levels in the body. Vitamin B12 deficiency associated with hyperhomocysteinemia is a major risk factor for cardiovascular diseases (CVDs), which are one of the main causes of death in patients after kidney transplantation. The aim of our study was to determine the impact of the rs602662 (G>A) polymorphism of the FUT2 gene on the functionality of transplanted kidneys and the risk of CVD in patients after kidney transplantation. The study included 402 patients treated with immunosuppression (183 patients taking cyclosporine (CsA) and 219 patients taking tacrolimus (TAC)). The analysis of the FUT2 rs602662 (G>A) polymorphism was performed using real-time PCR. Patients with CsA were more likely to be underweight (1.64% vs. 0.91%) and obese (27.87% vs. 15.98%), while those taking TAC were more likely to be of normal weight (39.27%) or overweight (43.84%). No statistically significant differences were observed comparing the mean blood pressure, both systolic and diastolic. The renal profile showed a higher median urea nitrogen concentration in patients with CsA (26.45 mg/dL (20.60–35.40) vs. 22.95 mg/dL (17.60–33.30), p = 0.004). The observed frequency of rs602662 alleles of the FUT2 gene was similar in the analyzed groups. The A allele was present in 43.7% of patients with CsA and 41.1% of those taking TAC (OR = 0.898; 95% CI: 0.678–1.189; p = 0.453). In the group with CsA, the GG genotype was present in 32.2% of patients, the GA in 48.1% and the AA in 19.7%. A similar distribution was obtained in the TAC group: GG—33.8%, GA—50.2%, and AA—16.0%. An association of genotypes containing the G allele with a higher incidence of hypertension was observed. The G allele was present in 65% of people with hypertension and in 56% of patients with normal blood pressure (p = 0.036). Moreover, the evaluation of the renal parameters showed no effect of the FUT2 polymorphism on the risk of organ rejection because the levels of creatinine, eGFR, potassium, and urea nitrogen were prognostic of successful transplantation. Our results suggest that the rs6022662 FUT2 polymorphism may influence the risk of cardiovascular diseases.
1. Introduction
Cardiovascular disease (CVD) is the leading cause of death after kidney transplantation, and its incidence is much higher than in the general population. Conventional risk factors such as diabetes, hypertension, and dyslipidemia increase the risk of CVD after transplantation. Additionally, other factors specific to organ transplantation, such as genetic polymorphisms, elevated levels of homocysteine and mycoinflammatory markers, systemic inflammation, infections, and immunosuppressive drugs play a role in CVD risk [1,2,3,4].
In case of disorders in homocysteine metabolism, its excess accumulates in the blood, the high concentration of which is a risk factor for coronary heart disease, heart attack, and stroke. A high homocysteine level, combined with a deficiency of folate and vitamin B12, causes damage to the endothelium of blood vessels. This leads to an increased risk of developing atherosclerotic lesions (the intensification of inflammation, reconstruction of vessel walls, adhesion of platelets). The role of homocysteine in the activation of blood coagulation factors V and XII and the inactivation of factors VI and VIII is also important. This effect of homocysteine on coagulation factors indicates its prothrombotic effect. Elevated levels of homocysteine in the blood may lead to peripheral vascular thrombosis, which is independent of hypercholesterolemia, hypertension, or diabetes [3,4].
The FUT2 gene encodes an enzyme called α-1,2-fucosyltransferase, which is involved in the formation of blood group antigens AB0(H) that are located on erythrocytes, but they are also in a soluble form in body fluids (sweat, saliva, and intestinal mucus) [5,6]. Polymorphisms that reduce the activity of the α-1,2-fucosyltransferase enzyme, such as W143X in Caucasians (rs601338G>A) and I129F in Asians, cause a “non-secretory” phenotype characterized by the absence of these antigens in body secretions and consequently affect susceptibility to many pathogens and diseases [7]. Individuals who have a functional enzyme (genotype GG and GA for rs601338G>A) are called secretors, while those who lack a functional enzyme are called non-secretors (genotype AA). Non-secretory individuals have been shown to have a lower risk of childhood diarrhea and ear infections [8,9] and an increased risk of certain autoimmune diseases, including type 1 diabetes [10], psoriasis [11,12] and inflammatory bowel disease [13,14].
Moreover, it has been shown that the fructosyltransferase 2 (FUT2) is also involved in the processes of vitamin B12 absorption and its transport between cells. FUT2 gene polymorphisms are associated with vitamin B12 levels in the body [15,16,17]. Variants of this gene have been linked to low blood levels of vitamin B12, especially when following a vegetarian diet. Vitamin B12 deficiency is also associated with a diet low in meat and dairy products, total or partial resection of the stomach, resection of the ileum, the use of metformin, drugs blocking the secretion of gastric acid, and others [18]. Vitamin B12 deficiency leads to hematological and neurological symptoms, including glossitis, fatigue, macrocytic anemia, and peripheral neuropathy. Additionally, vitamin B12 deficiency is strongly associated with hyperhomocysteinemia, which is a major risk factor for cardiovascular diseases (CVDs) [18].
In kidney transplant recipients, special attention is paid to avoiding the risk of side effects and comorbidities that may lead to transplant failure or death, in particular obesity, infections, cancer, and cardiovascular diseases [19,20,21]. Diarrhea is a common symptom in kidney transplant recipients and may be related to the use of immunosuppressive drugs [22,23]. Among the immunosuppressive drugs, mycophenolate mofetil is extensively hydrolyzed to mycophenolic acid by esterases in the stomach, small intestine, blood, liver, and other tissues. There is evidence that patients taking mycophenolate mofetil frequently experience diarrhea [24], which is associated with duodenal villous atrophy and erosive ileitis [25,26]. It may contribute to vitamin B12 malabsorption. Vitamin B12 deficiency may promote CVD [27,28], which is an important cause of death in kidney transplant patients [29].
The aim of our study was to determine the impact of the rs602662 (G>A) polymorphism of the FUT2 gene on the functionality of transplanted kidneys and the risk of CVD in transplant patients.
2. Results
2.1. Characteristics of Patients Qualified for the Study
Among the patients who qualified for the study, there were more men than women (57.5% vs. 42.5%), and their ages ranged from 19 to 82 years. Patients under 50 years of age constituted 38.06% of the group, most people, 55.72%, were between 51 and 70 years of age, and only 6.22% of people were over 70 years of age. The mean age for the group taking CsA was 54.02 ± 12.60 and was statistically significantly higher than in the second group: 51.00 ± 13.37 (p = 0.021). Analyzing the age of patients, it was observed that cyclosporine was more often taken by the oldest patients ≥70 years of age (8.20% vs. 4.56%), while the youngest <40 years of age took tacrolimus (24.66% vs. 13.12%). No statistically significant differences were observed comparing the mean height and blood pressure, both systolic and diastolic. The body weight of patients with CsA was higher at 78.77 ± 17.06 kg vs. 75.52 ± 15.35 kg in the TAC group (p = 0.045). The mean BMI values did not differ statistically significantly between the groups and were 27.12 ± 5.47 kg/m2 and 26.25 ± 4.35 kg/m2 in the CsA and TAC groups, respectively (p = 0.082). Patients taking cyclosporine were more likely to be underweight (1.64% vs. 0.91%) and obese (27.87% vs. 15.98%), while those taking tacrolimus were more likely to be of normal weight or overweight. Comparing the time since transplantation in both study groups, it was observed that in the CsA group, the average time was 122.40 ± 76.51 months (min–max: 1–324), and in the TAC group 76.41 ± 52.43 months (min–max: 1–264), with p < 0.001.
Chronic diseases were frequently reported in patients after kidney transplantation, most often hypertension and diabetes, but their incidence was not statistically different in both study groups. However, more chronic comorbidities were observed in the CsA group compared to the TAC group (21.31% vs. 13.24%, p = 0.044). There were no statistically significant differences in the use of stimulants (alcohol and cigarette smoking) between the groups. Analyzing the self-assessment of their health condition, 15.42% of patients answered that they felt very good, 72.64% good, 11.69% poor, and one person (0.25%) described their health as very poor. The self-assessment of cyclosporine patients was not statistically different from tacrolimus patients (p = 0.806). Detailed characteristics of renal transplant patients treated with cyclosporine and tacrolimus are presented in Table 1.

Table 1.
General characteristics and clinical data of renal transplant patients treated with cyclosporine and tacrolimus.
The patients underwent laboratory blood tests (morphology, renal profile, liver function tests, and lipid profile). The obtained results are presented in Table 2. Analyzing the morphology of patients after kidney transplantation, a higher number of white blood cells (WBC), red blood cells (erythrocytes, RBC), and an increase in hematocrit (HCT) and hemoglobin (HGB) concentration were noted in patients taking TAC compared to CsA group. The differences for RBC and HGB were statistically significant between the analyzed groups (RBC—4.24 ± 0.59 vs. 4.42 ± 0.61, with p = 0.004; 37.99 ± 4.77 vs. 39.11 ± 5.14, with p = 0.026). However, the number of thrombocytes (PLT, platelets) was higher in the CsA group, and the median was 215.50 (174.00–258.00) vs. 197.00 (158.50–240.00) in the TAC group, with p = 0.004. Analysis of the renal profile showed a higher median urea nitrogen concentration in patients taking preparations containing cyclosporine at 26.45 mg/dL (20.60–35.40) vs. 22.95 mg/dL (17.60–33.30), with p = 0.004. Upon analyzing liver parameters, no differences were observed in the concentrations of alanine aminotransferase (ALAT) and aspartate aminotransferase (ASPAT), while the CsA group had a statistically significantly higher median bilirubin of 0.54 mg/dL (0.43–0.71) vs. 0.44 mg/dL (0.33–0.62) in the TAC group, with p < 0.001. When assessing the lipid profile, no significant differences were observed between patients taking cyclosporine and tacrolimus (Table 2).
Table 2.
Characteristics of laboratory data of renal transplant patients treated with cyclosporine and tacrolimus.
2.2. Analysis of the FUT2 rs602662 Variant
In the group of 402 tested patients, 33% had the homozygous GG genotype, 49% had the heterozygous GA genotype, and 18% had the homozygous AA genotype. In the next stage of the study, the frequencies of genotypes and alleles of the FUT2 rs602662 polymorphism were compared in a group of 183 patients with CsA and 219 patients with TAC. The statistical analysis performed using the chi-square test showed that the genotype frequencies for this variant were consistent with the Hardy–Weinberg equilibrium (HWE) law. The observed frequency of rs602662 alleles of the FUT2 gene was similar in the analyzed groups. The A allele was present in 43.7% of patients taking cyclosporine and in 41.1% of those taking tacrolimus (OR = 0.898; 95% CI: 0.678–1.189; p = 0.453).
Table 3 shows the genotype frequency of FUT2 rs602662 polymorphism in renal transplant patients treated with cyclosporine and tacrolimus. In the group treated with cyclosporine, the GG genotype was present in 32.2% of the subjects, the GA in 48.1%, and the AA in 19.7%. A similar distribution was obtained in the TAC group: GG—33.8%, GA—50.2%, and AA—16.0%. There were no statistically significant differences in any of the analyzed genetic models between the analyzed patient groups. Also, after adjusting the regression model for age, BMI, and time since transplantation, no statistically significant differences were observed. In both cases, the recessive genetic model was shown to be the best. For the raw regression model, the OR = 0.78; the 95% CI: 0.46–1.30; p = 0.335; and the AIC = 557.1, and the adjusted OR = 0.74; the 95% CI: 0.44–1.25; p = 0.260; and the AIC = 552.3.
Table 3.
Frequency of rs602662 genotypes of the FUT2 gene in patients after kidney transplantation treated with cyclosporine and tacrolimus.
2.3. Associations of Genotypes and Alleles of the FUT2 Gene with Clinical and Biochemical Data
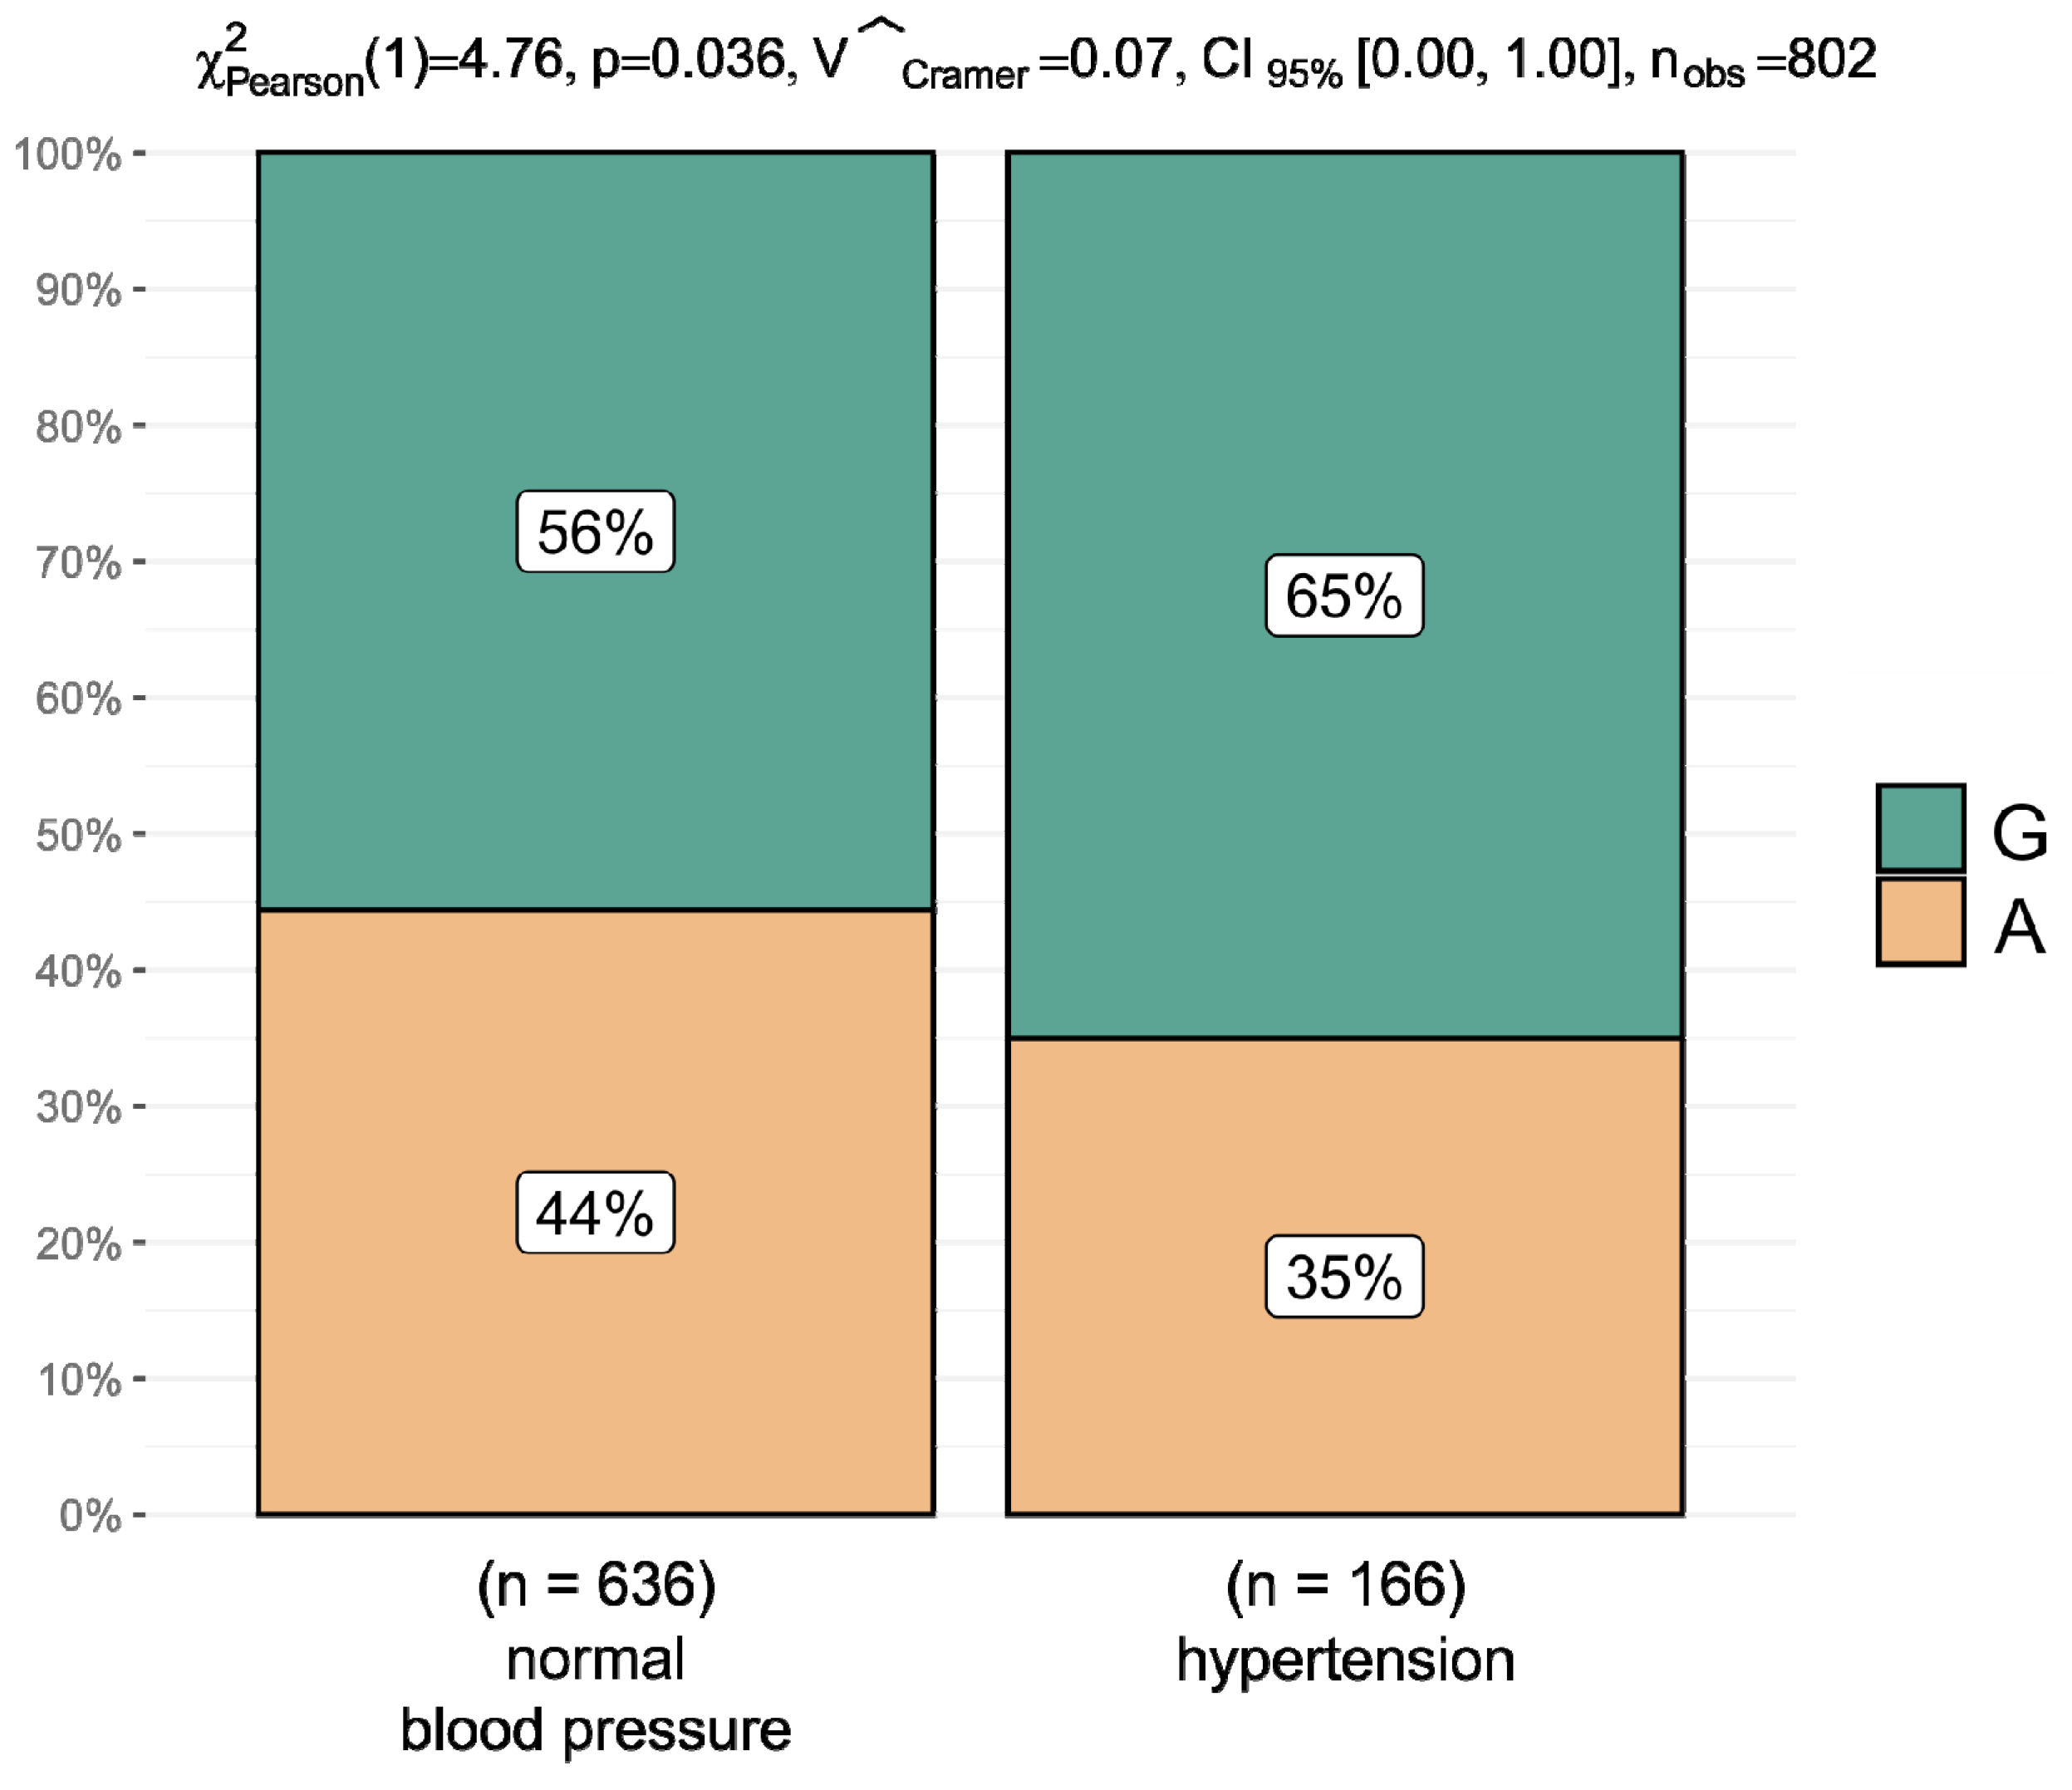
A comparative analysis of the mean clinical data depending on the genotypes and alleles of the rs602662 variant was performed in renal transplant patients treated with cyclosporine and tacrolimus. Upon analyzing the data for the entire group of 402 patients, an association of genotypes containing the G allele with a higher incidence of hypertension was observed. Hypertension occurred in 25.00% of patients with the GG genotype, in 21.21% of those with heterozygotes, and in 11.27% of patients with the AA genotype. However, the AA genotype was present in 88.73% of patients without hypertension, the AG in 78.79%, and the GG in 75.00% (p = 0.068). Statistically significant relationships were obtained by comparing the frequency of hypertension and alleles of the rs602662 variant. The G allele was present in 65% of people with hypertension and in 56% of patients with normal blood pressure (p = 0.036) (Figure 1).

Figure 1.
Percentage distribution of rs602662 alleles of the FUT2 gene and arterial hypertension in the entire group of 402 patients after kidney transplantation.
In terms of age, weight, height, BMI, blood pressure, and gender, no statistically significant differences were observed between genotypes in the group of patients taking cyclosporine. In the TAC group, differences in the mean age and height of patients were shown to be statistically significant (Table 4). Then, the results of the laboratory tests were analyzed depending on the genotypes in groups of patients after kidney transplantation treated with cyclosporine and tacrolimus.
Table 4.
General characteristics and clinical data of patients after kidney transplantation treated with cyclosporine and tacrolimus depending on the genotypes of the FUT2 rs602662 variant.
In 183 patients taking cyclosporine, the most interesting observation was the difference in the alanine transaminase (ALAT) medians. In patients with the GG genotype, the highest values were noted at 19.00 U/L (IQR: 13.00–30.50), they were lower in heterozygous patients at 15.50 U/L (IQR: 11.00–21.00), and they were the lowest in AA homozygotes at 15.00 U/L (IQR: 12.00–19.00), with p = 0.081 (Table 5). Comparing the concentrations of this transaminase for alleles of the rs602662 variant, the median for the G allele was statistically significantly higher—16.00 U/L (IQR: 12.00–27.00)—compared to the median for the A allele—15.00 U/L (IQR: 12, 00–20.00), with p = 0.029.
Table 5.
Characteristics of laboratory data depending on the genotypes of the FUT2 rs602662 variant in patients after kidney transplantation treated with CsA.
In patients taking tacrolimus, a statistically significant difference was noted in the medians of aspartate transaminase (ASPAT). In patients with the GG genotype, the lowest value was 16.00 U/L (IQR: 14.00–21.00), and the highest value in patients with the heterozygous genotype was 19.50 U/L (IQR: 16.00–25.00), with p = 0.008 (Table 6).
Table 6.
Characteristics of laboratory data depending on the genotypes of the FUT2 rs602662 variant in patients after kidney transplantation treated with TAC.
3. Discussion
In patients after kidney transplantation, special attention is paid to avoiding the risk of side effects and comorbidities that may cause transplant failure or death, in particular obesity, infections, cancer, and cardiovascular diseases. Vitamin B12 deficiency may contribute to the occurrence of CVD, which is one of the main causes of death in patients after kidney transplantation. In our study, we determined the impact of the rs602662 (G>A) polymorphism of the FUT2 gene on the functionality of transplanted kidneys and the risk of CVD in transplant patients.
Upon analyzing data for the entire group of 402 patients, we observed an association of genotypes containing the G allele with a higher incidence of hypertension. Hypertension occurred in 25.00% of people with the GG genotype, in 21.21% of those with heterozygotes, and in 11.27% of people with the AA genotype. However, the AA genotype was present in 88.73% of patients without hypertension, the AG in 78.79%, and the GG in 75.00% (p = 0.068). Statistically significant relationships were obtained by comparing the incidence of hypertension and alleles of the rs602662 variant. The G allele was present in 65% of people with hypertension and in 56% of people with normal blood pressure (p = 0.036). The lipid profile in relation to the tested genotypes was comparable in patients taking cyclosporine or tacrolimus.
As shown, the FUT2 gene is highly polymorphic and shows variable frequency in populations [30]. Hazra et al. performed a meta-analysis to identify the loci associated with plasma vitamin B12, homocysteine, folic acid, and vitamin B6 [31]. They demonstrated an association of vitamin B12 in plasma with rs602662 and rs492602 polymorphisms in strong linkage disequilibrium (LD) with rs601338 polymorphism and the FUT2 W143X mutation. They confirmed that carriers homozygous for non-secretory variants had higher vitamin B12 levels than carriers of the secretory genotype [31]. Another study showed that white women who had the GG genotype for the rs492602 polymorphism of the FUT2 gene, which is strongly associated with FUT2 rs601338 polymorphism, had higher plasma vitamin B12 concentrations [15]. A meta-analysis conducted in Italy (Tuscany and Sardinia) and the USA (Baltimore, Washington) showed that the presence of the A allele for the rs6022662 polymorphism was associated with a higher concentration of vitamin B12 [32].
This relationship confirms that our patients with the AA genotype have a lower risk of hypertension compared to the G allele and GG genotype of the rs6022662 polymorphism. This is the first study in a European population assessing the impact of the rs6022662 polymorphism of the FUT2 gene on the occurrence of CVD in patients after kidney transplantation. Our study indicates that patients with the G allele and GG genotype have an increased risk of hypertension, which may lead to CVD. This is because vitamin B12 deficiency is strongly associated with hyperhomocysteinemia, which is a major risk factor for CVD.
In addition, the evaluation of the renal parameters showed no effect of the FUT2 polymorphism on the risk of organ rejection, because the levels of creatinine, eGFR, potassium, and urea nitrogen were prognostic of successful transplantation.
4. Materials and Methods
4.1. Patients
The study included 402 patients after kidney transplantation treated with immunosuppression who were divided into two groups taking cyclosporine (CsA, n = 183) and tacrolimus (TAC, n = 219). The patients were recruited at the Division of Nephrology and Kidney Transplantation, the Independent Public Provincial Hospital in Szczecin, and the Department of General Surgery and Transplantation, Pomeranian Medical University in Szczecin.
After renal transplantation, immunosuppressive therapy consisting of a calcineurin inhibitor (TAC/CsA), mycophenolate mofetil, and glucocorticoids is the standard treatment. Underage patients, retransplant patients, and patients with rapidly progressive graft failure, severe neurocognitive disease, or inability to communicate fluently in Polish were not eligible for the study.
Peripheral blood was used for biochemical tests (renal, hepatic, and lipid profile parameters), the measurement of drug blood concentrations (cyclosporine, tacrolimus), and the analysis of the genetic variants. Fasting whole blood concentrations of TAC and CsA weredetermined before drug administration. The analysis was performed using the ARCHITECT i2000SR analyzer (Abbott, Chicago, IL, USA). The ARCHITECT System Tacrolimus was used to determine drug concentrations based on chemiluminescent microparticle immunoassay (CMIA) according to the manufacturer’s protocol. Clinical and biochemical parameters were evaluated to determine the risk for graft rejection.
4.2. Analysis of the FUT2 rs602662 (G>A) Polymorphism
Genetic analysis was carried out at the Department of Stem Cells and Regenerative Medicine at the Institute of Natural Fibers in Poznan, Poland. Genomic DNA was isolated from peripheral blood leukocytes using a commercial kit—Macherey-Nagel NucleoSpin®Blood (Macherey-Nagel GmbH&Co, Düren, Germany)—according to the manufacturer’s protocol. The analysis of the FUT2 rs602662 (G>A) polymorphism was performed using real-time PCR using LightCycler®96 (Roche Diagnostics, Rotkreuz, Switzerland). A set of LightSNiP rs602662 for FUT2 polymorphism contained appropriate concentrations of specific primers and probes for the amplified fragment and was prepared according to the manufacturer’s instructions. The PCR program was initiated at 95 °C for 10 min. Each PCR cycle comprised a denaturation step at 95 °C for 10 s, an annealing step at 60 °C for 10 s, and an elongation step at 72 °C for 15 s (45 cycles). The final stage was the melting of products as a result of temperature rise to 95 °C. The analysis of the genotyping was based on the melting curve using LightCycler®96 Basic Software (16 February 2023). The research was approved by the Bioethics Committee of Poznan University of Medical Sciences, Poland (no. 510/12;574/18), and all patients gave written informed consent to participate before enrolling in the study.
4.3. Statistical Analysis
The R program version 4.2.2, the “SNPassoc” version 2.0-2 and the “ggstatsplot” package were used for statistical analyses of the results [33,34,35]. The normality of data distribution on the interval scale was assessed using the Shapiro–Wilk test. Normally distributed variables were presented as arithmetic means with standard deviation (SD), and non-parametric variables were presented as medians with lower and upper quartiles (Q1; Q3). Assessing the difference in the compared parameters between groups, when a normal distribution was obtained, the Student’s t-test or analysis of variance (ANOVA) and Tukey’s post hoc test were used. Interval data without a normal distribution and data on an ordinal scale were assessed using the Mann–Whitney or Kruskal–Wallis test. To compare data on a nominal scale presented as numbers and percentages, χ2 or Fisher tests were used, thus depending on the size of the compared groups. Correlations were assessed using Spearman’s rho coefficient for non-parametric data.
The comparison of allele frequencies in groups with the expected frequencies resulting from the Hardy–Weinberg equation was made using the χ2 test. Unconditional logistic regression was used to calculate odds ratios (ORs) with 95% confidence intervals to demonstrate the association of the rs602662 polymorphism of the FUT2 gene in kidney transplant patients treated with immunosuppression divided according to the calcineurin inhibitor taken. A crude model and one adjusted for factors with significant differences between groups (age, BMI, and time since transplantation) were included, and odds ratios were calculated to compare allele and genotype frequencies. Five genetic models were analyzed (codominant, dominant, recessive, overdominant, and log-additive). The Akaike information criterion (AIC) was chosen to evaluate the model. Results with p < 0.05 were considered statistically significant.
5. Conclusions
In conclusion, our results suggest that the FUT2 rs6022662 polymorphism may influence the risk of CVD. This is because it has been shown that patients with the G allele and the GG genotype have an increased risk of hypertension, which may lead to CVD. Upon analyzing renal parameters, it was demonstrated that there was no effect of FUT2 polymorphism on the risk of organ rejection, because the levels of creatinine, eGFR, potassium, and urea nitrogen were prognostic of successful transplantation.
The advantages of our study should also be mentioned. First, a relatively large group of post-kidney transplant patients with detailed clinical data was collected. Second, this is the first study to evaluate the effect of the FUT2 polymorphism on CVD risk in kidney transplant patients. The limitation of the study is that homocysteine and vitamin B12 levels were not measured to further confirm the conclusions. This is due to the fact that the data collected so far were intended to assess the impact of polymorphisms involved in the metabolism of immunosuppressive drugs.
Author Contributions
M.J.K.—conceptualization, methodology, original draft preparation. P.O.—conceptualization, methodology, validation and formal analysis, original draft preparation. J.S. and B.C.—analysis of data, writing—review and editing. K.T.—validation and formal analysis. B.M.—writing—review and editing. A.G. and A.E.M.—analysis of data. A.B.—supervision, project administration. All authors have read and agreed to the published version of the manuscript.
Funding
The study was supported by the National Science Centre through Grant no. UMO-2011/03/B/NZ7/06550.
Institutional Review Board Statement
Not applicable.
Informed Consent Statement
Not applicable.
Data Availability Statement
Data are contained within the article.
Conflicts of Interest
The authors declare no conflicts of interest.
References
- Rao, N.N.; Coates, P.T. Cardiovascular Disease After Kidney Transplant. Semin. Nephrol. 2018, 38, 291–297. [Google Scholar] [CrossRef] [PubMed]
- Neale, J.; Smith, A.C. Cardiovascular risk factors following renal transplant. World J. Transplant. 2015, 5, 183–195. [Google Scholar] [CrossRef] [PubMed]
- Stoumpos, S.; Jardine, A.G.; Mark, P.B. Cardiovascular morbidity and mortality after kidney transplantation. Transpl. Int. 2015, 28, 10–21. [Google Scholar] [CrossRef] [PubMed]
- Aker, S.; Ivens, K.; Grabensee, B.; Heering, P. Cardiovascular risk factors and diseases after renal transplantation. Int. Urol. Nephrol. 1998, 30, 777–788. [Google Scholar] [CrossRef] [PubMed]
- Wu, H.; Sun, L.; Lin, D.P.; Shao, X.X.; Xia, S.L.; Lv, M. Association of Fucosyltransferase 2 Gene Polymorphisms with Inflammatory Bowel Disease in Patients from Southeast China. Gastroenterol. Res. Pract. 2017, 2017, 4148651. [Google Scholar] [CrossRef] [PubMed]
- Yuan, M.; Itzkowitz, S.H.; Palekar, A.; Shamsuddin, A.M.; Phelps, P.C.; Trump, B.F.; Kim, Y.S. Distribution of blood group antigens A, B, H, Lewis A and Lewis B in human normal, fetal, and malignant colonic tissue. Cancer Res. 1985, 45, 4499–4511. [Google Scholar] [PubMed]
- Kelly, R.J.; Rouquier, S.; Giorgi, D.; Lennon, G.G.; Lowe, J.B. Sequence and expression of a candidate for the human Secretor blood group alpha(1,2)fucosyltransferase gene (FUT2). Homozygosity for an enzyme-inactivating nonsense mutation commonly correlates with the non-secretor phenotype. J. Biol. Chem. 1995, 270, 4640–4649. [Google Scholar] [CrossRef]
- Bustamante, M.; Standl, M.; Bassat, Q.; Vilor-Tejedor, N.; Medina-Gomez, C.; Bonilla, C.; Ahluwalia, T.S.; Bacelis, J.; Bradfield, J.P.; Tiesler, C.M.; et al. A genome-wide association metaanalysis of diarrhoeal disease in young children identifies FUT2 locus and provides plausible biological pathways. Hum. Mol. Genet. 2016, 25, 4127–4142. [Google Scholar] [CrossRef] [PubMed]
- Tian, C.; Hromatka, B.S.; Kiefer, A.K.; Eriksson, N.; Noble, S.M.; Tung, J.Y.; Hinds, D.A. Genome-wide association and HLA region fine-mapping studies identify susceptibility loci for multiple common infections. Nat. Commun. 2017, 8, 599. [Google Scholar] [CrossRef]
- Smyth, D.J.; Cooper, J.D.; Howson, J.M.; Clarke, P.; Downes, K.; Mistry, T.; Stevens, H.; Walker, N.M.; Todd, J.A. FUT2 nonsecretor status links type 1 diabetes susceptibility and resistance to infection. Diabetes 2011, 60, 3081–3084. [Google Scholar] [CrossRef]
- Ellinghaus, D.; Ellinghaus, E.; Nair, R.P.; Stuart, P.E.; Esko, T.; Metspalu, A.; Debrus, S.; Raelson, J.V.; Tejasvi, T.; Belouchi, M.; et al. Combined analysis of genome-wide association studies for Crohn disease and psoriasis identifies seven shared susceptibility loci. Am. J. Hum. Genet. 2012, 90, 636–647. [Google Scholar] [CrossRef] [PubMed]
- Tang, H.; Jin, X.; Li, Y.; Jiang, H.; Tang, X.; Yang, X.; Cheng, H.; Qiu, Y.; Chen, G.; Mei, J.; et al. A large-scale screen for coding variants predisposing to psoriasis. Nat. Genet. 2013, 46, 45. [Google Scholar] [CrossRef]
- Jostins, L.; Ripke, S.; Weersma, R.K.; Duerr, R.H.; McGovern, D.P.; Hui, K.Y.; Lee, J.C.; Schumm, L.P.; Sharma, Y.; Anderson, C.A.; et al. Host-microbe interactions have shaped the genetic architecture of inflammatory bowel disease. Nature 2012, 491, 119–124. [Google Scholar] [CrossRef]
- McGovern, D.P.; Jones, M.R.; Taylor, K.D.; Marciante, K.; Yan, X.; Dubinsky, M.; Ippoliti, A.; Vasiliauskas, E.; Berel, D.; Derkowski, C.; et al. Fucosyltransferase2 (FUT2)non-secretor status is associated with Crohn’s disease. Hum. Mol. Genet. 2010, 19, 3468–3476. [Google Scholar] [CrossRef]
- Hazra, A.; Kraft, P.; Selhub, J.; Giovannucci, E.L.; Thomas, G.; Hoover, R.N.; Chanock, S.J.; Hunter, D.J. Common variants of FUT2 are associated with plasma vitamin B12 levels. Nat. Genet. 2008, 40, 1160–1162. [Google Scholar] [CrossRef]
- Lin, X.; Lu, D.; Gao, Y.; Tao, S.; Yang, X.; Feng, J.; Tan, A.; Zhang, H.; Hu, Y.; Qin, X.; et al. Genome-wide association study identifies novel loci associated with serum level of vitamin B12 in Chinese men. Hum. Mol. Genet. 2012, 21, 2610–2617. [Google Scholar] [CrossRef]
- Tanwar, V.S.; Chand, M.P.; Kumar, J.; Garg, G.; Seth, S.; Karthikeyan, G.; Sengupta, S. Common variant in FUT2 gene is associated with levels of vitamin B(12) in Indian population. Gene 2013, 515, 224–228. [Google Scholar] [CrossRef]
- da Silva Pontes, K.S.; Klein, M.R.S.T.; da Costa, M.S.; de Carvalho Rosina, K.T.; Barreto, A.P.M.M.; Silva, M.I.B.; da Silveira Rioja, S. Vitamin B12 status in kidney transplant recipients: Association with dietaryintake, body adiposity and immunosuppression. Br. J. Nutr. 2019, 122, 450–458. [Google Scholar] [CrossRef]
- Cimino, F.M.; Snyder, K.A. Primary care of the solid organ transplant recipient. Am. Fam. Physician 2016, 93, 203–210. [Google Scholar]
- Neuberger, J.M.; Bechstein, W.O.; Kuypers, D.R.; Burra, P.; Citterio, F.; De Geest, S.; Duvoux, C.; Jardine, A.G.; Kamar, N.; Krämer, B.K.; et al. Practical recommendations for long-term management of modifiable risks in kidney and liver transplant recipients: A guidance report and clinical checklist by the Consensus on Managing Modifiable Risk in Transplantation (COMMIT) group. Transplantation 2017, 101, S1–S56. [Google Scholar] [CrossRef]
- Chan, W.; Bosch, J.A.; Jones, D.; McTernan, P.G.; Phillips, A.C.; Borrows, R. Obesity in kidney transplantation. J. Ren. Nutr. 2014, 24, 1–12. [Google Scholar] [CrossRef]
- Aulagnon, F.; Scemla, A.; DeWolf, S.; Burra, P.; Citterio, F.; De Geest, S.; Duvoux, C.; Jardine, A.G.; Kamar, N.; Krämer, B.K.; et al. Diarrhea after kidney transplantation: A new look at a frequent symptom. Transplatation 2014, 98, 806–816. [Google Scholar] [CrossRef]
- Shin, H.S.; Chandraker, A. Causes and management of postrenal transplant diarrhea: An underappreciated cause of transplant-associated morbidity. Curr. Opin. Nephrol. Hypertens. 2017, 26, 484–493. [Google Scholar] [CrossRef]
- Tricontinental Mycophenolate Mofetil Renal Transplantation Study Group. A blinded, randomized clinical trial of mycophenolate mofetil for the prevention of acute rejection in cadaveric renal transplantation. Transplantation 1996, 61, 1029–1037. [Google Scholar] [CrossRef]
- Kamar, N.; Faure, P.; Dupuis, E.; Cointault, O.; Joseph-Hein, K.; Durand, D.; Moreau, J.; Rostaing, L. Villous atrophy induced by mycophenolate mofetil in renal transplant patients. Transpl. Int. 2004, 17, 463–467. [Google Scholar] [CrossRef]
- Maes, B.D.; Dalle, I.; Oellerich, M.; Armstrong, V.W.; Evenepoel, P.; Geypens, B.; Kuypers, D.; Shipkova, M.; Geboes, K.; Vanrenterghem, Y.F.C. Erosive enterocolitis in mycophenolate mofetil-treated in renal transplant recipients with persistent afebrile diarrhea. Transplantation 2003, 75, 665–672. [Google Scholar] [CrossRef]
- Ganguly, P.; Alam, S.F. Role of homocysteine in the development of cardiovascular disease. Nutr. J. 2015, 14, 6. [Google Scholar] [CrossRef]
- Shipton, M.; Thachil, J. Vitamin B12 deficiency—A 21st century perspective. Clin. Med. 2015, 15, 145–150. [Google Scholar] [CrossRef]
- Jardine, A.G.; Gaston, R.S.; Fellstrom, B.C.; Holdaas, H. Prevention of cardiovascular disease in adult recipients of kidney transplants. Lancet 2011, 378, 1419–1427. [Google Scholar] [CrossRef]
- Koda, Y.; Tachida, H.; Pang, H.; Liu, Y.; Soejima, M.; Ghaderi, A.A.; Takenaka, O.; Kimura, H. Contrasting patterns of polymorphisms at the ABO-secretor gene (FUT2) and plasma alpha(1,3)fucosyltransferase gene (FUT6) in human populations. Genetics 2001, 158, 747–756. [Google Scholar] [CrossRef]
- Hazra, A.; Kraft, P.; Lazarus, R.; Chen, C.; Chanock, S.J.; Jacques, P.; Selhub, J.; Hunter, D.J. Genome wide significant predictors of metabolites in the one-carbon metabolism pathway. Hum. Mol. Genet. 2009, 18, 4677–4687. [Google Scholar] [CrossRef] [PubMed]
- Tanaka, T.; Scheet, P.; Giusti, B.; Bandinelli, S.; Piras, M.G.; Usala, G.; Lai, S.; Mulas, A.; Corsi, A.M.; Vestrini, A.; et al. Genome-wide association study of vitamin B6, vitamin B12, folate, and homocysteine blood concentrations. Am. J. Hum. Genet. 2009, 84, 477–482. [Google Scholar] [CrossRef] [PubMed]
- R Core Team. R: A Language and Environment for Statistical Computing. R Foundation for Statistical Computing, Vienna, Austria. 2021. Available online: https://www.R-project.org/ (accessed on 2 June 2023).
- Gonzalez, J.R.; Moreno, V. SNPassoc: SNPs-Based Whole Genome Association Studies. R package Version 2.0–2. 2020. Available online: https://CRAN.R-project.org/package=SNPassoc (accessed on 18 April 2024).
- Patil, I. Visualizations with statistical details: The g‘gstatsplot’ approach. J. Open Source Softw. 2021, 6, 3167. [Google Scholar] [CrossRef]
Disclaimer/Publisher’s Note: The statements, opinions and data contained in all publications are solely those of the individual author(s) and contributor(s) and not of MDPI and/or the editor(s). MDPI and/or the editor(s) disclaim responsibility for any injury to people or property resulting from any ideas, methods, instructions or products referred to in the content. |
© 2024 by the authors. Licensee MDPI, Basel, Switzerland. This article is an open access article distributed under the terms and conditions of the Creative Commons Attribution (CC BY) license (https://creativecommons.org/licenses/by/4.0/).