

Composite Graph Neural Networks for Molecular Property Prediction

 ,
,  ,
,  , , and
Abstract
:1. Introduction
2. Results
3. Discussion
4. Materials and Methods
4.1. Datasets
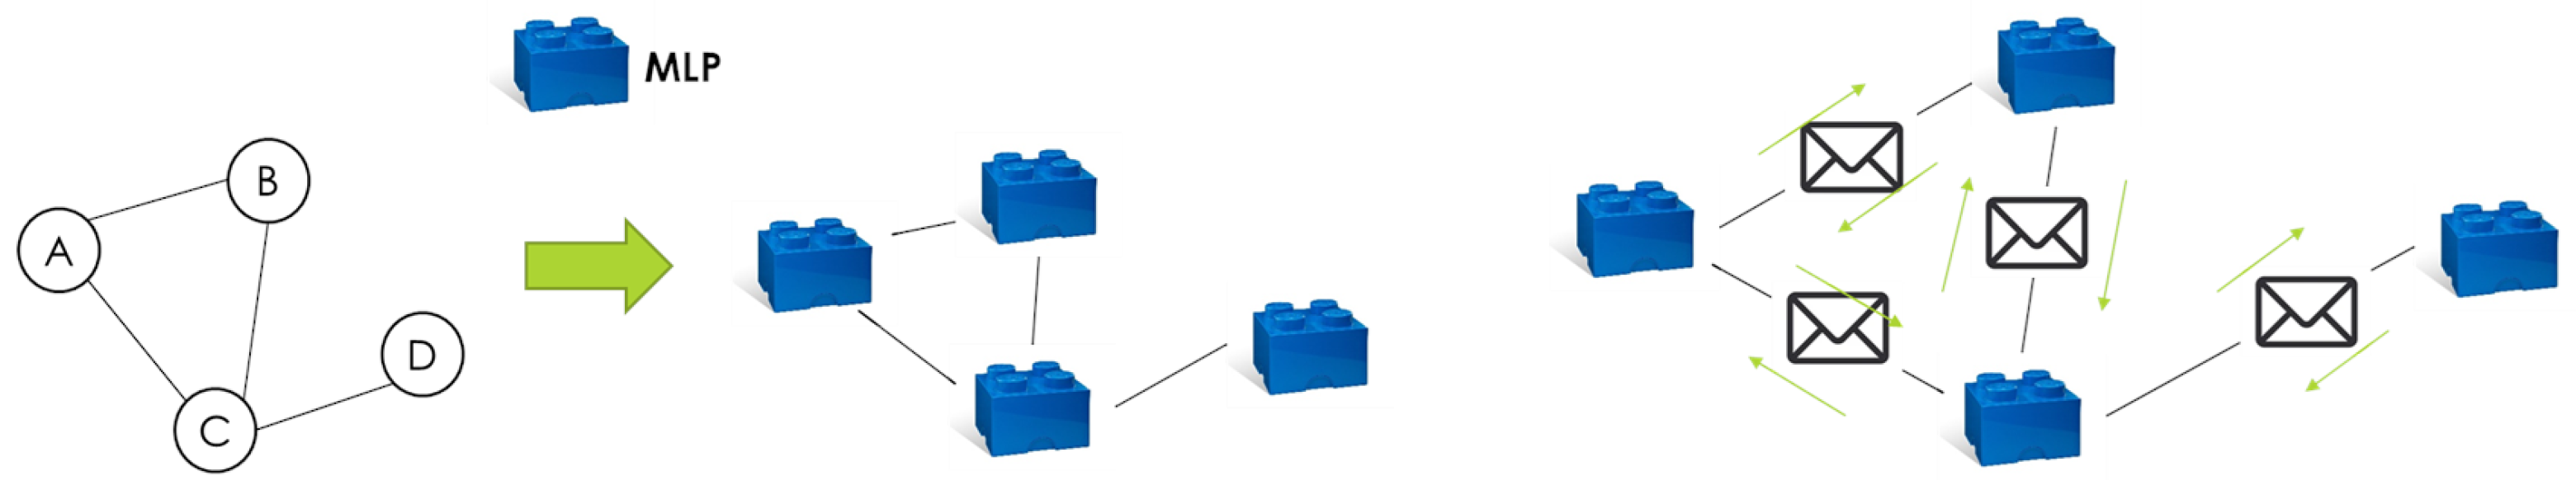
4.2. Model
4.3. Experiments
Author Contributions
Funding
Informed Consent Statement
Data Availability Statement
Conflicts of Interest
Abbreviations
| MDPI | Multidisciplinary Digital Publishing Institute |
| OGB | Open Graph Benchmark |
| MPNN | Message Passing Neural Network |
| GNN | Graph Neural Network |
| LGNN | Layered Graph Neural Network |
| CGNN | Composite Graph Neural Network |
| GCN | Graph Convolutional Network |
| GAT | Graph Attention Network |
| GIN | Graph Isomorphism Network |
| LSTM | Long Short Term Memory |
| RMSE | Root Mean Squared Error |
| TPR | True Positive Rate |
| FPR | False Positive Rate |
| AP | Average Precision |
| AUROC | Area Under the Receiver Operating characteristic Curve |
References
- Scarselli, F.; Gori, M.; Tsoi, A.C.; Hagenbuchner, M.; Monfardini, G. The Graph Neural Network Model. IEEE Trans. Neural Netw. 2009, 20, 61–80. [Google Scholar] [CrossRef] [PubMed]
- Weisfeiler, B.; Leman, A. The reduction of a graph to canonical form and the algebra which appears therein. NTI Ser. 1968, 2, 12–16. [Google Scholar]
- Xu, K.; Hu, W.; Leskovec, J.; Jegelka, S. How Powerful are Graph Neural Networks? In Proceedings of the ICLR 2018, Vancouver, BC, Canada, 30 April–3 May 2018. [Google Scholar]
- Zhou, J.; Cui, G.; Hu, S.; Zhang, Z.; Yang, C.; Liu, Z.; Wang, L.; Li, C.; Sun, M. Graph neural networks: A review of methods and applications. AI Open 2020, 1, 57–81. [Google Scholar] [CrossRef]
- Pradhyumna, P.; Shreya, G.P. Graph neural network (GNN) in image and video understanding using deep learning for computer vision applications 2021. In Proceedings of the Second International Conference on Electronics and Sustainable Communication Systems (ICESC), Coimbatore, India, 4–6 August 2021. [Google Scholar]
- Liang, F.; Qian, C.; Yu, W.; Griffith, D.; Golmie, N. Survey of graph neural networks and applications. Wirel. Commun. Mob. Comput. 2022, 1, 9261537. [Google Scholar]
- Wu, Z.; Pan, S.; Chen, F.; Long, G.; Zhang, C.; Yu, P.S. A comprehensive survey on graph neural networks. IEEE Trans. Neural Networks Learn. Syst. 2020, 32, 4–24. [Google Scholar] [CrossRef] [PubMed]
- Kipf, T.N.; Welling, M. Semi–Supervised Classification with Graph Convolutional Networks. In Proceedings of the ICLR 2017, Toulon, France, 24–26 April 2017. [Google Scholar]
- Bruna, J.; Zaremba, W.; Szlam, A.; LeCun, Y. Spectral networks and deep locally connected networks on graphs. In Proceedings of the 2nd International Conference on Learning Representations, ICLR 2014, Banff, AB, Canada, 14–16 April 2014. [Google Scholar]
- Defferrard, M.; Bresson, X.; Vandergheynst, P. Convolutional neural networks on graphs with fast localized spectral filtering. In Proceedings of the Advances in Neural Information Processing Systems, Barcelona, Spain, 5–10 December 2016; pp. 3844–3852. [Google Scholar]
- Veličković, P.; Cucurull, G.; Casanova, A.; Romero, A.; Liò, P.; Bengio, Y. Graph attention networks. Stat 2017, 1050, 10–48550. [Google Scholar]
- Hamilton, W.; Ying, Z.; Leskovec, J. Inductive representation learning on large graphs. In Proceedings of the Advances in Neural Information Processing Systems, Long Beach, CA, USA, 4–9 December 2017; pp. 1024–1034. [Google Scholar]
- Gilmer, J.; Schoenholz, S.S.; Riley, P.F.; Vinyals, O.; Dahl, G.E. Neural message passing for Quantum chemistry. In Proceedings of the 34th International Conference on Machine Learning, Sydney, Australia, 6–11 August 2017; Volume 70, pp. 1263–1272. [Google Scholar]
- Guo, Z.; Wang, H. A deep graph neural network-based mechanism for social recommendations. IEEE Trans. Ind. Inform. 2020, 17, 2776–2783. [Google Scholar] [CrossRef]
- Lam, R.; Sanchez-Gonzalez, A.; Willson, M.; Wirnsberger, P.; Fortunato, M.; Alet, F.; Ravuri, S.; Ewalds, T.; Eaton-Rosen, Z.; Hu, W.; et al. GraphCast: Learning skillful medium-range global weather forecasting. arXiv 2022, arXiv:2212.12794. [Google Scholar]
- Owerko, D.; Gama, F.; Ribeiro, A. Optimal power flow using graph neural networks. In Proceedings of the ICASSP 2020—2020 IEEE International Conference on Acoustics, Speech and Signal Processing (ICASSP), Barcelona, Spain, 4–8 May 2020; pp. 5930–5934. [Google Scholar]
- Rusek, K.; Suárez-Varela, J.; Almasan, P.; Barlet-Ros, P.; Cabellos-Aparicio, A. RouteNet: Leveraging graph neural networks for network modeling and optimization in SDN. IEEE J. Sel. Areas Commun. 2020, 38, 2260–2270. [Google Scholar] [CrossRef]
- Kim, J.; Park, S.; Min, D.; Kim, W. Comprehensive Survey of Recent Drug Discovery Using Deep Learning. Int. J. Mol. Sci. 2021, 22, 9983. [Google Scholar] [CrossRef] [PubMed]
- Bianchi, F.M.; Grattarola, D.; Livi, L.; Alippi, C. Hierarchical representation learning in graph neural networks with node decimation pooling. IEEE Trans. Neural Netw. Learn. Syst. 2020, 33, 2195–2207. [Google Scholar] [CrossRef] [PubMed]
- Wu, B.; Liu, Y.; Lang, B.; Huang, L. DGCNN: Disordered graph convolutional neural network based on the gaussian mixture model. Neurocomputing 2018, 321, 346–356. [Google Scholar] [CrossRef]
- Lee, J.B.; Rossi, R.; Kong, X. Graph classification using structural attention. In Proceedings of the 24th ACM SIGKDD International Conference on Knowledge Discovery & Data Mining, London, UK, 19–23 August 2018; pp. 1666–1674. [Google Scholar]
- Pancino, N.; Rossi, A.; Ciano, G.; Giacomini, G.; Bonechi, S.; Andreini, P.; Scarselli, F.; Bianchini, M.; Bongini, P. Graph Neural Networks for the Prediction of Protein–Protein Interfaces. In Proceedings of the ESANN 2020, Bruges, Belgium, 22–24 April 2020; pp. 127–132. [Google Scholar]
- Pancino, N.; Bongini, P.; Scarselli, F.; Bianchini, M. GNNkeras: A Keras–based library for Graph Neural Networks and homogeneous and heterogeneous graph processing. SoftwareX 2022, 18, 101061. [Google Scholar] [CrossRef]
- Bongini, P.; Pancino, N.; Scarselli, F.; Bianchini, M. BioGNN: How Graph Neural Networks Can Solve Biological Problems. In Artificial Intelligence and Machine Learning for Healthcare: Vol. 1: Image and Data Analytics; Artificial Intelligence and Machine Learning for Healthcare; Springer International Publishing: Cham, Switzerland, 2023; Chapter 11; pp. 211–231. [Google Scholar]
- Bongini, P.; Bianchini, M.; Scarselli, F. Molecular generative Graph Neural Networks for Drug Discovery. Neurocomputing 2021, 450, 242–252. [Google Scholar] [CrossRef]
- Bongini, P. Graph Neural Networks for Drug Discovery: An Integrated Decision Support Pipeline. In Proceedings of the 2023 IEEE International Conference on Metrology for eXtended Reality, Artificial Intelligence and Neural Engineering (MetroXRAINE), Milano, Italy, 25–27 October 2023; Volume 1, pp. 218–223. [Google Scholar] [CrossRef]
- Bongini, P.; Scarselli, F.; Bianchini, M.; Dimitri, G.M.; Pancino, N.; Liò, P. Modular Multi–Source Prediction of Drug Side–Effects with DruGNN. IEEE/ACM Trans. Comput. Biol. Bioinform. 2023, 20, 1211–1220. [Google Scholar] [CrossRef] [PubMed]
- Bongini, P.; Messori, E.; Pancino, N.; Bianchini, M. A Deep Learning Approach to the Prediction of Drug Side–Effects on Molecular Graphs. In IEEE/ACM Transactions on Computational Biology and Bioinformatics; IEEE: Washington, DC, USA, 2023. [Google Scholar]
- Guerranti, F.; Mannino, M.; Baccini, F.; Bongini, P.; Pancino, N.; Visibelli, A.; Marziali, S. CaregiverMatcher: Graph neural networks for connecting caregivers of rare disease patients. Procedia Comput. Sci. 2021, 192, 1696–1704. [Google Scholar] [CrossRef]
- Hu, W.; Fey, M.; Zitnik, M.; Dong, Y.; Ren, H.; Liu, B.; Catasta, M.; Leskovec, J. Open graph benchmark: Datasets for machine learning on graphs. Adv. Neural Inf. Process. Syst. 2020, 33, 22118–22133. [Google Scholar]
- Ying, C.; Cai, T.; Luo, S.; Zheng, S.; Ke, G.; He, D.; Shen, Y.; Liu, T.Y. Do transformers really perform badly for graph representation? Adv. Neural Inf. Process. Syst. 2021, 34, 28877–28888. [Google Scholar]
- Wu, Z.; Ramsundar, B.; Feinberg, E.N.; Gomes, J.; Geniesse, C.; Pappu, A.S.; Leswing, K.; Pande, V. MoleculeNet: A benchmark for molecular machine learning. Chem. Sci. 2018, 9, 513–530. [Google Scholar] [CrossRef] [PubMed]
- Bongini, P. Graph Neural Networks for Molecular Data. Ph.D. Thesis, University of Florence, Firenze, Italy, 2022. [Google Scholar]
- Kingma, D.P.; Ba, J. Adam: A method for stochastic optimization (2014). arXiv 2017, arXiv:1412.6980. [Google Scholar]

| Dataset | Best GNN | Best CGNN | ||||||||
|---|---|---|---|---|---|---|---|---|---|---|
| ILR | HS | HO | SD | AF | ILR | HS | HO | SD | AF | |
| HIV | 30 | 70 | 10 | tanh | 50 | 20 | 5 | tanh | ||
| FreeSolv | 20 | 40 | 30 | tanh | 10 | 100 | 30 | selu | ||
| Tox-21 | 50 | 20 | 15 | relu | 50 | 40 | 30 | relu | ||
| BACE | 50 | 20 | 10 | relu | 30 | 20 | 30 | selu | ||
| BBBP | 10 | 40 | 10 | tanh | 20 | 20 | 15 | relu | ||
| ClinTox | 50 | 40 | 10 | selu | 30 | 70 | 15 | relu | ||
| MUV | 30 | 20 | 3 | selu | 50 | 70 | 10 | relu | ||
| Sider | 50 | 100 | 5 | selu | 10 | 40 | 15 | relu | ||
| Dataset | Metric | GNN | CGNN |
|---|---|---|---|
| HIV | AUROC | ||
| FreeSolv | RMSE | ||
| Tox-21 | AUROC | ||
| BACE | AUROC | ||
| BBBP | AUROC | ||
| ClinTox | AUROC | ||
| MUV | AP | ||
| Sider | AUROC |
| Dataset | SotA Method | Metric | SotA | CGNN |
|---|---|---|---|---|
| HIV | Graphormer + FPs [31] | AUROC | ||
| FreeSolv | GIN [30] | RMSE | ||
| Tox-21 | GIN citeOGB | AUROC | ||
| BACE | GCN [30] | AUROC | ||
| BBBP | GIN [30] | AUROC | ||
| ClinTox | GCN [30] | AUROC | ||
| MUV | GCN [30] | AP | ||
| Sider | GCN [30] | AUROC |
| Dataset | Graphs | Tasks | Task Type |
|---|---|---|---|
| HIV | 41,127 | 1 | Binary Classification |
| FreeSolv | 642 | 1 | Regression |
| Tox-21 | 7831 | 12 | Binary Classification |
| BACE | 1513 | 1 | Binary Classification |
| BBBP | 2039 | 1 | Binary Classification |
| ClinTox | 1477 | 2 | Binary Classification |
| MUV | 93,087 | 17 | Binary Classification |
| Sider | 1427 | 27 | Binary Classification |
| Hyperparameter | Values |
|---|---|
| ILR | |
| HS | 10, 20, 30, 50 |
| HO | 20, 40, 70, 100 |
| SD | 3, 5, 10, 15, 30 |
| AF |
Disclaimer/Publisher’s Note: The statements, opinions and data contained in all publications are solely those of the individual author(s) and contributor(s) and not of MDPI and/or the editor(s). MDPI and/or the editor(s) disclaim responsibility for any injury to people or property resulting from any ideas, methods, instructions or products referred to in the content. |
© 2024 by the authors. Licensee MDPI, Basel, Switzerland. This article is an open access article distributed under the terms and conditions of the Creative Commons Attribution (CC BY) license (https://creativecommons.org/licenses/by/4.0/).
Share and Cite
Bongini, P.; Pancino, N.; Bendjeddou, A.; Scarselli, F.; Maggini, M.; Bianchini, M. Composite Graph Neural Networks for Molecular Property Prediction. Int. J. Mol. Sci. 2024, 25, 6583. https://doi.org/10.3390/ijms25126583
Bongini P, Pancino N, Bendjeddou A, Scarselli F, Maggini M, Bianchini M. Composite Graph Neural Networks for Molecular Property Prediction. International Journal of Molecular Sciences. 2024; 25(12):6583. https://doi.org/10.3390/ijms25126583
Chicago/Turabian StyleBongini, Pietro, Niccolò Pancino, Asma Bendjeddou, Franco Scarselli, Marco Maggini, and Monica Bianchini. 2024. "Composite Graph Neural Networks for Molecular Property Prediction" International Journal of Molecular Sciences 25, no. 12: 6583. https://doi.org/10.3390/ijms25126583