

Natural-Target-Mimicking Translocation-Based Fluorescent Sensor for Detection of SARS-CoV-2 PLpro Protease Activity and Virus Infection in Living Cells

 , ,
, ,  and
and 
Abstract
1. Introduction
2. Results
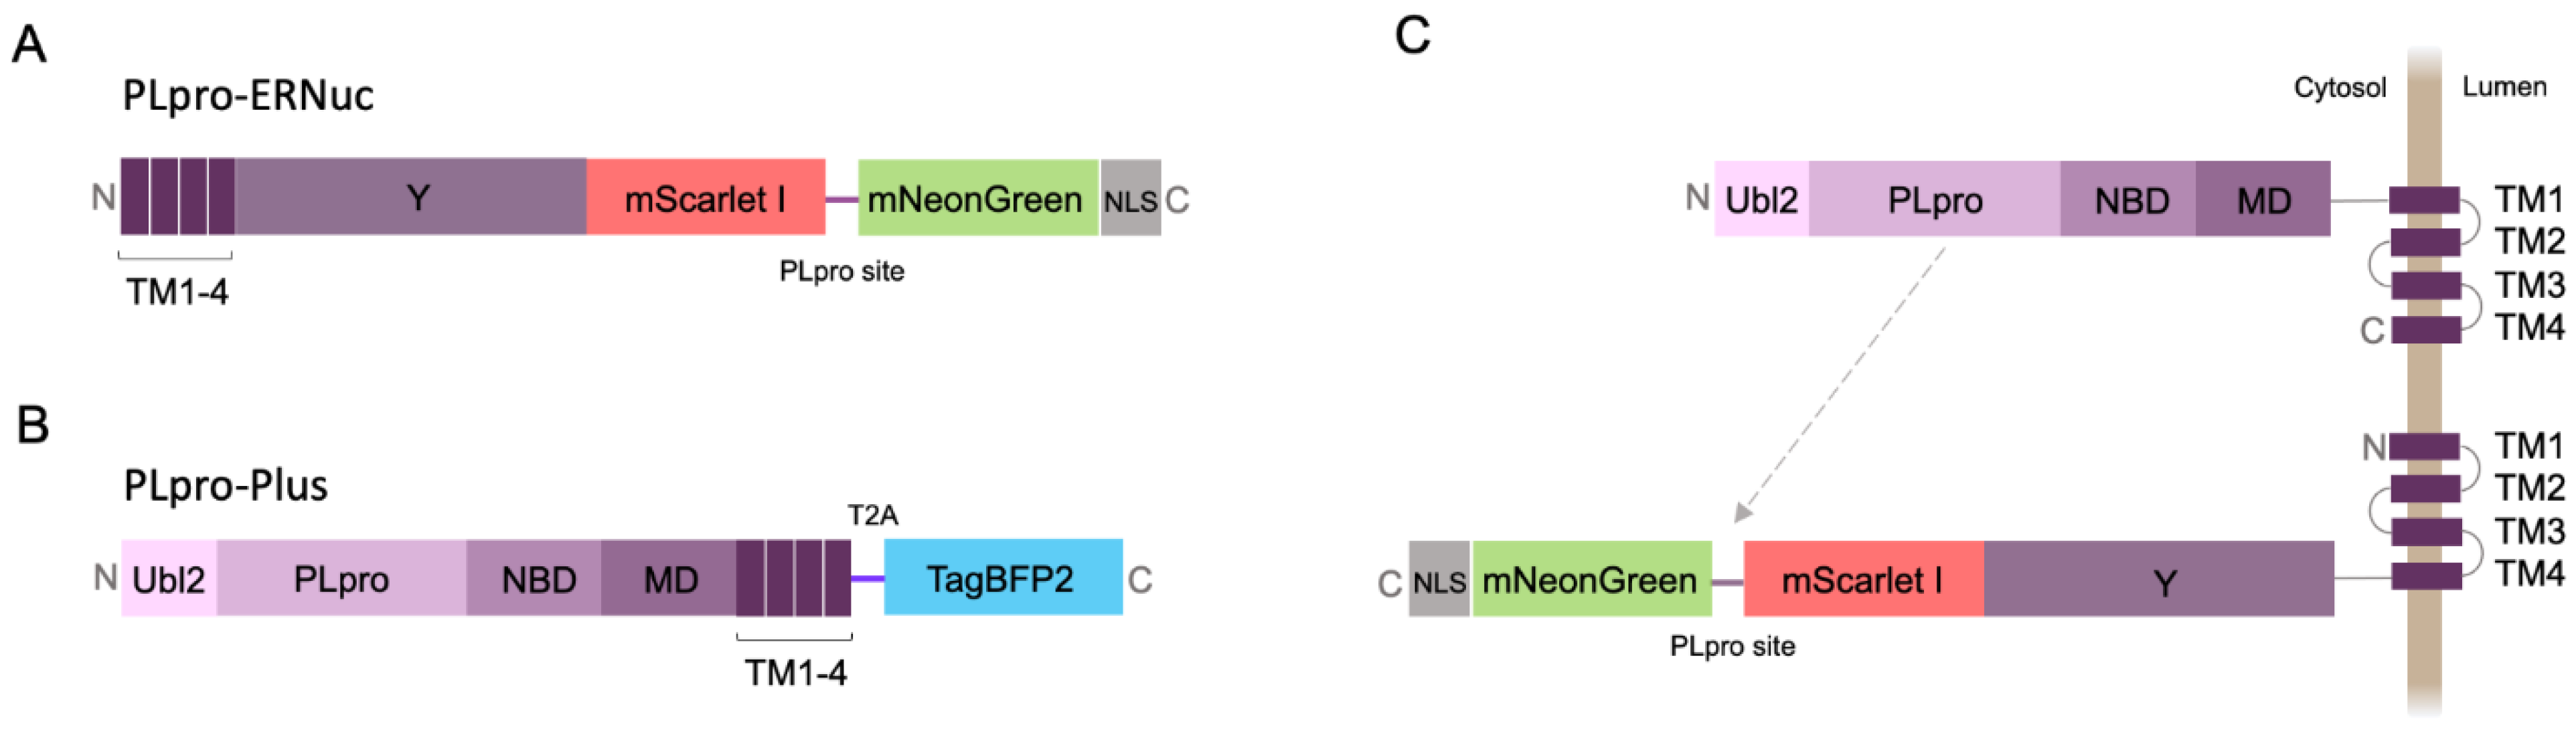
2.1. Sensor Design
2.2. Testing PLpro-ERNuc Sensor in Cells Expressing Recombinant PLpro
2.3. Testing PLpro-ERNuc Sensor in the Model of SARS-CoV-2 Infection of Cultured Cells
3. Discussion
4. Materials and Methods
4.1. General Methods and Materials
4.2. DNA Cloning
4.3. Cell Culture and Transfection
4.4. Lentivirus Production and Stable HeLa Cell Line Generation
4.5. SARS-CoV-2 Infection Assay
4.6. Live Cell Imaging
4.7. Image Analysis
5. Conclusions
Author Contributions
Funding
Institutional Review Board Statement
Informed Consent Statement
Data Availability Statement
Conflicts of Interest
References
- WHO COVID-19 Dashboard. Available online: http://data.who.int (accessed on 4 May 2024).
- Hartenian, E.; Nandakumar, D.; Lari, A.; Ly, M.; Tucker, J.M.; Glaunsinger, B.A. The Molecular Virology of Coronaviruses. J. Biol. Chem. 2020, 295, 12910–12934. [Google Scholar] [CrossRef]
- Arya, R.; Kumari, S.; Pandey, B.; Mistry, H.; Bihani, S.C.; Das, A.; Prashar, V.; Gupta, G.D.; Panicker, L.; Kumar, M. Structural Insights into SARS-CoV-2 Proteins. J. Mol. Biol. 2021, 433, 166725. [Google Scholar] [CrossRef] [PubMed]
- Ullrich, S.; Nitsche, C. SARS-CoV-2 Papain-Like Protease: Structure, Function and Inhibition. Chembiochem 2022, 23, e202200327. [Google Scholar] [CrossRef]
- Osipiuk, J.; Azizi, S.-A.; Dvorkin, S.; Endres, M.; Jedrzejczak, R.; Jones, K.A.; Kang, S.; Kathayat, R.S.; Kim, Y.; Lisnyak, V.G.; et al. Structure of Papain-like Protease from SARS-CoV-2 and Its Complexes with Non-Covalent Inhibitors. Nat. Commun. 2021, 12, 743. [Google Scholar] [CrossRef] [PubMed]
- Ong, I.L.H.; Yang, K.-L. Recent Developments in Protease Activity Assays and Sensors. Analyst 2017, 142, 1867–1881. [Google Scholar] [CrossRef]
- Ma, C.; Sacco, M.D.; Xia, Z.; Lambrinidis, G.; Townsend, J.A.; Hu, Y.; Meng, X.; Szeto, T.; Ba, M.; Zhang, X.; et al. Discovery of SARS-CoV-2 Papain-like Protease Inhibitors through a Combination of High-Throughput Screening and a FlipGFP-Based Reporter Assay. ACS Cent. Sci. 2021, 7, 1245–1260. [Google Scholar] [CrossRef] [PubMed]
- Froggatt, H.M.; Heaton, B.E.; Heaton, N.S. Development of a Fluorescence-Based, High-Throughput SARS-CoV-2 3CLpro Reporter Assay. J. Virol. 2020, 94, 10–1128. [Google Scholar] [CrossRef]
- Zhang, Q.; Schepis, A.; Huang, H.; Yang, J.; Ma, W.; Torra, J.; Zhang, S.-Q.; Yang, L.; Wu, H.; Nonell, S.; et al. Designing a Green Fluorogenic Protease Reporter by Flipping a Beta Strand of GFP for Imaging Apoptosis in Animals. J. Am. Chem. Soc. 2019, 141, 4526–4530. [Google Scholar] [CrossRef]
- Hahn, F.; Häge, S.; Herrmann, A.; Wangen, C.; Kicuntod, J.; Jungnickl, D.; Tillmanns, J.; Müller, R.; Fraedrich, K.; Überla, K.; et al. Methodological Development of a Multi-Readout Assay for the Assessment of Antiviral Drugs against SARS-CoV-2. Pathogens 2021, 10, 1076. [Google Scholar] [CrossRef]
- Jones, C.T.; Catanese, M.T.; Law, L.M.J.; Khetani, S.R.; Syder, A.J.; Ploss, A.; Oh, T.S.; Schoggins, J.W.; MacDonald, M.R.; Bhatia, S.N.; et al. Real-Time Imaging of Hepatitis C Virus Infection Using a Fluorescent Cell-Based Reporter System. Nat. Biotechnol. 2010, 28, 167–171. [Google Scholar] [CrossRef]
- Li, X.; Yang, E.; Li, X.; Fan, T.; Guo, S.; Yang, H.; Wu, B.; Wang, H. MAVS-Based Reporter Systems for Real-Time Imaging of EV71 Infection and Antiviral Testing. Viruses 2023, 15, 1064. [Google Scholar] [CrossRef] [PubMed]
- Choi, H.J.; Park, A.; Kang, S.; Lee, E.; Lee, T.A.; Ra, E.A.; Lee, J.; Lee, S.; Park, B. Human Cytomegalovirus-Encoded US9 Targets MAVS and STING Signaling to Evade Type I Interferon Immune Responses. Nat. Commun. 2018, 9, 125. [Google Scholar] [CrossRef] [PubMed]
- van Huizen, M.; Vendrell, X.M.; de Gruyter, H.L.M.; Boomaars-van der Zanden, A.L.; van der Meer, Y.; Snijder, E.J.; Kikkert, M.; Myeni, S.K. The Main Protease of Middle East Respiratory Syndrome Coronavirus Induces Cleavage of Mitochondrial Antiviral Signaling Protein to Antagonize the Innate Immune Response. Viruses 2024, 16, 256. [Google Scholar] [CrossRef] [PubMed]
- Yang, Y.; Liang, Y.; Qu, L.; Chen, Z.; Yi, M.; Li, K.; Lemon, S.M. Disruption of Innate Immunity due to Mitochondrial Targeting of a Picornaviral Protease Precursor. Proc. Natl. Acad. Sci. USA 2007, 104, 7253–7258. [Google Scholar] [CrossRef] [PubMed]
- Sun, L.; Feng, H.; Misumi, I.; Shirasaki, T.; Hensley, L.; González-López, O.; Shiota, I.; Chou, W.-C.; Ting, J.P.-Y.; Cullen, J.M.; et al. Viral Protease Cleavage of MAVS in Genetically Modified Mice with Hepatitis A Virus Infection. J. Hepatol. 2023, 78, 271–280. [Google Scholar] [CrossRef] [PubMed]
- Wang, B.; Xi, X.; Lei, X.; Zhang, X.; Cui, S.; Wang, J.; Jin, Q.; Zhao, Z. Enterovirus 71 Protease 2Apro Targets MAVS to Inhibit Anti-Viral Type I Interferon Responses. PLoS Pathog. 2013, 9, e1003231. [Google Scholar] [CrossRef] [PubMed]
- Yan, Y.; Wu, L.; Yuan, Y.; Wang, H.; Yin, H.; Li, M.; Chai, L.; Liang, R.; Liu, Y.; Zhao, D.; et al. Species-Specific Cleavage of cGAS by Picornavirus Protease 3C Disrupts Mitochondria DNA-Mediated Immune Sensing. PLoS Pathog. 2023, 19, e1011641. [Google Scholar] [CrossRef] [PubMed]
- Sokolinskaya, E.L.; Putlyaeva, L.V.; Polinovskaya, V.S.; Lukyanov, K.A. Genetically Encoded Fluorescent Sensors for SARS-CoV-2 Papain-like Protease PLpro. Int. J. Mol. Sci. 2022, 23, 7826. [Google Scholar] [CrossRef]
- Subach, O.M.; Cranfill, P.J.; Davidson, M.W.; Verkhusha, V.V. An Enhanced Monomeric Blue Fluorescent Protein with the High Chemical Stability of the Chromophore. PLoS ONE 2011, 6, e28674. [Google Scholar] [CrossRef] [PubMed]
- Ibrahimi, A.; Vande Velde, G.; Reumers, V.; Toelen, J.; Thiry, I.; Vandeputte, C.; Vets, S.; Deroose, C.; Bormans, G.; Baekelandt, V.; et al. Highly Efficient Multicistronic Lentiviral Vectors with Peptide 2A Sequences. Hum. Gene Ther. 2009, 20, 845–860. [Google Scholar] [CrossRef]
- Costantini, L.M.; Baloban, M.; Markwardt, M.L.; Rizzo, M.A.; Guo, F.; Verkhusha, V.V.; Snapp, E.L. A Palette of Fluorescent Proteins Optimized for Diverse Cellular Environments. Nat. Commun. 2015, 6, 7670. [Google Scholar] [CrossRef] [PubMed]
- Smirnova, O.A.; Ivanova, O.N.; Fedyakina, I.T.; Yusubalieva, G.M.; Baklaushev, V.P.; Yanvarev, D.V.; Kechko, O.I.; Mitkevich, V.A.; Vorobyev, P.O.; Fedorov, V.S.; et al. SARS-CoV-2 Establishes a Productive Infection in Hepatoma and Glioblastoma Multiforme Cell Lines. Cancers 2023, 15, 632. [Google Scholar] [CrossRef] [PubMed]
- Şimşek-Yavuz, S.; Komsuoğlu Çelikyurt, F.I. An Update of Anti-Viral Treatment of COVID-19. Turk. J. Med. Sci. 2021, 51, 3372–3390. [Google Scholar]
- Musinova, Y.R.; Lisitsyna, O.M.; Golyshev, S.A.; Tuzhikov, A.I.; Polyakov, V.Y.; Sheval, E.V. Nucleolar Localization/Retention Signal is Responsible for Transient Accumulation of Histone H2B in the Nucleolus Through Electrostatic Interactions. Biochim. Biophys. Acta. 2011, 1813, 27–38. [Google Scholar] [CrossRef] [PubMed]
- Kitamura, A.; Nakayama, Y.; Kinjo, M. Efficient and Dynamic Nuclear Localization of Green Fluorescent Protein via RNA Binding. Biochem. Biophys. Res. Commun. 2015, 463, 401–406. [Google Scholar] [CrossRef] [PubMed]
- Xiao, F.; Fofana, I.; Heydmann, L.; Barth, H.; Soulier, E.; Habersetzer, F.; Doffoël, M.; Bukh, J.; Patel, A.H.; Zeisel, M.B.; et al. Hepatitis C Virus Cell-Cell Transmission and Resistance to Direct-Acting Antiviral Agents. PLoS Pathog. 2014, 10, e1004128. [Google Scholar] [CrossRef] [PubMed]
- Weber, E.; Engler, C.; Gruetzner, R.; Werner, S.; Marillonnet, S. A Modular Cloning System for Standardized Assembly of Multigene Constructs. PLoS ONE 2011, 6, e16765. [Google Scholar] [CrossRef] [PubMed]
- Kim, D.-K.; Knapp, J.J.; Kuang, D.; Chawla, A.; Cassonnet, P.; Lee, H.; Sheykhkarimli, D.; Samavarchi-Tehrani, P.; Abdouni, H.; Rayhan, A.; et al. A Comprehensive, Flexible Collection of SARS-CoV-2 Coding Regions. G3 2020, 10, 3399–3402. [Google Scholar] [CrossRef]
- Yan, W.; Zheng, Y.; Zeng, X.; He, B.; Cheng, W. Structural Biology of SARS-CoV-2: Open the Door for Novel Therapies. Signal Transduct. Target. Ther. 2022, 7, 26. [Google Scholar] [CrossRef]
- Tunitskaya, V.L.; Eliseeva, O.V.; Valuev-Elliston, V.T.; Tyurina, D.A.; Zakirova, N.F.; Khomich, O.A.; Kalis, M.; Latyshev, O.E.; Starodubova, E.S.; Ivanova, O.N.; et al. Prokaryotic Expression, Purification and Immunogenicity in Rabbits of the Small Antigen of Hepatitis Delta Virus. Int. J. Mol. Sci. 2016, 17, 1721. [Google Scholar] [CrossRef]
- Schindelin, J.; Arganda-Carreras, I.; Frise, E.; Kaynig, V.; Longair, M.; Pietzsch, T.; Preibisch, S.; Rueden, C.; Saalfeld, S.; Schmid, B.; et al. Fiji: An Open-Source Platform for Biological-Image Analysis. Nat. Methods 2012, 9, 676–682. [Google Scholar] [CrossRef] [PubMed]


Disclaimer/Publisher’s Note: The statements, opinions and data contained in all publications are solely those of the individual author(s) and contributor(s) and not of MDPI and/or the editor(s). MDPI and/or the editor(s) disclaim responsibility for any injury to people or property resulting from any ideas, methods, instructions or products referred to in the content. |
© 2024 by the authors. Licensee MDPI, Basel, Switzerland. This article is an open access article distributed under the terms and conditions of the Creative Commons Attribution (CC BY) license (https://creativecommons.org/licenses/by/4.0/).
Share and Cite
Sokolinskaya, E.L.; Ivanova, O.N.; Fedyakina, I.T.; Ivanov, A.V.; Lukyanov, K.A. Natural-Target-Mimicking Translocation-Based Fluorescent Sensor for Detection of SARS-CoV-2 PLpro Protease Activity and Virus Infection in Living Cells. Int. J. Mol. Sci. 2024, 25, 6635. https://doi.org/10.3390/ijms25126635
Sokolinskaya EL, Ivanova ON, Fedyakina IT, Ivanov AV, Lukyanov KA. Natural-Target-Mimicking Translocation-Based Fluorescent Sensor for Detection of SARS-CoV-2 PLpro Protease Activity and Virus Infection in Living Cells. International Journal of Molecular Sciences. 2024; 25(12):6635. https://doi.org/10.3390/ijms25126635
Chicago/Turabian StyleSokolinskaya, Elena L., Olga N. Ivanova, Irina T. Fedyakina, Alexander V. Ivanov, and Konstantin A. Lukyanov. 2024. "Natural-Target-Mimicking Translocation-Based Fluorescent Sensor for Detection of SARS-CoV-2 PLpro Protease Activity and Virus Infection in Living Cells" International Journal of Molecular Sciences 25, no. 12: 6635. https://doi.org/10.3390/ijms25126635
APA StyleSokolinskaya, E. L., Ivanova, O. N., Fedyakina, I. T., Ivanov, A. V., & Lukyanov, K. A. (2024). Natural-Target-Mimicking Translocation-Based Fluorescent Sensor for Detection of SARS-CoV-2 PLpro Protease Activity and Virus Infection in Living Cells. International Journal of Molecular Sciences, 25(12), 6635. https://doi.org/10.3390/ijms25126635