Abstract
The serine carboxypeptidase-like (SCPL) gene family plays a crucial role in the regulation of plant growth, development, and stress response through activities such as acyltransferases in plant secondary metabolism pathways. Although SCPL genes have been identified in various plant species, their specific functions and characteristics in soybean (Glycine max) have not yet been studied. We identified and characterized 73 SCPL genes, grouped into three subgroups based on gene structure and phylogenetic relationships. These genes are distributed unevenly across 20 soybean chromosomes and show varied codon usage patterns influenced by both mutation and selection pressures. Gene ontology (GO) enrichment suggests these genes are involved in plant cell wall regulation and stress responses. Expression analysis in various tissues and under stress conditions, including the presence of numerous stress-related cis-acting elements, indicated that these genes have varied expression patterns. This suggests that they play specialized roles such as modulating plant defense mechanisms against nematode infections, enhancing tolerance to drought and high salinity, and responding to cold stress, thereby helping soybean adapt to environmental stresses. Moreover, the expression of specific GmSCPLs was significantly affected following exposure to nematode infection, drought, high salt (NaCl), and cold stresses. Our findings underscore the potential of SCPL genes in enhancing stress resistance in soybean, providing a valuable resource for future genetic improvement and breeding strategies.
1. Introduction
Soybean (Glycine max) is one of the most important crops globally, serving as a fundamental component of agriculture by providing essential protein and oil for human and animal consumption [1,2]. Additionally, soybeans are increasingly used in biodiesel production, a renewable energy source that can reduce reliance on fossil fuels [3]. However, various biotic stressors such as pests, diseases, and weeds, along with abiotic stresses including extreme temperatures, drought, and saline conditions, pose significant threats to soybean yield and quality worldwide [4,5,6,7]. In plant biology, serine carboxypeptidases (SCPs) and their closely related serine carboxypeptidase-like proteins (SCPLs) have drawn considerable interest due to their complex roles in plant growth, development, and responses to various stresses [8,9,10,11,12].
Both SCPs and SCPLs are part of the S10 subgroup within the Serine Carboxypeptidase (SCP) family, noted for their highly conserved α/β hydrolase fold. This structural motif includes a central β-sheet surrounded by α-helices on both sides, creating a sturdy globular shape [13,14]. Typically, SCPL proteins contain a conserved triad of amino acids: Serine, aspartate, and histidine (Ser-Asp-His) [14,15]. Most SCPL proteins, characterized by the PF00450 domain in the Pfam database, share structural features that include four evolutionarily conserved domains involved in substrate binding and catalytic activities, a signal peptide for internal transport or secretion, and several N-linked glycosylation sites [16].
SCPs are proteolytic enzymes that facilitate the cleavage of peptide bonds at the carboxyl terminus of proteins and peptides. In contrast, SCPLs, while structurally similar to SCPs, have adapted to engage in a wider array of biochemical processes, notably the modification of secondary metabolites and the regulation of phytohormones. A notable feature of SCPLs is their important role in plant defense mechanisms [17,18]. It was found that the expression of the OsBISCPL1 gene in rice significantly increased when exposed to defense-related signaling compounds such as salicylic acid (SA) and jasmonic acid (JA) or following bacterial infection [11]. More severe symptoms of Verticillium wilt in cotton (Gossypium hirsutum) were displayed when GhSCPL42 was silenced by virus-induced gene silencing (VIGS) [19]. An increase in proline levels and a reduction in malondialdehyde, leading to enhanced resistance to drought and salt stress, were reported to result from the overexpression of TaSCPL184-6D in Arabidopsis plants [20].
In this study, we conducted a comprehensive examination of the entire SCPL gene family in soybean using the well-established Williams 82 soybean reference genome (https://www.soybase.org/, Wm82.a2.v1), also referred to as Wm82 [21]. We successfully identified and characterized 73 SCPL gene family members within the Wm82 soybean genome. This investigation provides new insights into the SCPL genes by detailing their gene structures, evolutionary relationships, growth patterns, and expression profiles in soybean. Our results not only facilitate further research on SCPL genes in soybean but also contribute to the enhancement of soybean resistance to various stressors through the development of SCPL genes.
2. Results
2.1. Genome-Wide Identification and Analysis of the SCPL Gene Family
SCPL genes were examined in various plant species, including Arabidopsis thaliana, rice (Oryza sativa), and bread wheat (Triticum aestivum), as reported by several studies [20,22,23]. However, the specific functions and characteristics of SCPL genes in soybean (Glycine max) have not been fully explored. The specific locus identifiers and genetic sequences of these genes are comprehensively listed in Supplementary Table S1. A genome-wide search was conducted within the soybean genome using Tbtools to identify all members of the SCPL family. Following this, candidates were verified through the protein family database (Pfam) search and NCBI Batch CDD for functional annotations. In soybean, we identified and characterized a total of 73 serine carboxypeptidase-like (SCPL) genes. These genes were assigned unique identifiers, ranging from GmSCPL1 to GmSCPL73, according to their specific locations on the soybean chromosomes (Table 1). The detailed information about each identified SCPL gene in soybean, including open reading frame (ORF) lengths, amino acid lengths, molecular weights (MWs), theoretical isoelectric points (PIs), numbers of introns, splice variants, and subcellular locations, is provided in Table 1. The ORF lengths of the identified GmSCPLs ranged from 654 base pairs (GmSCPL38, Glyma.12G179400.1) to 1596 base pairs (GmSCPL40, Glyma.13G028800.1). The sizes of the proteins varied from 218 to 532 amino acids, with molecular weights ranging from 18.63 kDa to 59.81 kDa, and PI values between 4.81 (GmSCPL63, Glyma.19G128100.1) and 9.17 (GmSCPL23, Glyma.09G249500.1). The count of introns, along with splice variants, varied from 0 to 13 and 1 to 9, respectively. Subcellular localization prediction, using the Plant-mPLoc tool, indicated that most GmSCPLs are located in the vacuole.

Table 1.
Detailed information of the putative SCPLs in soybean.
2.2. Phylogenetic Analysis of the SCPL Family
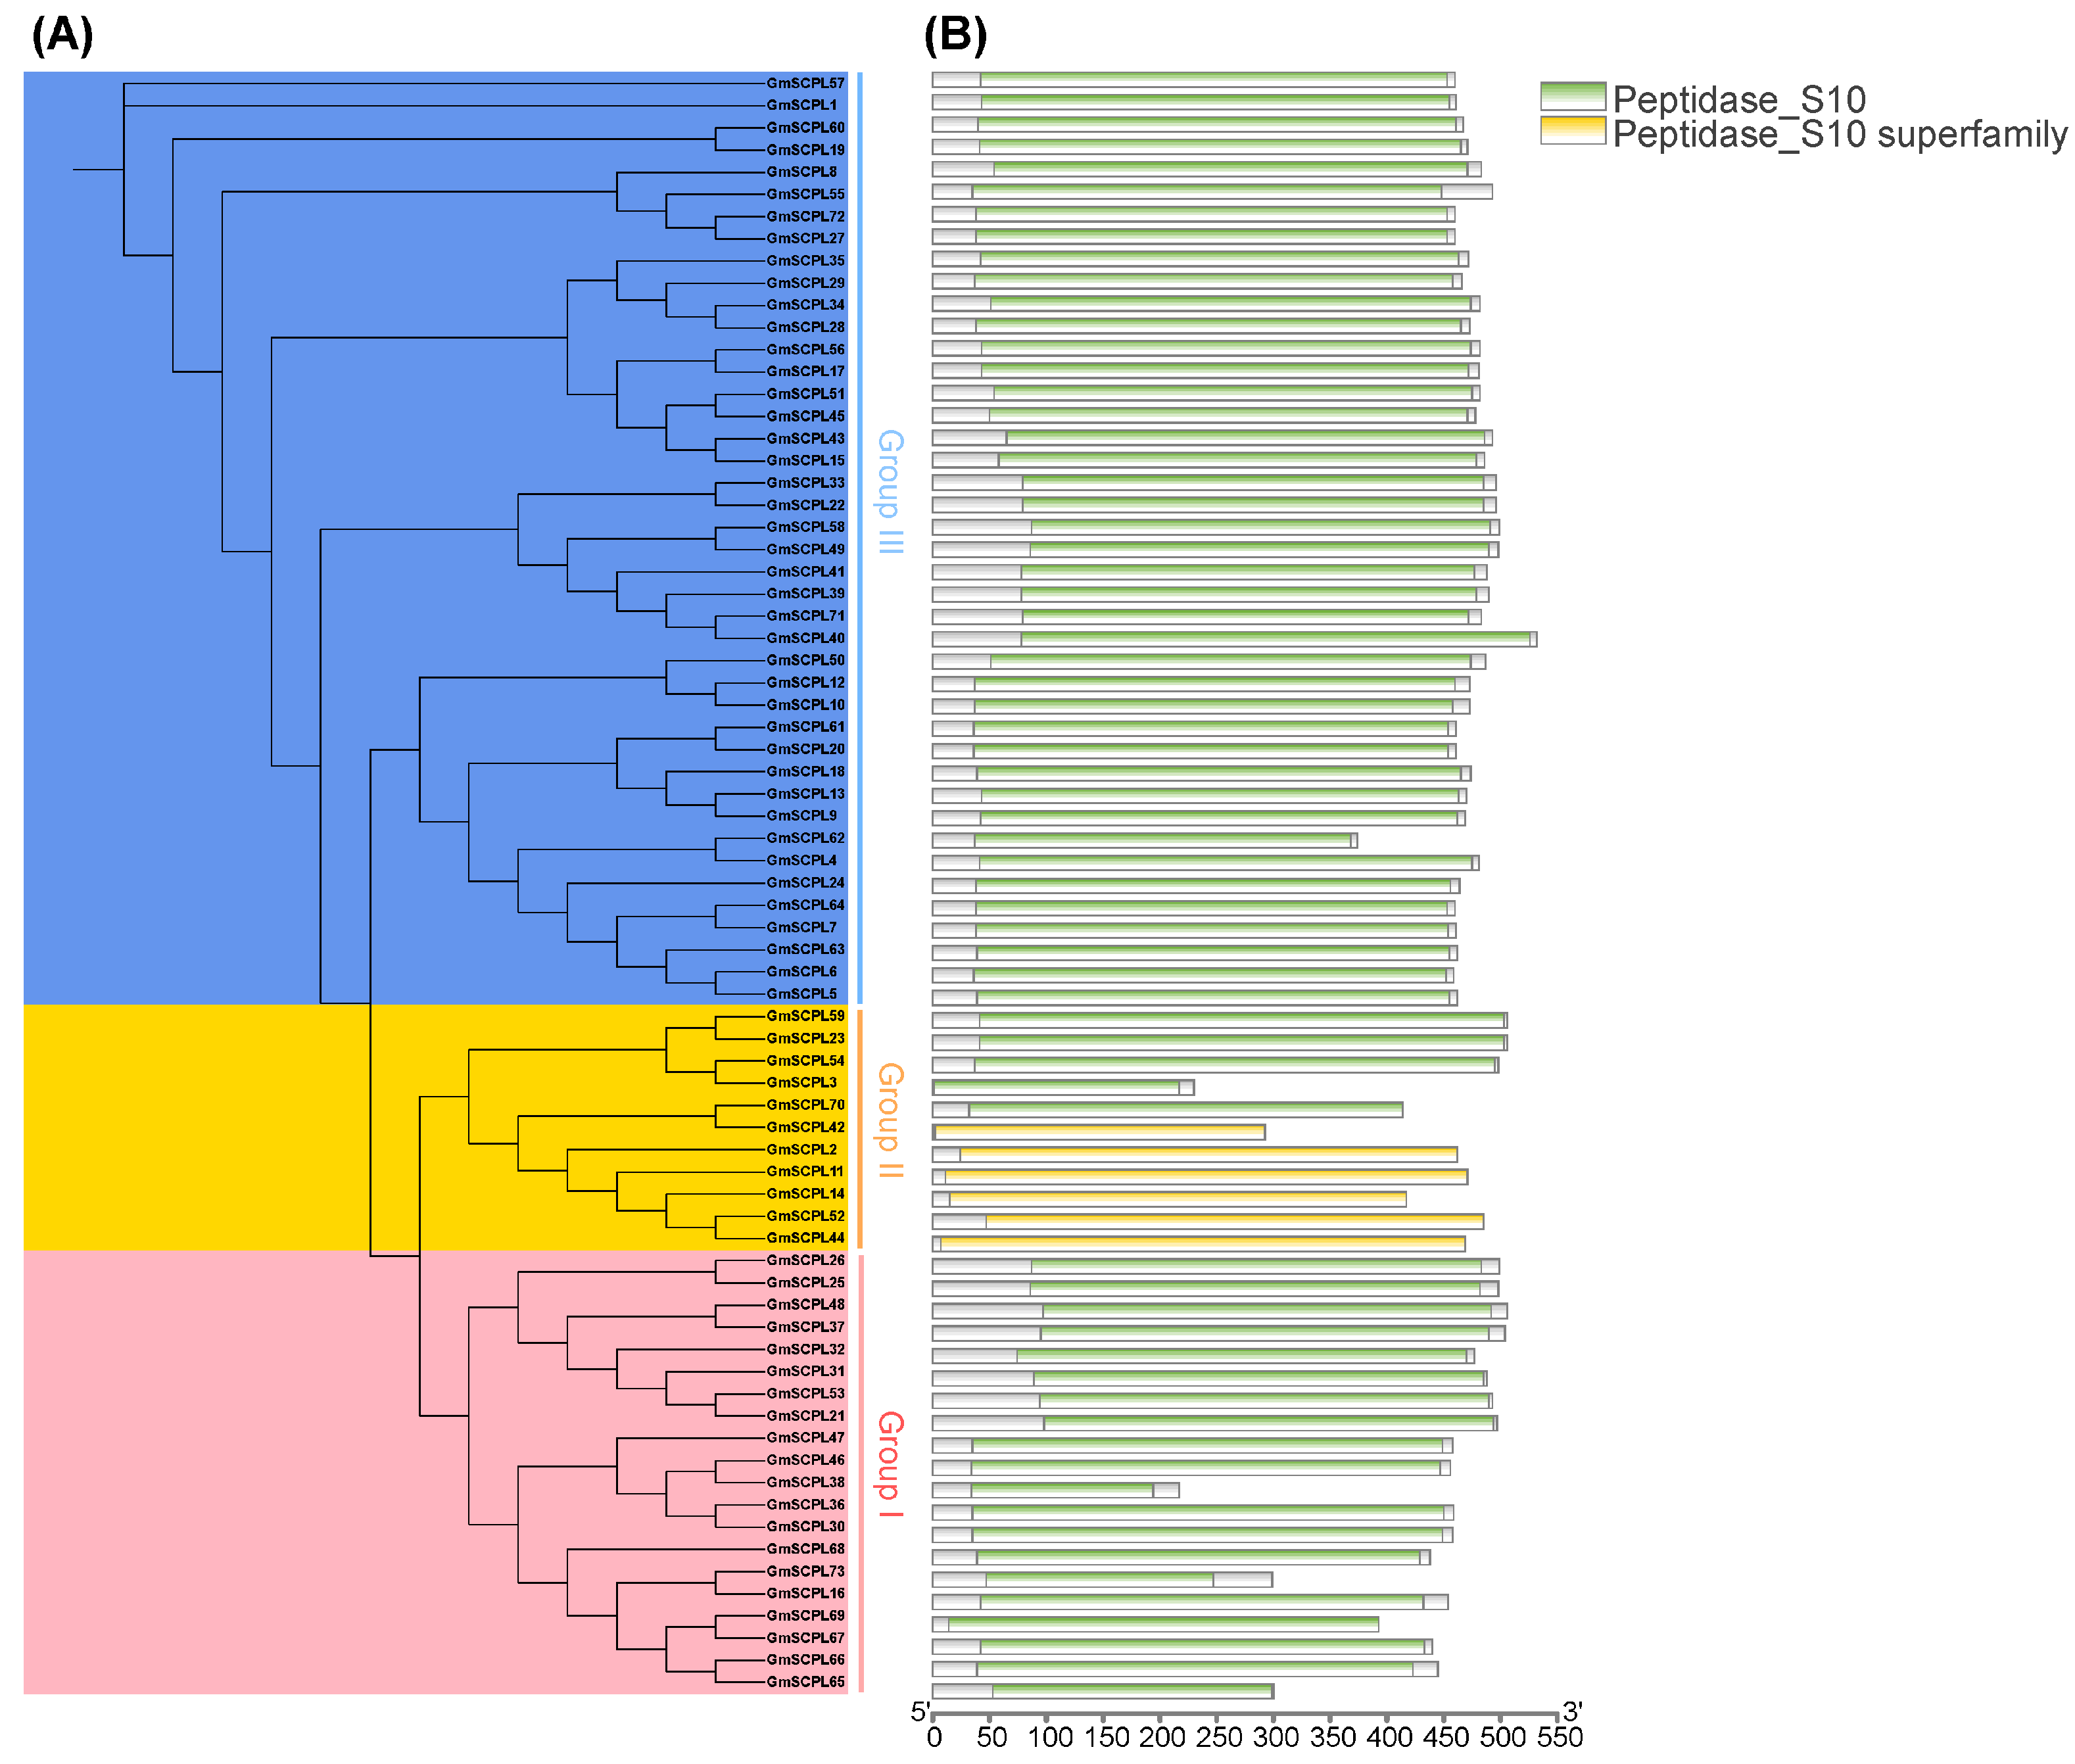
To elucidate the evolutionary relationships among SCPL proteins from GmSCPLs and other well-documented plant SCPLs, we utilized protein sequences from Arabidopsis thaliana, rice (Oryza sativa), bread wheat (Triticum aestivum), soybean (Glycine max), and wild soybean (Glycine soja). These sequences were analyzed to construct a maximum likelihood phylogenetic tree using the IQ-TREE 2.2.5 software(IQ-TREE 2.2.5, Canberra, Australia), employing the Q.pfam+R6 model (Figure 1). Additionally, a separate phylogenetic tree was generated using only the 73 GmSCPL protein sequences, applying the LG+R4 model to further refine our understanding (Figure 2A). NCBI Batch CDD analysis confirmed that each GmSCPL sequence contained one or two conserved S10 regions (Figure 2B). The identified GmSCPLs were classified into three distinct subgroups:Ⅰ, Ⅱ, and Ⅲ, consistent with several previous studies [19,20,23].

Figure 1.
The maximum likelihood (ML) phylogenetic tree was constructed based on the SCPL amino acid sequences in Arabidopsis thaliana, Oryza sativa, Triticum aestivum, Glycine max, and Glycine soja using IQ-TREE 2.2.5 software(Q-TREE 2.2.5, Canberra, Australia) with Q. pfam+R6 model. All SCPLs are divided into three phylogenetic groups.
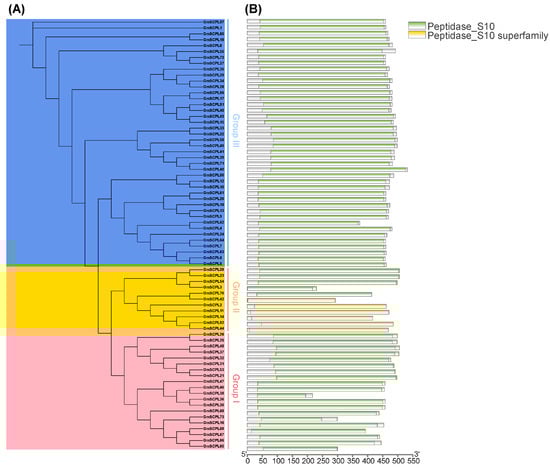
Figure 2.
Phylogenetic and conserved domain analysis of the GmSCPL family. (A) Maximum likelihood (ML) phylogenetic tree of GmSCPLs using IQ-tree with LG+R4 model. All GmSCPLs are divided into three phylogenetic groups. (B) Conserved domains of all identified GmSCPLs.
2.3. Chromosomal Distribution and Gene Duplication of the GmSCPL Family
To investigate the chromosomal distribution characteristics of the GmSCPL family, we analyzed their locations across soybean chromosomes. Figure 3 and Figure S1 show that chromosome 13 harbors the highest number of GmSCPL genes. In contrast, chromosome 2 contains only one GmSCPL gene, highlighting an uneven distribution of the 73 GmSCPLs across the 20 chromosomes of soybean. The distribution pattern of SCPL genes across the chromosomes does not exhibit a strong correlation with gene density, GC content, or GC skew (Figure 3).
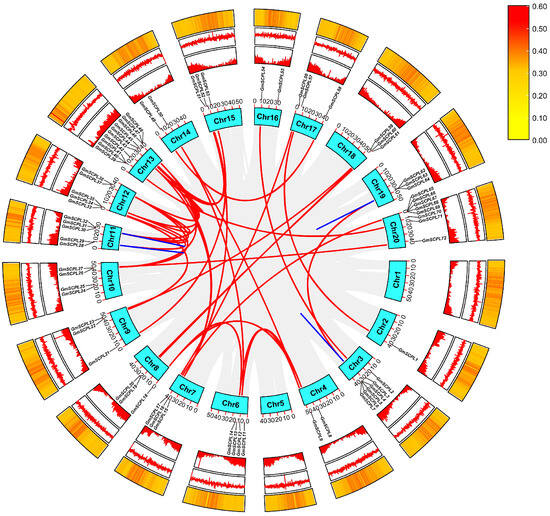
Figure 3.
Chromosome location and gene duplication analysis of GmSCPL genes. Slight gray lines indicate all synteny blocks within soybean genome. The duplicated gene pairs are highlighted with colored lines. Heat map in the inner circle indicates chromosomal gene density; Heat map in the middle circle indicates chromosomal GC skew; Heat map in the outer circle indicates chromosomal GC contents.
The soybean cyst nematode (SCN) is recognized as a significant global threat to soybean production [4,24]. Notably, our analysis revealed that 38.35% (28 out of 73) of the identified GmSCPL genes are located within regions corresponding to known SCN-related quantitative trait loci (QTLs), as shown in Figure S1 and Table S2. Additionally, RNA-seq analysis indicated that the expression of these SCPL genes was significantly induced 5 days post-inoculation with SCN (Figure S2). While this study provides a comprehensive identification and characterization of SCPL genes, future research will focus on real-world verification and functional studies to further elucidate the roles of these genes in soybean’s defense mechanisms against SCN.
2.4. Analysis of SCPL Paralogs and Orthologs
To delve deeper into uncovering the evolutionary links within the SCPL gene family, we conducted a syntenic analysis aimed at identifying SCPL paralogous gene pairs within soybean (G. max) and SCPL orthologous gene pairs between soybean and monocotyledonous plants (O. sativa) as well as dicotyledonous plants (Arabidopsis and G. soja) using Multiple Collinearity Scan Toolkit (MCScanX, Athens, Greece). We identified 40 paralogs in soybean (Gm-Gm) (Table S3). Among these, 33 orthologous gene pairs were detected between Arabidopsis and soybean (Gm-At), 117 orthologous gene pairs between G. soja and soybean (Gm-G. soja), and only eight SCPL orthologous gene pairs between rice and soybean (Gm-Os) (Figure 4). These findings suggest a close linkage between SCPL genes in soybean and those in G. soja, possibly due to their close genetic relationship [25,26,27].
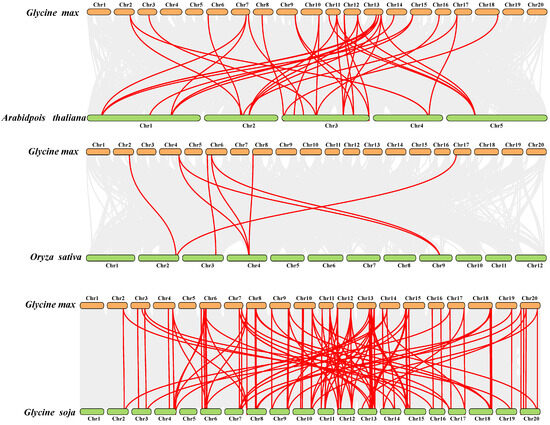
Figure 4.
Syntenic relationships of the SCPL genes in Glycine max and three other species, including Arabidopsis thaliana, Oryza sativa, and Glycine soja.
The Ka/Ks ratio, a crucial parameter reflecting selective pressure on plant genes, was utilized to assess evolutionary patterns [28]. The Ka (non-synonymous substitution rate) measures the rate of amino acid-changing mutations, while the Ks (synonymous substitution rate) measures the rate of mutations that do not change the amino acid sequence. The Ka/Ks ratio indicates the type of selective pressure acting on a gene: A ratio greater than 1 suggests positive selection (adaptive evolution), a ratio equal to 1 suggests neutral evolution, and a ratio less than 1 suggests purifying selection (removal of deleterious mutations) [29]. Divergence time (T) was calculated based on Ks values to estimate the evolutionary time scale of gene duplications. For each SCPL gene pair, we calculated the Ka, Ks, Ka/Ks, and T values. Our analysis revealed that the Ka/Ks ratios of all paralogous genes (Gm-Gm) and most orthologous genes (Gm-G. soja, Gm-Os, and Gm-At) were below 1 (see Tables S3 and S4), indicating that purifying selection plays a dominant role in the evolution of the SCPL family. Additionally, the divergence time (T) of the 40 paralogs (Gm-Gm) ranged from 2.03 to 58.61 million years ago (Mya) (Table S3). The divergence time of orthologs (Gm-G. soja) ranged from 0.09 to 58.6 Mya, while it ranged from 51.41 to 152.16 Mya in Gm-At and from 69.51 to 74.02 Mya in Gm-Os. These results further underscore the closer genetic relationship between soybeans and wild soybeans (G. soja) on an evolutionary scale [30]. It is important to note that these divergence times are specific to the evolutionary history of the SCPL gene family within these plant lineages.
2.5. Analysis of Codon Usage Patterns in SCPL Genes across Plant Species
Each codon uniquely specifies an amino acid, and multiple codons can encode the same amino acid, termed synonymous codons [31,32]. The frequency of usage for these synonymous codons varies significantly among different species and even within different genes, underscoring the importance of codon preference in evolutionary dynamics [33]. We examined codon usage bias (CUB) across five species, including Clycine max, Clycine soja, Oryza sativa, Arabidopsis thaliana, and Triticum aestivum, utilizing identified SCPL CDS sequences, with detailed information provided in Table S5. Our findings revealed that the average GC content and GC3s of SCPL genes ranged from 0.422164384 to 0.575114286 and 0.3610685 to 0.7024667, respectively, across the five species. Notably, the average effective number of codons (ENC) of SCPL genes in monocotyledonous species (O. sativa and T. aestivum) was lower compared to that in dicotyledonous ones (G. max, G. soja, and Arabidopsis) (Table 2), indicating stronger codon usage bias in monocotyledonous plants.
Table 2.
Codon usage indicators of the SCPL family in five different species. Abbreviations: CBI, codon bias index; Fop, frequency of optimal codons; ENC, effective number of codons; and GC3s, contents of G or C bases at the third position of the codons; and GC content, the contents of the G and C bases of the codons.
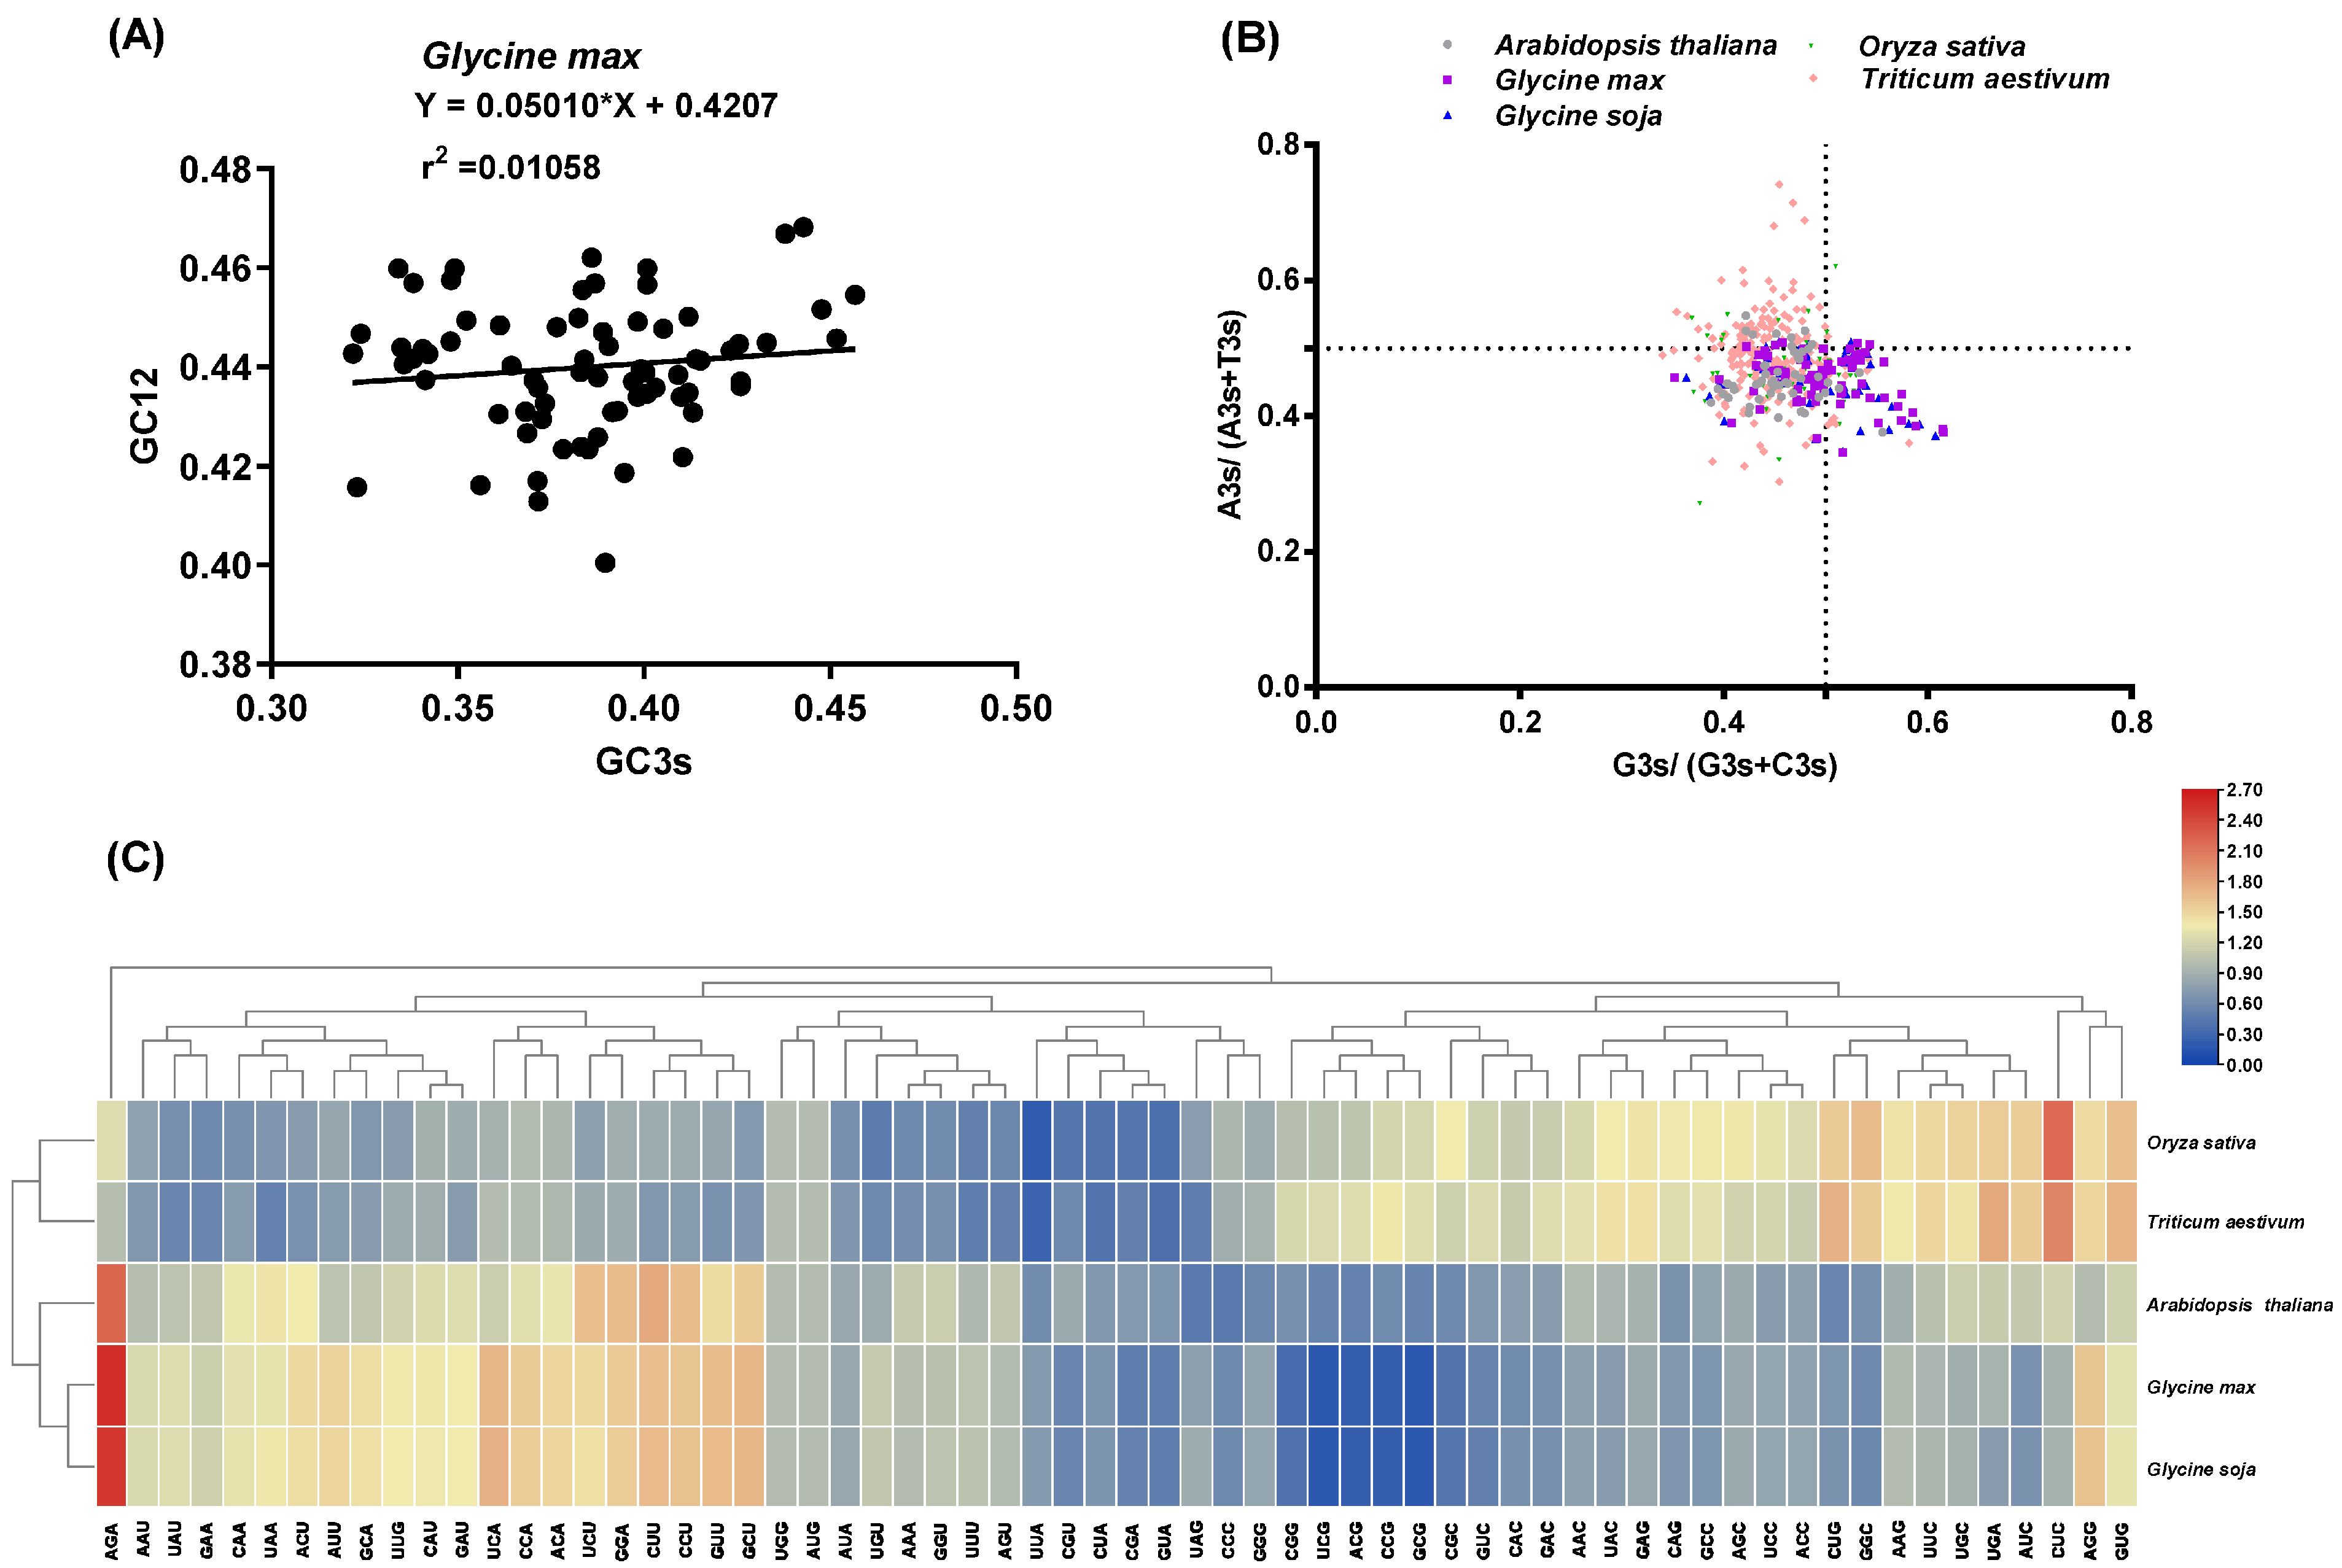
Analysis of relative synonymous codon usage (RSCU) provided insights into CUB [34]. We observed that the RSCU patterns of SCPL genes in G. max and G. soja were similar, whereas those in O. sativa and T. aestivum were clustered (Figure 5C), potentially reflecting their natural evolutionary relationships. Parity rule 2 (PR2) analysis explored GC and AT composition bias at the third codon position [35]. Investigation of PR2 revealed varying ratios of G3s/(G3s+C3s) and A3s/(A3s+T3s) among different species, with most identified SCPL members in the five species preferring C and T over G and A (Figure 5B). Neutral plot analysis confirmed additional factors influencing codon preference beyond base composition. Relatively slight positive correlations between GC3s and GC12 of SCPL gene CDS sequences were observed in G. max (r2 = 0.01058, p < 0.01) (Figure 5A), G. soja (r2 = 0.01346, p < 0.01) (Figure S3A), and Arabidopsis (r2 = 0.4409, p < 0.01) (Figure S3B), indicating that both mutation pressure and natural selection influenced the codon preference of SCPLs in dicots (G. max, G. soja, and Arabidopsis). Interestingly, notably positive correlations between GC3s and GC12 of SCPL gene CDS sequences were evident in rice (r2 = 0.7020, p < 0.01) (Figure S3C) and bread wheat (r2 = 0.6118, p < 0.01) (Figure S3D), likely attributable to their monocot classification.

Figure 5.
Condon usage bias analysis. (A) Neutrality plot analysis of all identified GmSCPLs CDS sequences. (B) Parity rule 2 (PR2) analysis of GmSCPLs CDS sequences in five species including Arabidopsis thaliana, Oryza sativa, Triticum aestivum, Glycine max, and Glycine soja. (C) Heatmap showing relative synonymous codon usage (RSCU) values of five species including Arabidopsis thaliana, Oryza sativa, Triticum aestivum and Glycine max and Glycine soja. Blue-to-red color indicates low-to-high RSCU values of codons.
2.6. Analysis of Conserved Motifs and Gene Structure in GmSCPLs
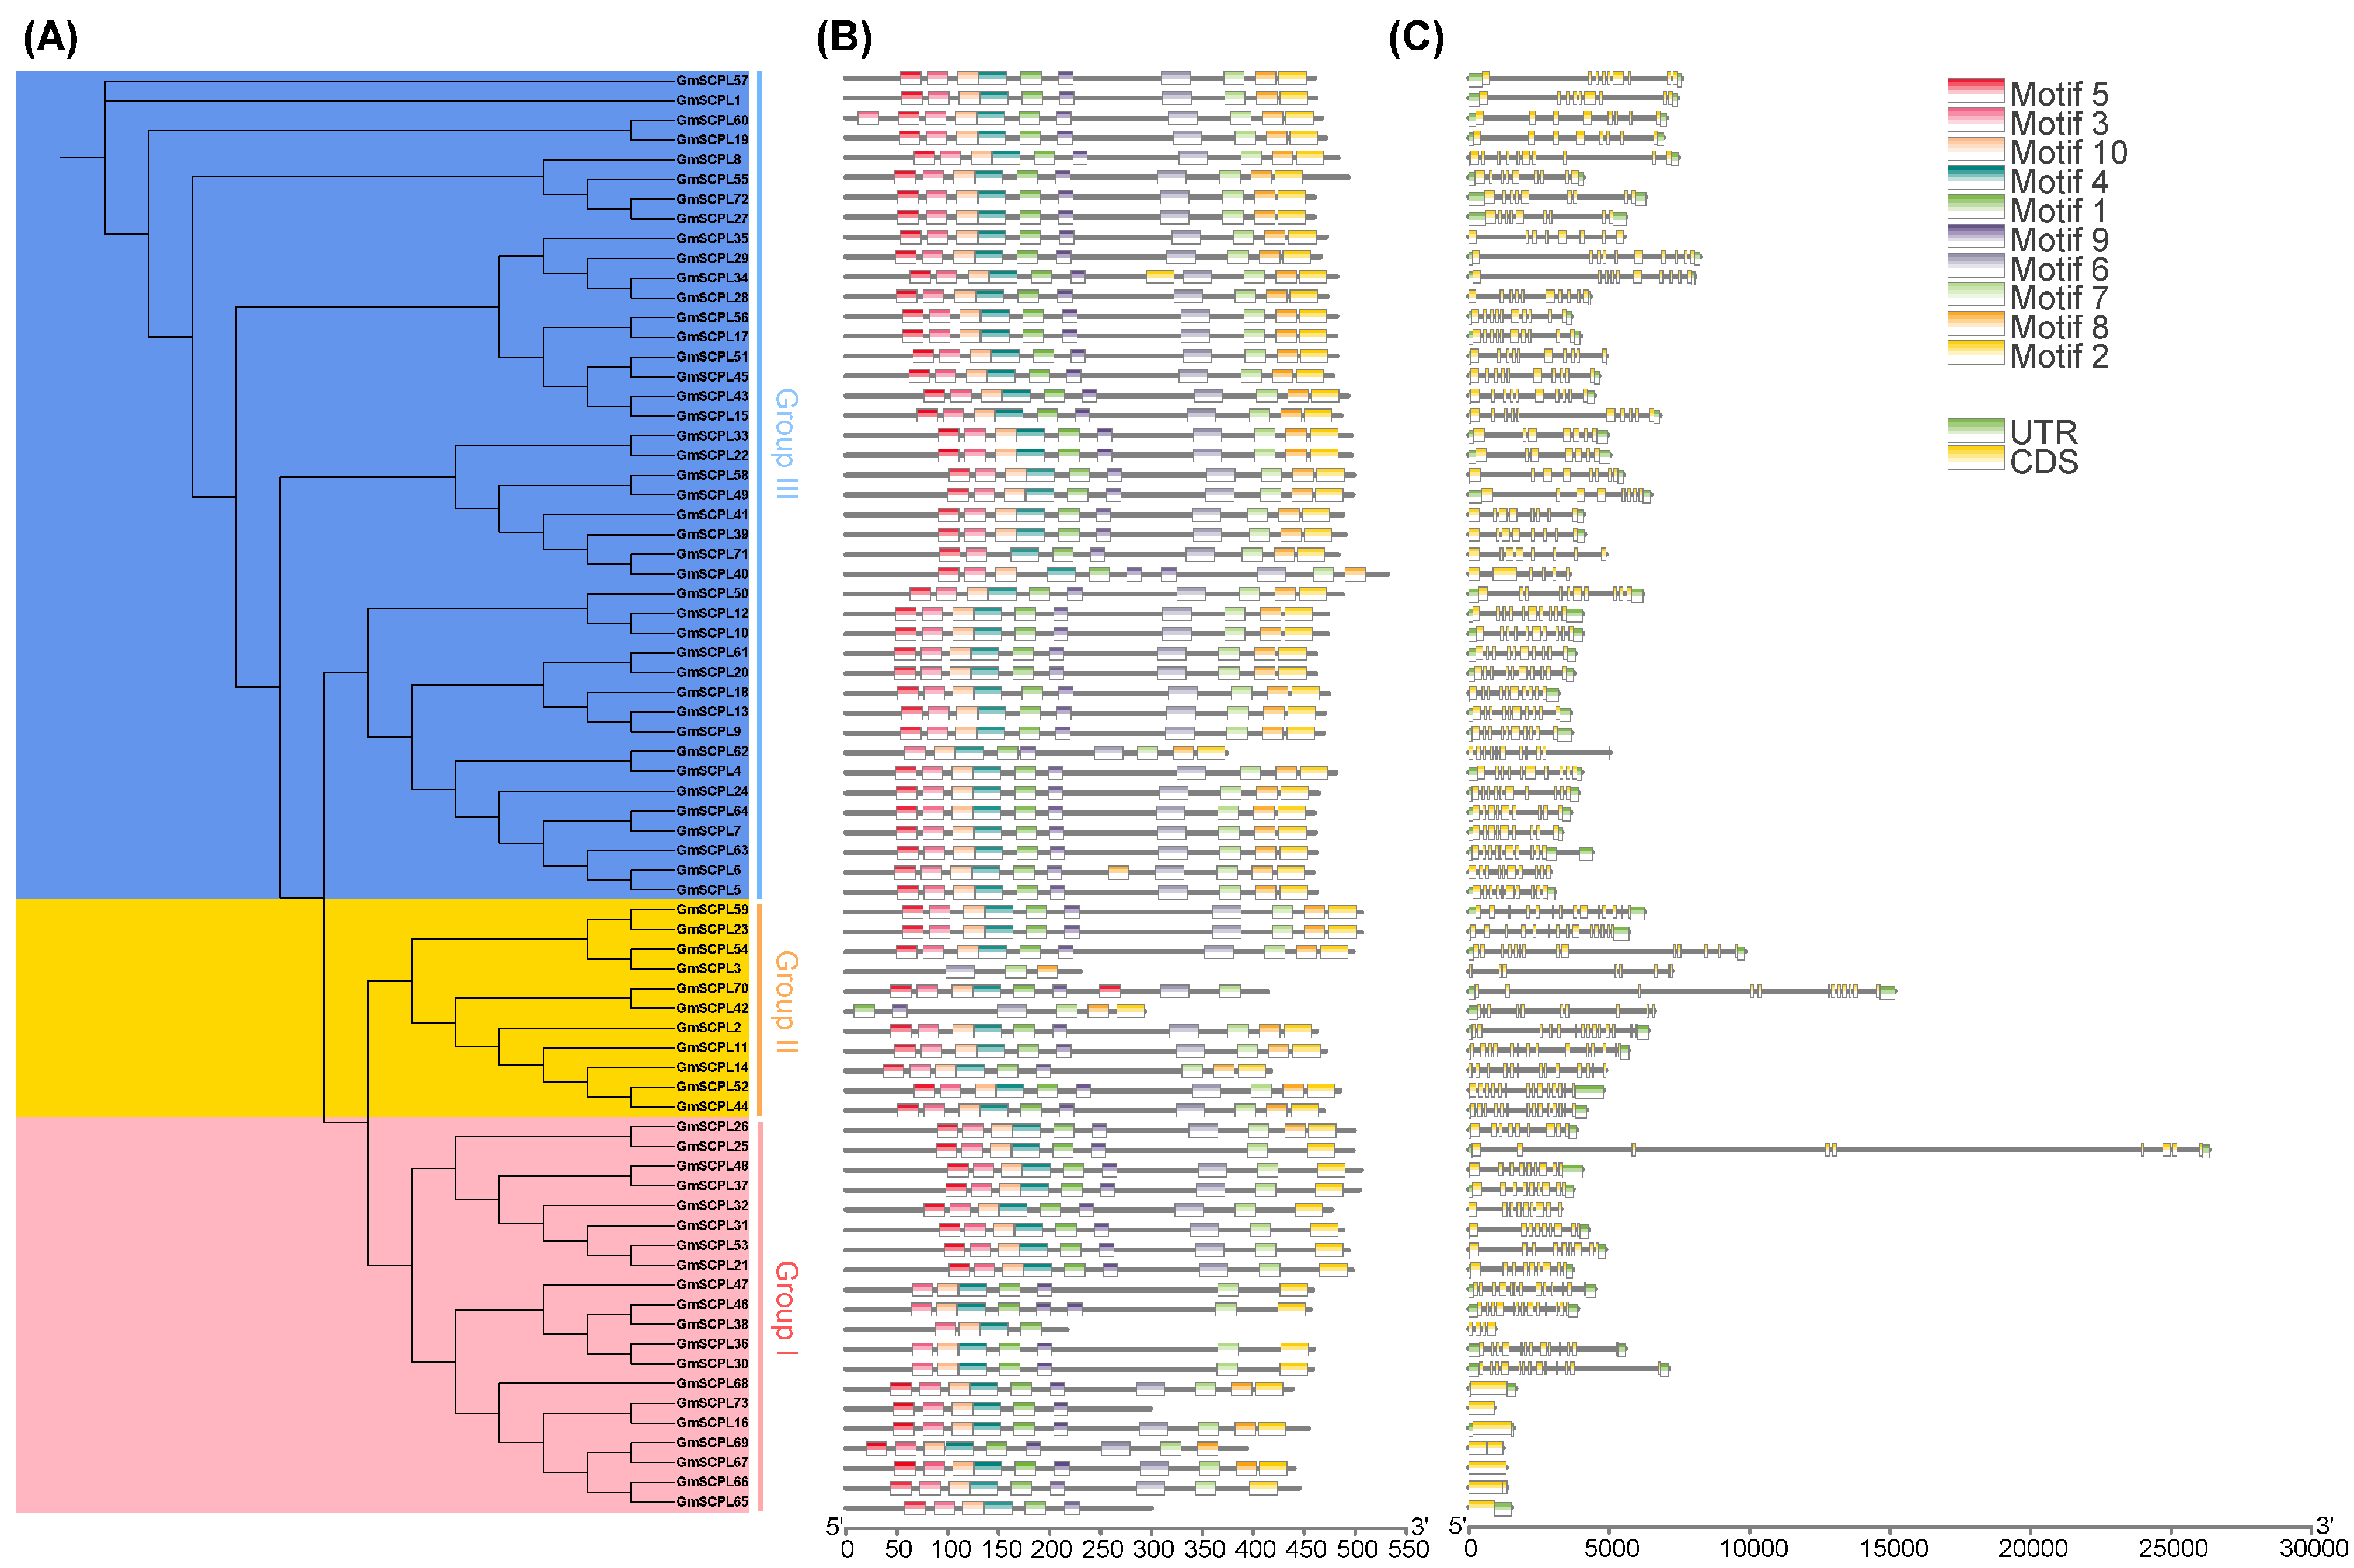
Examining the exon–intron architecture of genes provides valuable insights into their evolutionary paths and functional diversification. We conducted an analysis of the gene structure and conserved motifs of GmSCPLs, revealing a range of exon numbers from 1 to 14 (Table 1). Notably, this analysis highlights a degree of conservation in exon–intron structures within each branch of the evolutionary tree (Figure 6C).
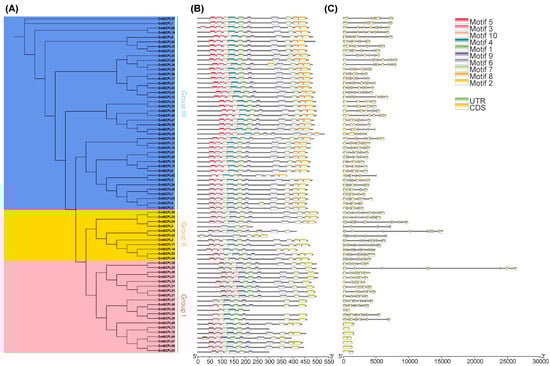
Figure 6.
Analysis of the phylogenetic relationship, gene struchure and conserved motfs of GmSCPLs. (A) Phylogenetic tree of GmSCPLs. (B) Conserved motifs of GmSCPLs. Different colors indicate different motifs numbered 1 to 10. (C) Gene structure of all identified GmSCPLs. Green boxes indicate untranslated regions (UTRs), and yellow boxes indicate coding sequence (CDS) regions.
To identify potential motifs within the soybean SCPL gene family, we subjected the deduced amino acid sequences of 73 GmSCPL proteins to motif prediction analysis using the MEME suite. As illustrated in Figure 6B, ten conserved motifs (designated as Motif1-10) were predicted and visualized across all identified GmSCPLs. The distribution of motifs among the GmSCPLs varied, with counts ranging from three to ten. Remarkably, certain motifs were prevalent among most GmSCPLs, while others were specific to particular clusters. For example, Motifs 1, 3, 4, 5, 9, and 10 were consistently found at the 5′ terminal of 98% of identified GmSCPL members, whereas motif 2 or 8 existed at the 3′ terminal of 95.8% of identified GmSCPL members (Figure 6B). Additionally, we observed that GmSCPLs within the same subgroup exhibited a similar order of motif distribution, suggesting potential functional homogeneity.
2.7. Prediction of cis-Acting Regulatory Elements in Promoter Regions of GmSCPLs
In the realm of plants, a subset of cis-acting regulatory elements holds considerable importance in orchestrating responses to diverse stressors, such as hormonal fluctuations, dehydration, cold, and light exposure, through the binding of specific transcription factors [36,37,38,39,40,41]. Furthermore, certain cis-regulatory elements have been identified as pivotal mediators of plant immune mechanisms [42,43,44,45]. To explore the expression patterns of GmSCPL genes, we screened their 2.0 kb promoter region sequences using the PlantCARE database [46]. A total of 12,469 cis-acting regulatory elements were predicted and identified, categorized into groups related to development, environmental stress response, hormone signaling, light responsiveness, and promoter and site-binding elements (Figure 7A). This underscores the significant role of cis-acting elements in governing SCPL gene expression during soybean growth and development. As depicted in Figure 7B,C, a total of 590 environmental-related elements and 722 hormone-related elements were characterized, suggesting that GmSCPL genes may not only impact soybean growth and development but also play a profound role in regulating and responding to various biotic and abiotic stresses.
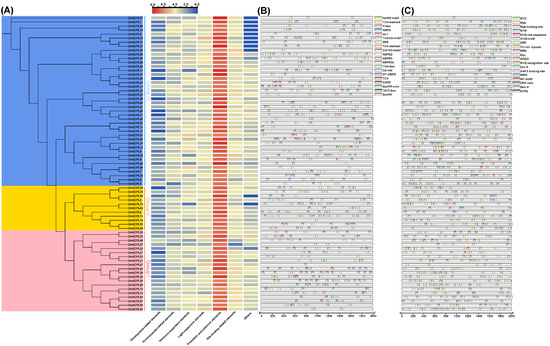
Figure 7.
Analysis of cis-acting regulatory elements in GmSCPLs. (A) The number of seven distinct types of cis-acting elements within the promoter regions of each GmSCPL.; (B) overview of environmental-related cis-acting regulatory elements in each GmSCPL.; (C) overview of hormone-relate cis-acting regulatory elements in each GmSCPL.
2.8. Gene Ontology (GO) Enrichment Analysis of GmSCPLs
Gene Ontology (GO) enrichment analysis is commonly employed as a fundamental approach for elucidating gene functionality [47]. Consequently, we conducted GO enrichment analysis of all identified GmSCPL members. GmSCPLs within the biological processes (BP) category were enriched in secondary metabolic process; those within the cellular components (CC) category were associated with plant-type cell wall; while those within the molecular function (MF) category were primarily enriched in serine-type peptidase activity, serine-type exopeptidase activity, serine-type carboxypeptidase activity, exopeptidase activity, serine hydrolase activity, and peptidase activity (Figure 8). These findings suggest that the GmSCPL family may be involved in the stress response and regulation of plant cell wall dynamics.
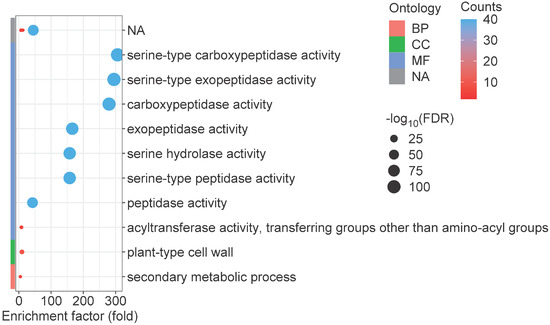
Figure 8.
Gene Ontology (GO) enrichment analysis of GmSCPL genes, organized into three categories: biological process (BP), cellular component (CC), and molecular function (MF). GO terms with a p-value below 0.05 were deemed statistically significant, indicating notable enrichment.
2.9. Analysis of Tissue-Specific Expression Patterns of Selected GmSCPLs
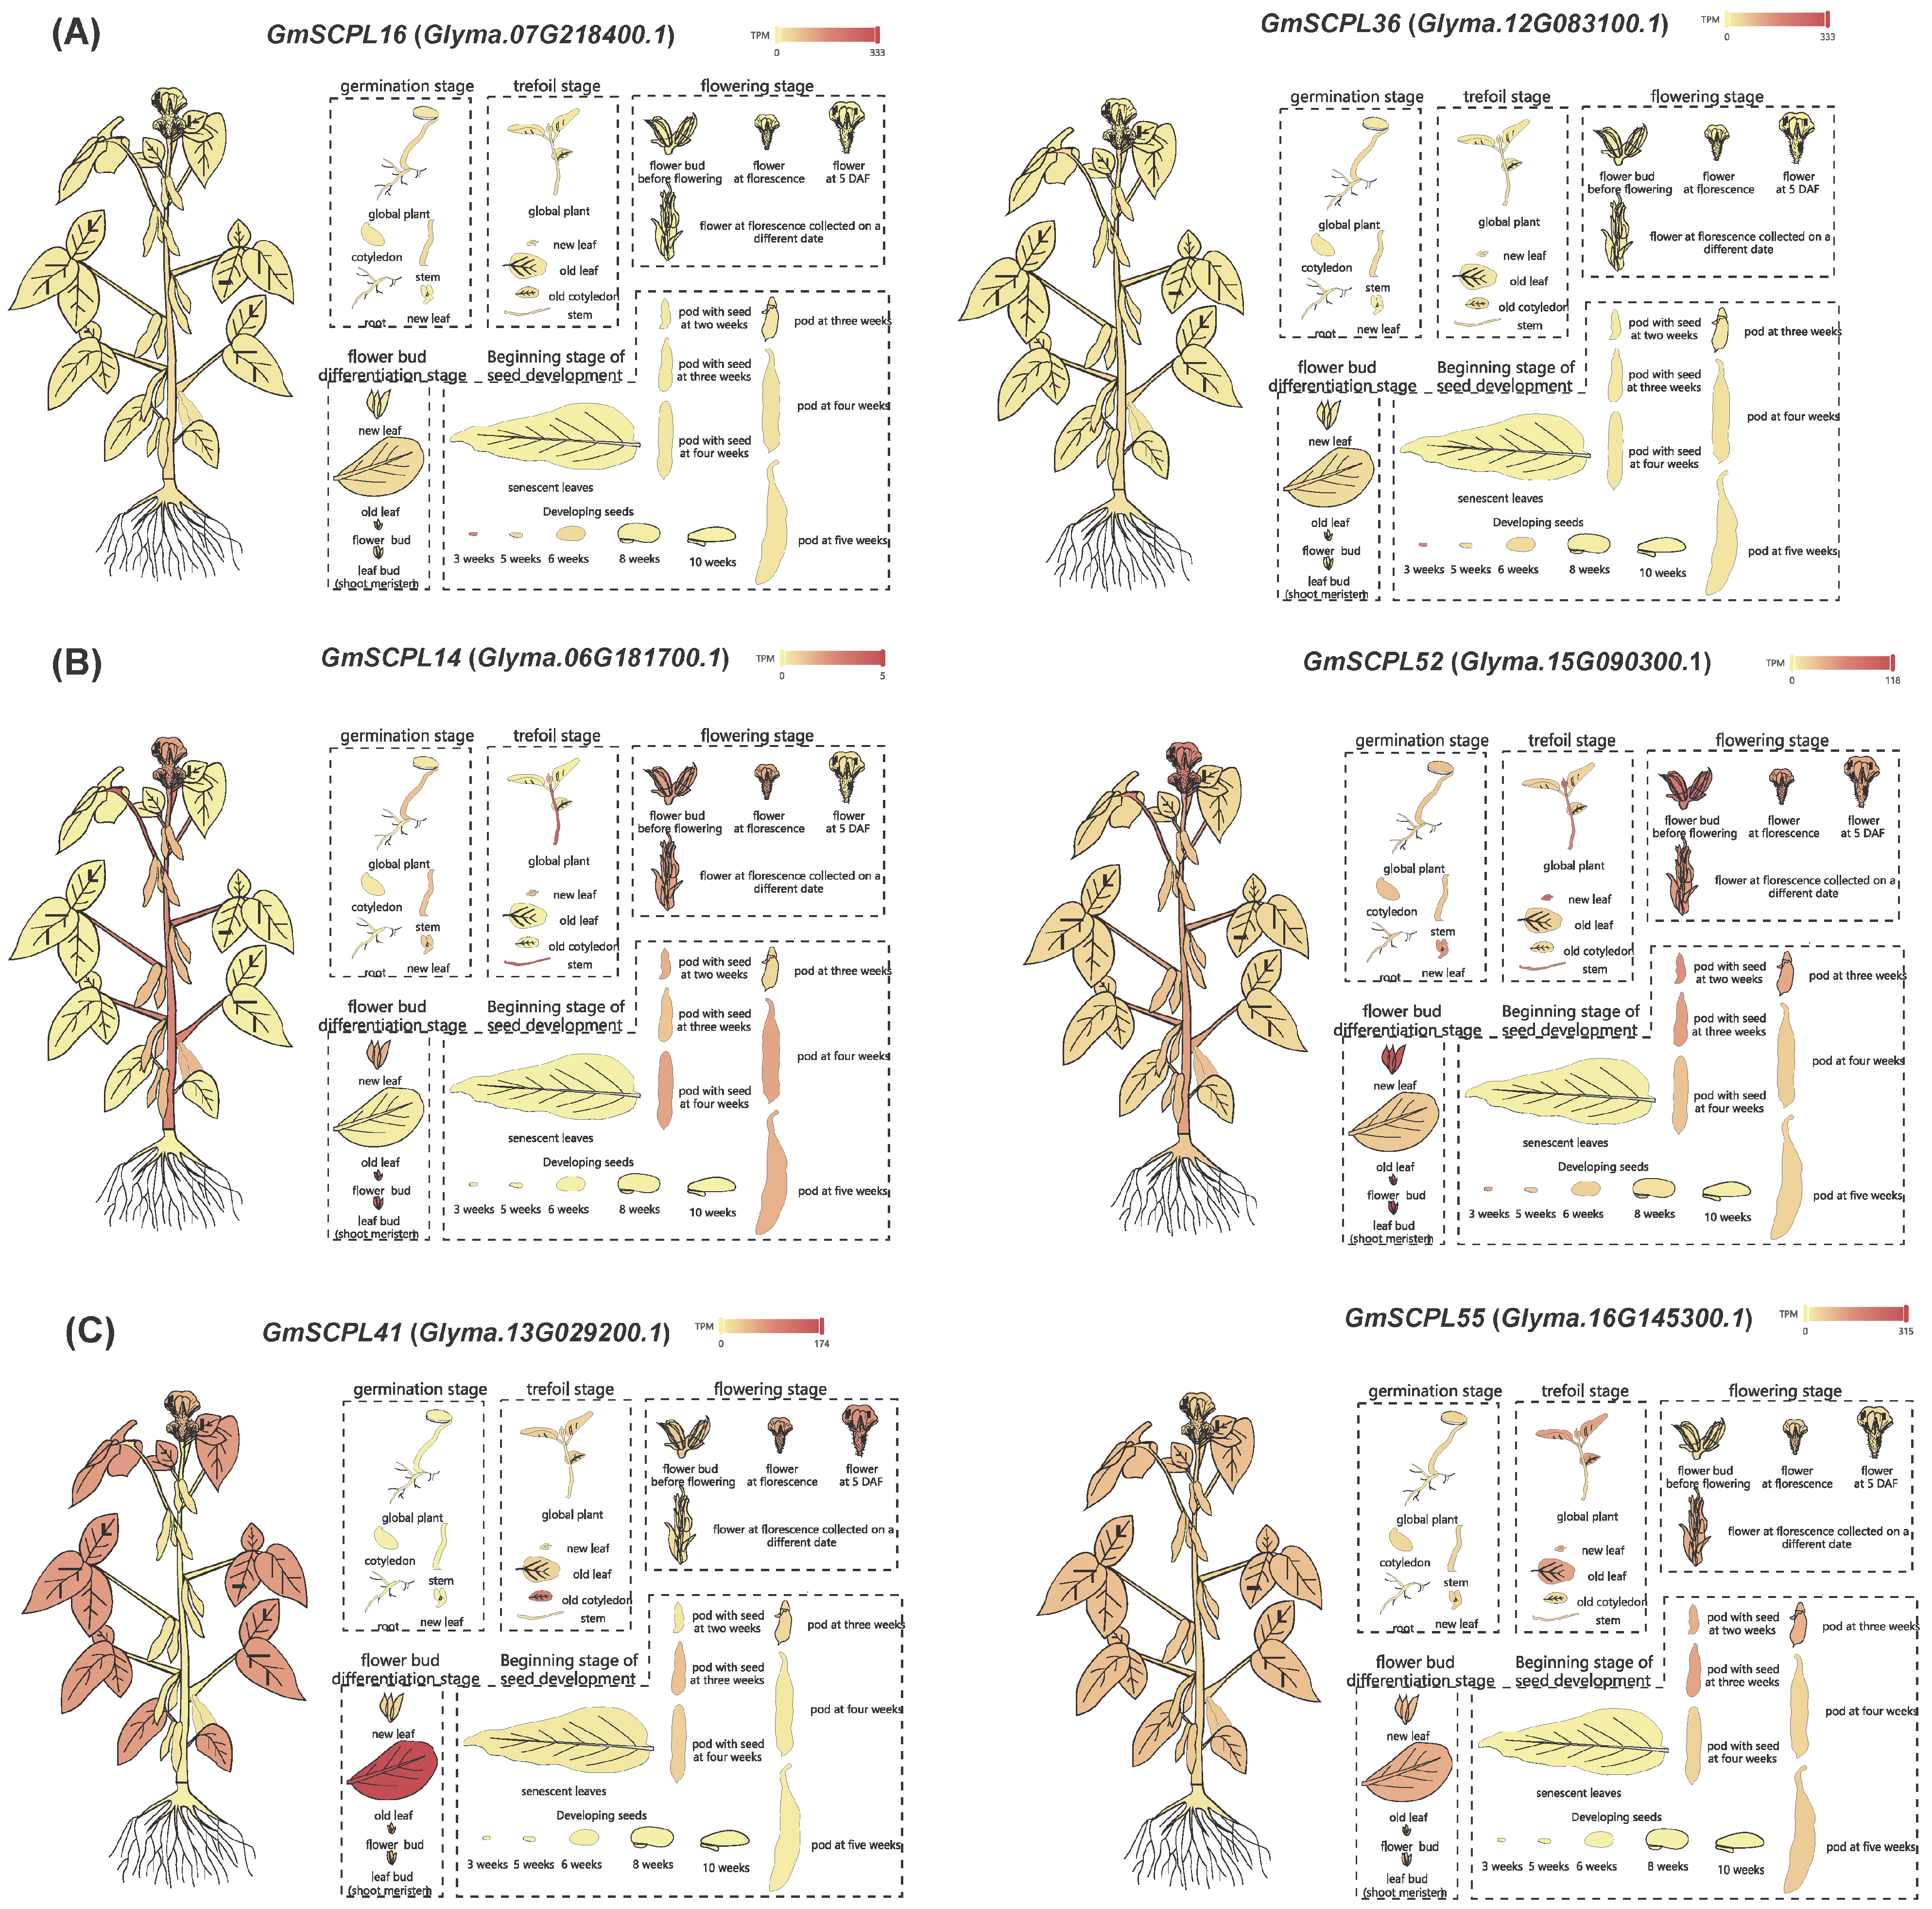
To explore the functions of GmSCPLs, we analyzed the transcriptional levels of six specific GmSCPL genes in various tissues using RNA-seq Tools of SoyMD [48]. These genes included two from each subgroup (Ⅰ, Ⅱ, and Ⅲ) and were all located within SCN-related QTLs (soybean cyst nematode-related quantitative trait loci) (Figure S1 and Table S2). We measured expression levels in terms of transcripts per kilobase million (TPM). Figure 9 shows that each GmSCPL was transcriptionally active in at least one specific organ. Notably, while the expression patterns varied among different phylogenetic subgroups, they were quite consistent within each subgroup. This indicates that GmSCPLs may have important roles in tissue-specific developmental processes at various stages of growth.
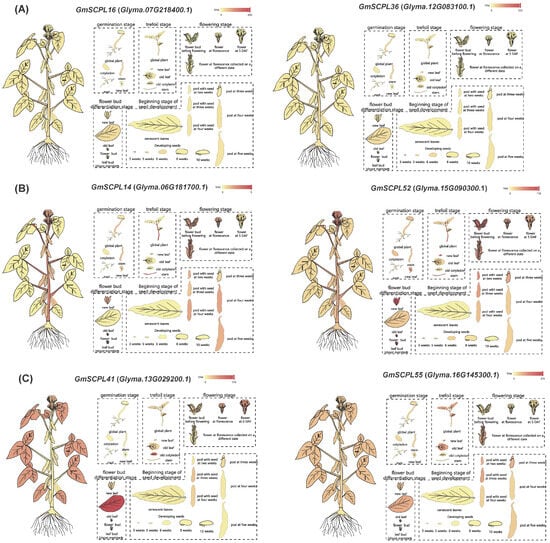
Figure 9.
Differential expression of selected GmSCPLs in different tissues by RNA-seq. (A) Expression profiles of GmSCPL16 (Glyma.07G218400.1) and GmSCPL36 (Glyma.12G083100.1) across various soybean tissues at different developmental stages. (B) Expression profiles of GmSCPL14 (Glyma.06G181700.1) and GmSCPL52 (Glyma.15G090300.1) across various soybean tissues at different developmental stages. (C) Expression profiles of GmSCPL41 (Glyma.13G029200.1) and GmSCPL55 (Glyma.16G145300.1) across various soybean tissues at different developmental stages. The heatmaps indicate the expression levels, with red representing high expression and yellow representing low expression. Each diagram illustrates the expression patterns in tissues such as roots, stems, leaves, flowers, and pods, providing a comprehensive overview of the spatial and temporal expression of these genes.
2.10. Expression Analysis of GmSCPLs under Abiotic and Biotic Stress
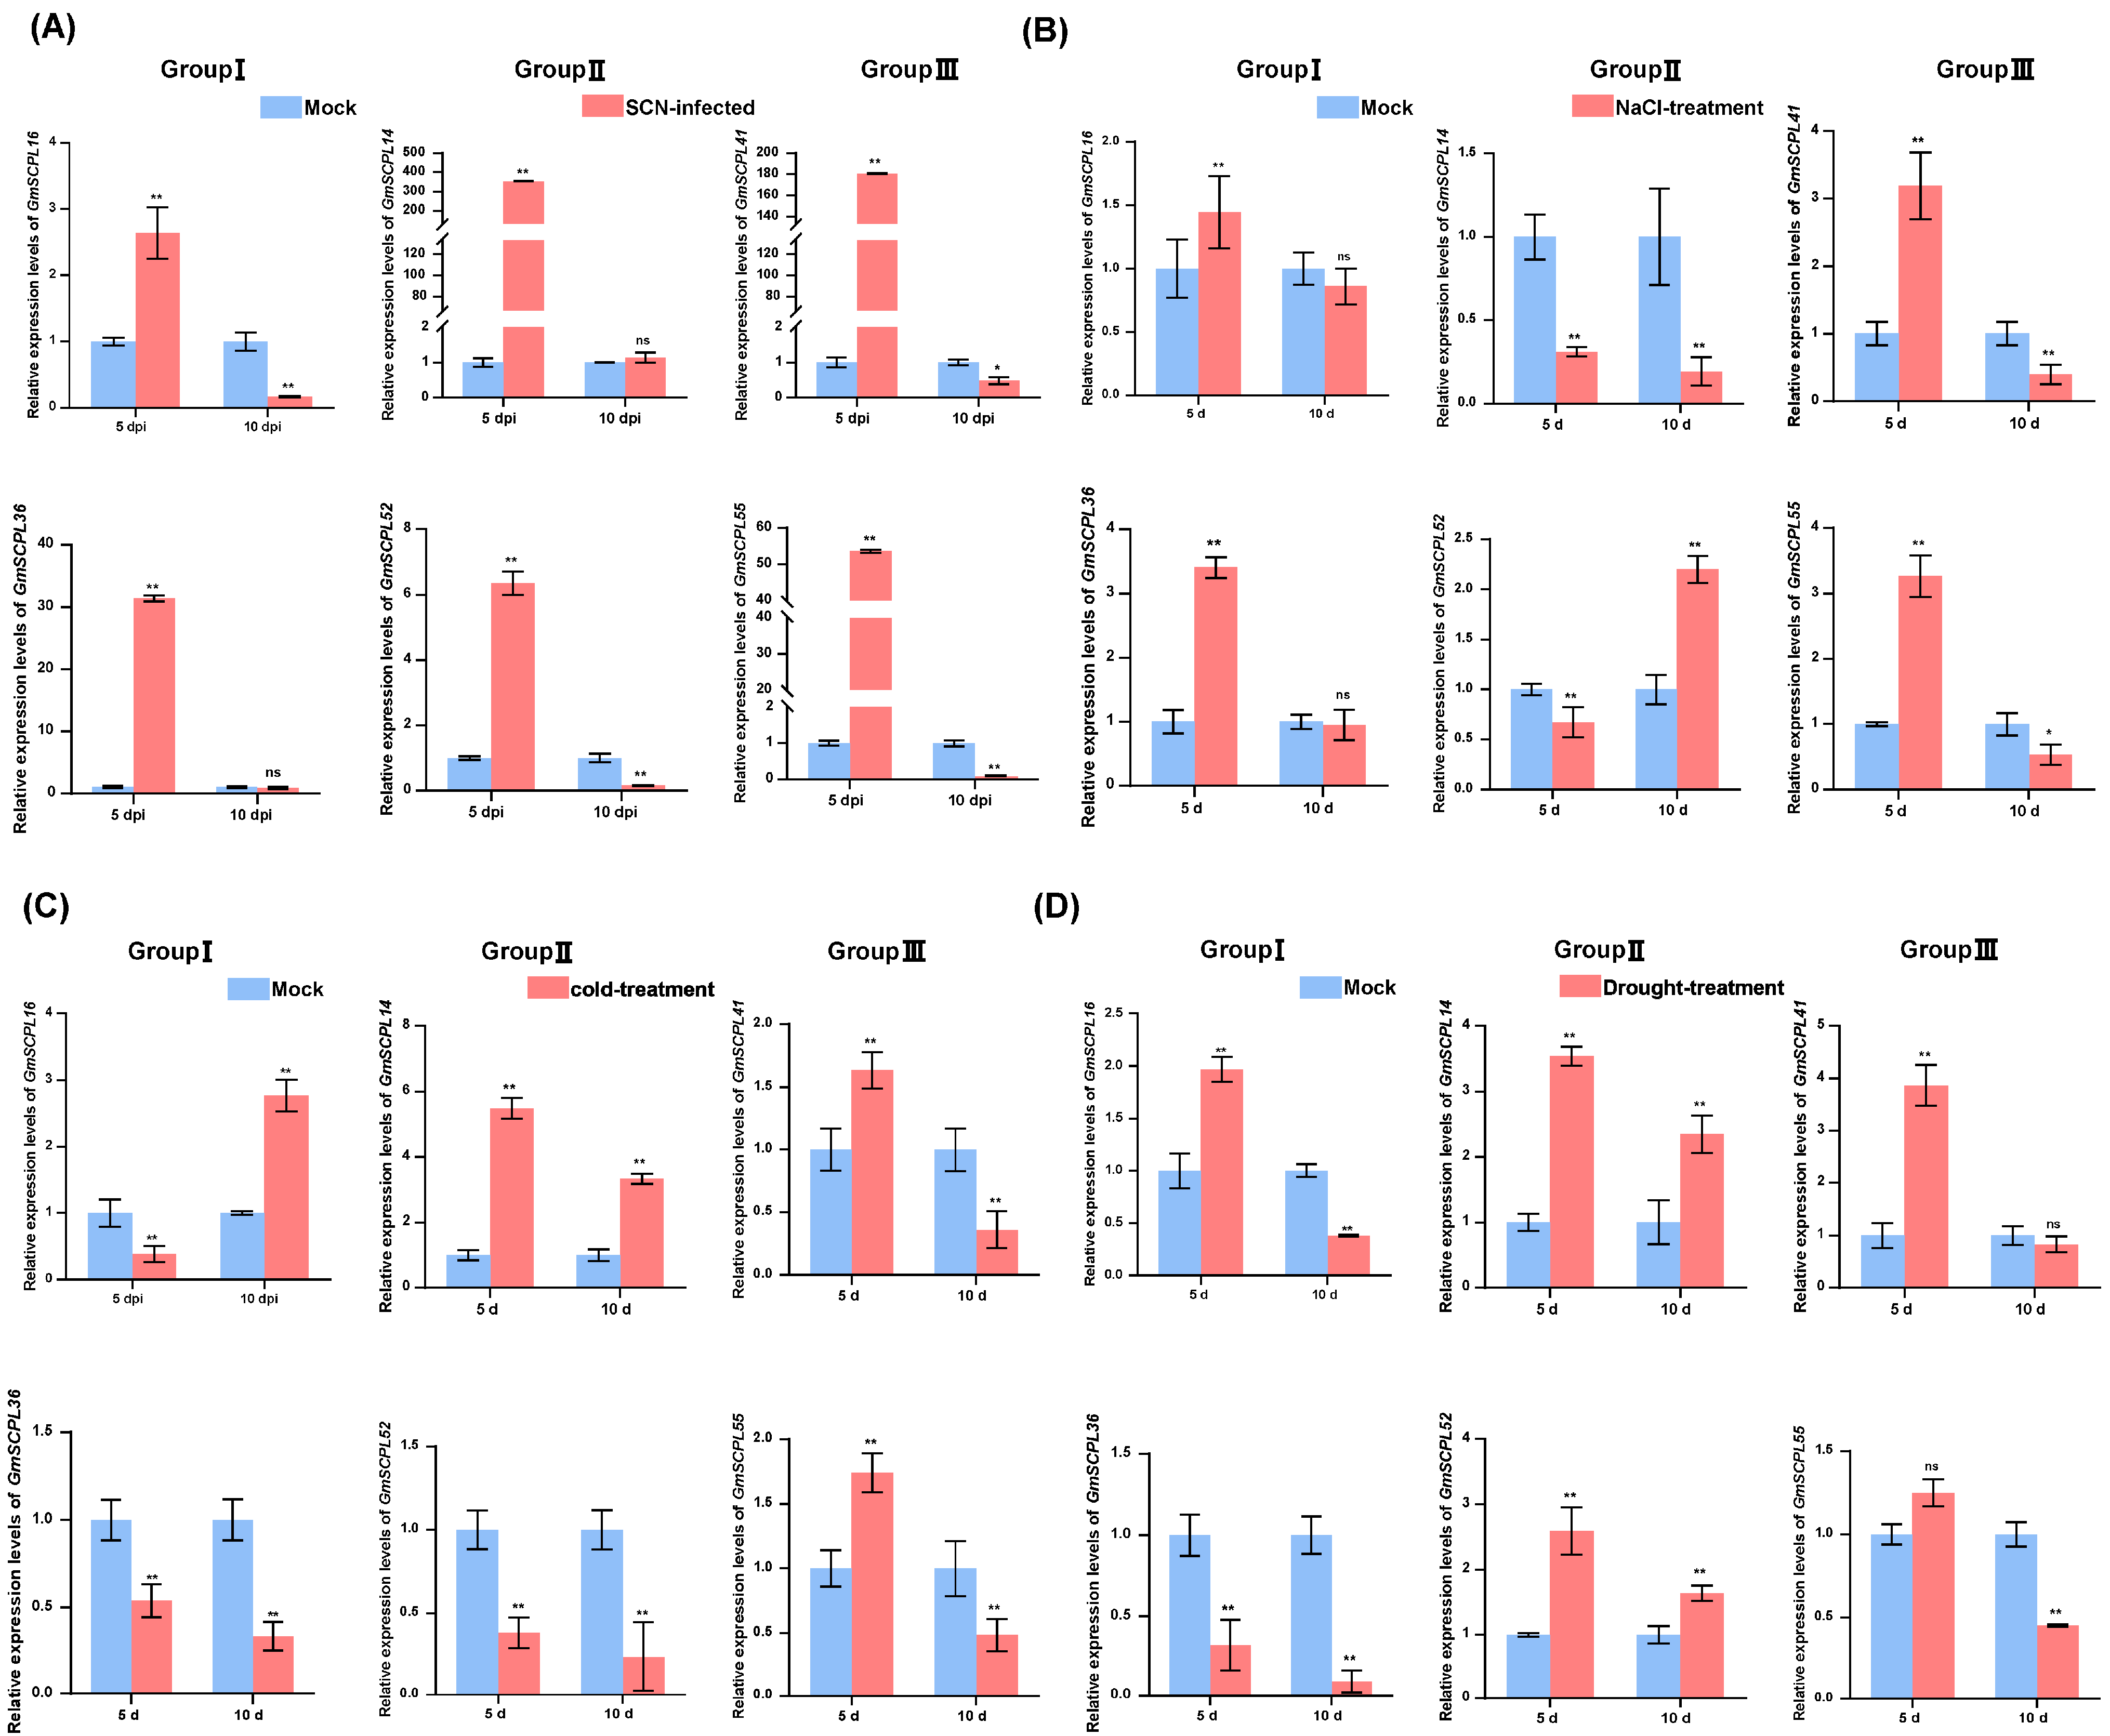
Previous studies have established that SCPLs in plants are crucial for various physiological and biochemical functions, and their transcription is influenced by a range of stimuli, including pathogenic attacks and environmental stresses such as drought, salt, and cold [19,20,49]. To investigate the roles of GmSCPLs under biotic and abiotic stress conditions, we analyzed how soybean cyst nematode (SCN, Heterodera glycines), cold, drought, and saline-alkali stresses affect the transcription levels of selected GmSCPL genes. Our data show significant up-regulation of all selected genes five days after inoculation with SCN (5 dpi) (Figure 10A). Ten days post-SCN inoculation, GmSCPL16, GmSCPL52, GmSCPL41, and GmSCPL55 showed significant expulsion, whereas GmSCPL14 and GmSCPL36 exhibited no significant changes (Figure 10A). Under saline-alkali or cold stress, GmSCPL41 and GmSCPL55 (Group Ⅲ) displayed a strong induction on the fifth day and suppression on the tenth day (Figure 10B,C). Regarding drought stress, the expression of GmSCPL41 was significantly induced, while GmSCPL55 displayed no significant change (Figure 10D). The response of Group Ⅰ and Ⅱ members varied significantly under different abiotic stresses. For example, GmSCPL16 and GmSCPL36 (Group Ⅰ) showed strong induction under saline-alkali stress on the fifth day, but their expression was not significantly changed under the same condition on the tenth day (Figure 10B). As for GmSCPL14 and GmSCPL52 (Group Ⅱ), their expression was vitally suppressed under saline-alkali stress while induced under drought stress on the fifth day (Figure 10B,C). These findings suggest that GmSCPLs play significant roles in response to nematode infection and various environmental stresses.

Figure 10.
Analysis of the expression of certain GmSCPLs in response to biotic and abiotic stresses. (A) Expression profiles of certain GmSCPLs in response to soybean cyst nematode (SCN, Heterodera glycines) infection were analyzed by RT-qPCR. The mean values and standard errors (SE) were calculated from three biological replicates, each consisting of three technical replicates: ns indicates non-significance; ** p < 0.01; * p < 0.05 (Student’s t-test). (B) Expression profiles of certain GmSCPLs in response to 0.9% NaCl treatment were analyzed by RT-qPCR. Mean values and standard errors (SE) were calculated from three biological replicates, each consisting of three technical replicates. Note: “ns” indicates non-significance; “**” p < 0.01; “*” p < 0.05 (Student’s t-test). (C) Expression profiles of certain GmSCPLs in response to 4 ℃ treatment were analyzed by RT-qPCR. The mean values and standard errors (SE) were calculated from three biological replicates, each consisting of three technical replicates: “**” p < 0.01 (Student’s t-test). (D) Expression profiles of certain GmSCPLs in response to drought treatment were analyzed by RT-qPCR. The mean values and standard errors (SE) were calculated from three biological replicates, each consisting of three technical replicates: “ns” indicates non-significance; “**” p < 0.01 (Student’s t-test).
3. Discussion
The serine carboxypeptidase-like genes (SCPLs) hold a significant position in plant growth, development, and responses to various stress [11,50,51,52]. Genome-wide investigation of SCPLs in multiple plants, including Arabidopsis thaliana, rice (Oryza sativa), bread wheat (Triticum aestivum), cotton (Gossypium hirsutum), rapeseed (Brassica napus), and the tea plant (Camellia sinensis), had been performed previously [19,20,22,53,54]. As one of the most important protein feed and vegetable oil crops for human consumption, cultivated soybean (Glycine max) originated from wild soybean (Glycine soja) in China about 5000 years ago [26,27,55]. Williams 82 (Wm82) was the first-released reference genome among plenty of cultivated soybeans [56,57]. Nevertheless, a systemic analysis of the SCPL gene family in soybean has been limited until now. Here, 73 SCPL members were identified and characterized based on the reference genome of Wm82. All identified GmSCPLs could be stratified into three distinct clusters (termed Group Ⅰ, Ⅱ, and Ⅲ) on the bias of their gene structure and phylogenetic analysis (Figure 2A and Figure 3), in accordance with several earlier observations [19,20,23]. Our analysis revealed that the conserved domain, motif, and gene structure of most identified GmSCPLs were relatively conserved within the same cluster (Figure 2 and Figure 6). Additionally, most members of the identified GmSCPLs were predicted to be localized in the vacuole or peroxisome (Table 1), which might be due to the indispensable role SCPLs played in the presence of plant secondary metabolites [58,59].
The number of SCPLs varies a lot across different species (Table 1 and Table S1). For instance, bread wheat (T. aestivum) owns the largest number (210) of SCPL gene family members, which can be attributed to the fact that wheat is a complex allohexaploid and has experienced two whole genome duplications. The number of SCPL members in soybean (G. max) and wild soybean (G. soja) is quite comparable (Table 1 and Table S1). Furthermore, 117 orthologous gene pairs were identified between soybean and wild soybean (G. max-G. soja), much more abundant than those in other species (Figure 4 and Table S4). These observations may be due to the fact that G. max and G. soja are closely related wild relatives [26,27,60]. Gene duplication events are fundamental for the gene family, and they can facilitate plants in nature becoming more and more adapted to diverse environmental conditions [61,62,63]. Our exploration revealed that six tandem duplication events and 34 fragment duplication events contributed to the SCPL gene family in soybean (Figure 3), suggesting both fragment and tandem duplication events were vital for GmSCPLs’s expansion.
It is highly frequent for codon usage bias (CUB) to occur within the plant genome [64,65]. CUB occupies a significant position in the regulation of gene expression and molecular evolution [66,67]. CUB, including codon bias index (CBI), frequency of optimal codons (Fop), effective number of codons (ENC), GC content at the third position (GC3s), and overall GC content of SCPL gene family analysis, was performed in soybean. Taking these CUB indicators into account, we found that the CUB of SCPL genes in dicotyledonous plants (G. max, G. soja, and Arabidopsis) was more intense than that in monocotyledonous ones (O.sativa and T. aestivum) (Table 2). We also examined the relative synonymous codon usage (RSCU) values of the SCPL gene family across five species. A relatively conserved RSCU pattern within monocotyledons or dicotyledons was also observed (Figure 5C). Furthermore, neutral plot and parity rule 2 (PR2) analysis showed that CUB of the SCPL gene family in monocotyledonous plants is mainly influenced by natural selection, while both mutation and natural pressure function in dicotyledonous ones (Figure 5A,B).
The SCPL gene family exhibits a broad spectrum of expression across different tissues [19]. RNA-seq analysis revealed that all selected GmSCPLs exhibited higher expression levels in the upper flower, indicating their potential involvement in plant growth and development (Figure 9). The GmSCPLs promoter analysis identified a series of cis-acting elements, encompassing those elements related to development, environmental stress, and hormone responsiveness (Figure 7), which suggests GmSCPLs may play an important role in soybean response to abiotic or biotic stresses. Then, we explored the expression of GmSCPLs under biotic stress (nematode infection) and abiotic stress (NaCl, cold, and drought treatments). As shown in Figure 10, the outcomes revealed that the expression levels of all selected GmSCPLs were significantly influenced by abiotic or biotic stress. These results suggest that GmSCPLs may have distinct functions in combating various natural stresses.
Through a blend of genomic, bioinformatic, and experimental approaches, this study lays a solid foundation for future functional studies and genetic engineering efforts aimed at exploiting the potential of SCPL genes to improve stress tolerance in soybean. Further research into the specific roles of individual SCPL genes will elucidate their contributions to soybeans’ adaptive responses and facilitate the development of targeted breeding strategies for stress resistance.
4. Materials and Methods
4.1. Identification and Characterization of the SCPL Family in Soybean
For this study, Williams 82 soybean seeds were obtained from the Chinese Academy of Agricultural Sciences in Beijing, China. Reference genomic sequences for Oryza sativa (Oryza sativa v7.0), Glycine max (Wm82.a2.v1), Arabidopsis thaliana (Arabidopsis thaliana TAIR10), and Glycine soja (G. soja v1.1) were obtained from the Phytozome Plants database (https://phytozome-next.jgi.doe.gov/, accessed on 6 January 2024). Reference genomic sequences for Triticum aestivum (bread wheat) were downloaded from the Ensemble Plants database (http://plants.ensembl.org/Triticum_aestivum/Info/Index; accessed on 6 January 2024). SCPL sequences from A. thaliana and O. sativa were used to perform a local BlastP analysis against the G. max (Williams 82) genome with a significance threshold E-value of less than 1 × 10⁻¹⁰. The SCPL family HMM profile (PF00450) was downloaded from the PFAM database (http://pfam.xfam.org/; accessed on 6 January 2024) and used for functional annotation with the HMMER software (version 3.0)( HMMER3, Cambridge, UK) [68]. The structural integrity of the SCPL domain in each candidate protein sequence was verified using the NCBI Batch Web CD-Search Tool (https://www.ncbi.nlm.nih.gov/Structure/bwrpsb/Bwrpsb.cgi; accessed on 16 January 2024). In total, 73 GmSCPL members were identified. Detailed information on the GmSCPL family, including gene locations, open reading frame (ORF) lengths, intron numbers, splice variants, and molecular sizes, was gathered from the Phytozome Plants database. Theoretical isoelectric points (PI) and molecular weights (MW) for the GmSCPLs were calculated using the ExPAsy tool (https://web.expasy.org/compute; accessed on 6 January 2024) [69]. Subcellular localization predictions for the 73 GmSCPLs were made using the Plant-mPLoc tool [70].
4.2. Phylogenetic Analysis
Multiple sequence alignments of GmSCPL proteins from G. max, G. soja, Arabidopsis, O. sativa, and T. aestivum were carried out using ClustalW. Following this, a maximum likelihood (ML) phylogenetic tree was constructed with IQ-Tree 2.2.5 software (IQ-TREE2.2.5, Canberra, Australia) [71] and refined using the iTOL online tool (https://itol.embl.de; accessed on 19 January 2024).
4.3. Chromosome Location and Collinearity Analysis
Synteny relationships within the SCPL family across G. max, G. soja, Arabidopsis, and O. sativa were explored using McscanX [72] and visualized with TBtools [73]. The ratio of nonsynonymous to synonymous substitutions (Ka/Ks) for tandem duplications was determined using the Ka/Ks Calculator in TBtools, and divergence times (T) were calculated with the formula T = Ks/(2 × 9.1 × 10−9) million years ago (Mya) [29,74].
4.4. Codon Usage Bias Analysis
Codon usage bias for SCPL coding sequences (CDS) from G. max, G. soja, Arabidopsis, O. sativa, and T. aestivum was assessed using CodonW 1.4.2 software (CodonW 1.4.2, Houston, USA). The frequency of optimal codons, effective number of codons (ENC), GC content, and GC3s content, along with relative synonymous codon usage (RSCU), were estimated using the EMBOSS online tool.
4.5. Motif and Gene Structure Analysis
Conserved motifs within the GmSCPLs were predicted using the MEME sequence analysis tool (https://meme-suite.org/meme/) with a maximum of ten motifs per sequence [75]. The results were visualized using TBtools software (TBtools, Guangzhou, China) [74]. Additionally, the advanced gene structure view function of TBtools was utilized to analyze and display the gene structures of GmSCPL genes [74].
4.6. Promoter Analysis
Promoter regions, extending 2000 base pairs upstream from the transcription start sites of 73 GmSCPL genes, were extracted from the soybean genome GTF file. These sequences were analyzed using the PlantCARE website (http://bioinformatics.psb.ugent.be/webtools/plantcare/html/; accessed on 6 January 2024) to predict potential cis-acting regulatory elements.
4.7. Gene Ontology (GO) Enrichment Analysis
GO annotation enrichment analysis for GmSCPLs was performed using the GO Enrichment function of TBtools software (TBtools, Guangzhou, China), which involved transforming the p-values using the -log10 conversion [74]. The results were subsequently visualized using the clusterProfiler tool [76].
4.8. RNA Isolation and Real-Time Quantitative Polymerase Chain Reaction (RT-qPCR)
Total RNA was isolated following the manufacturer’s instructions using TRIzol Reagent (Vazyme, Nanjing, China). Single-stranded cDNA was synthesized using a First Strand cDNA Synthesis Kit (Vazyme, Nanjing, China). Real-time quantitative PCR (RT-qPCR) was performed using an ABI QuantStudio5 Detection System (Applied Biosystems, Foster City, CA, USA) with Hieff qPCR SYBR Green Master Mix (YEASEN, Shanghai, China). Each experimental condition included at least three biological replicates and three technical replicates. The relative expression levels of target genes were quantified using the 2−ΔΔC(t) method as described by [77]. The actin gene served as the internal control for each assay. Primers involved in RT-qPCR are shown in Table S6.
4.9. Tissue Expression by RNA-seq
Tissue expression analysis was performed using RNA-seq data obtained from the Soybean multi-omics database (SoyMD) (Soybean: Home (hzau.edu.cn); accessed on 6 January 2024) [48]. The RNA-seq data were normalized using TPM (transcripts per million) values to ensure accurate and comparable expression levels across different tissues and developmental stages. The RNA-seq analysis was visualized using the efp tool for the transcriptomics module of the SoyMD database.
4.10. Plant Growth and Stress Treatments
Williams 82 soybean seeds were grown in a controlled environment greenhouse at 25 °C with a 16/8 h light/dark photoperiod. At the five-leaf stage, seedlings underwent nematode inoculations, and were subjected to drought, saline, and cold stress treatments.
Eggs of the soybean cyst nematode (SCN, Heterodera glycines) were incubated in a hatching buffer containing 2.99 mM ZnCl2 at room temperature for 72 h. The resulting stage 2 juveniles (J2) were sterilized using a solution containing 0.1 g/L HgCl2 and 0.01% sodium azide for 80 s, followed by two rinses in sterile water. The J2 SCNs were then resuspended in 0.048% sterile agarose solution for inoculation. For temperature stress experiments, seedlings were maintained at 4 °C. For drought stress, watering was withheld, and for saline stress, seedlings were treated with 0.9% NaCl.
5. Conclusions
In conclusion, this comprehensive study has elucidated the structural, evolutionary, and functional dynamics of the SCPL gene family in soybean, classifying 73 members into three distinct subgroups. Detailed analyses of gene architecture, conserved domains, and cis-acting regulatory elements highlighted the complexity and specialization of these genes in response to various environmental stresses. The findings from codon usage bias analysis and gene expression profiling under different stress conditions have further underscored the significant roles these genes play in plant stress responses. This foundational work not only advances our understanding of the SCPL family’s contribution to soybeans’ resilience and adaptability but also sets the stage for future research aimed at harnessing these genes for the development of stress-resistant soybean varieties. These insights provide invaluable resources for improving soybean cultivation and stress management strategies, paving the way for enhanced agricultural productivity and sustainability.
Supplementary Materials
The following supporting information can be downloaded at: https://www.mdpi.com/article/10.3390/ijms25126712/s1.
Author Contributions
L.H. designed the experiment and prepared the manuscript; L.H. performed experiments; L.H. and Q.L. performed the bioinformatics analysis; L.H. wrote the draft, S.H. revised the manuscript. All authors have read and agreed to the published version of the manuscript.
Funding
National Key Research and Development Program of China (2023YFD1401000), National Natural Science Foundation of China (32302292, 32272478 and 32102146), Natural Science Foundation of Zhejiang Province (LTGN23C130003), the Postdoctoral Science Foundation of China (2022M710128) and Zhejiang Lab Open Research Project (K2022PE0AB03).
Institutional Review Board Statement
Not applicable.
Informed Consent Statement
Not applicable.
Data Availability Statement
Data are contained within the article.
Acknowledgments
We thank Shiming Liu from Chinese Academy of Agricultural Sciences in Beijing, China for providing Williams 82 seeds.
Conflicts of Interest
The authors declare no conflicts of interest.
References
- Wang, C.; Li, X.; Zhuang, Y.; Sun, W.; Cao, H.; Xu, R.; Kong, F.; Zhang, D. A novel miR160a-GmARF16-GmMyc2 module determines soybean salt tolerance and adaptation. New Phytol. 2024, 241, 2176–2192. [Google Scholar] [CrossRef] [PubMed]
- Graham, P.H.; Vance, C.P. Legumes: Importance and constraints to greater Use. Plant Physiol. 2002, 131, 872–877. [Google Scholar] [CrossRef] [PubMed]
- Goldsmith, P.D. Economics of soybean production, marketing, and utilization. Soybeans 2008, 117–150. [Google Scholar]
- He, L.; Ghani, N.N.U.; Chen, L.; Liu, Q.; Zheng, J.; Han, S. Research progress on the functional study of host resistance-related genes against Heterodera Glycines. Crop Health. 2023, 1, 1–12. [Google Scholar] [CrossRef]
- Whitham, S.A.; Qi, M.; Innes, R.W.; Ma, W.; Lopes-Caitar, V.; Hewezi, T. Molecular soybean-pathogen interactions. Annu. Rev. Phytopathol. 2016, 54, 443–468. [Google Scholar] [CrossRef] [PubMed]
- Deshmukh, R.; Sonah, H.; Patil, G.; Chen, W.; Prince, S.; Mutava, R.; Vuong, T.; Valliyodan, B.; Nguyen, H.T. Integrating omic approaches for abiotic stress tolerance in soybean. Front Plant Sci. 2014, 5, 244. [Google Scholar] [CrossRef] [PubMed]
- Mammadov, J.; Buyyarapu, R.; Guttikonda, S.K.; Parliament, K.; Abdurakhmonov, I.Y.; Kumpatla, S.P. Wild relatives of maize, rice, cotton, and Soybean: Treasure troves for tolerance to biotic and abiotic stresses. Front Plant Sci. 2018, 9, 886. [Google Scholar] [CrossRef]
- Ciarkowska, A.; Ostrowski, M.; Starzyńska, E.; Jakubowska, A. Plant scpl acyltransferases: Multiplicity of enzymes with various functions in secondary metabolism. Phytochem. Rev. 2019, 18, 303–316. [Google Scholar] [CrossRef]
- Breddam, K. Carlsberg Research Communications. Serine Carboxypeptidases: A Review. Carlsberg Res. Commun. 1986, 51, 83–128. [Google Scholar] [CrossRef]
- Li, J.; Lease, K.A.; Tax, F.E.; Walker, J.C. Brs1, a Serine carboxypeptidase, regulates Bri1 signaling in Arabidopsis thaliana. Proc. Natl. Acad. Sci. USA 2001, 98, 5916–5921. [Google Scholar] [CrossRef]
- Liu, H.; Wang, X.; Zhang, H.; Yang, Y.; Ge, X.; Song, F. A rice serine carboxypeptidase-like gene Osbiscpl1 is involved in regulation of defense responses against biotic and oxidative stress. Gene 2008, 420, 57–65. [Google Scholar] [CrossRef] [PubMed]
- Mugford, S.T.; Qi, X.; Bakht, S.; Hill, L.; Wegel, E.; Hughes, R.K.; Papadopoulou, K.; Melton, R.; Philo, M.; Sainsbury, F.; et al. A serine carboxypeptidase-like acyltransferase is required for synthesis of antimicrobial compounds and disease resistance in oats. Plant Cell 2009, 21, 2473–2484. [Google Scholar] [CrossRef] [PubMed]
- Milkowski, C.; Strack, D. Serine carboxypeptidase-like acyltransferases. Phytochemistry 2004, 65, 517–524. [Google Scholar] [CrossRef] [PubMed]
- Holmquist, M. Alpha/Beta-hydrolase fold enzymes: Structures, functions and mechanisms. Curr. Protein Pept. Sci. 2000, 1, 209–235. [Google Scholar] [CrossRef]
- Fricker, L.D.; Leiter, E.H. Peptides, enzymes and obesity: New insights from a ‘Dead’ enzyme. Trends Biochem. Sci. 1999, 24, 390–393. [Google Scholar] [CrossRef] [PubMed]
- Agarwal, V.; Tikhonov, A.; Metlitskaya, A.; Severinov, K.; Nair, S.K. Structure and function of a serine carboxypeptidase adapted for degradation of the protein synthesis antibiotic Microcin C7. Proc. Natl. Acad. Sci. USA 2012, 109, 4425–4430. [Google Scholar] [CrossRef] [PubMed]
- Guerreiro, J.; Peter, M. Unveiling the intricate mechanisms of plant defense. Front Plant Phy. 2023, 1, 1285373. [Google Scholar] [CrossRef]
- Peng, H.; Feng, H.; Zhang, T.; Wang, Q. Plant defense mechanisms in plant-pathogen interactions. Front Plant Sci. 2023, 14, 1292294. [Google Scholar] [CrossRef] [PubMed]
- Wang, Y.; Zhao, J.; Deng, X.; Wang, P.; Geng, S.; Gao, W.; Guo, P.; Chen, Q.; Li, C.; Qu, Y. Genome-wide analysis of serine carboxypeptidase-like protein (Scpl) family and functional validation of Gh_Scpl42 unchromosome conferring cotton verticillium der verticillium wilt stress in Gossypium Hirsutum. BMC Plant Biol. 2022, 22, 421. [Google Scholar] [CrossRef]
- Xu, X.; Zhang, L.; Zhao, W.; Fu, L.; Han, Y.; Wang, K.; Yan, L.; Li, Y.; Zhang, X.H.; Min, D.H. Genome-wide analysis of the serine carboxypeptidase-like protein family in Triticum aestivum reveals Tascpl184-6d is involved in abiotic stress response. BMC Genom. 2021, 22, 350. [Google Scholar] [CrossRef]
- Schmutz, J.; Cannon, S.B.; Schlueter, J.; Ma, J.; Mitros, T.; Nelson, W.; Hyten, D.L.; Song, Q.; Thelen, J.J.; Cheng, J.; et al. Genome sequence of the palaeopolyploid soybean. Nature 2010, 463, 178–183. [Google Scholar] [CrossRef] [PubMed]
- Feng, Y.; Xue, Q. The serine carboxypeptidase like gene family of rice (Oryza Sativa, L. Ssp. Japonica). Funct. Integr. Genom. 2006, 6, 14–24. [Google Scholar] [CrossRef] [PubMed]
- Zhu, D.; Chu, W.; Wang, Y.; Yan, H.; Chen, Z.; Xiang, Y. Genome-wide identification, classification and expression analysis of the serine carboxypeptidase-like protein family in Poplar. Physiol. Plant. 2018, 162, 333–352. [Google Scholar] [CrossRef] [PubMed]
- Han, S.; Smith, J.M.; Du, Y.; Bent, A.F. Soybean transporter AATRhg1 abundance increases along the nematode migration path and impacts vesiculation and ROS. Plant Physiol. 2023, 192, 133–153. [Google Scholar] [CrossRef] [PubMed]
- Liu, H.; Yu, J.; Yu, X.; Zhang, D.; Chang, H.; Li, W.; Song, H.; Cui, Z.; Wang, P.; Luo, Y.; et al. Structural variation of mitochondrial genomes sheds light on evolutionary history of soybeans. Plant J. 2021, 108, 1456–1472. [Google Scholar] [CrossRef] [PubMed]
- Liu, Y.; Du, H.; Li, P.; Shen, Y.; Peng, H.; Liu, S.; Zhou, G.-A.; Zhang, H.; Liu, Z.; Shi, M.; et al. Pan-genome of wild and cultivated soybeans. Cell 2020, 182, 162–176. [Google Scholar] [CrossRef] [PubMed]
- Liu, S.; Zhang, M.; Feng, F.; Tian, Z. Toward a “Green Revolution” for soybean. Mol. Plant. 2020, 13, 688–697. [Google Scholar] [CrossRef] [PubMed]
- Cannon, S.B.; Mitra, A.; Baumgarten, A.; Young, N.D.; May, G. The roles of segmental and tandem gene duplication in the evolution of large gene families in Arabidopsis thaliana. BMC Plant Biol. 2004, 4, 10. [Google Scholar] [CrossRef] [PubMed]
- Hurst, L.D. The Ka/Ks ratio: Diagnosing the form of sequence evolution. Trends Genet. 2002, 18, 486. [Google Scholar] [CrossRef]
- Alazem, M.; Lin, N.S. Roles of plant hormones in the regulation of host-virus interactions. Mol. Plant Pathol. 2015, 16, 529–540. [Google Scholar] [CrossRef]
- Hershberg, R.; Petrov, D.A. Selection on codon bias. Annu Rev. Genet. 2008, 42, 287–299. [Google Scholar] [CrossRef] [PubMed]
- Liu, X.-Y.; Li, Y.; Ji, K.-K.; Zhu, J.; Ling, P.; Zhou, T.; Fan, L.-Y.; Xie, S.-Q. Genome-wide codon usage pattern analysis reveals the correlation between codon usage bias and gene expression in Cuscuta Australis. Genomics 2020, 112, 2695–2702. [Google Scholar] [CrossRef]
- Roberts, R.J. Restriction and modification enzymes and their recognition sequences. Nucleic Acids Res. 1981, 9, r75-96. [Google Scholar] [CrossRef] [PubMed]
- Li, G.; Pan, Z.; Gao, S.; He, Y.; Xia, Q.; Jin, Y.; Yao, H. Analysis of synonymous codon usage of chloroplast genome in Porphyra Umbilicalis. Genes Genom. 2019, 41, 1173–1181. [Google Scholar] [CrossRef] [PubMed]
- Sueoka, N. Intrastrand parity rules of DNA base composition and usage biases of synonymous codons. J. Mol. Evol. 1995, 40, 318–325. [Google Scholar] [CrossRef] [PubMed]
- Butler, J.E.; Kadonaga, J.T. The RNA polymerase Ii core promoter: A key component in the regulation of gene expression. Genes Dev. 2002, 16, 2583–2592. [Google Scholar] [CrossRef]
- Liu, K.; Yuan, C.; Feng, S.; Zhong, S.; Li, H.; Zhong, J.; Shen, C.; Liu, J. Genome-wide analysis and characterization of Aux/Iaa family genes related to fruit ripening in Papaya (Carica Papaya, L.). BMC Genom. 2017, 18, 351. [Google Scholar] [CrossRef] [PubMed]
- Osakabe, Y.; Yamaguchi-Shinozaki, K.; Shinozaki, K.; Tran, L.P. ABA control of plant macroelement membrane transport systems in response to water deficit and high salinity. New Phytol. 2014, 202, 35–49. [Google Scholar] [CrossRef]
- Pieterse, C.M.; Van Loon, L. NPR1: The spider in the web of induced resistance signaling pathways. Curr Opin Plant Biol. 2004, 7, 456–464. [Google Scholar] [CrossRef]
- Sakuma, Y.; Liu, Q.; Dubouzet, J.G.; Abe, H.; Shinozaki, K.; Yamaguchi-Shinozaki, K. DNA-binding dpecificity of the Erf/Ap2 domain of Arabidopsis DREBs, transcription factors involved in dehydration- and cold-inducible gene expression. Biochem. Biophys. Res. Commun. 2002, 290, 998–1009. [Google Scholar] [CrossRef]
- Yamaguchi-Shinozaki, K.; Shinozaki, K. Organization of cis-acting regulatory elements in osmotic- and cold-stress-responsive promoters. Trends Plant Sci. 2005, 10, 88–94. [Google Scholar] [CrossRef] [PubMed]
- Yu, Y.; Guo, D.; Li, G.; Yang, Y.; Zhang, G.; Li, S.; Liang, Z. The grapevine R2R3-type MYB transcription factor VdMYB1 positively regulates defense responses by activating the stilbene synthase gene 2 (VdSTS2). BMC Plant Biol. 2019, 19, 1–15. [Google Scholar] [CrossRef] [PubMed]
- Shan, T.; Rong, W.; Xu, H.; Du, L.; Liu, X.; Zhang, Z. The wheat R2R3-MYB transcription factor TaRIM1 participates in resistance response against the pathogen Rhizoctonia cerealis infection through regulating defense genes. Sci. Rep. 2016, 6, 28777. [Google Scholar] [CrossRef] [PubMed]
- Kaur, A.; Pati, P.K.; Pati, A.M.; Nagpal, A.K. In-silico analysis of cis-acting regulatory elements of pathogenesis-related proteins of Arabidopsis thaliana and Oryza sativa. PLoS ONE 2017, 12, e0184523. [Google Scholar] [CrossRef] [PubMed]
- He, L.; Chen, X.; Xu, M.; Liu, T.; Zhang, T.; Li, J.; Yang, J.; Chen, J.; Zhong, K. Genome-Wide Identification and Characterization of the Cystatin Gene Family in Bread Wheat (Triticum aestivum L.). Int. J. Mol. Sci. 2021, 22, 10264. [Google Scholar] [CrossRef] [PubMed]
- Lescot, M.; Déhais, P.; Thijs, G.; Marchal, K.; Moreau, Y.; Van de Peer, Y.; Rouzé, P.; Rombauts, S. PlantCARE, a database of plant cis-acting regulatory elements and a portal to tools for in silico analysis of promoter sequences. Nucleic Acids Res. 2002, 30, 325–327. [Google Scholar] [CrossRef] [PubMed]
- He, L.; Jin, P.; Chen, X.; Zhang, T.-Y.; Zhong, K.-L.; Liu, P.; Chen, J.-P.; Yang, J. Comparative proteomic analysis of Nicotiana benthamiana plants under Chinese wheat mosaic virus infection. BMC Plant Biol. 2021, 21, 1–17. [Google Scholar] [CrossRef] [PubMed]
- Yang, Z.; Luo, C.; Pei, X.; Wang, S.; Huang, Y.; Li, J.; Liu, B.; Kong, F.; Yang, Q.-Y.; Fang, C. SoyMD: A platform combining multi-omics data with various tools for soybean research and breeding. Nucleic Acids Res. 2023, 52, D1639–D1650. [Google Scholar] [CrossRef] [PubMed]
- Havé, M.; Balliau, T.; Cottyn-Boitte, B.; Dérond, E.; Cueff, G.; Soulay, F.; Lornac, A.; Reichman, P.; Dissmeyer, N.; Avice, J.-C.; et al. Increases in activity of proteasome and papain-like cysteine protease in Arabidopsis autophagy mutants: Back-up compensatory effect or cell-death promoting effect? J. Exp. Bot. 2018, 69, 1369–1385. [Google Scholar] [CrossRef]
- Cercós, M.; Urbez, C.; Carbonell, J. A serine carboxypeptidase gene (PsCP), expressed in early steps of reproductive and vegetative development in Pisum sativum, is induced by gibberellins. Plant Mol. Biol. 2003, 51, 165–174. [Google Scholar] [CrossRef]
- Bienert, M.D.; Delannoy, M.; Navarre, C.; Boutry, M. NtSCP1 from Tobacco Is an Extracellular Serine Carboxypeptidase III That Has an Impact on Cell Elongation. Plant Physiol. 2012, 158, 1220–1229. [Google Scholar] [CrossRef]
- Chen, J.; Li, W.-Q.; Jia, Y.-X. The Serine Carboxypeptidase-Like Gene SCPL41 Negatively Regulates Membrane Lipid Metabolism in Arabidopsis thaliana. Plants 2020, 9, 696. [Google Scholar] [CrossRef] [PubMed]
- Ahmad, M.Z.; Li, P.; She, G.; Xia, E.; Benedito, V.A.; Wan, X.C.; Zhao, J. Genome-wide analysis of serine carboxypeptidase-like acyltransferase gene family for evolution and characterization of enzymes involved in the biosynthesis of galloylated catechins in the tea plant (Camellia sinensis). Front. Plant Sci. 2020, 11, 848. [Google Scholar] [CrossRef]
- Liu, Y.; Ce, F.; Tang, H.; Tian, G.; Yang, L.; Qian, W.; Dong, H. Genome-wide analysis of the serine carboxypeptidase-like (SCPL) proteins in Brassica napus L. Plant Physiol. Biochem. 2022, 186, 310–321. [Google Scholar] [CrossRef] [PubMed]
- Wilson, R.F. Soybean: Market driven research needs. Genetics and genomics of soybean. Genet. Genom. Soybean 2008, 3–15. [Google Scholar]
- Carter, T.E., Jr.; Nelson, R.L.; Sneller, C.H.; Cui, Z.G. Genetic diversity in soybean. Soybeans Improv. Prod. Uses 2004, 16, 303–416. [Google Scholar]
- Li, M.-W.; Wang, Z.; Jiang, B.; Kaga, A.; Wong, F.-L.; Zhang, G.; Han, T.; Chung, G.; Nguyen, H.; Lam, H.-M. Impacts of genomic research on soybean improvement in East Asia. Theor. Appl. Genet. 2019, 133, 1655–1678. [Google Scholar] [CrossRef] [PubMed]
- Lehfeldt, C.; Shirley, A.M.; Meyer, K.; Ruegger, M.O.; Cusumano, J.C.; Viitanen, P.V.; Strack, D.; Chapple, C. Cloning of the SNG1 gene of Arabidopsis reveals a role for a serine carboxypeptidase-like protein as an acyltransferase in secondary metabolism. Plant Cell 2000, 12, 1295–1306. [Google Scholar] [CrossRef] [PubMed]
- Milkowski, C.; Baumert, A.; Schmidt, D.; Nehlin, L.; Strack, D. Molecular regulation of sinapate ester metabolism in Brassica napus: Expression of genes, properties of the encoded proteins and correlation of enzyme activities with metabolite accumulation. Plant, J. 2004, 38, 80–92. [Google Scholar] [CrossRef]
- Li, Y.; Li, W.; Zhang, C.; Yang, L.; Chang, R.; Gaut, B.S.; Qiu, L. Genetic diversity in domesticated soybean (Glycine max) and its wild progenitor (Glycine soja) for simple sequence repeat and single-nucleotide polymorphism loci. New Phytol. 2010, 188, 242–253. [Google Scholar] [CrossRef]
- Panchy, N.; Lehti-Shiu, M.; Shiu, S.-H. Evolution of Gene Duplication in Plants. Plant Physiol. 2016, 171, 2294–2316. [Google Scholar] [CrossRef] [PubMed]
- Flagel, L.E.; Wendel, J.F. Gene duplication and evolutionary novelty in plants. New Phytol. 2009, 183, 557–564. [Google Scholar] [CrossRef]
- Lallemand, T.; Leduc, M.; Landès, C.; Rizzon, C.; Lerat, E. An Overview of Duplicated Gene Detection Methods: Why the Duplication Mechanism Has to Be Accounted for in Their Choice. Genes 2020, 11, 1046. [Google Scholar] [CrossRef]
- Parvathy, S.T.; Udayasuriyan, V.; Bhadana, V. Codon usage bias. Mol. Biol. Rep. 2022, 49, 539–565. [Google Scholar] [CrossRef]
- Gao, Y.; Lu, Y.; Song, Y.; Jing, L. Analysis of codon usage bias of WRKY transcription factors in Helianthus annuus. BMC Genet. 2022, 23, 1–12. [Google Scholar] [CrossRef] [PubMed]
- Brule, C.E.; Grayhack, E.J. Synonymous Codons: Choose Wisely for Expression. Trends Genet. 2017, 33, 283–297. [Google Scholar] [CrossRef]
- Qian, W.; Yang, J.R.; Pearson, N.M.; Maclean, C.; Zhang, J. Balanced codon usage optimizes eukaryotic translational efficiency. PLoS Genet. 2012, 8, e1002603. [Google Scholar] [CrossRef]
- Mistry, J.; Finn, R.D.; Eddy, S.R.; Bateman, A.; Punta, M. Challenges in homology search: HMMER3 and convergent evolution of coiled-coil regions. Nucleic Acids Res. 2013, 41, e121. [Google Scholar] [CrossRef]
- Wilkins, M.R.; Gasteiger, E.; Bairoch, A.; Sanchez, J.C.; Williams, K.L.; Appel, R.D.; Hochstrasser, D.F. Protein Identification and Analysis Tools in the ExPASy Server. In 2-D Proteome Analysis Protocols. Methods in Molecular Biology; Humana Press: Totowa, NJ, USA, 1999; Volume 112, pp. 531–552. [Google Scholar] [CrossRef]
- Chou, K.C.; Shen, H.B. Plant-Mploc: A top-down strategy to augment the power for predicting plant protein dubcellular localization. PLoS ONE 2010, 5, e11335. [Google Scholar] [CrossRef]
- Nguyen, L.-T.; Schmidt, H.A.; Von Haeseler, A.; Minh, B.Q. IQ-TREE: A Fast and Effective Stochastic Algorithm for Estimating Maximum-Likelihood Phylogenies. Mol. Biol. Evol. 2015, 32, 268–274. [Google Scholar] [CrossRef]
- Wang, Y.; Tang, H.; DeBarry, J.D.; Tan, X.; Li, J.; Wang, X.; Lee, T.-H.; Jin, H.; Marler, B.; Guo, H.; et al. MCScanX: A toolkit for detection and evolutionary analysis of gene synteny and collinearity. Nucleic Acids Res. 2012, 40, e49. [Google Scholar] [CrossRef] [PubMed]
- Chen, C.J.; Chen, H.; Zhang, Y.; Thomas, H.R.; Frank, M.H.; He, Y.H.; Xia, R. TBtools: An Integrative Toolkit Developed for Interactive Analyses of Big Biological Data. Mol. Plant 2020, 13, 1194–1202. [Google Scholar] [CrossRef] [PubMed]
- Chen, C.; Wu, Y.; Li, J.; Wang, X.; Zeng, Z.; Xu, J.; Liu, Y.; Feng, J.; Chen, H.; He, Y.; et al. Tbtools-Ii: A “One for all, all for one” bioinformatics platform for biological big-data mining. Mol Plant. 2023, 16, 1733–1742. [Google Scholar] [CrossRef]
- Bailey, T.L.; Boden, M.; Buske, F.A.; Frith, M.; Grant, C.E.; Clementi, L.; Ren, J.; Li, W.W.; Noble, W.S. MEME SUITE: Tools for motif discovery and searching. Nucleic Acids Res. 2009, 37, w202–w208. [Google Scholar] [CrossRef] [PubMed]
- Wu, T.; Hu, E.; Xu, S.; Chen, M.; Guo, P.; Dai, Z.; Feng, T.; Zhou, L.; Tang, W.; Zhan, L.; et al. clusterProfiler 4.0: A universal enrichment tool for interpreting omics data. Innovation 2021, 2, 100141. [Google Scholar] [CrossRef]
- Livak, K.J.; Schmittgen, T.D. Analysis of relative gene expression data using real-time quantitative PCR and the 2−ΔΔCT Method. Methods 2001, 25, 402–408. [Google Scholar] [CrossRef]


Disclaimer/Publisher’s Note: The statements, opinions and data contained in all publications are solely those of the individual author(s) and contributor(s) and not of MDPI and/or the editor(s). MDPI and/or the editor(s) disclaim responsibility for any injury to people or property resulting from any ideas, methods, instructions or products referred to in the content. |
© 2024 by the authors. Licensee MDPI, Basel, Switzerland. This article is an open access article distributed under the terms and conditions of the Creative Commons Attribution (CC BY) license (https://creativecommons.org/licenses/by/4.0/).