Article

“Core/Shell” Nanocomposites as Photocatalysts for the Degradation of the Water Pollutants Malachite Green and Rhodamine B

1
Faculty of Chemistry and Pharmacy, Sofia University “St. Kliment Ohridski”, 1, J. Bourchier, 1164 Sofia, Bulgaria
2
Faculty of Physics, Sofia University “St. Kliment Ohridski”, 5a, J. Bourchier, 1164 Sofia, Bulgaria
*
Authors to whom correspondence should be addressed.
Int. J. Mol. Sci. 2024, 25(12), 6755; https://doi.org/10.3390/ijms25126755
Submission received: 21 April 2024 / Revised: 4 June 2024 / Accepted: 13 June 2024 / Published: 19 June 2024

Abstract

:
“Core/shell” composites are based on a ferrite core coated by two layers with different properties, one of them is an isolator, SiO2, and the other is a semiconductor, TiO2. These composites are attracting interest because of their structure, photocatalytic activity, and magnetic properties. Nanocomposites of the “core/shell” МFe2O4/SiO2/TiO2 (М = Zn(II), Co(II)) type are synthesized with a core of MFe2O4 produced by two different methods, namely the sol-gel method (SG) using propylene oxide as a gelling agent and the hydrothermal method (HT). SiO2 and TiO2 layer coating is performed by means of tetraethylorthosilicate, TEOS, Ti(IV) tetrabutoxide, and Ti(OBu)4, respectively. A combination of different experimental techniques is required to prove the structure and phase composition, such as XRD, UV-Vis, TEM with EDS, photoluminescence, and XPS. By Rietveld analysis of the XRD data unit cell parameters, the crystallite size and weight fraction of the polymorphs anatase and rutile of the shell TiO2 and of the ferrite core are determined. The magnetic properties of the samples, and their activity for the photodegradation of the synthetic industrial dyes Malachite Green and Rhodamine B are measured in model water solutions under UV light irradiation and simulated solar irradiation. The influence of the water matrix on the photocatalytic activity is determined using artificial seawater in addition to ultrapure water. The rate constants of the photocatalytic process are obtained along with the reaction mechanism, established using radical scavengers where the role of the radicals is elucidated.

1. Introduction

In recent years, investigations on the purification of polluted waters have been associated with the materials applied and the processes for pollutant elimination. Research on water’s purification by photocatalysis started by testing mainly TiO2 as a photocatalyst under UV light irradiation [1], both pure [2] and modified [3], followed by other oxides such as ZnO, NiO, and CeO2 [4,5,6,7,8,9,10,11], as well as sulfides such as CdS, ZnS [12,13], and mixed-metal oxides with spinel structure of the type MFe2O4 [14,15,16]. Mixed-metal oxides of the Zn1−xNixFe2O4 type with a spinel structure have been tested for Malachite Green (MG) decomposition [17], methylene blue (MB) dye degradation under visible light with degradation efficiency increasing with Ni(II) content [18], NixCo1 − xFe2O4 for MB decomposition [19], and CoxMg1 − xFe2O4 for photocatalytic degradation of MB both under sunlight and simulating visible light, where it was found that photocatalytic activity can be limited by an excessive amount of Co(II) [20], etc. Investigations on mixed-metal oxides as photocatalysts have developed in the direction of their incorporation into composites. Composites possessing so-called “core–shell” structures contain a mixed-metal oxide, very often ferrite, as a core in order to ensure magnetic functionality. In order to vary the functionality, quite often, the shell is made of different materials, among them ferrites, perovskites, silica, titania, noble metals, polymers, etc. [21]. For example, M0.5Fe2.5O4 (M = Co, Mn, and Ni) and Fe3O4 have been experimented with, where both ferrite and magnetite have been tested as the core and shell [22]. Similar core/shell structures CoFe2O4/ZnFe2O4 and, vice versa, ZnFe2O4/CoFe2O4, have been synthesized for tunable magnetic properties [23]. The variations of core/shell combinations, as well as the methods for their synthesis, their properties, and their area of application, including photocatalytic activity, are summarized in [21]. Among all of the compositions reviewed [21], only a few of them, containing a core coated with two consecutive layers/shells made of compounds differing in properties, have been studied, such as CoFe2O4/SiO2/TiO2 [24,25,26], CoFe2O4/SiO2/Y2O3:Tb3+ [27], and MnFe2O4/SiO2/CeO2 [28]. Along with the investigation of luminescence [27] and magnetic properties [24,25,26], including photocatalytic activity for the degradation of dyes such as dichlorophenol–indophenol [25], MB [24,26,28] has been studied under UV light irradiation. It has been shown that “core–shell” structured materials could improve photocatalytic activity in different ways, such as enhancing surface reactions, efficient charge transfer at the heterojunction interface, band structure modifications, and by improving the surface area [29].
The introduction of a SiO2 layer between the ferrite core of the MFe2O4 type and the TiO2 layer aims to reduce the recombination process between the TiO2 layer and the ferrite, as SiO2 could act as an insulator [24,30]. SiO2 is used as a middle layer due to its abundant –OH on the surface, as well as its high chemical and mechanical stability [27].
One of the challenges with “core/shells” of the MFe2O4/SiO2/TiO2 type is to evidence the phase composition and the structure, especially to prove the presence of TiO2 on the surface, taking into account its crucial role in the photocatalytic process. A suitable combination of experimental techniques is needed, such as TEM/EDS and XPS. Another issue to be mentioned is related to the polymorphs of TiO2, anatase and rutile, especially their ratio. The latter can be observed by Rietveld analysis based on XRD data. Actually, the Rietveld analysis of XRD data is not a very commonly applied approach, especially not in the MFe2O4/SiO2/TiO2 characterization discussed so far. Anatase, rutile, and brookite are the crystalline phases of TiO2. Of those, anatase has shown the highest photocatalytic activity [31,32], usually produced by the calcination of TiO2 at around 500–600 °C [33]. At that temperature, mixed-metal oxides, such as cobalt ferrite and zinc ferrite, are known to be thermally stable compounds.
The purpose of the work presented is to obtain nanocomposites of the “core/shell” МFe2O4/SiO2/TiO2 (M = Zn(II), Co(II)) type, where a layer of titania is deposited on nanoparticles of metal ferrite with pre-deposited silica in order to study their structure and phase composition by different methods, including Rietveld analysis of XRD data, as well as to study their properties, both photocatalytic activity under UV-light and simulated solar irradiation and magnetic properties. The latter is to be expected due to the МFe2O4 ferrites used as a core. Two organic dyes different from those used in [24,25,26] are selected as model pollutants in water solutions. Rhodamine B, RhB (Figure 1a), is widely used in the textile industry and is a potential cause for carcinogenic and teratogenic effects, but is known for its good stability [2,34]. The other one is the Malachite Green, MG (Figure 1b), a basic, synthetic organic dye, soluble in water with antimicrobial properties, used for the dyeing of leather, wool, silk, paper, etc., as well as for the control of fungal and bacterial infections of fish, having mutagenic and carcinogenic properties [35].
The selection of the dyes tested in this study was based on (i) their easy detection by UV/Vis spectrophotometry, at 550 nm for Rh B and 622 nm for MG, respectively; (ii) the convenience of the preparation of the model solutions for photocatalytic tests; (iii) previous experience of their decomposition using other photocatalysts synthesized by the authors [3,17].
The influence of the water matrix on the photocatalytic activity is followed by the testing of dye solutions both in ultrapure and artificial seawater. The recycling and stability of the composite prepared after recycling is investigated.

2. Results

2.1. Core/Shell Structured Composites Based on Sol-Gel (SG)-Produced CoFe2O4

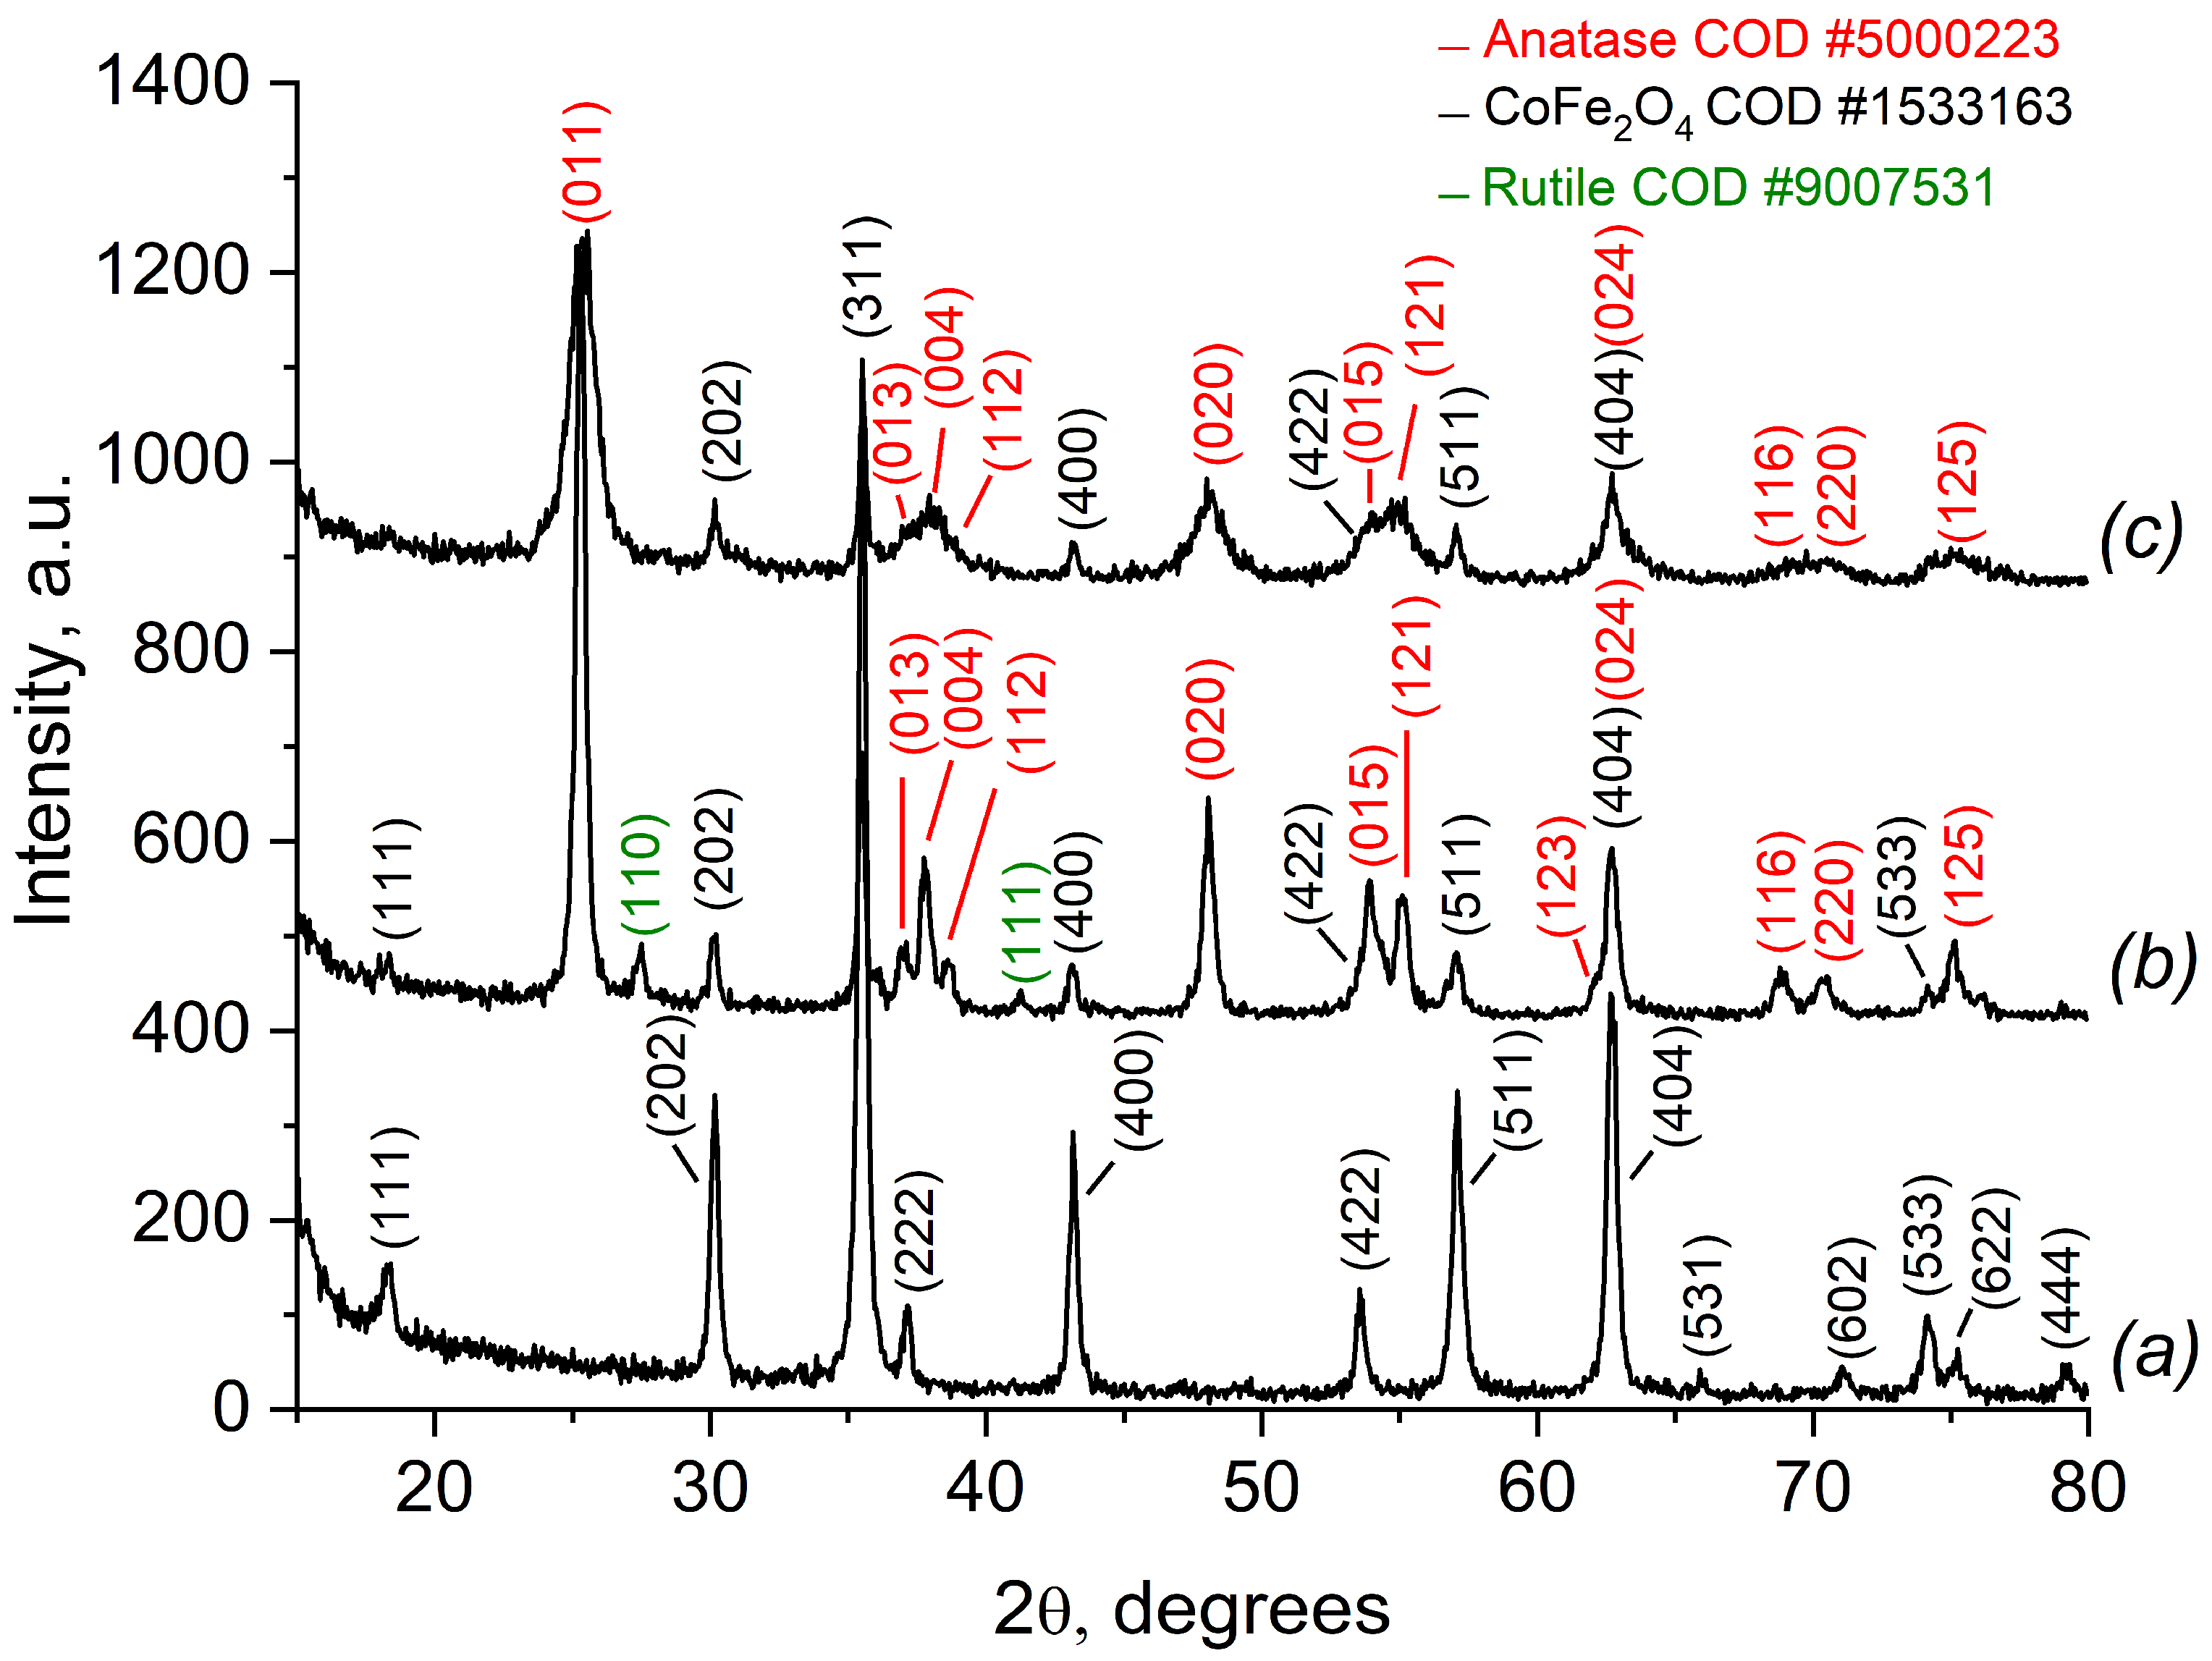
2.1.1. Phase Composition and the Crystal Structure of CoFe2O4, Synthesized by the Sol-Gel Method (SG), and of the Composite CoFe2O4/SiO2/TiO2 (SG) Based on It

According to the XRD pattern (Figure 2a), the CoFe2O4 prepared by the sol-gel method has a well-crystallized single phase of the face-centered cubic spinel structure (space group Fd3m).
The calculated unit cell parameter (Table 1) is in good agreement with crystallographic databases (8.3550 Å, COD #00-591-0063).
The XRD pattern of the nanocomposite CoFe2O4/TiO2 (SG) (Figure 2b) shows pure CoFe2O4 with diffraction peaks of TiO2, anatase, and rutile. The unit cell parameters and the crystallite size were calculated using Rietveld’s method. The unit cell calculation shows that, for anatase, a = 3.7833 and c = 9.4391 Å, for rutile, a = 4.5815 and c = 2.9531 Å, and for CoFe2O4, a = 8.3652 Å. The XRD pattern of the nanocomposite CoFe2O4/SiO2/TiO2 (SG) displays the presence of anatase only (Figure 2c) with unit cell parameters for anatase a = 3.7893 and c = 9.4364 Å, and for CoFe2O4, a = 8.3631 Å. A slight tendency toward increasing the crystallite size is observed for CoFe2O4, i.e., the pure one has a crystallite size of 48 nm, while the one included in the nanocomposites has a size of 56 and 53 nm, respectively, for CoFe2O4/TiO2 (SG) and CoFe2O4/SiO2/TiO2 (SG). The potential reason for this tendency is the secondary crystal growth caused by additional thermal treatment during TiO2 formation. A tendency toward decreasing the crystallite size is observed for TiO2 (anatase): 25 nm for CoFe2O4/TiO2 (SG) and 16 nm for CoFe2O4/SiO2/TiO2 (SG), respectively.
The nanocomposites CoFe2O4/TiO2 (SG) and CoFe2O4/SiO2/TiO2 (SG) show different phase compositions of the TiO2 layer, i.e., CoFe2O4/TiO2 (SG) contains both polymorphs, anatase and rutile, but for CoFe2O4/SiO2/TiO2 (SG), only anatase is detected (Table 1). It is known that different experimental conditions influence the transformation of the metastable anatase phase of TiO2 to the equilibrium rutile phase, among which are the synthetic procedure, the initial material, the calcination time, the atmosphere of calcination, some additives, etc. [36]. Upon heating, the A/R (anatase/rutile) ratio depends on the temperature applied; for example, rutile contents (%) of 0 (500 °C), 46 (600 °C), and 94 (700 °C) are reached for sol-gel-produced TiO2 [37]. In our case, in addition to the annealing temperature, the presence of SiO2 also influences the transformation A/R ratio. It can be assumed that the phase transition of anatase to rutile is limited by the presence of SiO2. As a result, at 550 °C, only anatase was observed, while in the samples without SiO2 layer, TiO2 polymorph anatase partially transformed into rutile.

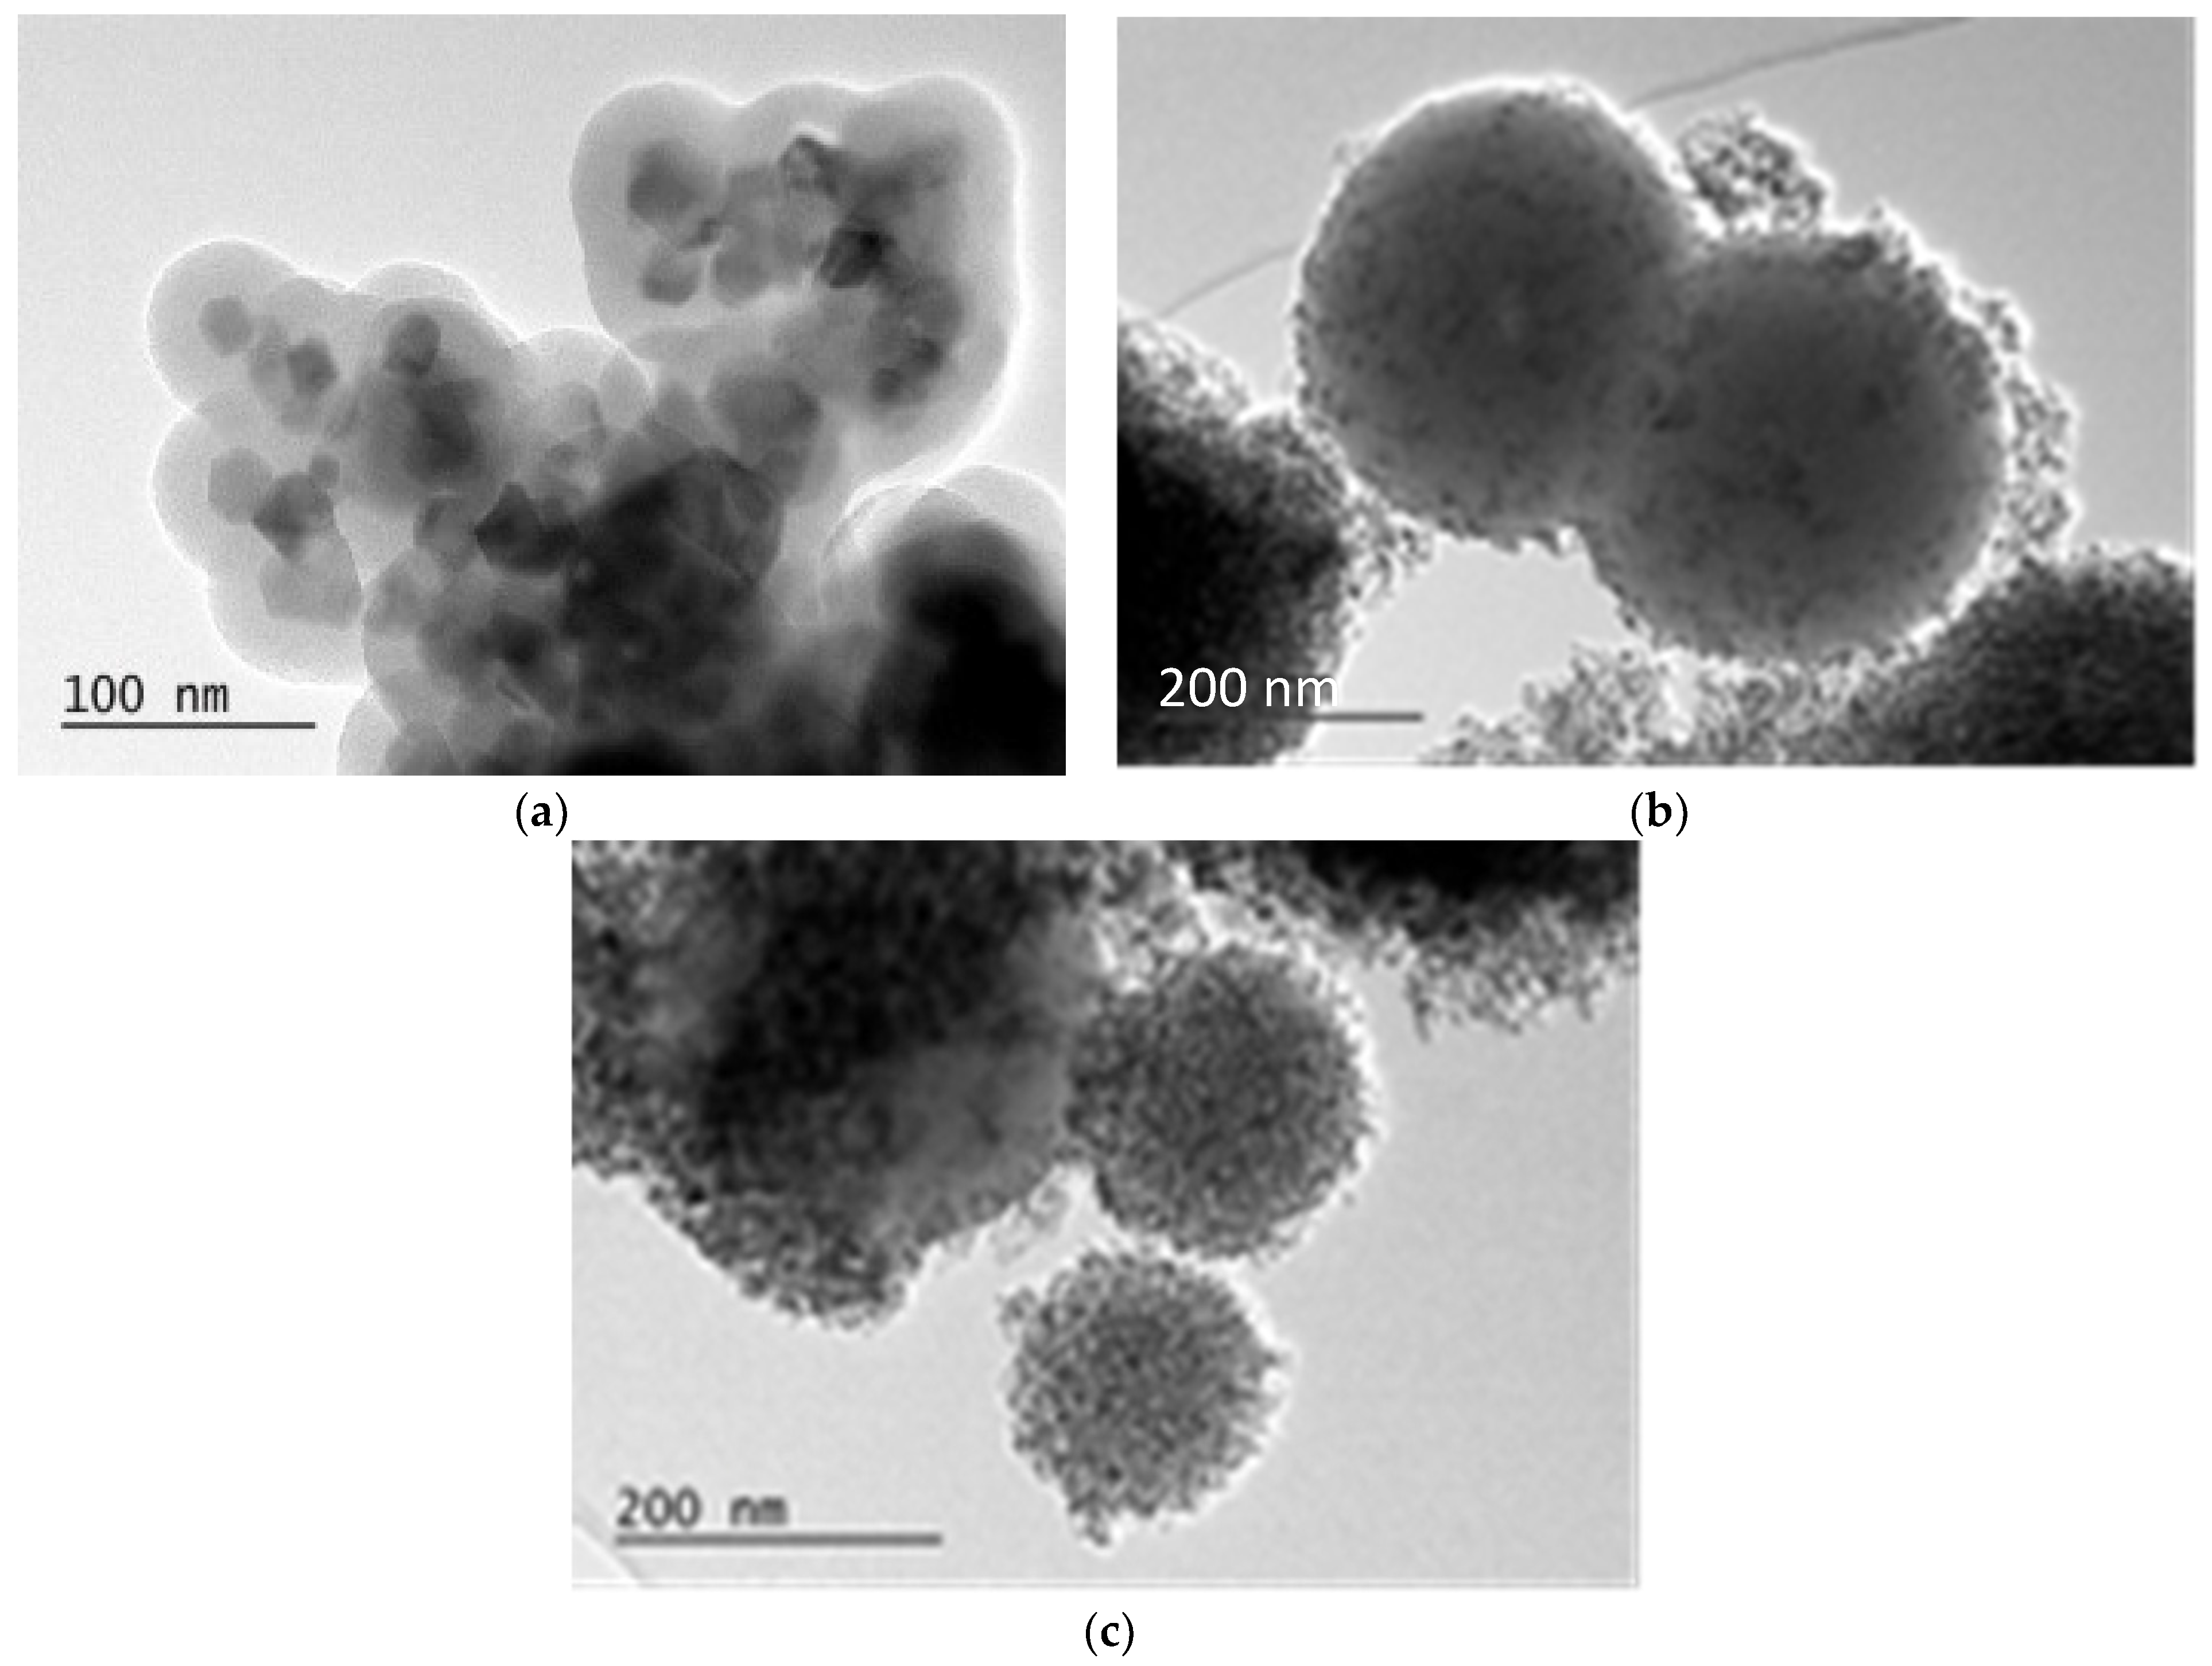
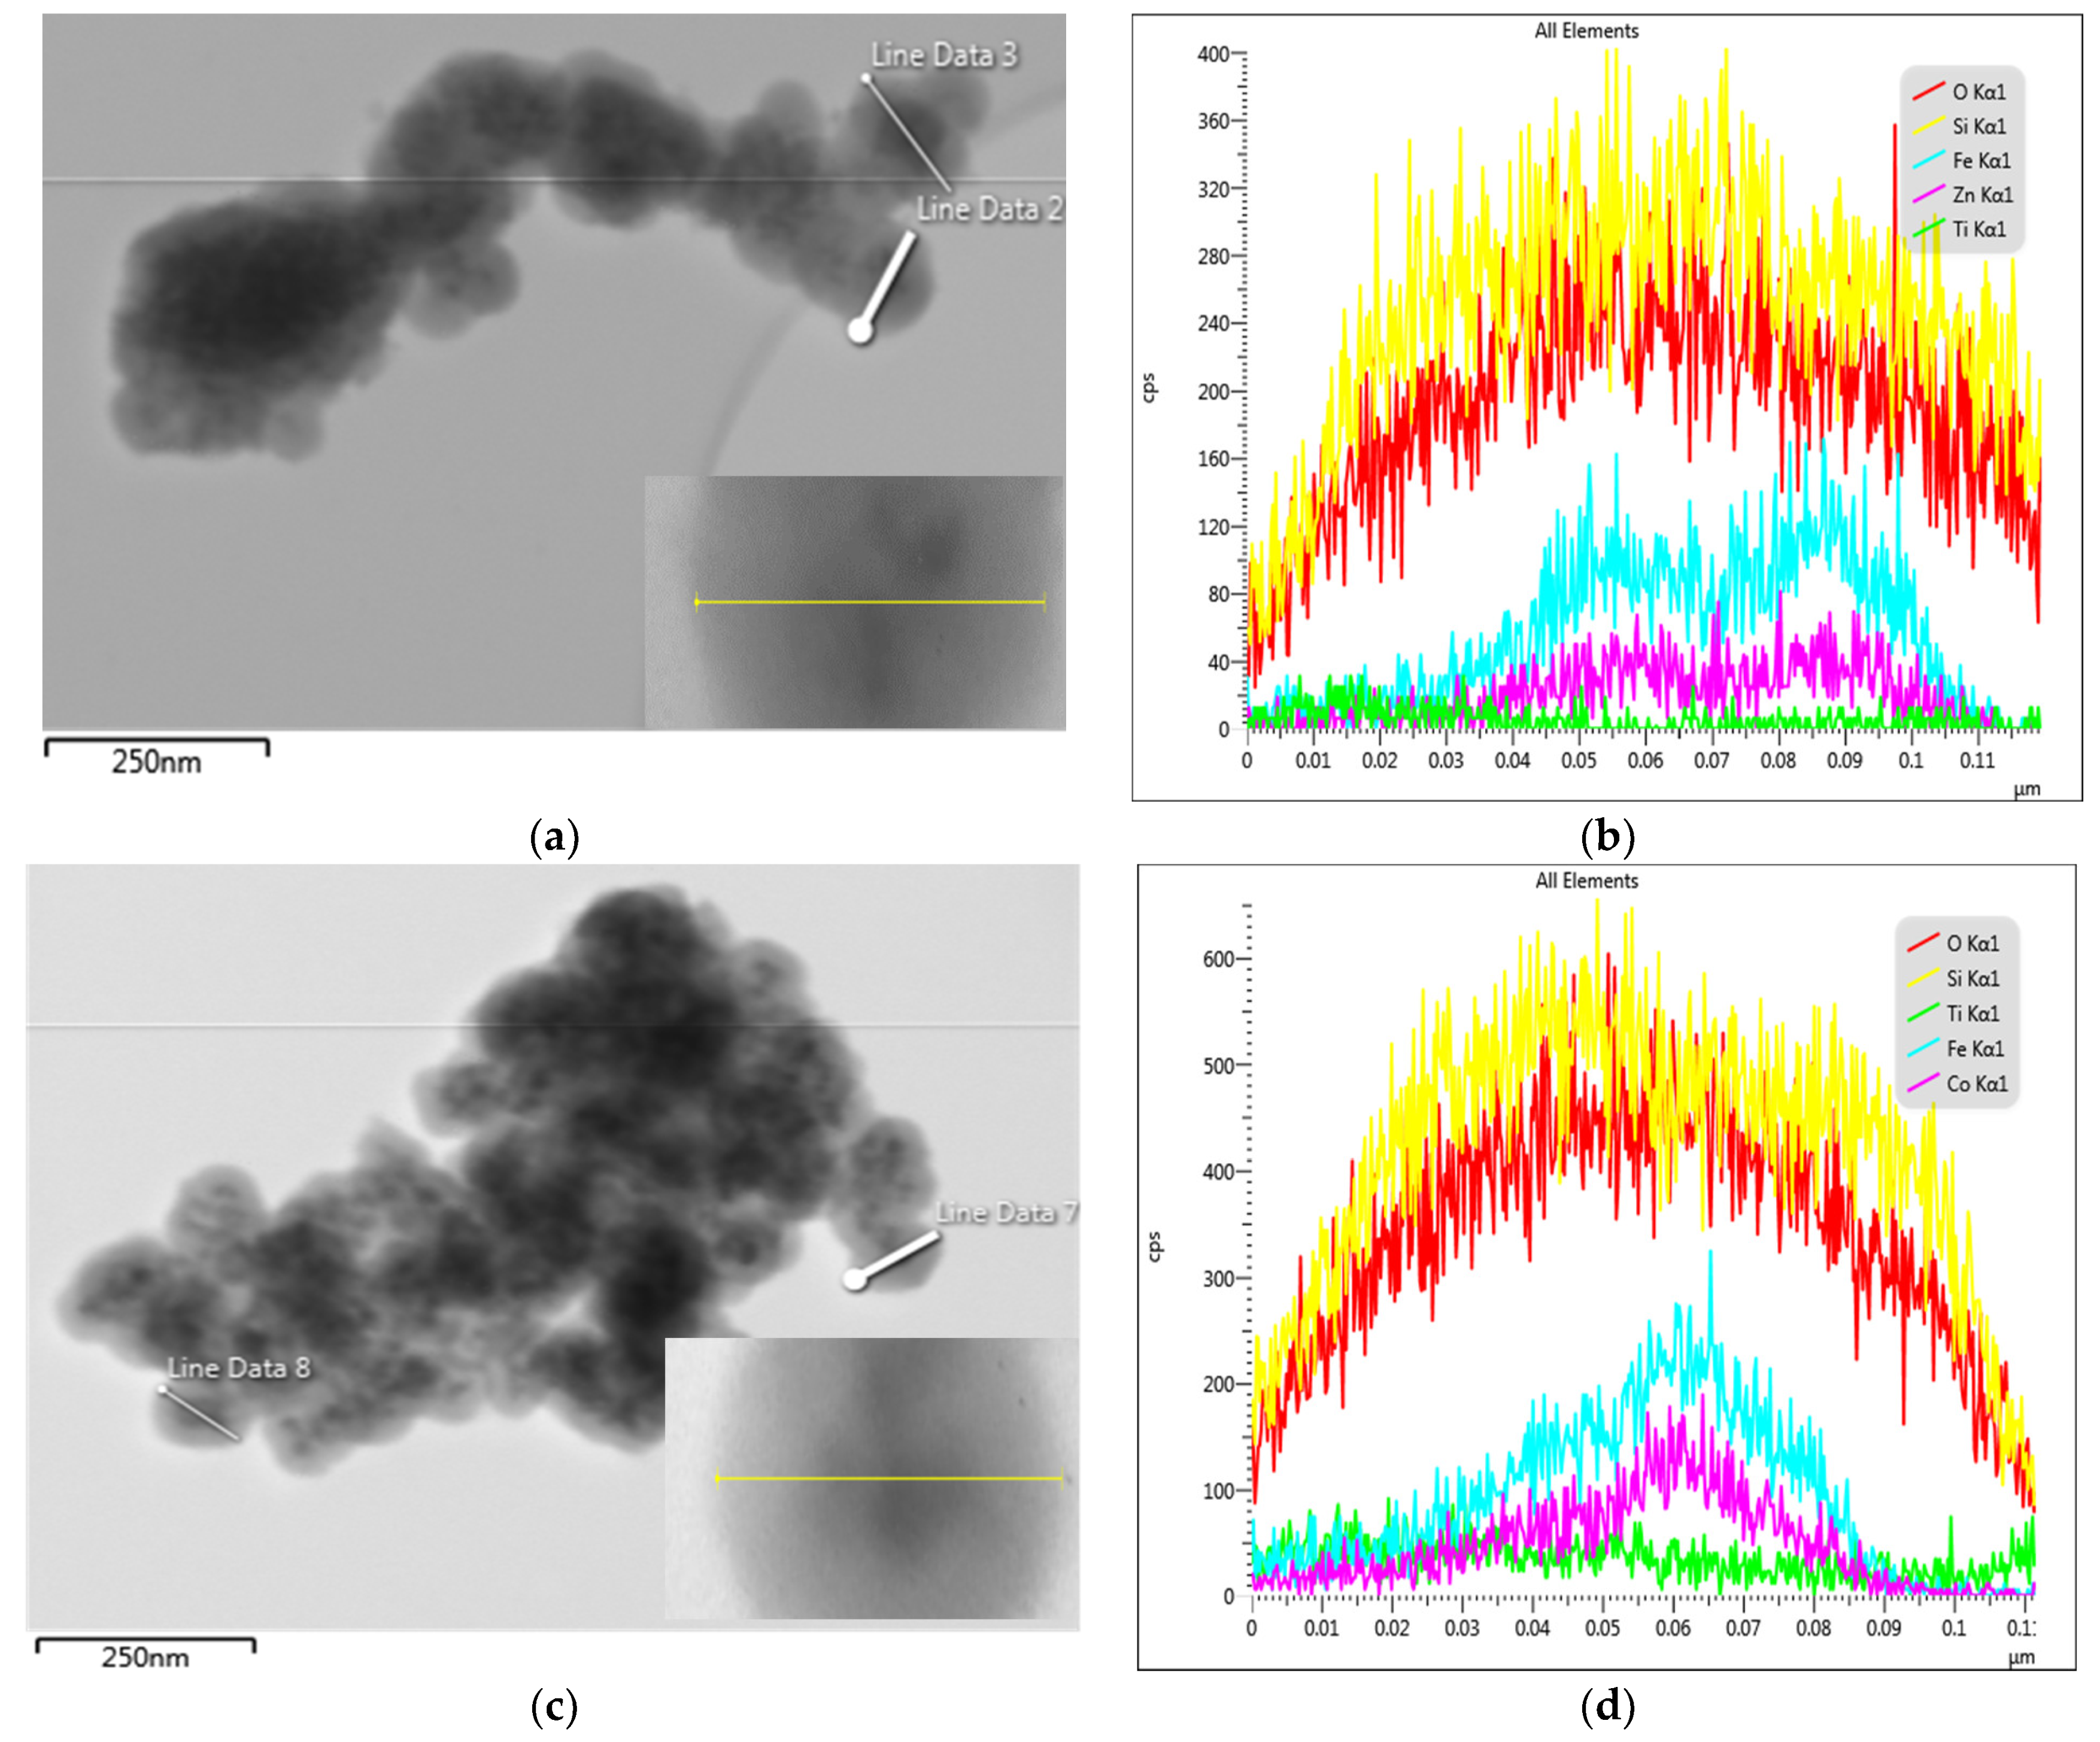
2.1.2. Morphology of the Composites CoFe2O4/SiO2/TiO2 (SG)

The morphology and the structure of as-synthesized composites can be observed in the transmission electron microscopy graphs (TEM) (Figure 3). This is significant, particularly for the one-layered core–shell CoFe2O4/SiO2 (SG), where XRD is not informative because it displays an amorphous sample. According to the information obtained by TEM, CoFe2O4/SiO2 (SG) contains a very well-crystallized core of CoFe2O4 with a well-shaped covering layer of SiO2 (Figure 3a and Figure S1). In spite of some aggregation observed, the structure of a single core covered with a shell can be detected. Regarding the thickness of the SiO2 layer, it can be estimated to be, on average, approximately 25–30 nm.
After the CoFe2O4/SiO2 composite is coated with TiO2 by the procedure presented in Section 4.2.3, the CoFe2O4/SiO2/TiO2 (SG) composite is formed. The latter can be seen in the TEM micrographs (Figure 3b,c), where TiO2 coating on the surface of silica spheres can be observed. The size of the CoFe2O4/SiO2 spheres (Figure 3a) is approximately 100 nm in diameter, while the size of the CoFe2O4/SiO2/TiO2 (SG) spheres (Figure 3b,c) is bigger, roughly 150–300 nm. That difference in the size could be explained by the presence of the TiO2 layer on CoFe2O4/SiO2/TiO2. In Figure 3a, the CoFe2O4 core is very well formed and visible, and the cobalt ferrite core of CoFe2O4/SiO2/TiO2 (SG) (Figure 3b,c) is not visible. Quite likely, the reason is that the dense layer of TiO2 disturbs the electron beam penetration.
The experiments proved that, under UV illumination, the two-layered core–shell composite CoFe2O4/SiO2/TiO2 (SG) has better photocatalytic activity for MG decomposition with a rate constant of 5.8 × 10⁻³ min−1, in comparison with the activity of one-layered CoFe2O4/TiO2 (SG) with a rate constant 2.9 × 10⁻³ min−1 (Figure 4). It should be mentioned that the activity detected is lower than the activity of TiO2 P25 under the same experimental conditions, with a rate constant of 12.0 × 10⁻³ min−1 obtained, for instance, in [38].

2.2. “Core/Shell” Structured Composites MFe2O4/SiO2/TiO2 (M = Zn, Co) Based on Hydrothermally (HT) Produced CoFe2O4 and ZnFe2O4

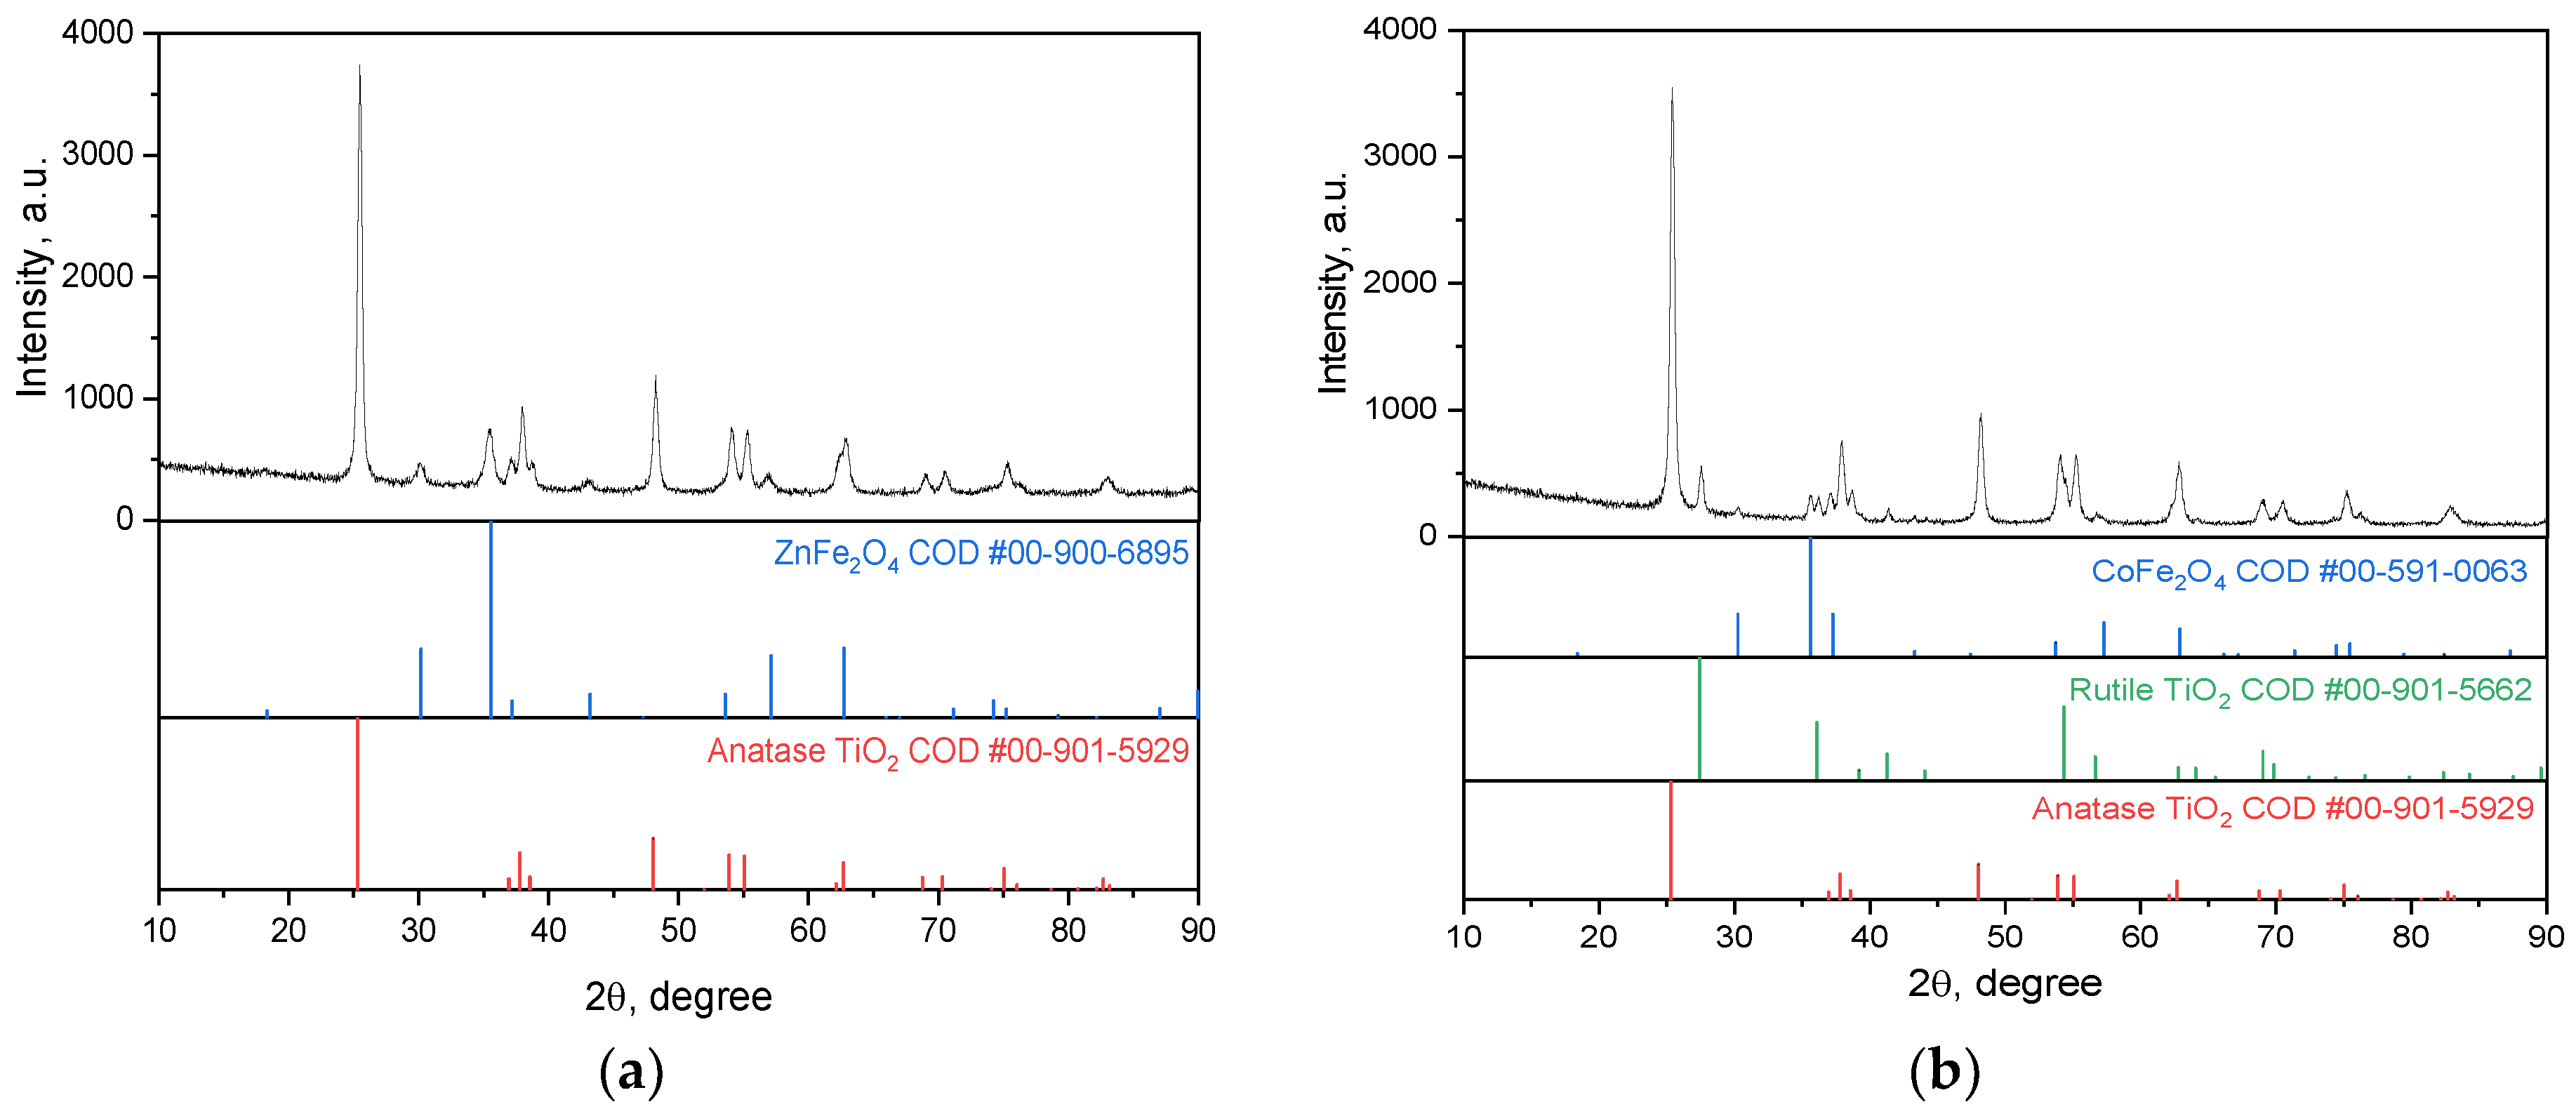
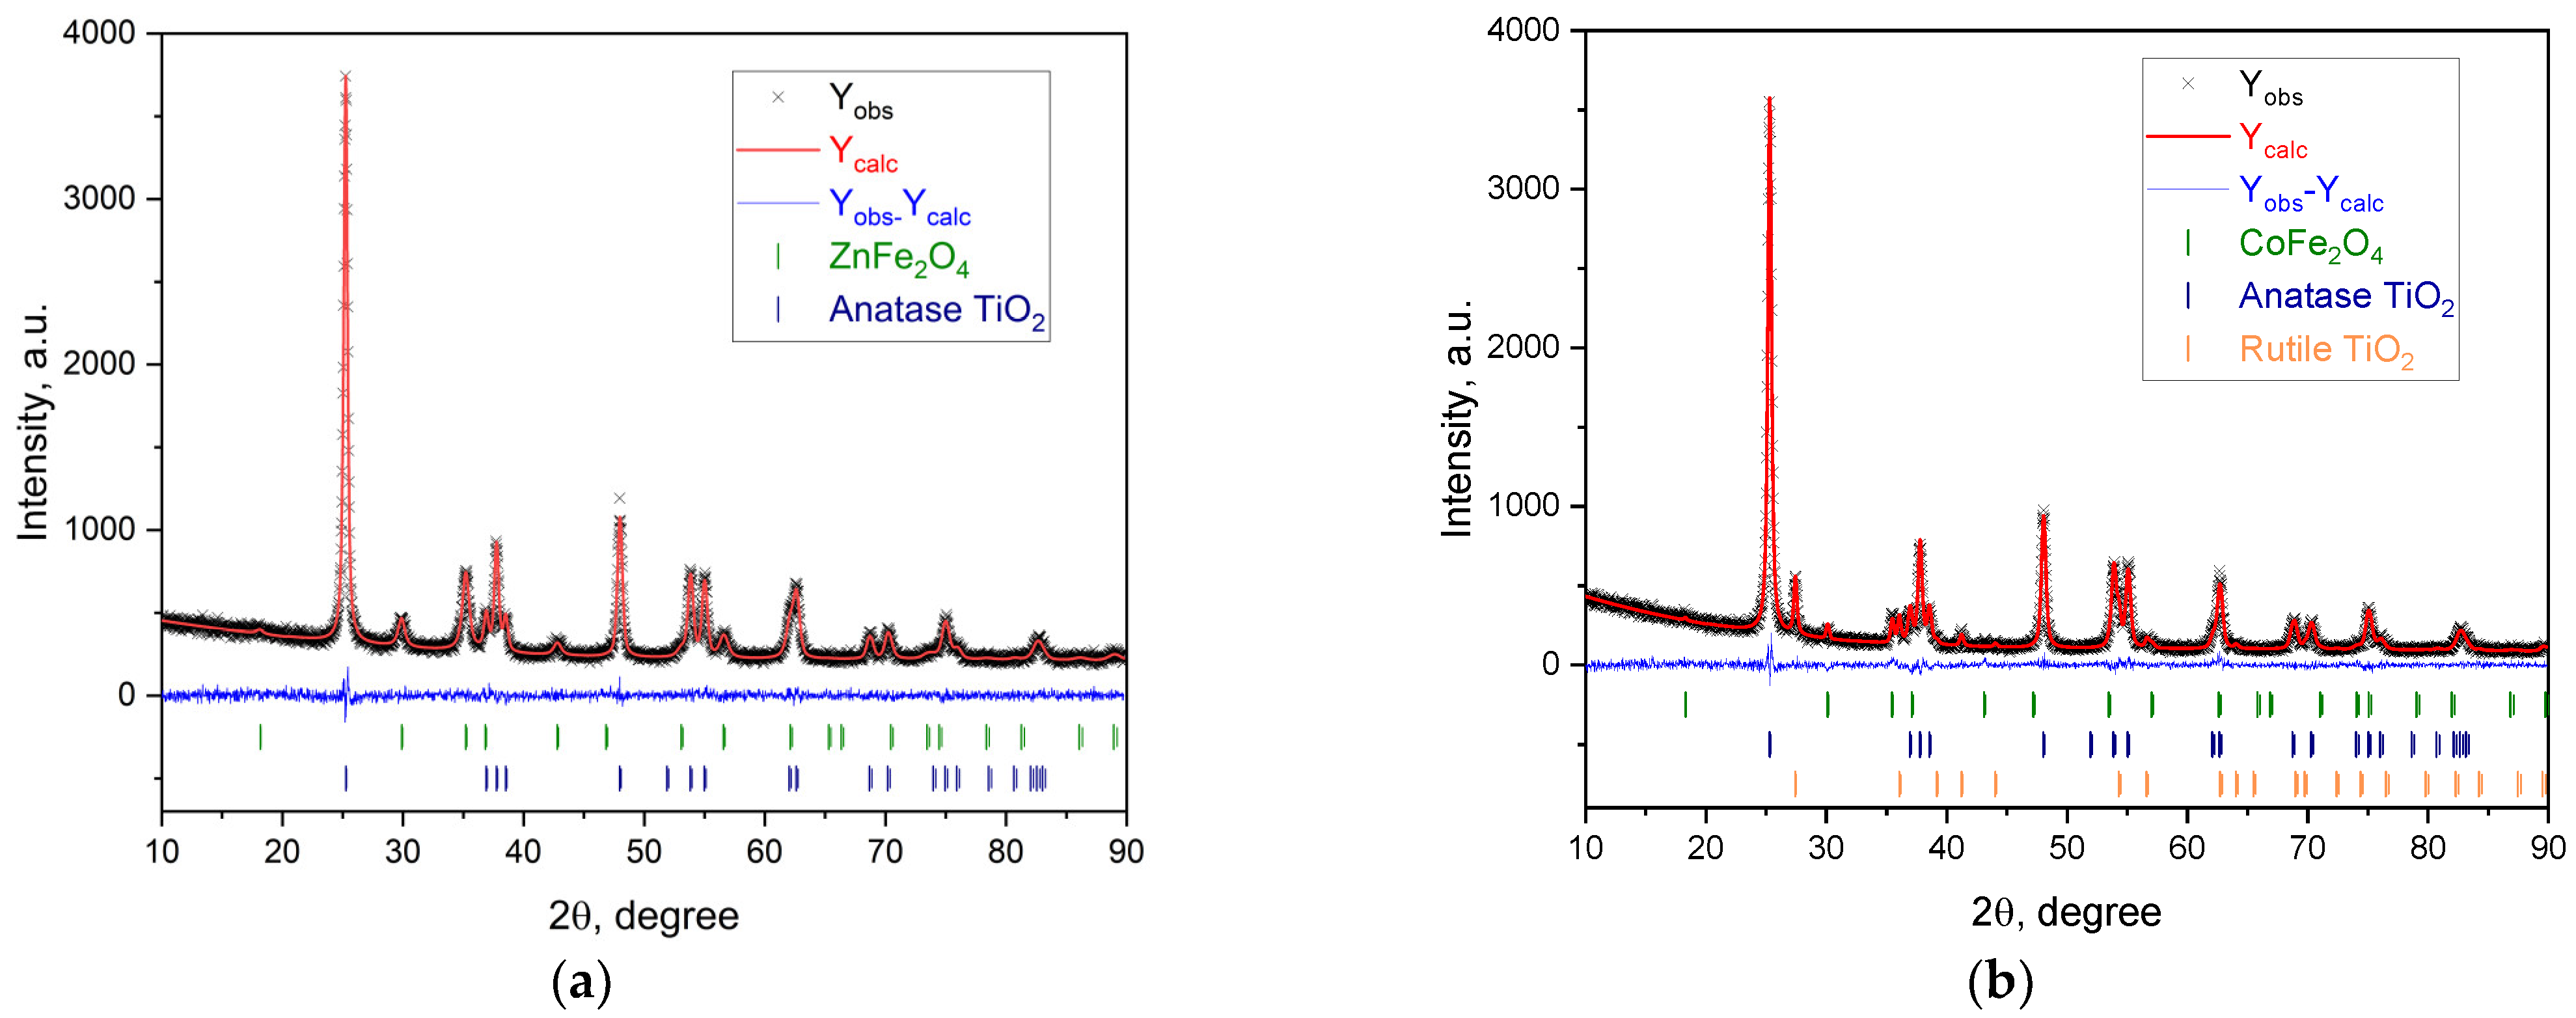
2.2.1. Phase Composition of MFe2O4/SiO2/TiO2 (M = Zn, Co), with CoFe2O4 and ZnFe2O4 Produced via the Hydrothermal (HT) Method

According to the XRD pattern (Figure 5a,b, the top), both CoFe2O4 and ZnFe2O4 prepared by the HT method have well-crystallized phases. The unit cell parameters calculated (Table 2) are in good agreement with crystallographic databases (COD # 00-900-6895 and 00-591-0063, for ZnFe2O4 and CoFe2O4, respectively). No change in the unit cell parameter for MFe2O4 after adding the layers (Table 2) can be expected. The XRD pattern of the ZnFe2O4/SiO2/TiO2 (HT) nanocomposite only shows the presence of anatase (Figure 5a, the bottom) with unit cell parameters after calculation for anatase, a = b = 3.7899 and c = 9.5230 Å, and for ZnFe2O4, a = b = c = 8.4463 (9) Å. For CoFe2O4/SiO2/TiO2 (HT), both rutile and anatase are registered (Figure 5b, middle and bottom, correspondingly). The unit cell parameter calculations for CoFe2O4 are a = b = c = 8.3874 Å, for rutile, a = b = 4.5953 (6), c = 2.9608 (7) Å, and for anatase, a = b = 3.7860 and c = 9.5185 Å. For MFe2O4 (M = Zn, Co), included in the nanocomposites, the crystallite size is 19 and 34 nm, for ZnFe2O4/SiO2/TiO2(HT) and CoFe2O4/SiO2/TiO2 (HT), respectively (Table 2).
The Rietveld analysis of the XRD data of the composites MFe2O4/SiO2/TiO2 (M = Zn, Co) was used to gain additional information about the structural and microstructural characteristics of the samples. The crystalline phase ratios were also observed (Figure 6).
In Table 2, the weight fraction (%) of the components of the composites is shown. The synthetic procedure followed for the ferrite MFe2O4 (M = Zn, Co) is the same, but the weight of CoFe2O4 detected is low. Due to the magnetic field caused by the magnetic stirrer used (Section 4.2.2), during the coating of CoFe2O4 with SiO2, some of the CoFe2O4 sticks to the stirrer. CoFe2O4 can be easily separated by the composite sample formed. Its amount is reproducible due to the same experimental conditions used, i.e., the initial amount of CoFe2O4, the power of the magnetic stirrer, and the size of the magnetic anchor.
The morphology of the ZnFe2O4/SiO2/TiO2 (HT) and CoFe2O4/SiO2/TiO2 (HT) composites characterized by TEM/EDS is presented in Figure 7. The agglomerates and well-shaped spheres can be seen (Figure 7a,c). In order to prove the core–shell structure and phase composition, a line scan through a well-defined particle was performed (shown in the insets). By that, it was established that the darker area (the core) is the well-crystalized ferrite (consisting of Fe, Zn/Co) surrounded by a relatively thick layer of SiO2 and a very thin uniform layer of TiO2 (Figure 7b,d). The results are consistent with the conclusions from the XPS analysis, confirming the presence of the thin TiO2 shell on the top of the thicker SiO2 layer (Figure 8 and Figure 9).
To prove the elemental composition of “core/shell” structures, X-ray photoelectron spectroscopy (XPS) was applied. The characteristic peaks of the surface atoms in the XPS spectra were registered, and based on the energy of these peaks, the identification of the surface elements was carried out (Figure S2). All core-level spectra were referenced to the C1s hydrocarbon peak at 284.5 eV to compensate for surface charging (internal charge correction [39]). Based on the XPS spectrum of the ZnFe2O4/SiO2/TiO2 (HT) composite, the following comments can be added (Figure 8): due to its asymmetry, the O1s peak can be deconvoluted to three components (three different oxygen species). The peaks at 533.4, 531.3, and 530.2 eV can be ascribed to Si-O-Si in SiO2 and Ti-O-Si and Ti-O-Ti in TiO2 [40,41]. This indicates (i) a strong interaction between the SiO2 and TiO2 layers and (ii) an extremely thin TiO2 layer (taking into account the integral area of this peak compared to the rest), which is in a good correlation with the results from the TEM/EDS analysis. The location of Ti2p3/2 at 459.1 eV and the splitting of 5.7 eV between Ti2p3/2 and Ti2p1/2, indicate the Ti(IV) oxidation state [42]. The peaks at 103.6 and 101.7 eV can be attributed to the Si-O bond in SiO2 and Si-O-Ti, respectively [43].
The XPS spectrum of CoFe2O4/SiO2/TiO2 closely resembles that of the ZnFe2O4/SiO2/TiO2 composite (Figure 9). The O1s peaks are located at 533.0, 531.7, and 530.2 eV for Si-O-Si in SiO2 and Ti-O-Si and Ti-O-Ti in TiO2, respectively. As expected, the Si2p peaks are located at 103.6 and 101.8 eV for the Si-O bond in SiO2 and Si-O-Ti, respectively. Accordingly, Ti2p3/2 is also located at 459.1 eV, while Ti2p1/2 is at 464.4 eV (peak separation of 5.3 eV), which indicates the Ti(IV) oxidation state. A difference in the XPS spectra of both composites was detected in the overall integral area of the peak corresponding to TiO2, which is higher in CoFe2O4/SiO2/TiO2 than in the ZnFe2O4 SiO2/TiO2 composite. This result correlates well with the XRD data.
The characteristic peaks for Zn, Co, and Fe atoms were not registered in the XPS spectra of the composites, i.e., those are the atoms of the core ferrites (Figure S2). XPS is a surface-sensitive technique. The X-ray penetration through SiO2/TiO2 layers is several µm, while the thickness of the SiO2 layer is approximately 25–30 nm (as commented in Section 2.1.2., page 5, for example). The attempts to register Zn, Co, and Fe atoms were unsuccessful. The reason is that the photoelectron escape depth is approximately 10 nm or less, so only those escaping the samples without energy loss can contribute to the XPS [39].

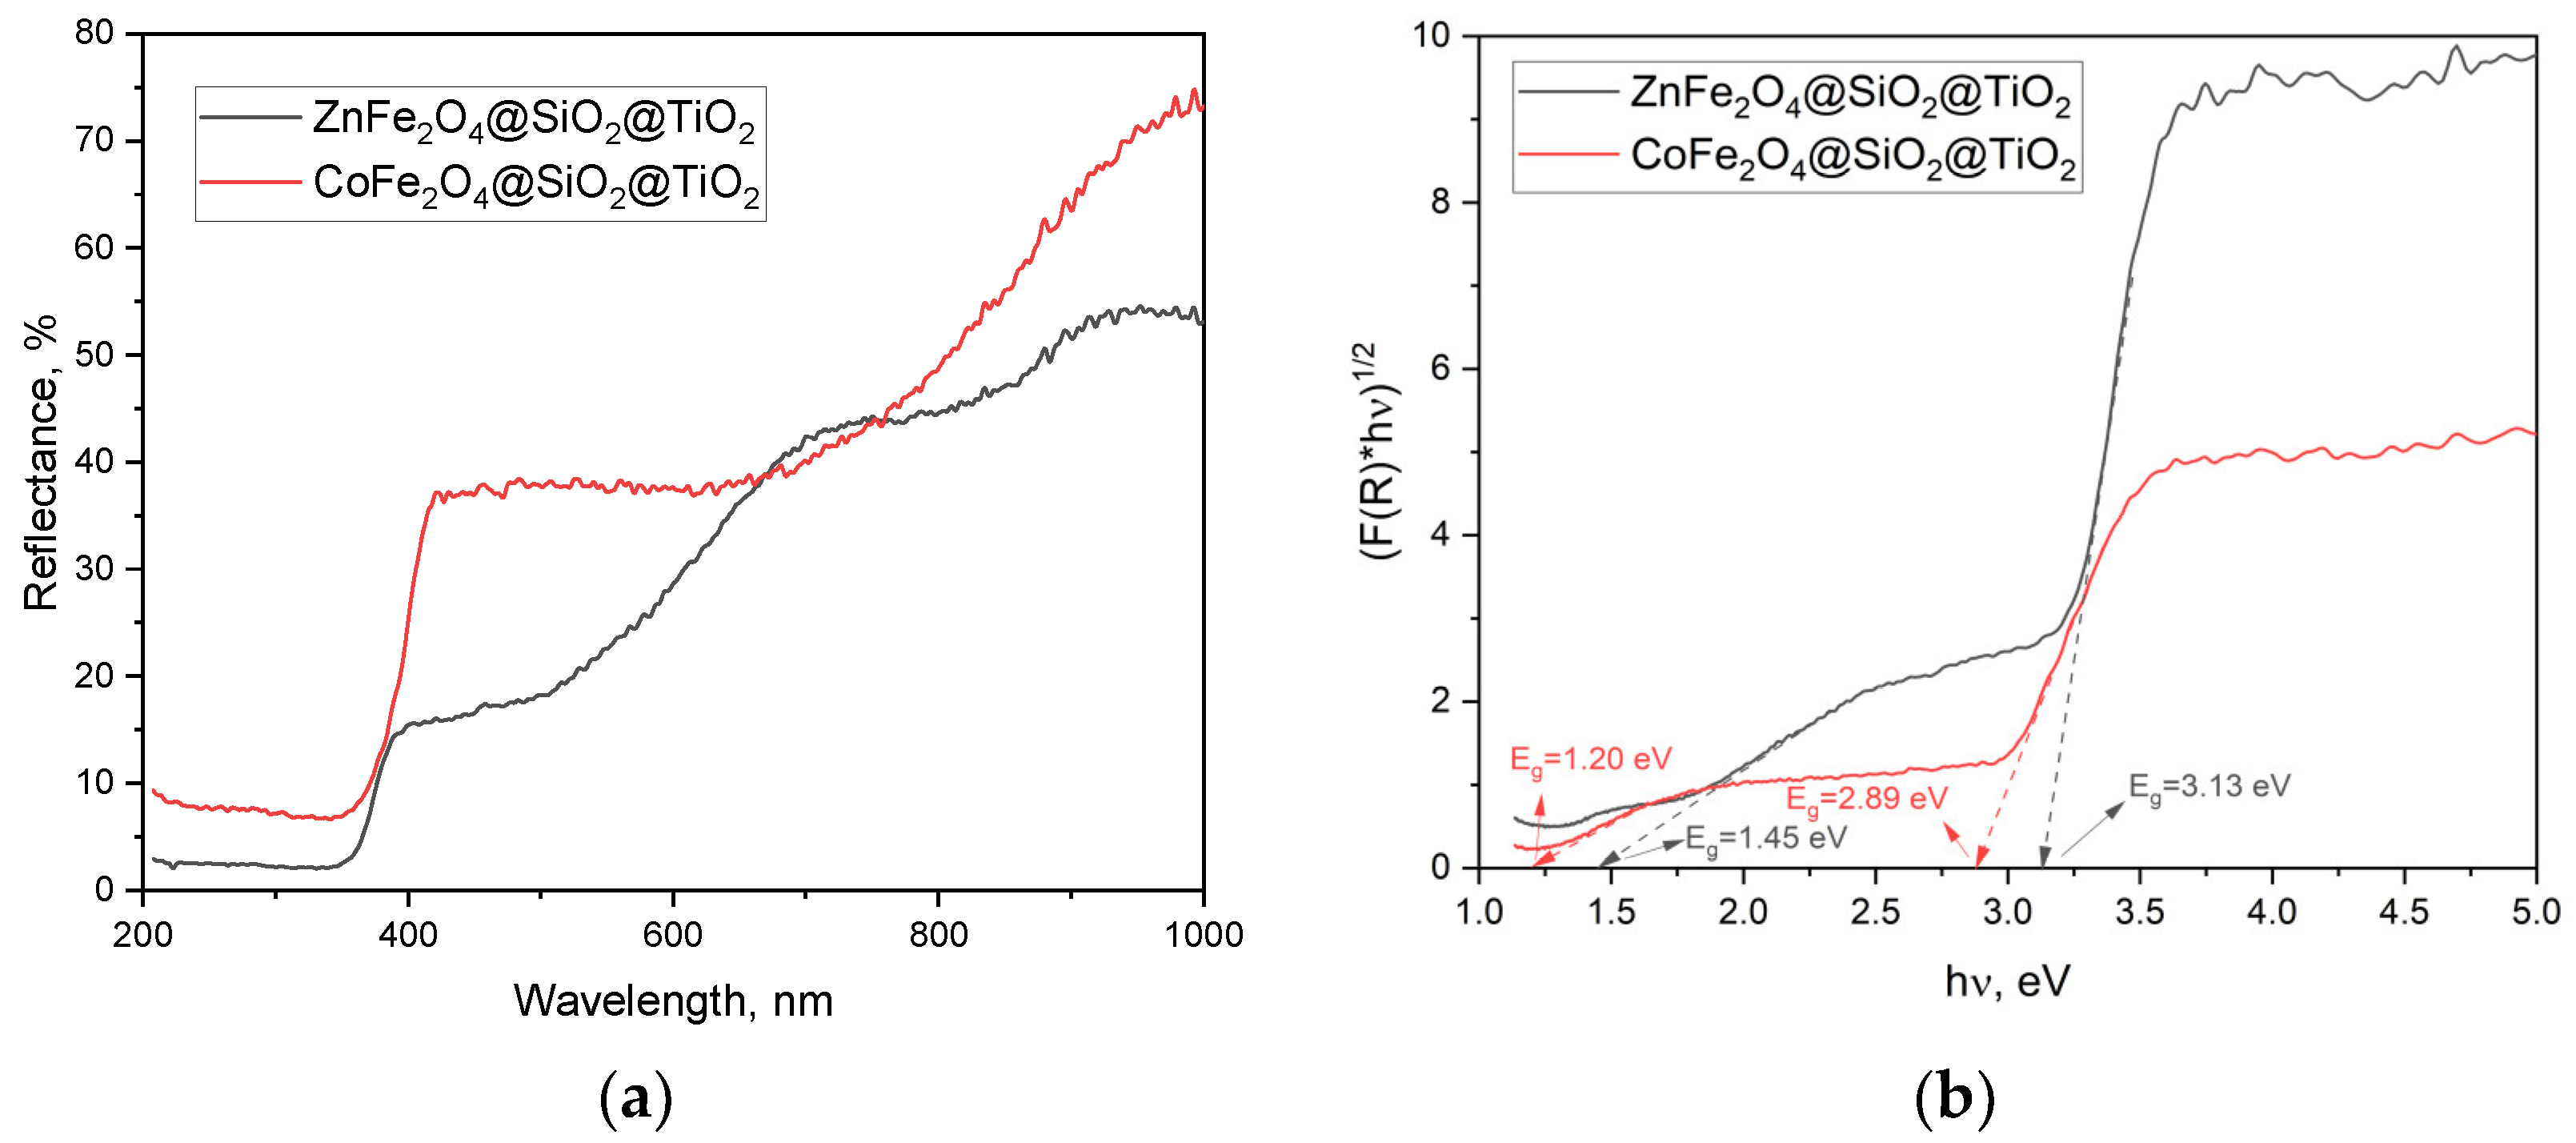
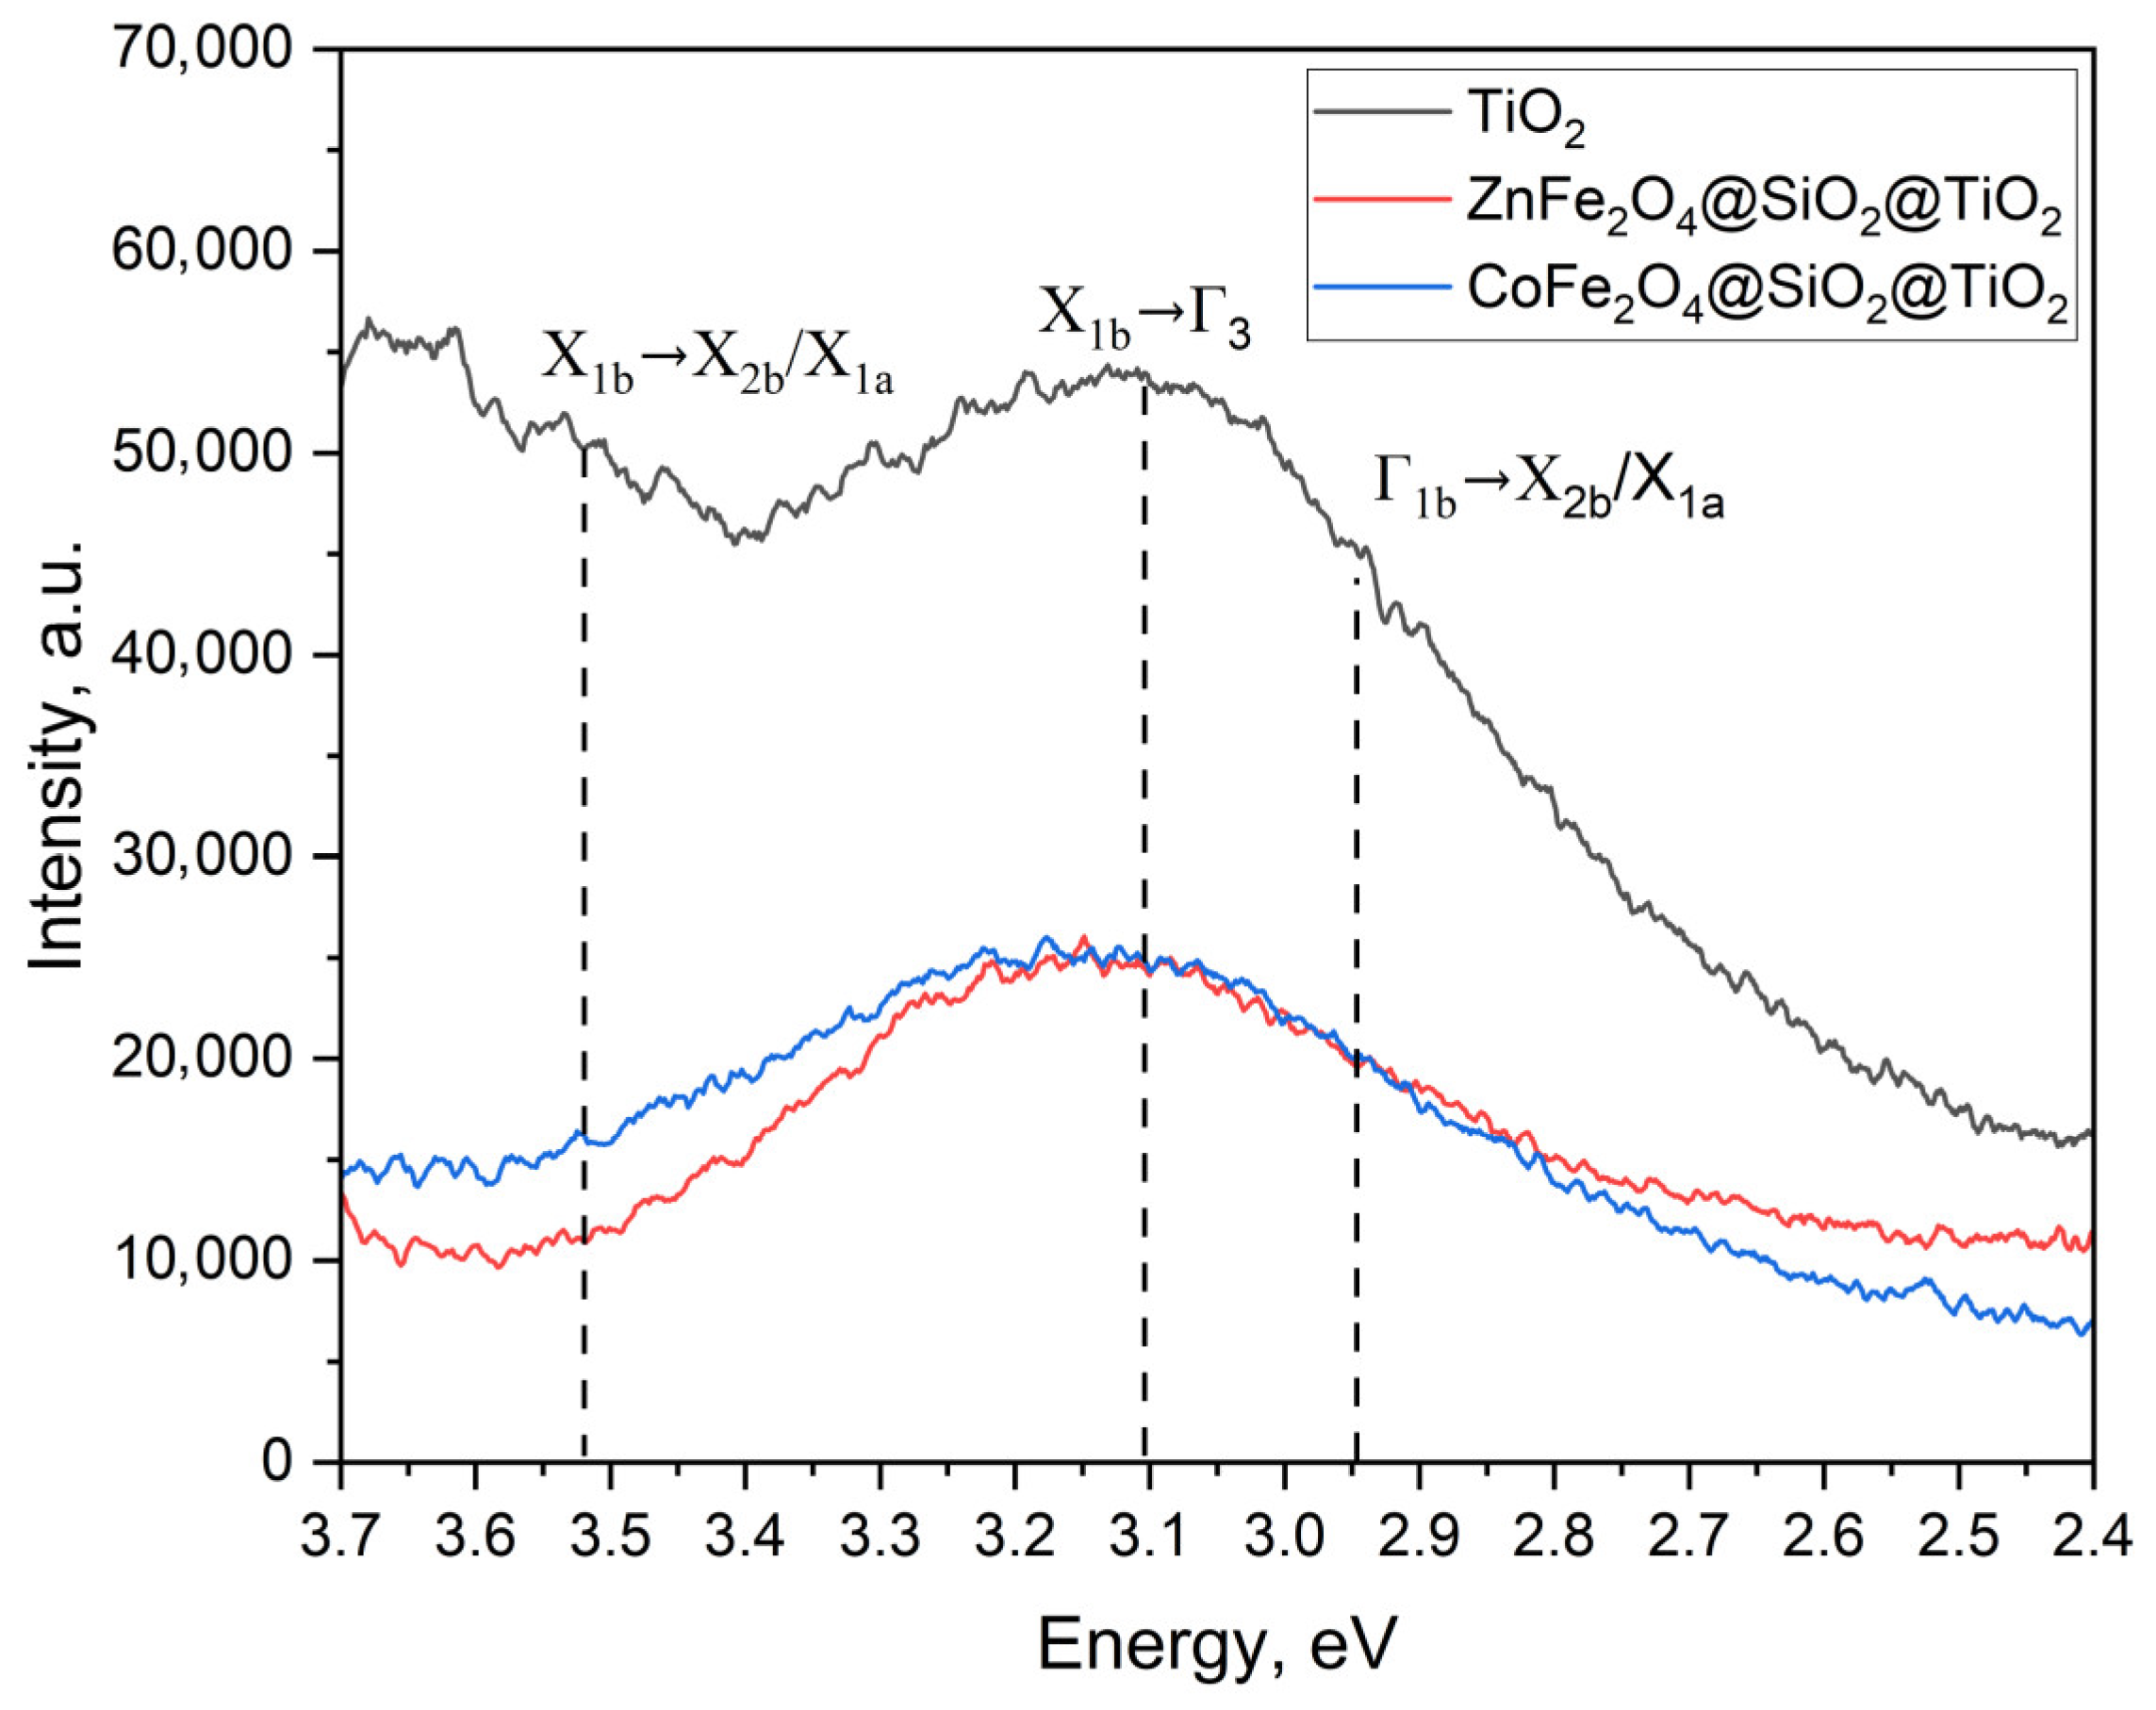
2.2.2. Optical Properties and the Energy Band Gap of MFe2O4/SiO2/TiO2 with MFe2O4 (M = Zn, Co) when HT-Synthesized

The reflectance of light by the powdered samples ZnFe2O4/SiO2/TiO2(HT) and CoFe2O4/SiO2/TiO2(HT) was registered in the region of 200–1000 nm (Figure 10a). Based on that, the energy band gap was calculated. Two values were obtained for ZnFe2O4/SiO2/TiO2(HT) (1.45 and 3.13 eV) and CoFe2O4/SiO2/TiO2(HT) (1.20 and 2.89 eV) (Figure 10b). The value of 1.20 eV obtained for CoFe2O4 is close to 1.22 eV, obtained by the sol-gel method, reported in [17]. The values of 3.13 and 2.89 eV are consistent with the band gap of anatase and the phase A/R ratio, respectively, knowing that the anatase band gap energy of 3.22 eV is broader than that for rutile, 3.0 eV. According to [43], the hydrothermal conditions could affect the band gap energy of TiO2 polymorphs.

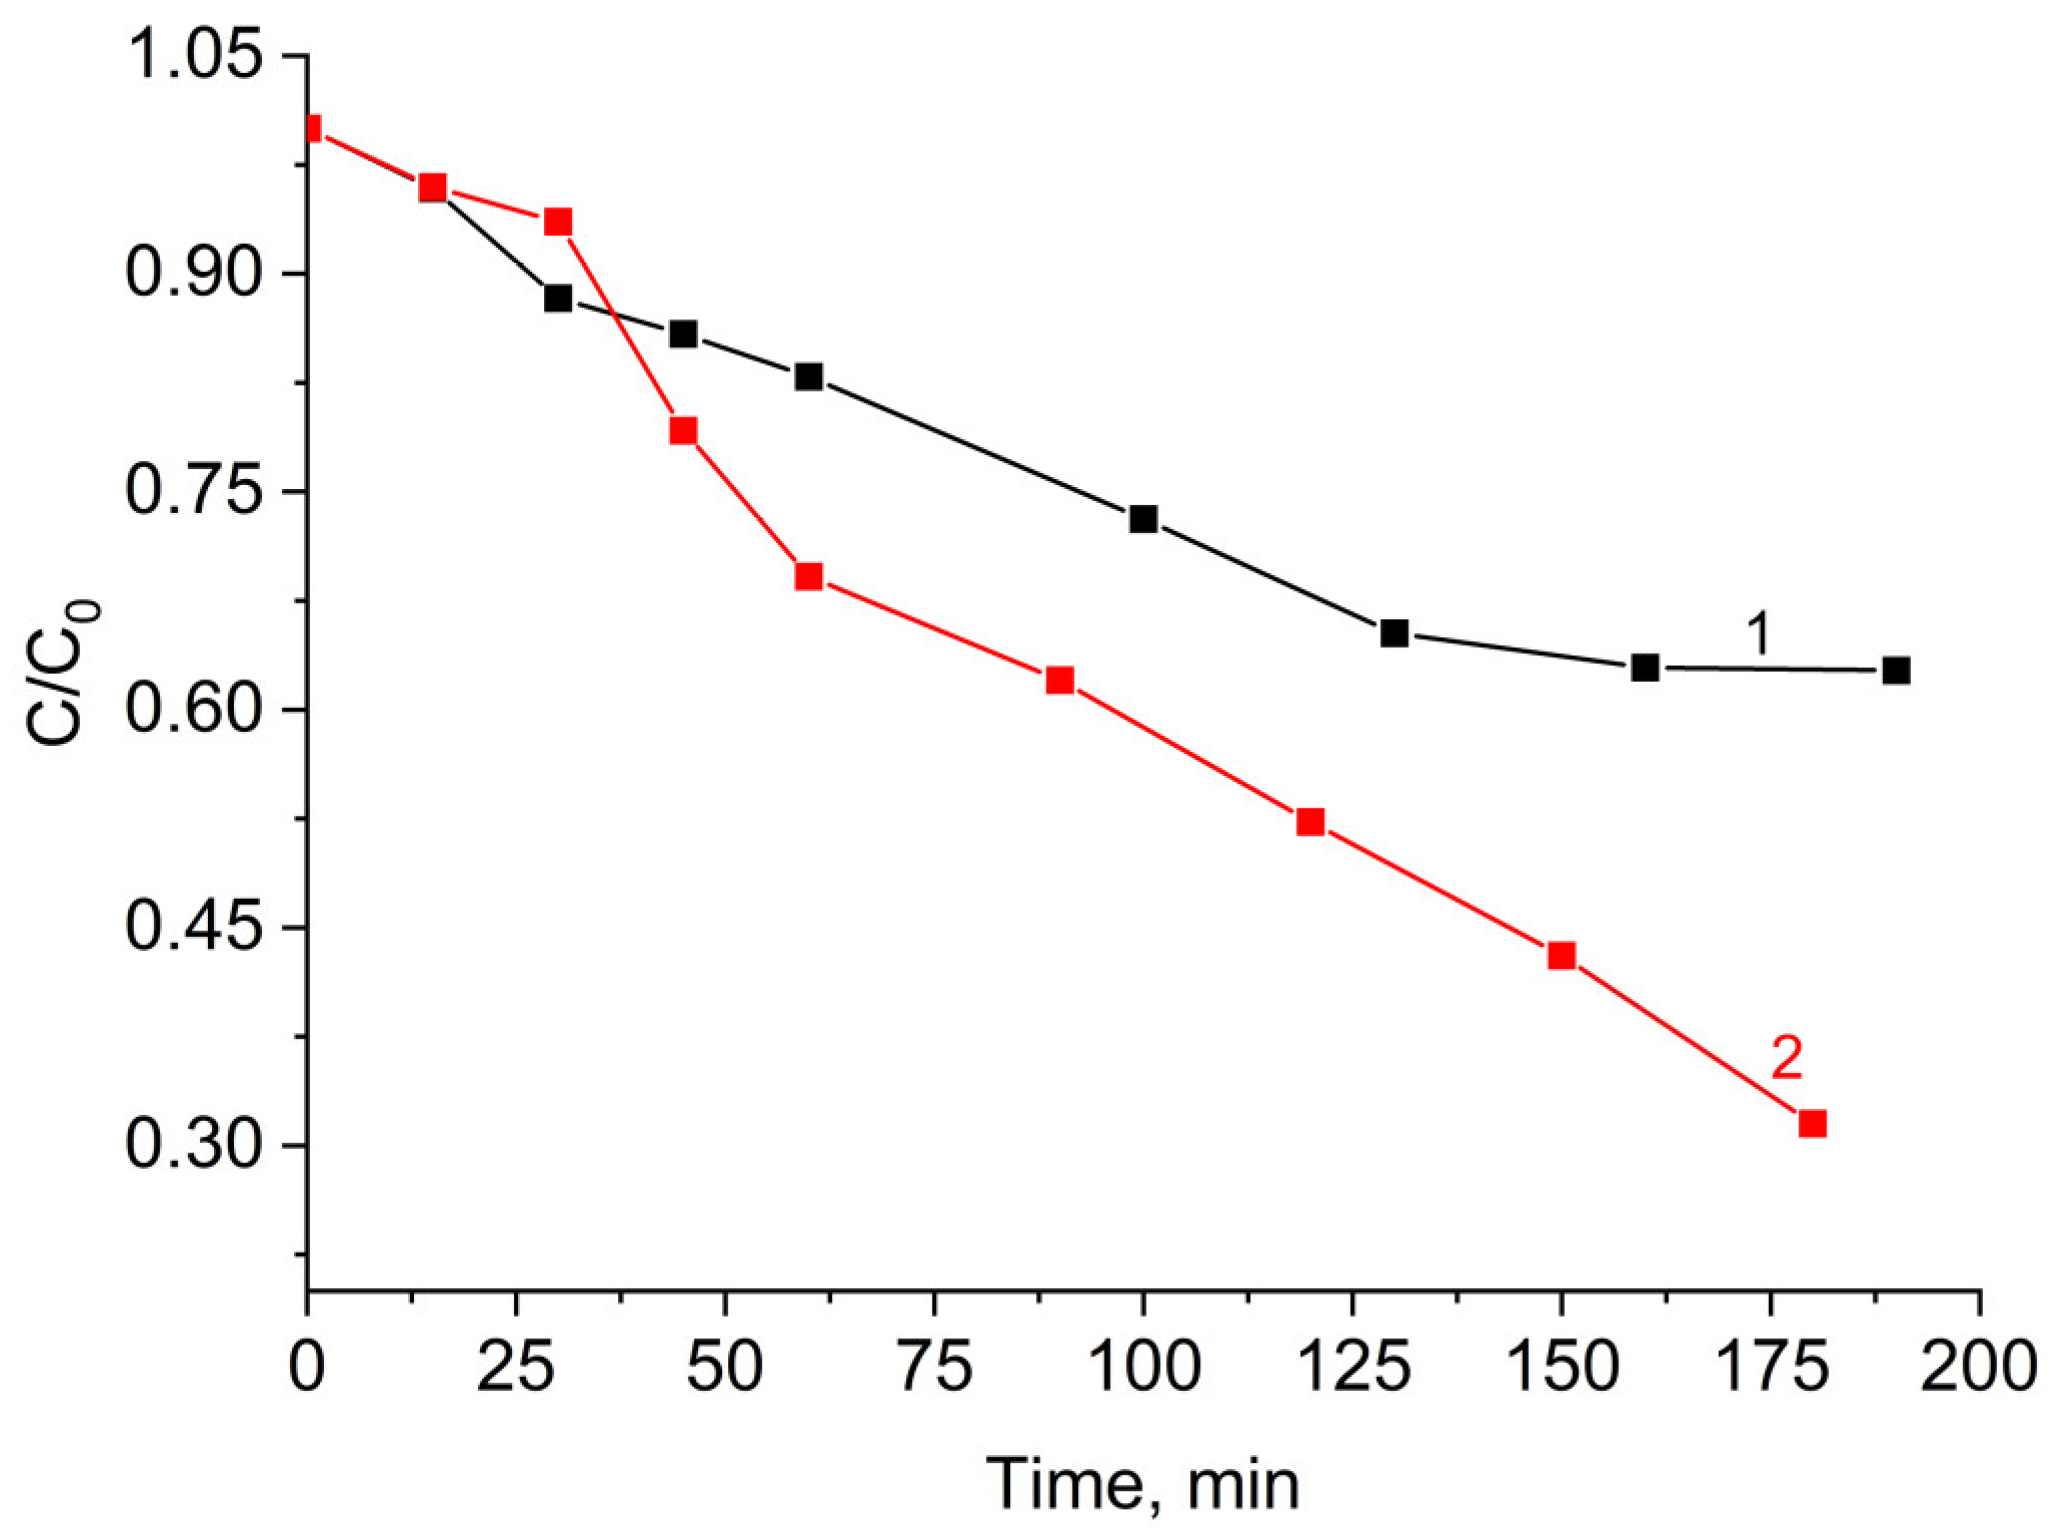
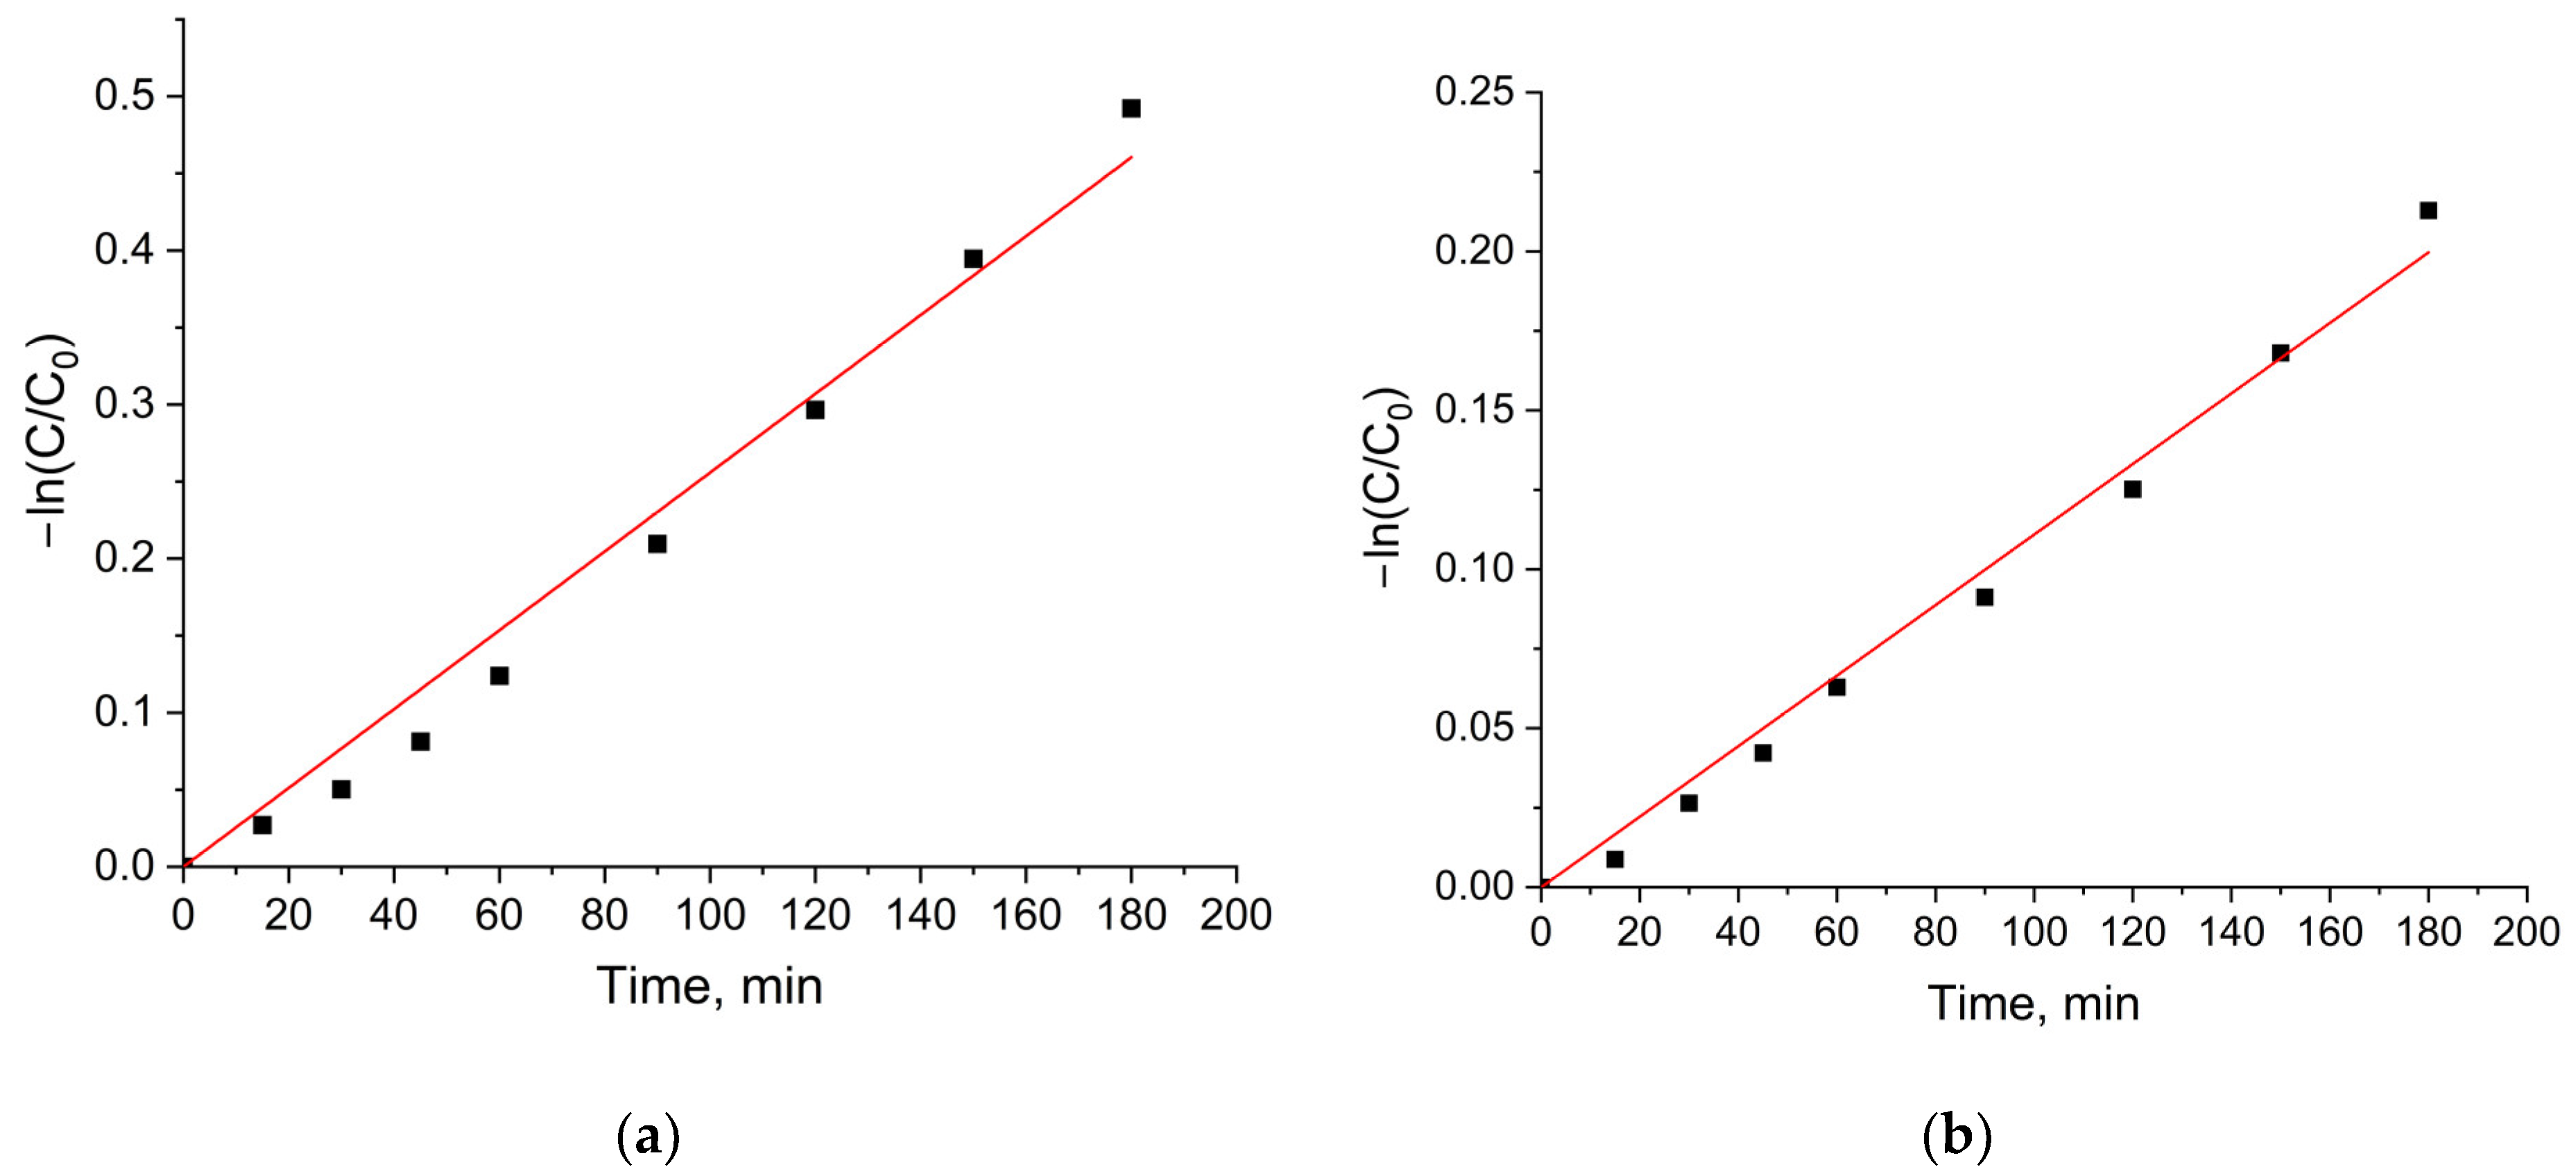
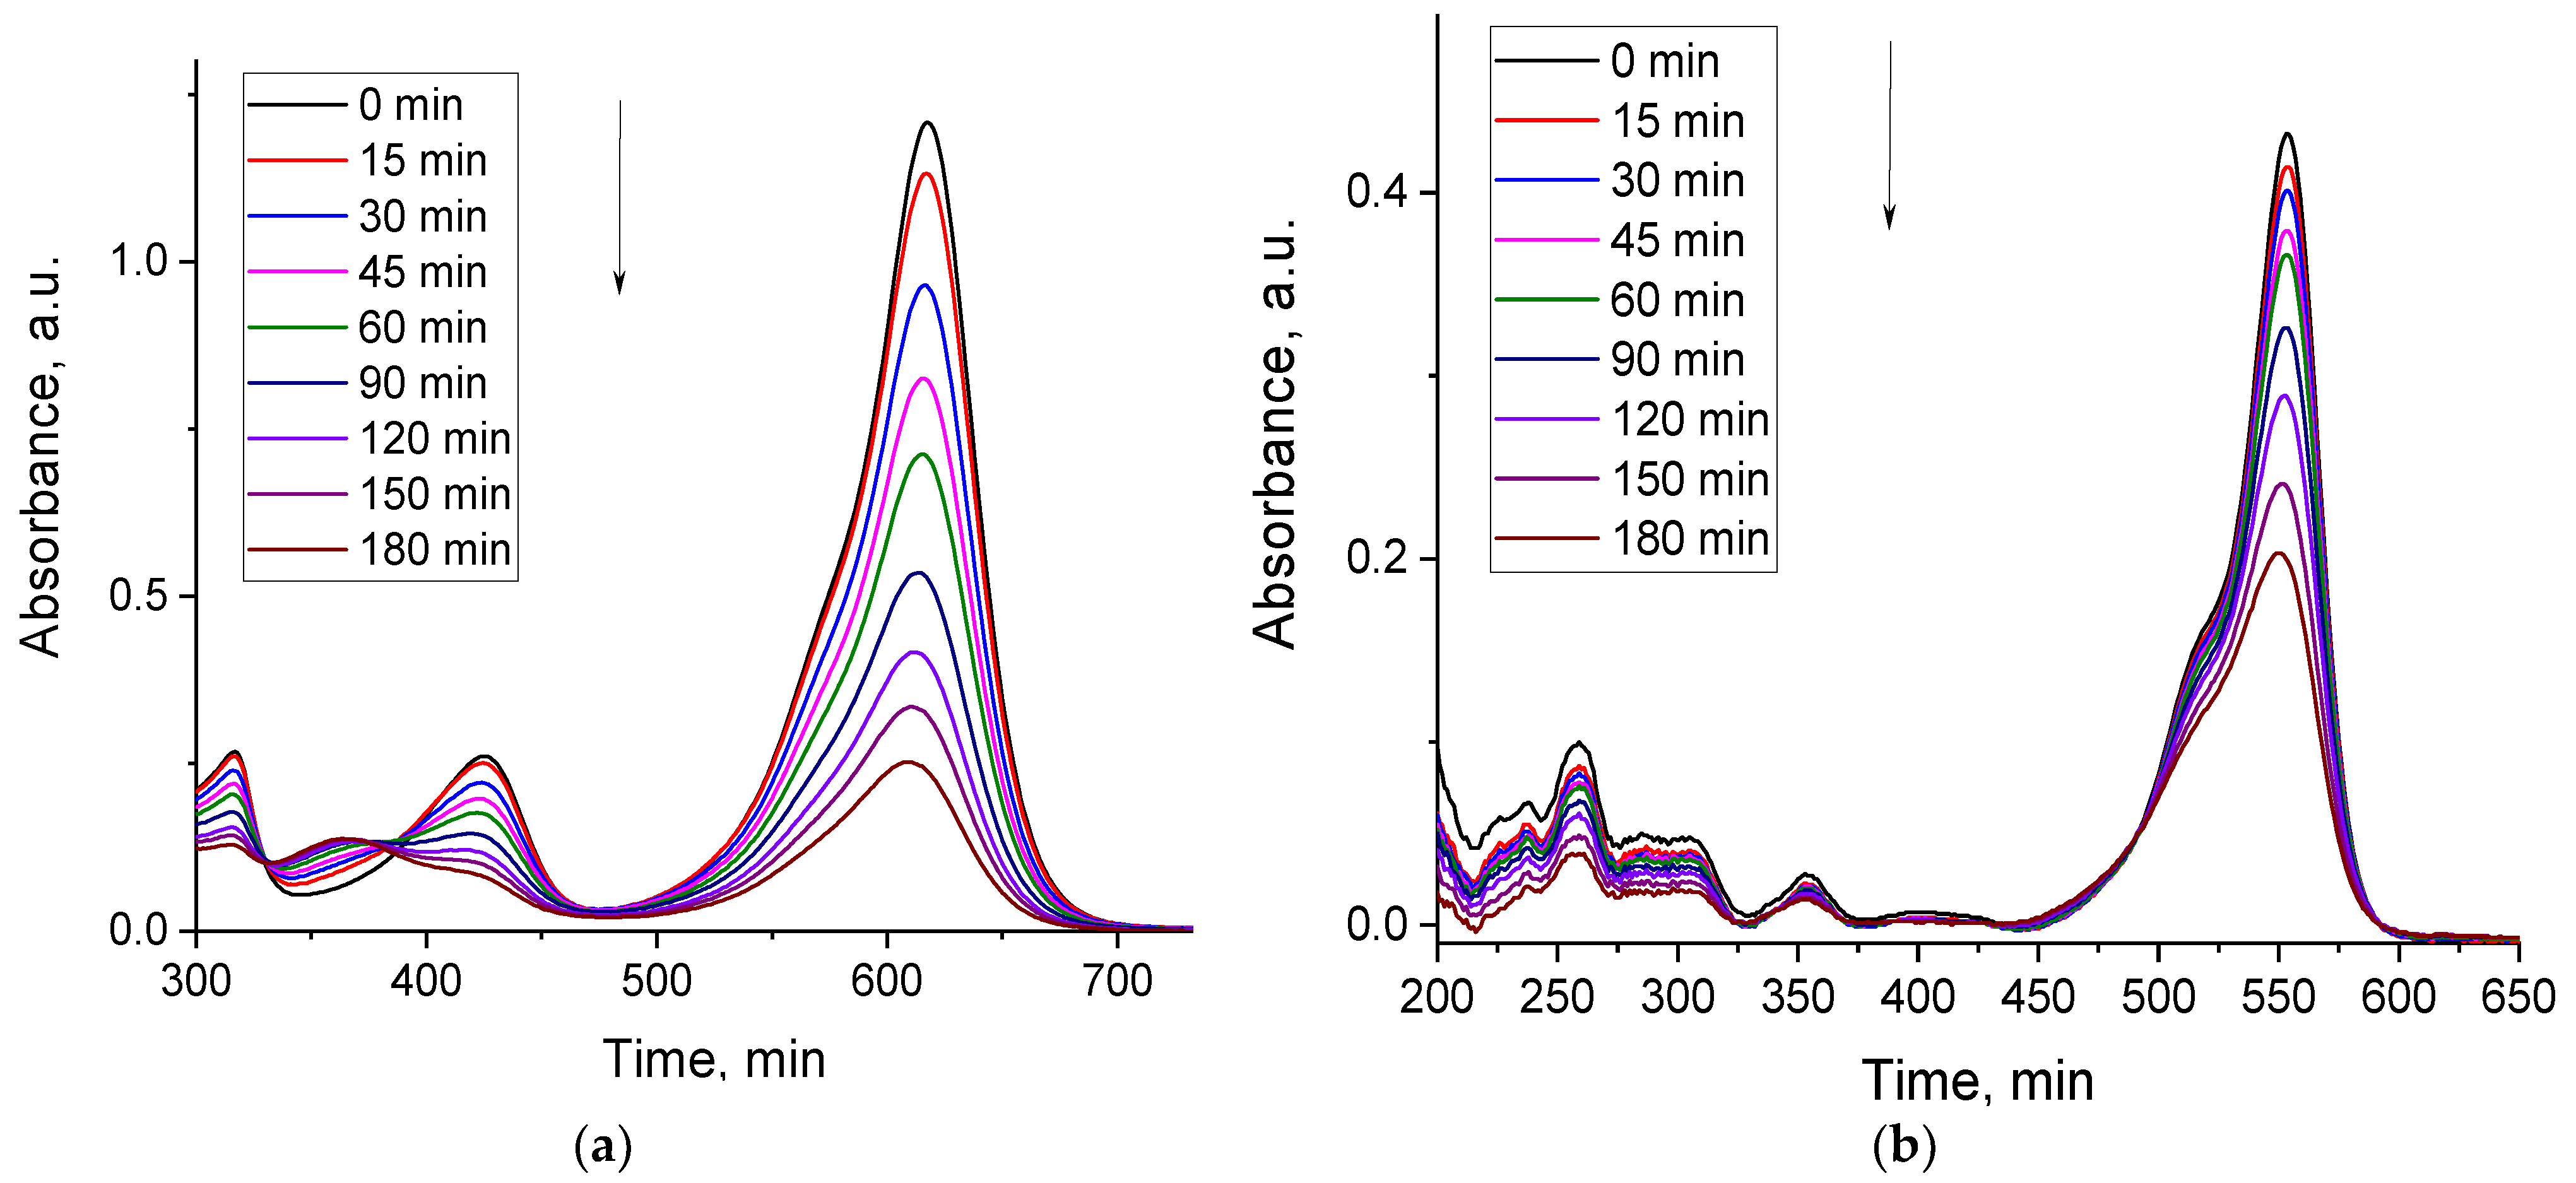
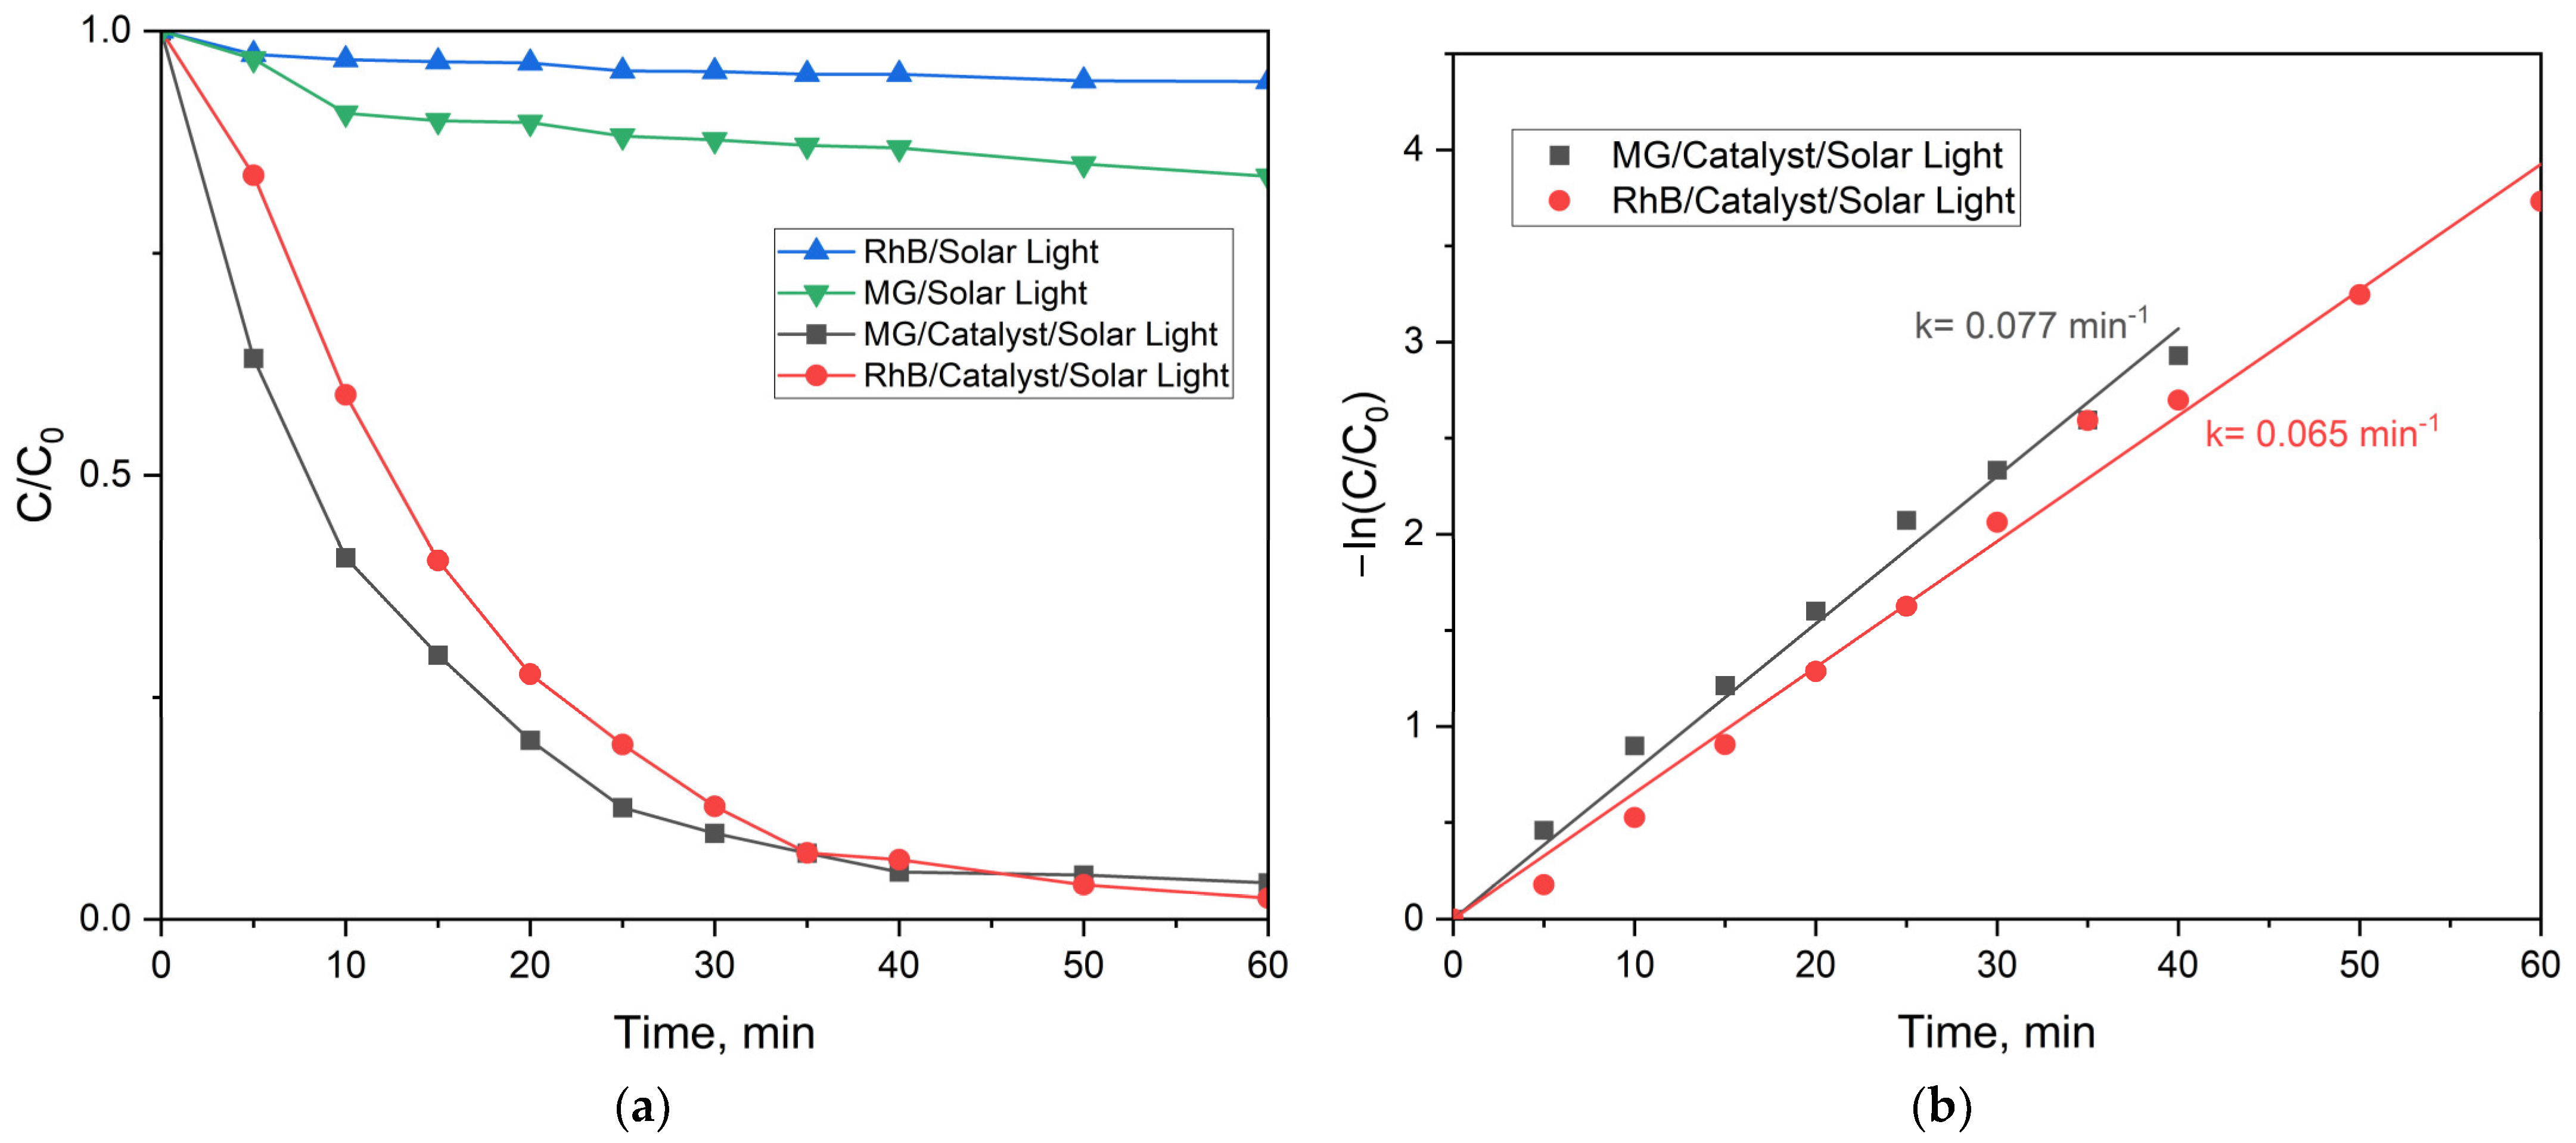
2.2.3. Photocatalytic Activity of the MFe2O4/SiO2/TiO2 (HT) with MFe2O4 (M = Zn, Co) Composites when HT-Synthesized

Under UV light irradiation, the photocatalytic activity of CoFe2O4/SiO2/TiO2(HT) is lower for the degradation of both MG and RhB, taking into account the rate constants 2.6 × 10⁻³ min−1 and 1.11 × 10⁻³ min−1, correspondingly (Figure 11). The values of the rate constants are lower than those obtained with TiO2 P25 under the same experimental conditions, for instance, 12.0 × 10⁻³ min−1 in [38].
Under UV light irradiation, the composite ZnFe2O4/SiO2/TiO2 (HT) shows activity against two dyes, MG and RhB, with degradation for MG at 80% and for RhB at 53%. The values are obtained by the dye’s absorbance, recorded by UV/Vis absorption spectroscopy (Figure 12).
The results of the degradation of the dyes determined by UV/Vis absorption (monitoring the band at 622 for MG and at 550 nm for RhB) are different compared to the results obtained by total organic carbon, TOC. Тhe decomposition of the organic molecules to CO2 and H2O proved by TOC is 39.7% for RhB, but no degradation of MG was registered. Using UV/Vis spectroscopy, the targeted pollutant is the only one to be detected, while the intermediate products (possibly more toxic than the original molecules themself) cannot be detected. At the same time, by TOC, the complete mineralization of an organic molecule can be followed. The TOC measurements show lower values for MG removal than UV/Vis spectroscopy. This is a clear indication that mineralization goes through a complex multistep process, including several intermediate products. For example, 16 intermediate products have been identified during the photocatalytic oxidation of MG over α-NiMoO4 [44]. All byproducts have different oxidation potentials when reacting with the radicals produced during the photocatalytic process. This leads to different speeds of mineralization for each of the intermediates and, therefore, their detection during TOC analysis.
If the ZnFe2O4/SiO2/TiO2 (HT) composite was more active under UV light, its activity was tested under simulated solar irradiation in a seawater matrix and for recycling.
MG and RhB dyes are stable under simulated solar irradiation. As can be seen, no photolysis was observed (Figure 13a). At the same time, the dyes were almost completely decomposed in the presence of the ZnFe2O4/SiO2/TiO2 (HT) composite under simulated solar light for 60 min irradiation. An efficiency of degradation of 98% was achieved, indicating the significantly higher photocatalytic activity of ZnFe2O4/SiO2/TiO2 (HT) under solar irradiation than under UV light irradiation. The rate constant obtained for the degradation of MG dye was higher than for RhB, 0.077 min−1 and 0.065 min−1, respectively, for MG and RhB (Figure 13b). Additionally, the TOC data showed very high mineralization efficiency, 92% for MG and 88% for RhB. Overall, the activity of the ZnFe2O4/SiO2/TiO2(HT) composite is significantly higher under simulated solar irradiation (300 W lamp) compared to UV-light irradiation alone (18 W lamp). It should be taken into account that the solar simulator used has a spectral distribution that is stronger than that of the sun in the UV region of the spectrum [45]. Spectral radiation distribution shows a high portion of the UV radiation. Its radiated power in the 315–400 nm (UVA) region is 13.6 W, and in the 280–315 nm (UVB) region, it is 3.0 W [46].
The influence of the water matrix on the photocatalytic activity of ZnFe2O4/SiO2/TiO2 (HT) was investigated in artificial seawater both under UV light and under simulated solar light.
The results from the photocatalytical experiments under UV light in seawater are presented in Figure 14a. The photocatalytic activity of the ZnFe2O4/SiO2/TiO2 (HT) composite is lower in seawater than in ultrapure water. The maximum degradation efficiency at 180 min irradiation reached for MG dye is 59.5% (rate constant 5.1 × 10⁻³ min−1), while for RhB, it is 42% (rate constant 3.6 × 10⁻³ min−1).
Taking into account the high catalytic activity observed under simulated solar irradiation in ultrapure water (Figure 13), experiments in artificial seawater under solar light were also conducted, and the results are presented in Figure 14b. As can be seen, the ZnFe2O4/SiO2/TiO2 (HT) composite shows excellent photocatalytic activity under solar radiation, even in seawater. The degradation efficiency is slightly lower than that found in ultrapure water (93% degradation for MG and 90% for RhB) with lower rate constants (rate constant for MG is 5.7 × 10⁻³ min−1, while for RhB is 4.0 × 10⁻³ min−1). Despite that, the results show that the prepared ZnFe2O4/SiO2/TiO2 (HT) composite can be used in real water matrices (seawater) with less than 10% loss of activity for azo dyes.
The data showing the influence of the water matrix and the irradiation light on the photocatalytic activity of ZnFe2O4/SiO2/TiO2 (HT) are summarized in Table 3. The artificial seawater matrix inhibits the role of both the UV and simulated solar light. The ions present in the artificial seawater, such as chloride and sulfate, display a different influence on the oxidation process of the dye, probably reacting with the radicals responsible for the oxidation of the dyes [47].
Catalyst recycling experiments were performed using MG dye in ultrapure water and under solar irradiation due to the high photocatalytic activity of the prepared materials under these conditions. The ZnFe2O4/SiO2/TiO2 (HT) composite retained its high photocatalytic activity under solar irradiation for at least three consecutive cycles. The degradation efficiency diminished from 98 to 96 and 95% (Figure 15a). Furthermore, the XRD patterns of the photocatalyst before and after the photocatalytic experiments under solar irradiation are presented in Figure 15b, where no significant difference is observed between the as-prepared and spent photocatalyst, indicating that the phase composition remains the same.

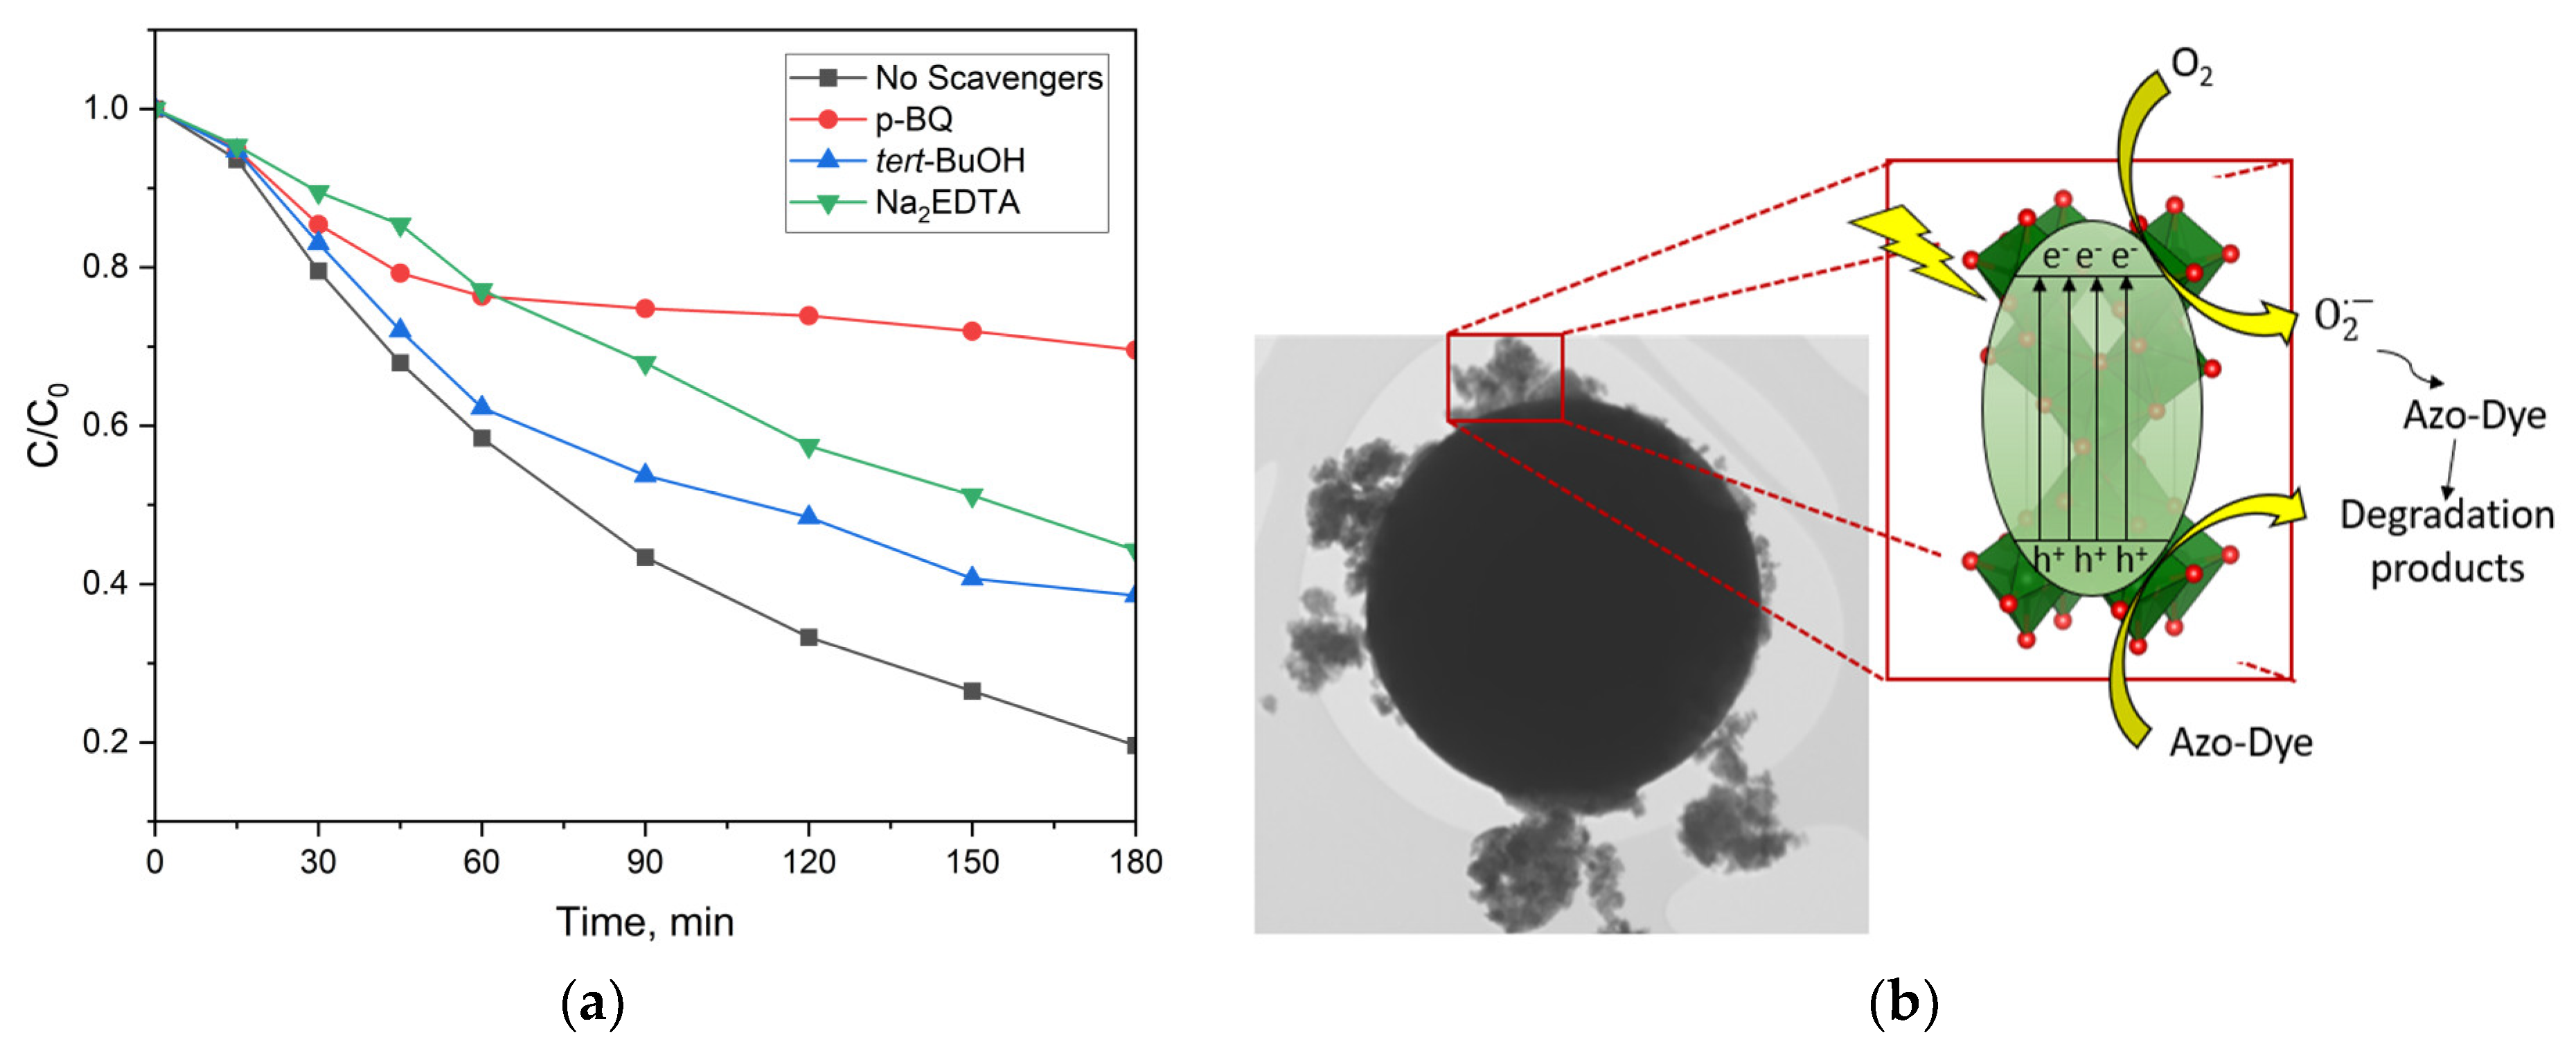
2.2.4. Mechanism of the Photocatalytic Process

In order to establish the reaction mechanism of the photocatalytic process, a series of experiments were conducted using radical scavengers with a concentration fixed at 10 ppm. The scavengers p-benzoquinone for superoxide anion radicals O2•−, tert-butanol for OH- radicals [48], and Na2EDTA as a scavenger for surface-generated holes h+ [49] were tested. The results show that the major reactive species are the h+ holes and superoxide anion radicals O2•− (Figure 16a). Based on the results, the reaction mechanism can be commented on. Briefly, by excitation, the surface of MFe2O4/SiO2/TiO2 (M = Co, Zn) with UV light electron-hole pairs is produced. The photogenerated electrons, e, are transferred to the conduction band from the valence band, creating positive holes, h+. The photogenerated holes can directly degrade the azo dye (MG or RhB). At the same time, the photogenerated electrons can react with O2 to produce anion radicals O2•−, which, on their side, can degrade the azo dye (MG or RhB), as illustrated in Figure 16b.
In order to show the charge separation, the photoluminescent spectra of the obtained pure TiO2 (prepared by the procedure in Section 4.2.3.) and MFe2O4/SiO2/TiO2 (M = Zn, Co) were recorded (Figure 17) at 315 nm [50]. It can be seen that the emission spectrum of TiO2 can be deconvoluted into three main emission bands known to be typical for anatase TiO2 [51] and the emission band at ~3.50–3.53 eV can be assigned following the degenerated direct transition X1b → X2b/X1a (Figure 17). This transition is slightly visible in pure TiO2 and completely missing in the MFe2O4/SiO2/TiO2 composites (Figure 17). The most intense and broad band, due to the indirect transition X1b → Γ3, is located at around 3.1 eV for pure TiO2 but is slightly red-shifted for composites. The lowest energy band between 2.9–3.0 eV (presented as a shoulder in all samples) is the nearly degenerated indirect transition Γ1b → X2b/X1a. Overall, the intensity of all bands significantly decreases for the composites in comparison to TiO2, which is an indication of improved charge separation.

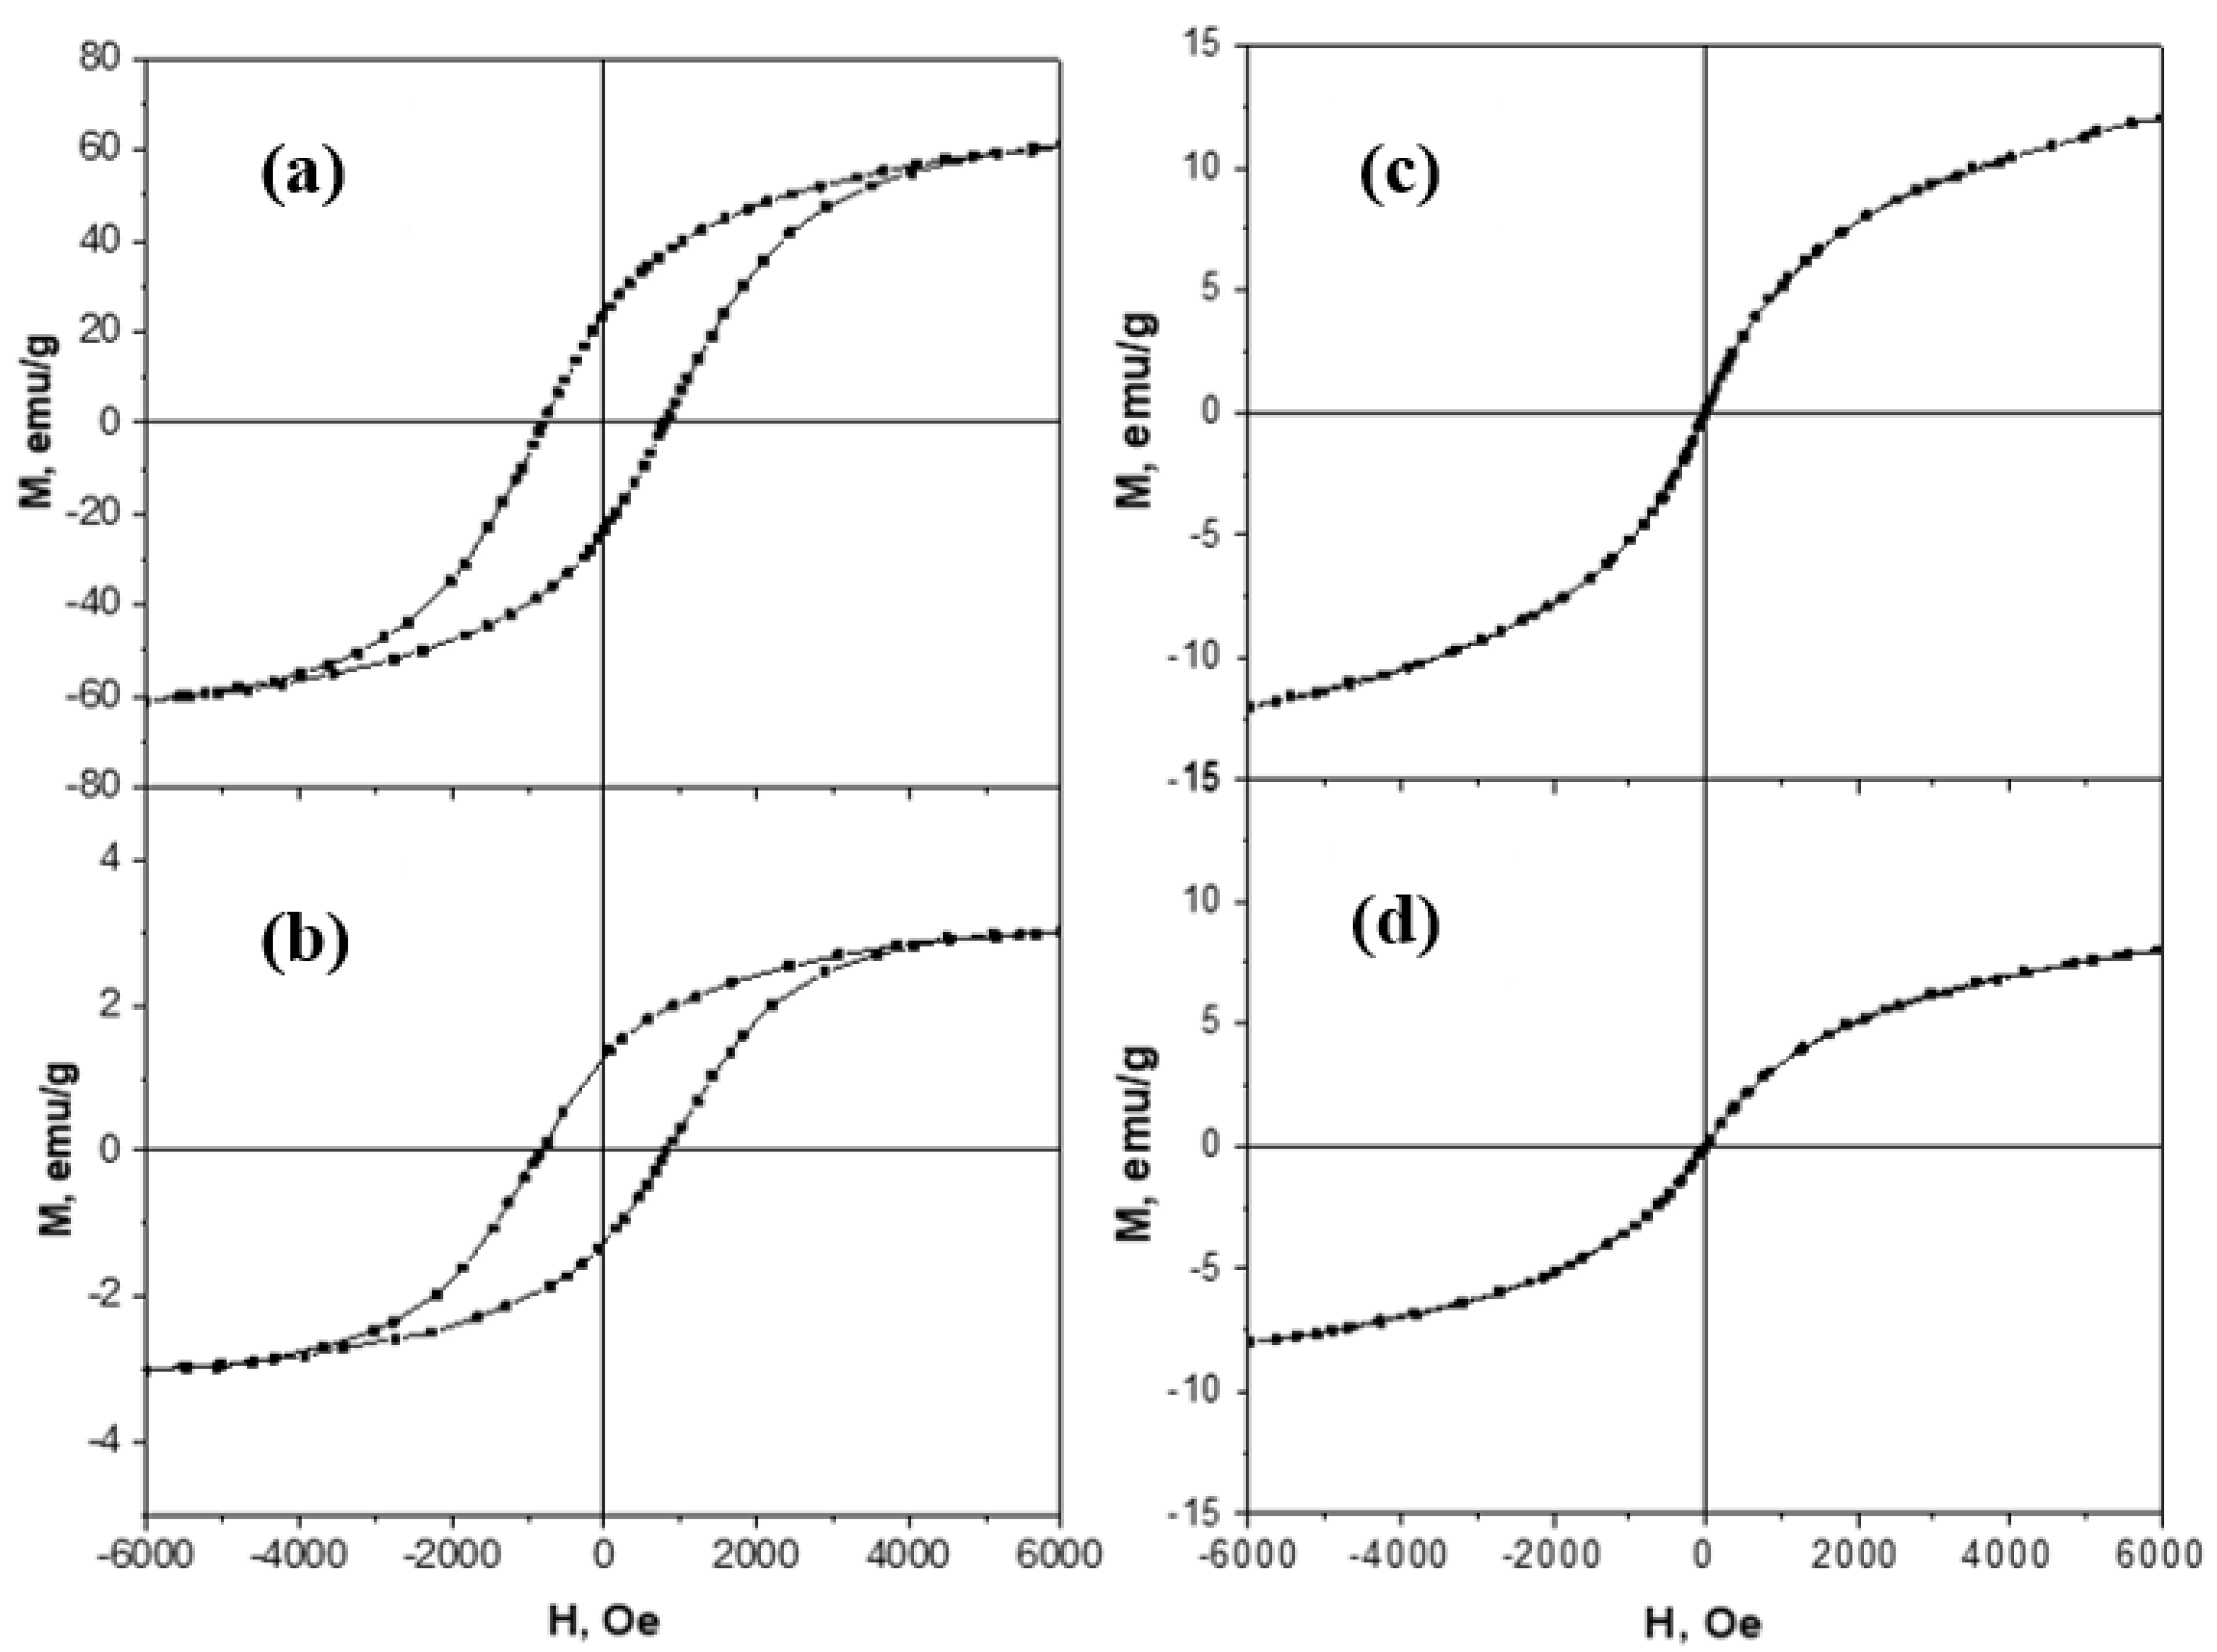
2.2.5. Magnetic Measurements

The magnetic properties of CoFe2O4 and the CoFe2O4/SiO2/TiO2 (HT) composite, as well as of ZnFe2O4 and the ZnFe2O4/SiO2/TiO2(HT) composite, were studied by a vibrating sample magnetometer (VSM) at room temperature. The cobalt ferrite samples showed ferromagnetic behavior at room temperature, which is illustrated by the obtained hysteresis curves (Figure 18a,b). The main magnetic characteristics, such as coercive field and maximum magnetization, were determined from the hysteresis curves. The maximum magnetization value for the sample of pure cobalt ferrite CoFe2O4 is 61 emu/g (48 nm crystallites size), close to 67.7 emu/g (crystallites size about 88 nm) for CoFe2O4 obtained by wet-chemical synthesis [26].
The composite sample containing SiO2 and TiO2 has a very small maximum magnetization, around 3 emu/g, as the weight magnetic fraction in this sample is just around 1.2% (Table 2). The coercivity of the cobalt ferrite samples is relatively high, around 800 Oe, slightly higher for the sample containing SiO2 and TiO2, which could probably be explained by the different anisotropy due to the presence of the great amount of non-magnetic material in this sample. The magnetization of CoFe2O4/SiO2/TiO2 can hardly be compared with similar composites because of the difference in the applied magnetic field of 6 kOe applied by us, but 15 kOe in [26], and 20 kOe in [25]. Still, the maximum magnetization is related to the applied field of 3 emu/g for 6 kOe and 6.5 emu/g for 20 kOe [25]. On the other hand, zinc ferrite samples show superparamagnetic behavior at room temperature, with zero coercivity and a well-defined S-shaped M–H curve (Figure 18c,d). The superparamagnetic behavior of the zinc ferrite samples could be explained by the very small nanoparticles size, around 19 nm, as obtained from Rietveld’s method (See Table 2). The maximum magnetization for the pure zinc ferrite sample is 11 emu/g, and for the sample containing SiO2 and TiO2, it is 8 emu/g.
Using an NdFeB magnet with a size of 9 × 9 × 9 mm and power of 42.1 N, the ferromagnetic behavior of the cobalt ferrite samples at room temperature was confirmed. The successful separation of the suspension, containing the catalyst CoFe2O4/SiO2/TiO2(HT), prepared for the photocatalytic activity test for MG degradation, is presented in Figure 19.

3. Discussion

Nanocomposites of the “core–shell” type, e.g., CoFe2O4/SiO2, CoFe2O4/TiO2, CoFe2O4/SiO2/TiO2, and ZnFe2O4/SiO2/TiO2, were obtained using two different procedures for the synthesis of the MFe2O4 core: the sol-gel (SG), and hydrothermal (HT) methods.
(i)
Photocatalytic activity of the CoFe2O4/TiO2 (SG) and CoFe2O4/SiO2/TiO2 (SG) composites. The comparison confirms the role of SiO2 as an insulator. The rate constant and the degradation of MG in the process are increasing, i.e., values of 2.9 × 10⁻³ min−1 (degradation 41%) for CoFe2O4/TiO2 (SG) and (SG) 5.8 × 10⁻³ min−1 (degradation 48%) for CoFe2O4/SiO2/TiO2 are obtained. A similar system to the kind used for CoFe2O4/SiO2/TiO2 can be experimented with for a different organic dye degradation, Methylene Blue [24], but due to the lack of any rate constant or percentage of degradation, any comparison with our results cannot be made.
(ii)
Photocatalytic activity of the CoFe2O4/SiO2/TiO2 (SG) and CoFe2O4/SiO2/TiO2 (HT) composites. Above and beyond the different ferrite “core” MFe2O4 (M = Zn, Co), by XRD, some changes in the phase composition of the nanocomposites, mainly affecting the “shell” TiO2, were detected. Comparing the polymorphs of TiO2 in CoFe2O4/SiO2/TiO2(SG) and CoFe2O4/SiO2/TiO2(HT), it can be seen that the former contains only anatase, but the latter contains both anatase and rutile. The first one, CoFe2O4/SiO2/TiO2(SG), is more active, with a rate constant for MG decomposition under UV light irradiation of 5.8 × 10⁻³ min−1 (degradation 48%), while the latter, CoFe2O4/SiO2/TiO2(HT), is less active under irradiation of 2.6 × 10⁻³ min−1 (degradation 39%). The reason for the different activity can be connected with the different polymorphs of TiO2, anatase or anatase/rutile. According to [52,53], anatase demonstrates higher photocatalytic activity in comparison to polymorphs rutile and brookite because of more surface defects and oxygen vacancies in anatase compared to rutile, leading to charge separation and better photocatalytic performance; however, according to [54,55] a combination of A/R displays better photocatalytic activity than each of the polymorphs. A well-known example is the anatase/rutile mixture of TiO2-Degussa P25 with 80% anatase and 20% rutile, being one of the most investigated photocatalysts with good activity under UV light [55]. In CoFe2O4/SiO2/TiO2(HT), the weight fraction (%) of anatase is 87.7 and of rutile is 11.1, apparently differing from that of TiO2-Degussa P25.
(iii)
The ZnFe2O4/SiO2/TiO2(HT) and CoFe2O4/SiO2/TiO2(HT) composites. Similarly, ZnFe2O4/SiO2/TiO2(HT) contains anatase, while in CoFe2O4/SiO2/TiO2(HT), both anatase and rutile are detected, with the weight fraction mentioned (%), A/R 87.7/11.1, differing from that of TiO2-Degussa P25. The rate constant for MG decomposition is 9 × 10⁻³ min−1 (degradation 80%) for ZnFe2O4/SiO2/TiO2(HT), while for the process with CoFe2O4/SiO2/TiO2(HT), 2.6 × 10⁻³ min−1 (degradation 39%) was obtained.
(iv)
Weight ratio of A/R. This happens to be crucial in order to overcome the photocatalytic activity of anatase [56,57]. It is found that an A/R mixture of 90/10 has a weak activity for the decomposition of Methylene Blue, while a mixture of 86/14 is more effective in the same process than commercial TiO2 Degussa P25 [58]. So, our results confirm that not only is the mixture of anatase/rutile essential, but the weight fraction of the polymorphs is also important. For example, the rate constant for the process of RhB degradation by CoFe2O4/SiO2/TiO2 (HT) is close to one obtained [59] for TiO2 containing A/R. However, such a comparison is not correct because of the missing exact value for the A/R ratio in [59]. In addition, differences in the catalyst dose, the pollutant concentration, and the irradiation time should be taken into account. All this is illustrated by the data included in Table S1 [60,61,62,63,64] and Table S2 [59,65].
Out of the three composites, CoFe2O4/SiO2/TiO2 (SG), CoFe2O4/SiO2/TiO2 (HT), and ZnFe2O4/SiO2/TiO2 (HT), the latter displays the highest photocatalytic activity for degradation of MG both under UV and simulated solar light, having a high content of anatase on the surface of the core/shell structure.
Despite the lower activity of CoFe2O4/SiO2/TiO2 (HT), it still possesses valuable ferromagnetic properties with magnetization of 3 emu/g, which increases its potential in practical applications.

4. Materials and Methods

4.1. Materials

The chemicаls Co(NO3)2·6H2O, Fe(NO3)3·9H2O (p.а., Sigma-Aldrich, Milwaukee, WI, USA), tetraethyl orthosilicate, TEOS (reagent grade, 98%, Sigma-Aldrich, Milwaukee, WI, USA), Ti(IV) tetrabutoxide, and Ti(OBu)4 (reagent grade, 97%, Sigma-Aldrich, Milwaukee, WI, USA) were used in this study as well as the dyes Malachite Green oxalate (MG), (Chroma GmbH, Hamburg, Germany) and Rhodamin B (RhB). An NdFeB magnet (MAGSY, s.r.o., Fryšták, Czech Republic) with a size of 9 × 9 × 9 mm and power 42.1 N was used.

4.2. Synthetic Procedures

4.2.1. Synthesis of CoFe2O4 by the Sol-Gel Method

Co(NO3)2·6H2O and Fe(NO3)3·9H2O were dissolved in 96 wt% ethanol with a mole ratio n(Co2+):n(Fe3+) = 1:2 and stirred until complete homogenization for 30 min, then propylene oxide (PO) was added as a gelling agent (ratio PO/EtOH = 1: 4) and stirred for an additional 30 min for sol formation. The sol was kept at 200 °C for 24 h until a gel was formed. After that, the prepared sample of CoFe2O4 was annealed at 550 °C for 5 h.

4.2.2. Synthesis of CoFe2O4 and ZnFe2O4 by Hydrothermal Method

The metal salts Co(NO3)2·6H2O and Fe(NO3)3·9H2O with mole ratio n(Co2+):n(Fe3+) = 1:2 were dissolved in 50 mL of ethylene glycol, EG. The solution was stirred for 30 min by magnetic stirring, followed by 30 min sonication in an ultrasonic bath. After adding NaOH and stirring for 30 min, the metal ions were precipitated. The mixture was transferred to a 75 mL PTFE autoclave and kept at 180 °C for 24 h. The samples obtained wеre annealed at 550 °C for 5 h.

4.2.3. Coating of MFe2O4 (M = Zn(II), Co(II)) with SiO2 and TiO2

Coating with layers of SiO2 and TiO2 was performed in ethyl alcohol media, as initial substances tetraethyl orthosilicate, TEOS, Ti(IV)tetrabutoxide, and Ti(OBu)4 were used, respectively.
In order to form a layer of SiO2, the quantity of CoFe2O4 and TEOS was calculated to obtain a mole ratio of n(CoFe2O4) /nSiO2 = 0.01. The choice of that ratio was a result of preliminary experiments not discussed here, and it was considered optimal for successful SiO2 layer formation on the basis of TEM micrographs of the samples produced (Figure 2). Briefly, to a suspension of CoFe2O4 in pure ethanol, TEOS was added (volume ratio TEOS:EtOH = 0.025), and it was stirred until homogenization was achieved. In addition, the NH3 water solution was added drop-wise up to pH 12, so basic hydrolysis was applied. Stirring continued at 20 °C for 24 h. After that, the samples were washed two-fold in a small amount of ethanol and kept at 60 °C for 48 h for drying. An analogous sample with ZnFe2O4 was not included among the samples characterized.
After SiO2 layer deposition, a layer of TiO2 was deposited on CoFe2O4/SiO2. For this purpose, a pure ethanol sample of CoFe2O4/SiO2 was suspended, Ti(IV) tetrabutoxide was dissolved (volume ratio Ti(OBu)4:EtOH = 0.025), and after homogenization, NH3 water solution was added drop-wise. The procedure included stirring for 24 h at 20 °C, washing with pure EtOH, and drying for 24 h at 60 °C. After calcination for 5 h at 550 °С, the sample considered to be CoFe2O4/SiO2/TiO2 was further characterized and tested. An identical procedure for ZnFe2O4/SiO2/TiO2 and CoFe2O4/TiO2 formation was applied.
The “core/shell” of the MFe2O4/SiO2/TiO2 type contained MFe2O4 (M = Zn or Co) prepared by two different synthetic methods, the sol-gel (SG) and hydrothermal (HT) method. For the purpose of distinguishing, they are named in the text, including the initials of the synthetic methods, SG or HT.

4.3. Methods for Characterization

X-ray powder diffraction (XRD) patterns for phase identification were recorded at an angle interval of 10–80° (2θ) on a Philips PW 1050 diffractometer equipped with a CuKα tube and scintillation detector. Data for cell refinements were collected in θ–2θ, step-scan mode at an angle interval from 10 to 90° (2θ), at steps of 0.02° (2θ), and with a counting time of 1 s/step. Phase identification was carried out using Match! 3 software [66] coupled with the Crystallography Open Database [67]. The unit cell parameters, crystallite size, and phase weight fraction were extracted by the Rietveld method using the MAUD program [68].
A transmitting electron microscope with energy dispersive X-ray spectroscopy EDS was used with a high resolution (HRTEM), JEM 2100 (JEOL), 200 kV, and up to 1,500,000 times magnification was applied to follow the morphology of the samples.
X-ray photoelectron spectroscopy (XPS) was performed using a VG Escalab MKII electron spectrometer with achromatic AlKα radiation and energy of 1486.6 eV. The binding energies correction was evaluated by utilizing the C 1s line as a reference with an energy of 285.0 eV. The photoelectron lines of constituent elements on the surface were recorded and corrected by subtracting a Shirley-type background. The deconvolution of spectra was carried out with XPSPEAK41 software.
To carry out UV-Vis absorption spectroscopy, an Evolution 300 UV-Vis spectrometer (Thermo Fisher Scientific Inc., Waltham, MA, USA ) was used to measure the absorption of the samples within a range of 200–900 nm.
Band gap energies were calculated from the UV-Vis absorption spectra ranging from 200 to 1000 nm. The UV–Vis data were analyzed to determine the relation between the optical band gap, absorption coefficient, and energy () of the incident photon for near-edge optical absorption in semiconductors. The band gap energy was calculated from the measured curves by fits according to Tauc’s equation αhν = A(hν − Eg)n/2, where A is a constant independent of , Eg is the semiconductor band gap, and n depends on the type of transition [69]. The value used for n was 1, reflecting a direct transition. The well-known approach for semiconductor band gap energy determination from the intersection of linear fits of (αhν)1/n versus hv on the x-axis was used, where n can be 1/2 and 2 for direct and indirect band gaps, respectively.
Photoluminescent spectroscopy was applied to record the photoluminescence spectra of the obtained catalysts at 315 nm using a FluoroLog3-22, Horiba JobinYvon spectrophotometer.
Magnetic properties measurements. Magnetization curves of the powdered samples were measured at room temperature using a vibrating sample magnetometer (VSM) in a magnetic field up to 6 kOe. The powders were pressed into cylindrical quartz containers so that the particles were fixed during the measurements.

4.4. Photocatalytic Activity

The activity of the samples as photocatalysts for the degradation of Malachite Green and Rhodamine B in model water solutions under UV light and simulated solar irradiation was tested. The photocatalytic tests were performed following the procedure described in [3,17]. Briefly, in a 500 mL Lenz Laborglas glass batch slurry reactor (model LF100) (1 g catalyst/L), a 200 mL 10−5 M aqueous solution of Malachite Green/(Rhodamine B) was used as a model pollutant. After a 30 min ‘‘dark’’ period (in order to establish the equilibrium of the sorption process), the system was UV-illuminated by a lamp (Sylvania 18 W BLB T8, emission in the 345–400 nm region with a maximum at 365 nm), situated at 9.5 cm distance above the slurry (illumination intensity 0.5 W/m) under continuous magnetically stirring (400 min−1) and bubbling with air (45 L/h). The role of the bubbling with air was to ensure the excess of oxygen was that which wasstoichiometrically needed. As a light source, a sunlight simulator 300 W lamp (Osram, Munich, Germany, Ultra Vitalux) was used. This is a UV/Vis lamp, with radiated power in the region of 315–400 nm (UVA) 13.6 W and in the region of 280–315 nm (UVB) 3.0 W. Spectral radiation distribution shows a high portion of the UV radiation [46]. The lamp was situated 15 cm above the suspension. A Pt/Rh thermocouple was inserted into the reaction mixture and connected to the ArgoLab CB-5 thermostat for better temperature control. The temperature was kept at 25 °C ± 0.1 during the whole procedure, including during the sorption–desorption (“dark”) period. The initial pH of the solution was between 5.8 and 5.9. Periodically, a 5-mL aliquot was taken from the solution and filtered through a 0.20-µm Minisart filter. The dye concentration was determined spectrophotometrically by the band at 622 nm (for MG) or 550 nm (for RhB). The data obtained were plotted in coordinates (C/C0)/t and −ln(C/C0)/t (where C0 is the concentration after the ‘‘dark’’ period, and C is the concentration after t min irradiation). The apparent rate constants of the degradation process were determined assuming first-order kinetics. The sorption capacity was calculated as the ratio of (C00–C0)/C00, where C00 is the starting solution concentration (before the ‘‘dark’’ period). The dye degradation in moment t was determined by the following formula: degradation,% = (Аo − Аt)/Аo × 100, where Аo is the initial absorption of the dye solution at moment t = 0 min, and Аt is the absorption at moment t min.

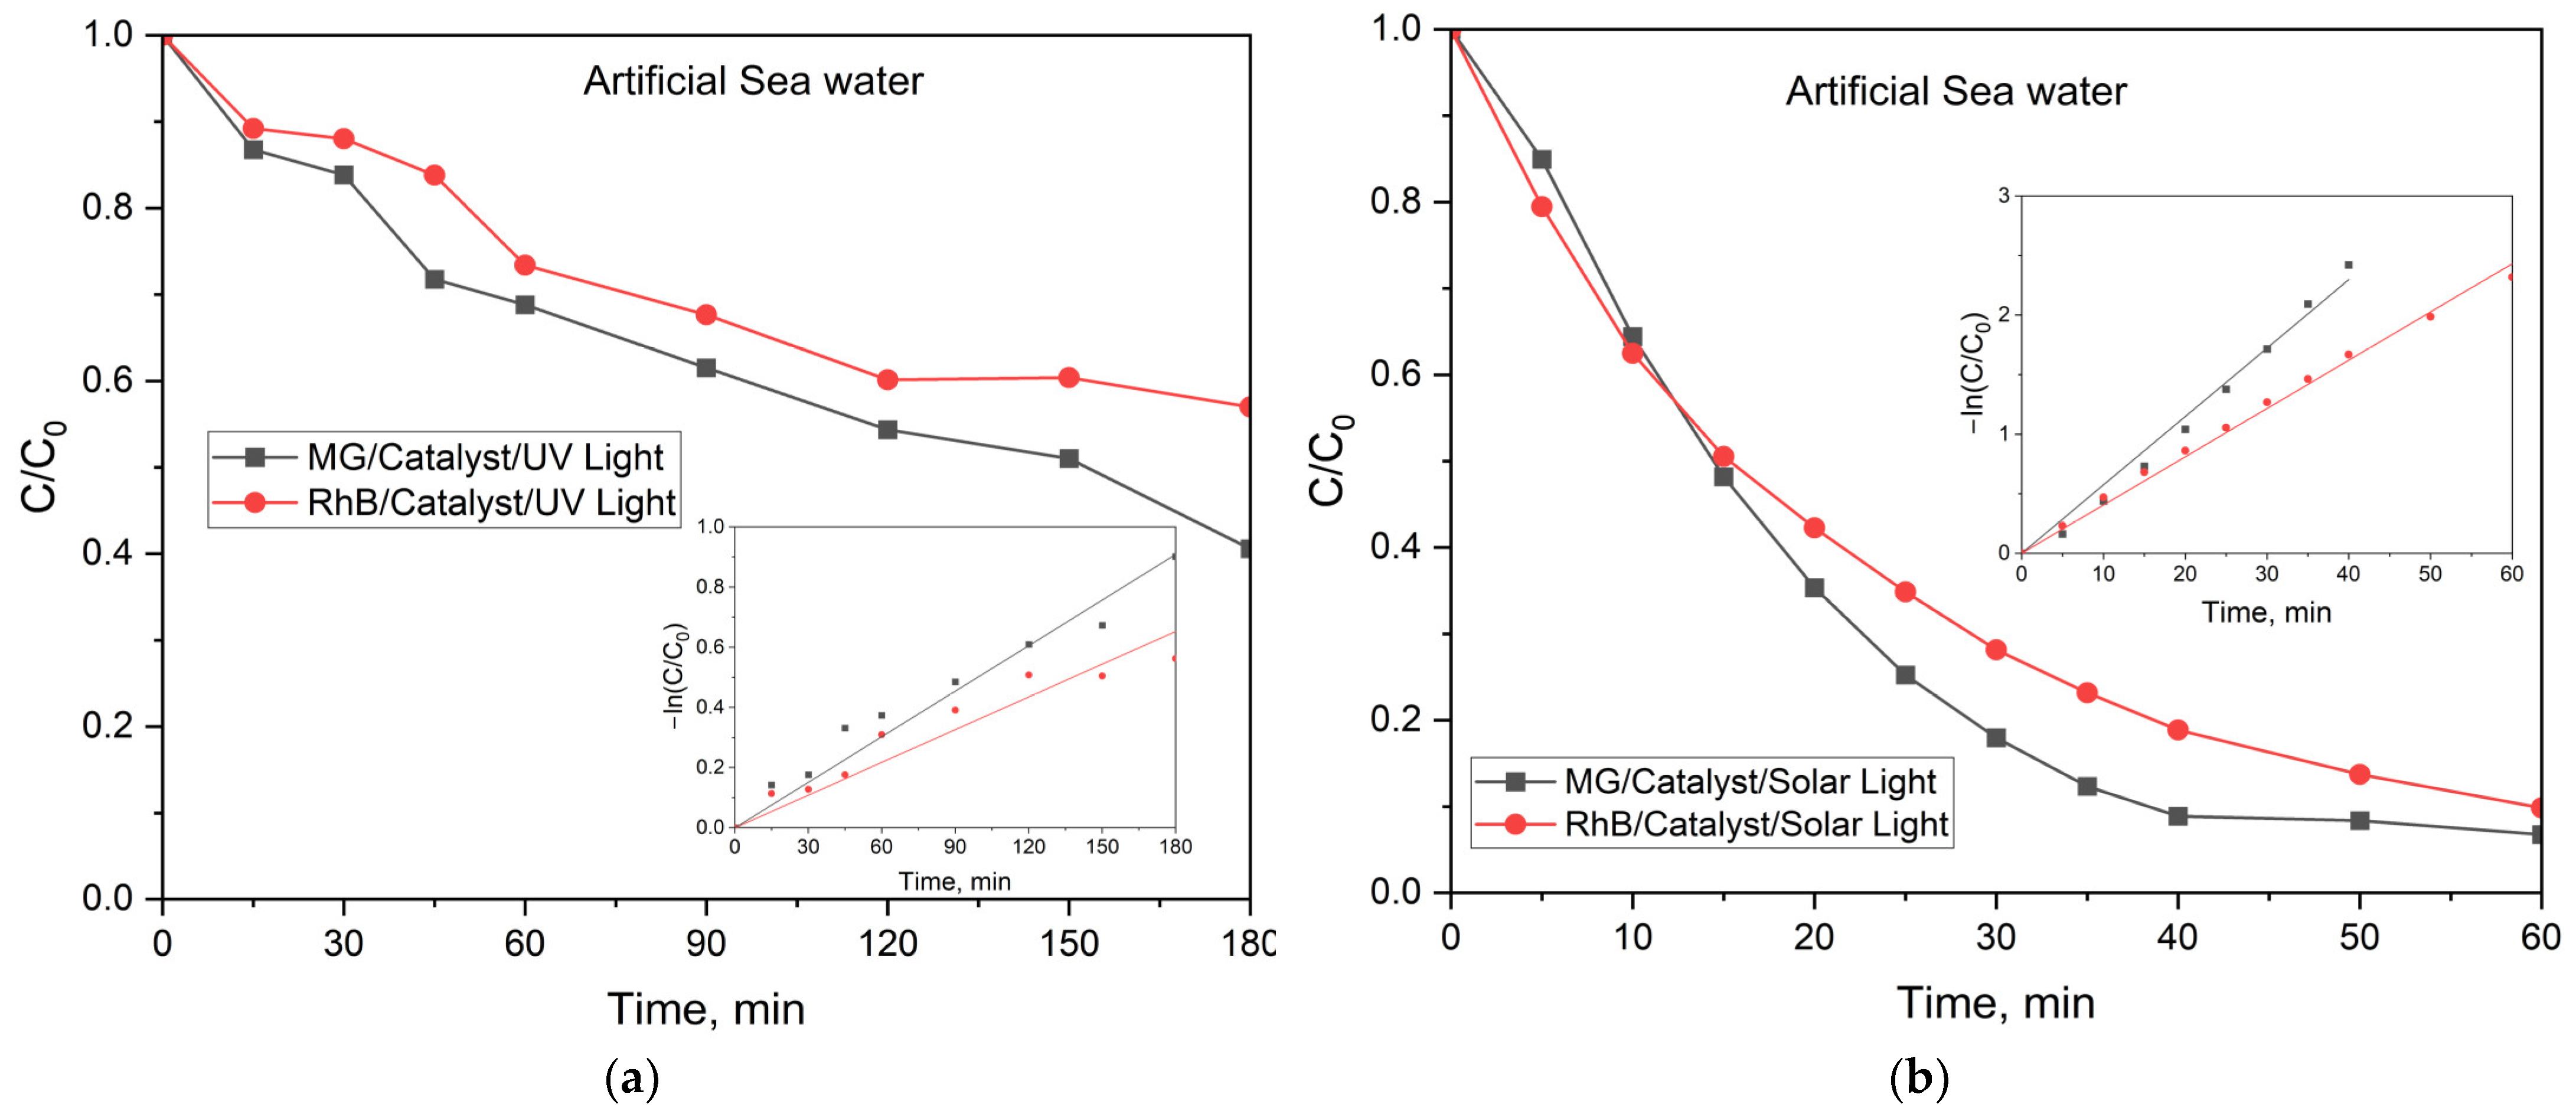
4.5. Photocatalytic Activity in Real Water Matrix

As Sofia University (located in Sofia city) does not have easy access to large water bodies, artificial seawater was used. The artificial seawater was prepared following the procedure proposed by [70]. It contained NaCl (25 g/L), MgCl2 (11 g/L), Na2SO4 (4 g/L), and CaCl2 (1.6 g/L) in ultrapure water.

5. Conclusions

Nanocomposites of the type МFe2O4/SiO2/TiO2 (M = Zn(II), Co(II)), with superparamagnetic and ferromagnetic properties, were synthesized, and their “core/shell” structure and morphology were proven. The structural and microstructural characteristics of the samples (crystallite size, microstrains, and weight fraction of the phases) were obtained by Rietveld analysis of the XRD data of the composites. By the combination of both experimental techniques, TEM/EDS and XPS, the phase composition and the structure of the “core/shell” were evidenced. Among the methods used for characterization, the XPS technique, known to be surface-sensitive, showed limitations for the detection of the elements in the core of the “core/shell” (Fe, Zn/Co) due to the thickness of the layers on the surface of the core.
The highest degradation efficiency of 98% and the highest rate constants were achieved for the degradation of MG and RhB under simulated solar light due to the high portion of UV radiation in the solar light simulator. The investigated influence of the water matrix on the photocatalytic activity showed that artificial seawater inhibited the role of both the UV and simulated solar light. As a result, decreased efficiency of the degradation and lower values of the rate constants of the photocatalytic process were obtained.
The detected decrease in the composite’s maximum magnetization in comparison with pure CoFe2O4 is due to the contribution of non-magnetic shells. The SiO2/TiO2 layers on CoFe2O4 are magnetically inactive, disturbing the magnetization of the composite.
The charge separation, important for the photocatalytic activity, was registered by photoluminescence measurements. Despite the improved charge separation of the composites in comparison with TiO2, their photocatalytic activity was lower than that of TiO2 P25. This is quite likely due to the anatase/rutile ratio for MFe2O4/SiO2/TiO2, differing from that of TiO2-Degussa P25. Despite the lower photocatalytic activity of the CoFe2O4/SiO2/TiO2 (HT) nanocomposite, it possessed a magnetic saturation of 3 emu/g. Samples of this kind can be applied to separate the photocatalyst from the purified water. Based on the available literature data, we may well affirm that the work presented here is the first study on the photocatalytic degradation of MG and RhB by MFe2O4/SiO2/TiO2 (M = Zn, Co) composites.

Supplementary Materials

The following supporting information can be downloaded at https://www.mdpi.com/article/10.3390/ijms25126755/s1.

Author Contributions

Conceptualization, J.Z. and M.T.; formal analysis, J.Z., M.T., M.G. and D.T.; investigation, M.T., J.Z., M.G. and D.T.; writing—original draft preparation, M.M. and M.T.; writing—review and editing, M.M. and M.T. All authors have read and agreed to the published version of the manuscript.

Funding

This research was funded by Operational Program “Science and Education for Smart Growth” Project BG05M2OP001-1.002-0019 and the European Union-Next Generation EU through the National Recovery and Resilience Plan of the Republic of Bulgaria, Project SUMMIT BG-RRP-2.004-0008-C01.

Data Availability Statement

Data are contained within the article.

Acknowledgments

The financial support of Project BG05M2OP001-1.002-0019, “Clean technologies for a sustainable environment—waters, wastes, energy for a circular economy”, as well as by the European Union-Next Generation EU through the National Recovery and Resilience Plan of the Republic of Bulgaria, Project SUMMIT BG-RRP-2.004-0008-C01, is highly appreciated.

Conflicts of Interest

The authors declare no conflict of interest.

References

  1. Linsebigler, A.L.; Lu, G.; Yates, J.T. Photocatalysis on TiO2 surfaces: Principles, mechanisms and selected results. Chem. Rev. 1995, 95, 735–758. [Google Scholar] [CrossRef]
  2. Xu, D.; Ma, H. Degradation of rhodamine B in water by ultrasound-assisted TiO2 photocatalysis. J. Clean. Prod. 2021, 313, 127758. [Google Scholar] [CrossRef]
  3. Kralchevska, R.; Milanova, M.; Hristov, D.; Pintar, A.; Todorovsky, D. Synthesis, characterization and photocatalytic activity of neodymium, nitrogen and neodymium-nitrogen doped TiO2. Mater. Res. Bull. 2012, 47, 2165–2177. [Google Scholar] [CrossRef]
  4. Zhou, X.; Shi, T.J.; Zhou, H.O. Hydrothermal preparation of ZnO-reduced graphene oxide hybrid with high performance in photocatalytic degradation. Appl. Surf. Sci. 2012, 258, 6204–6211. [Google Scholar] [CrossRef]
  5. Rahman, Q.I.; Ahmad, M.; Misra, S.K.; Lohani, M. Effective photocatalytic degradation of Rhodamine B dye by ZnO nanoparticles. Mater. Lett. 2013, 91, 170–174. [Google Scholar] [CrossRef]
  6. Lee, K.M.; Lai, C.W.; Ngai, K.S.; Juan, J.C. Recent developments of zinc oxide based photocatalyst in water treatment technology: A review. Water Res. 2016, 88, 428–448. [Google Scholar] [CrossRef] [PubMed]
  7. Ong, C.B.; Ng, L.Y.; Mohammad, A.W. A review of ZnO nanoparticles as solar photocatalysts: Synthesis, mechanisms and applications. Renew. Sustain. Energy Rev. 2018, 81, 536–551. [Google Scholar] [CrossRef]
  8. Vasei, H.V.; Masoudpanah, S.M.; Pouya, V.K. Photocatalytic activity of solution combustion synthesized ZnO powders by using a mixture of DTAB and citric acid fuels. J. Phys. Chem. Solids 2021, 151, 109895. [Google Scholar] [CrossRef]
  9. Qian, L.; Zhu, J.; Du, W.; Qian, X. Solvothermal synthesis, electrochemical and photocatalytic properties of monodispersed CeO2 nanocubes. Mater. Chem. Phys. 2009, 115, 835–840. [Google Scholar] [CrossRef]
  10. Bellardita, M.; Fiorenza, R.; Palmisano, L.; Scirè, S. Photocatalytic and photothermocatalytic applications of cerium oxide-based materials. In Cerium Oxide (CeO₂): Synthesis, Properties and Applications; Elsevier: Amsterdam, The Netherlands, 2020; pp. 109–167. [Google Scholar] [CrossRef]
  11. Wan, X.; Yuan, M.; Tie, S.-I.; Lan, S. Effects of catalyst characters on the photocatalytic activity and process of NiO nanoparticles in the degradation of methylene blue. Appl. Surf. Sci. 2013, 277, 40–46. [Google Scholar] [CrossRef]
  12. Chauhan, R.; Kumarb, A.; Chaudhary, R.P. Visible-light photocatalytic degradation of methylene blue with Fe doped CdS nanoparticles. Appl. Surf. Sci. 2013, 270, 655–660. [Google Scholar] [CrossRef]
  13. Zhang, H.L.; Wei, B.; Zhu, L.; Yua, J.H.; Sun, W.J.; Xu, L.L. Cation exchange synthesis of ZnS-Ag2S microspheric composites with enhanced photocatalytic activity. Appl. Surf. Sci. 2013, 270, 133–138. [Google Scholar] [CrossRef]
  14. Casbeer, E.; Sharma, V.K.; Li, X.-Z. Synthesis and photocatalytic activity of ferrites under visible light: A review. Sep. Purif. Technol. 2012, 87, 1–14. [Google Scholar] [CrossRef]
  15. Ch, K.; Dhar, S.S. Rapid catalytic degradation of malachite green by MgFe2O4 nanoparticles in presence of H2O2. J. Alloys Compd. 2020, 828, 154462. [Google Scholar] [CrossRef]
  16. Krishnamoorthi, A.M.C.; Babu, K.C.; Pavithra, N.C. Dielectric, magnetic hyperthermia, and photocatalytic properties of ZnFe2O4 nanoparticles synthesized by solvothermal reflux method. Appl. Phys. A 2019, 125, 477. [Google Scholar] [CrossRef]
  17. Tsvetkov, M.; Zaharieva, J.; Milanovа, M. Ferrites, modified with silver nanoparticles, for photocatalytic degradation of malachite green in aqueous solutions. Catal. Today 2020, 357, 453–459. [Google Scholar] [CrossRef]
  18. Manohar, A.; Chintagumpala, K.; Hyeon, K.K. Mixed Zn–Ni spinel ferrites: Structure, magnetic hyperthermia and photocatalytic properties. Ceram. Intern. 2021, 47, 7052–7061. [Google Scholar] [CrossRef]
  19. Lassoued, A.; Li, J.F. Magnetic and photocatalytic properties of Ni–Co ferrites. Solid State Sci. 2020, 104, 106199. [Google Scholar] [CrossRef]
  20. Dojcinovic, M.P.; Vasiljevic, Z.Z.; Pavlovic, V.P.; Barisic, D.; Pajic, D.; Tadic, N.B.; Nikolic, M.V. Mixed Mg–Co spinel ferrites: Structure, morphology, magnetic and photocatalytic properties. J. Alloys Compd. 2021, 855, 157429. [Google Scholar] [CrossRef]
  21. Kurian, M.; Thankachan, S. Structural diversity and applications of spinel ferrite core—Shell nanostructures—A review. Open Ceram. 2021, 8, 100179. [Google Scholar] [CrossRef]
  22. Klekotka, U.; Piotrowska, B.; Satuła, D.; Kalska-Szostko, B. Modified ferrite core-shell nanoparticles magneto-structural characterization. Appl. Surf. Sci. 2018, 444, 161–167. [Google Scholar] [CrossRef]
  23. Masala, O.; Hoffman, D.; Sundaram, N.; Page, K.; Proffen, T.; Lawes, G.; Seshadri, R. Preparation of magnetic spinel ferrite core/shell nanoparticles: Soft ferrites on hard ferrites and vice versa. Solid State Sci. 2006, 8, 1015–1022. [Google Scholar] [CrossRef]
  24. Greene, D.; Serrano-Garcia, R.; Govan, J.; Gun’ko, Y.K. Synthesis Characterization and Photocatalytic Studies of Cobalt Ferrite-Silica-Titania Nanocomposites. Nanomaterials 2014, 4, 331–343. [Google Scholar] [CrossRef] [PubMed]
  25. Hamad, H.; Abd El-Latif, M.; Kashyout, A.E.-H.; Sadik, W.; Feteha, M. Synthesis and characterization of core–shell–shell magnetic (CoFe2O4–SiO2–TiO2) nanocomposites and TiO2 nanoparticles for the evaluation of photocatalytic activity under UV and visible irradiation. N. J. Chem. 2015, 39, 3116–3128. [Google Scholar] [CrossRef]
  26. Harraz, F.A.; Mohamed, R.M.; Rashad, M.M.; Wang, Y.C.; Sigmund, W. Magnetic nanocomposite based on titania–silica/cobalt ferrite for photocatalytic degradation of methylene blue dye. Ceram. Int. 2014, 40, 375–384. [Google Scholar] [CrossRef]
  27. Ren, X.; Chen, X.; Ding, H.; Yang, H. Luminescent and magnetic properties of CoFe2O4@SiO2@Y2O3:Tb3+ nanocomposites with the core–shell. J. Alloys Compd. 2015, 625, 85–89. [Google Scholar] [CrossRef]
  28. Dee, G.; Shayoub, H.; McNeill, H.; Sánchez Lozano, I.; Rafferty, A.; Gun’ko, Y.K. MnFe2O4@SiO2@CeO2 core–shell nanostructures for applications in water remediation. RSC Adv. 2023, 13, 10513–10522. [Google Scholar] [CrossRef] [PubMed]
  29. Rao, V.N.; Reddy, N.L.; Preethi, V.; Karthik, M.; Yu, Y.-T.; Yang, J.M.; Kumari, M.M.; Shankar, M.V. A critical review on core/shell-based nanostructured photocatalysts for improved hydrogen generation. Int. J. Hydrogen Energy 2023, 48, 11754–11774. [Google Scholar] [CrossRef]
  30. Lee, C.-T.; Lee, H.-Y.; Chen, H.-W. GaN MOS device using SiO2 insulator grown by photoelectrochemical oxidation method. IEEE Electron Device Lett. 2003, 24, 54–56. [Google Scholar] [CrossRef]
  31. Peng, T.; Zhao, D.; Dai, K.; Shi, W.; Hirao, K. Synthesis of titanium dioxide nanoparticles with mesoporous anatase wall and high photocatalytic activity. J. Phys. Chem. B 2005, 109, 4947–4952. [Google Scholar] [CrossRef]
  32. Gong, X.-Q.; Selloni, A. Reactivity of anatase TiO2 nanoparticles: The role of the minority (001) surface. J. Phys. Chem. B 2005, 109, 19560–19562. [Google Scholar] [CrossRef] [PubMed]
  33. Zhang, W.F.; He, Y.L.; Zhang, M.S.; Yin, Z.; Chen, Q. Raman scattering study on anatase TiO2 nanocrystals. J. Phys. D 2000, 33, 912. [Google Scholar] [CrossRef]
  34. Yadav, A.A.; Kang, S.-W.; Hunge, Y.M. Photocatalytic degradation of Rhodamine B using graphitic carbon nitride photocatalyst. J. Mater. Sci. Mater. Electron. 2021, 32, 15577–15585. [Google Scholar] [CrossRef]
  35. Sutili, F.J.; Gressler, L.T. Antimicrobial agents. In Aquaculture Pharmacology; Academic Press: Cambridge, MA, USA, 2021; Chapter 3; pp. 131–168. [Google Scholar] [CrossRef]
  36. Hanaor, D.A.H.; Sorrell, C.C. Review of the anatase to rutile phase transformation. J. Mater. Sci. 2011, 46, 855–874. [Google Scholar] [CrossRef]
  37. Nolan, N.T.; Synnott, D.W.; Seery, M.K.; Hinder, S.J.; Van Wassenhoven, A.; Pillai, S.C. Effect of N-doping on the photocatalytic activity of sol–gel TiO2. J. Hazard. Mater. 2012, 211–212, 88–94. [Google Scholar] [CrossRef] [PubMed]
  38. Kralchevska, R.; Milanova, M.; Kovacheva, P.; Kolev, J.; Avdeev, G.; Todorovsky, D. In-fluence of ThO2 on the photocatalytic activity of TiO2. Cent. Eur. J. Chem. 2011, 9, 1027–1038. [Google Scholar] [CrossRef]
  39. Engelhard, M.H.; Droubay, T.C.; Du, Y. X-ray Photoelectron Spectroscopy Applications. In Encyclopedia of Spectroscopy and Spectrometry, 3rd ed.; Environmental Molecular Sciences Lab.: Washington, DC, USA, 2017; pp. 716–724. [Google Scholar] [CrossRef]
  40. Wing, M.; Gong, B.; Yao, X.; Wang, Y.; Lamb, R.N. Preparation and microstructure properties of Al-doped TiO2-SiO2 gel-glass film. Thin Solid Film. 2006, 515, 2055–2058. [Google Scholar] [CrossRef]
  41. Manole, A.V.; Dobromir, M.; Apetrei, R.; Nica, V.; Lucaet, D. Surface characterization of sputtered N:TiO2 thin films within a wide range of dopant concentration. Ceram. Int. 2014, 40, 9989–9995. [Google Scholar] [CrossRef]
  42. Guo, N.; Liang, Y.; Lan, S.; Liu, L. Uniform TiO2–SiO2 hollow nanospheres: Synthesis, characterization and enhanced adsorption–photodegradation of azo dyes and phenol. Appl. Surf. Sci. 2014, 305, 562–574. [Google Scholar] [CrossRef]
  43. Peng, T.; Ray, S.; Veeravalli, S.S.; Lalman, J.A.; Arefi-Khonsari, F. The role of hydrothermal conditions in determining 1D TiO2 nanomaterials bandgap energies and crystal phases. Mater. Res. Bull. 2018, 105, 104–113. [Google Scholar] [CrossRef]
  44. Ray, S.K.; Dhakal, D.; Lee, S.W. Insight into Malachite Green Degradation, Mechanism and Pathways by Morphology-Tuned α-NiMoO4 Photocatalyst. Photochem. Photobiol. 2018, 94, 552–563. [Google Scholar] [CrossRef]
  45. Weber, M.; Schulmeister, K. Hazard Assessment of Lamps following the CIE Lamp Safety Standard. 2003. Available online: https://laser-led-lamp-safety.seibersdorf-laboratories.at/fileadmin/uploads/intranet/2003%20cie%20hazard%20assessment%20of%20lamps_%20weber.pdf (accessed on 10 April 2024).
  46. Stefan, M. More Than Just Light. Solutions in Ultraviolet Light. 100 Years of Innovation Osram. 2016. Available online: https://docs.rs-online.com/45d7/0900766b81506d14.pdf (accessed on 10 April 2024).
  47. Hu, L.; Wang, P.; Zhang, G.; Liu, G.; Li, Y.; Shen, T.; Crittenden, J.C. Enhanced persulfate oxidation of organic pollutants and removal of total organic carbons using natural magnetite and microwave irradiation. Chem. Eng. J. 2020, 383, 123140. [Google Scholar] [CrossRef]
  48. Schneider, J.T.; Firak, D.S.; Ribeiro, R.R.; Peralta-Zamora, P. Use of scavenger agents in heterogeneous photocatalysis: Truths, half-truths, and misinterpretations. Phys. Chem. Chem. Phys. 2020, 22, 15723–15733. [Google Scholar] [CrossRef] [PubMed]
  49. Denisov, N.; Yoo, J.E.; Schmuki, P. Effect of different hole scavengers on the photoelectrochemical properties and photocatalytic hydrogen evolution performance of pristine and Pt-decorated TiO2 nanotubes. Electrochim. Acta 2019, 319, 61–71. [Google Scholar] [CrossRef]
  50. Slapničar, Š.; Žerjav, G.; Zavašnik, J.; Finšgar, M.; Pintar, A. Synthesis and characterization of plasmonic Au/TiO2 nanorod sol-ids for heterogeneous photocatalysis. J. Environ. Chem. Eng. 2023, 11, 109835. [Google Scholar]
  51. Serpone, N.; Lawless, D.; Khairutdinov, R. Size effects on the photophysical properties of colloidal anatase TiO2 particles: Size quantization or direct transition in this indirect semiconductor? J. Phys. Chem. 1995, 99, 16646–16654. [Google Scholar] [CrossRef]
  52. Zhang, J.; Zhou, P.; Liu, J.; Yu, J. New understanding of the difference of photocatalytic activity among anatase, rutile and brookite TiO2. Phys. Chem. Chem. Phys. 2014, 16, 20382–20386. [Google Scholar] [CrossRef] [PubMed]
  53. Golubović, A.; Scepanovic, M.J.; Kremenovic, A. Raman study of the variation in anatase structure of TiO2 nanopowders due to the changes of sol-gel synthesis conditions. J. Sol-Gel Sci. Technol. 2009, 3, 311–319. [Google Scholar] [CrossRef]
  54. Hurum, D.C.; Agrios, A.G.; Gray, K.A.; Rajh, T.; Thurnauer, M.C. Explaining the Enhanced Photocatalytic Activity of Degussa P25 Mixed-Phase TiO2 Using EPR. J. Phys. Chem. B 2003, 107, 4545–4549. [Google Scholar] [CrossRef]
  55. Yu, J.; Yu, H.; Cheng, B.; Zhou, M.; Zhao, X. Enhanced photocatalytic activity of TiO2 powder (P25) by hydrothermal treatment. J. Mol. Catal. A Chem. 2006, 253, 112–118. [Google Scholar] [CrossRef]
  56. Arbuj, S.S.; Hawaldar, R.R.; Mulik, U.P.; Waniet, B.N.; Amalnerkar, D.P.; Waghmode, S.B. Preparation, characterization and photocatalytic activity of TiO2 towards methylene blue degradation. Mater. Sci. Eng. B 2010, 168, 90–94. [Google Scholar] [CrossRef]
  57. Yuangpho, N.; Lee, S.T.T.; Treerujiraphapong, T.; Khanitchaidecha, W.; Nakaruk, A. Enhanced photocatalytic performance of TiO2 particles via effect of anatase–rutile ratio. Phys. E Low-Dimens. Syst. Nanostructures 2015, 67, 18–22. [Google Scholar] [CrossRef]
  58. Nolan, N.T.; Seery, M.K.; Pillai, S.C. Spectroscopic investigation of the anatase-to- rutile transformation of sol–gel-synthesized TiO2 photocatalysts. J. Phys. Chem. C 2009, 113, 16151–16157. [Google Scholar] [CrossRef]
  59. Mahlambi, M.M.; Mishra, A.K.; Mishra, S.B.; Krause, R.W.; Mamba, B.B.; Raichur, A.M. Comparison of Rhodamine B degradation under UV irradiation by two phases of titania nano-photocatalyst. J. Therm. Anal. Calorim. 2012, 110, 847–855. [Google Scholar] [CrossRef]
  60. Bachvarova-Nedelcheva, A.; Iordanova, R.; Georgieva, N.; Nemska, V.; Foteva, T.; Stoyanova, A. Influence of Nb2O5 and B2O3 on the photocatalytic and antibacterial activity of sol-gel derived TiO2 nanopowders. J. Chem. Techn. Metall. 2024, 59, 335–342. [Google Scholar] [CrossRef]
  61. Bachvarova-Nedelcheva, A.; Iordanova, R.; Naydenov, A.; Stoyanova, A.; Georgieva, N.; Nemska, V.; Foteva, T. Sol-Gel Obtaining of TiO2/TeO2 Nanopowders with Biocidal and Environmental Applications. Catalysts 2023, 13, 257. [Google Scholar] [CrossRef]
  62. Tarigh, G.D.; Shemirani, F.; Mazhari, N.S. Fabrication of a reusable magnetic multi-walled carbon nanotube–TiO2 nanocomposite by electrostatic adsorption: Enhanced photodegradation of malachite green. RSC Adv. 2015, 5, 35070. [Google Scholar] [CrossRef]
  63. Atalı, Ş.G.; Akbal, F.; Gürbüz, M.; Turan, B.C. Granular titanium dioxide and silicon-doped titanium dioxide as reusable photocatalysts for dye removal. Int. J. Appl. Ceram. Technol. 2023, 21, 2024–2036. [Google Scholar] [CrossRef]
  64. Ivanova, D.; Mladenova, E.; Kaneva, N. Photo-fixation of Ag onto TiO2 powder films for improved photocatalytic activity and atomic-absorption determination of residual noble metal in dyes solution. C. R. Acad. Bulg. Sci. 2024, 77, 20–29. [Google Scholar] [CrossRef]
  65. Aarthi, T.; Madras, G. Photocatalytic Degradation of Rhodamine Dyes with Nano-TiO2. Ind. Eng. Chem. Res. 2007, 46, 7–14. [Google Scholar] [CrossRef]
  66. Putz, H.; Brandenburg, K. Match!—Phase Analysis Using Powder Diffraction, Version 3.x, Crystal Impact; GbR, Kreuzherrenstr: Bonn, Germany; Volume 102, p. 53227. Available online: https://www.crystalimpact.de/match (accessed on 5 February 2024).
  67. Grazulis, S.; Chateigner, D.; Downs, R.T.; Yokochi, A.T.; Quiros, M.; Lutterotti, L.; Manakova, E.; Butkus, J.; Moeck, P.; Le Bail, A. Crystallography Open Database—An open-access collection of crystal structures. J. Appl. Crystallogr. 2009, 42, 726–729. [Google Scholar] [CrossRef] [PubMed]
  68. Lutterotti, L. Maud: A Rietveld analysis program designed for the internet and experiment integration. Acta Crystallogr. Sect. A Found. Crystallogr. 2000, A56, s54. [Google Scholar] [CrossRef]
  69. Tauc, J.; Grigorovici, R.; Vancu, A. Optical Properties and Electronic Structure of Amorphous Germanium. Phys. Status Solidi 1966, 15, 627–637. [Google Scholar] [CrossRef]
  70. Hu, J.; Sun, C.; Wu, L.; Zhao, G.; Liu, H.; Jiao, F. Halogen doped g-C3N4/ZnAl-LDH hybrid as a Z-scheme photocatalyst for efficient degradation for tetracycline in seawater. Sep. Purif. Technol. 2023, 309, 123047. [Google Scholar] [CrossRef]
Figure 1. The structures of (a) Rhodamine B and (b) Malachite Green.
Ijms 25 06755 g001
Figure 2. XRD patterns of (a) CoFe2O4 (SG), (b) CoFe2O4/TiO2 (SG), and (c) CoFe2O4/SiO2/TiO2 (SG).
Ijms 25 06755 g002
Figure 3. ТЕМ micrographs of core/shell composites: (a) CoFe2O4/SiO2 (SG) and (b,c) CoFe2O4/SiO2/TiO2 (SG).
Ijms 25 06755 g003
Figure 4. Photocatalytic degradation of Malachite Green by the nanocomposites (black, 1) CoFe2O4/TiO2 (SG) and (red, 2) CoFe2O4/SiO2/TiO2 (SG) under UV irradiation.
Ijms 25 06755 g004
Figure 5. The comparison of XRD data for the synthesized composites (a) ZnFe2O4/SiO2/TiO2 (HT) and (b) CoFe2O4/SiO2/TiO2 (HT) with the referents of the COD data for MFe2O4 (M = Zn, Co) (top), rutile (middle), and anatase (bottom).
Ijms 25 06755 g005
Figure 6. Experimentally observed (black dots), Rietveld calculated (continuous red line), and difference (continuous bottom blue line) profiles obtained after Rietveld analysis of the XRD data of (a) ZnFe2O4/SiO2/TiO2 (HT) (M = Zn, Co) and (b) CoFe2O4/SiO2/TiO2 (HT). Peak positions are shown at the baseline as small markers.
Ijms 25 06755 g006
Figure 7. TEM/EDS of (a,b) ZnFe2O4/SiO2/TiO2 and (c,d) CoFe2O4/SiO2/TiO2. The line scan is presented by the yellow line in the inset.
Ijms 25 06755 g007
Figure 8. ZnFe2O4/TiO2/SiO2 (HT): high-resolution XPS spectra of O1s, Ti2p, and Si2p.
Ijms 25 06755 g008
Figure 9. CoFe2O4/TiO2/SiO2 (HT): high-resolution XPS spectra of O1s, Ti2p, and Si2p.
Ijms 25 06755 g009
Figure 10. (a) Reflectance of the samples ZnFe2O4/SiO2/TiO2(HT) and CoFe2O4/SiO2/TiO2(HT); (b) energy band gap calculated on the base of the reflectance.
Ijms 25 06755 g010
Figure 11. Kinetic curves of the decomposition of (a) MG and (b) RhB in the presence of the composite CoFe2O4/SiO2/TiO2 (HT) under UV irradiation.
Ijms 25 06755 g011
Figure 12. Photocatalytic degradation of the dyes (a) MG and (b) RhB under UV light irradiation in the presence of ZnFe2O4/SiO2/TiO2(HT) evaluated by the absorbance. The arrow points decreasing of the absorbance with the irradiation time.
Ijms 25 06755 g012
Figure 13. (a) Kinetic curves of the photolysis of RhB (blue) and MG (green) and the photocatalytic decomposition of MG (black) and RhB (red) in the presence of ZnFe2O4/SiO2/TiO2 (HT) under simulated solar irradiation; (b) rate constants of the process of RhB and MG degradation under simulated solar irradiation.
Ijms 25 06755 g013
Figure 14. Photocatalytic activity of ZnFe2O4/SiO2/TiO2 (HT) in artificial seawater: (a) under UV light and (b) under simulated solar irradiation for MG (black) and RhB (red) (see the legend).
Ijms 25 06755 g014
Figure 15. (a) Photocatalytic degradation of MG under solar irradiation with recycled ZnFe2O4/SiO2/TiO2 (HT); (b) XRD pattern of the ZnFe2O4/SiO2/TiO2 (HT) photocatalyst before and after photocatalytic experiments (solar irradiation, MG degradation).
Ijms 25 06755 g015
Figure 16. (a) Efficiency of the different radical scavengers: p-benzoquinone, tert-BuOH, and Na2EDTA for the degradation of azo dye (according to the legend). (b) Schematic illustration of the radicals and h+ holes formation and the degradation of azo dye (MG and RhB) under UV irradiation in the presence of CoFe2O4/SiO2/TiO2.
Ijms 25 06755 g016
Figure 17. The photoluminescent spectra of pure TiO2 and MFe2O4/SiO2/TiO2 (M = Zn, Co).
Ijms 25 06755 g017
Figure 18. Magnetization versus magnetic field curves for the samples (a) CoFe2O4, (b) CoFe2O4/SiO2/TiO2(HT), (c) ZnFe2O4, and (d) ZnFe2O4/SiO2/TiO2(HT) measured by VSM at room temperature.
Ijms 25 06755 g018
Figure 19. (a) Suspension containing the CoFe2O4/SiO2/TiO2(HT) catalyst; (b) solution and catalyst separated by an NdFeB magnet.
Ijms 25 06755 g019
Table 1. Unit cell parameters and crystallite size of CoFe2O4, produced via the sol-gel method, and the nanocomposites on its base.
SampleUnit Cell
Parameters, Å
Crystallite
Size, nm
CoFe2O4 (SG)a = 8.3612(2)48.1 (2)
CoFe2O4/TiO2 (SG)Anatasea = 3.7833 (1)
c = 9.4391 (3)
25.3 (3)
Rutilea = 4.5815 (2)
c = 2.9531 (4)
20.1 (2)
CoFe2O4a = 8.3652 (10)56.6 (7)
CoFe2O4/SiO2/TiO2 (SG)Anatasea = 3.7893 (1)
c = 9.4364 (6)
16.8 (6)
CoFe2O4a = 8.3631 (9)53.1 (4)
Table 2. Lattice constants and crystallite size of the nanocomposites produced via the HT method.
ZnFe2O4/SiO2/TiO2 (HT)CoFe2O4/SiO2/TiO2 (HT)
ZnFe2O4AnataseCoFe2O4RutileAnatase
Unit cell parameters, Åa = b = c =
8.4463 (9)
A = b = 3.7899 (2)
c = 9.5230 (7)
a = b = c =
8.3874 (15)
a = b = 4.5953 (6)
c = 2.9608 (7)
a = b = 3.7860 (2)
c = 9.5185 (7)
Crystallite size, nm19.3 (5)41.2 (1)34.2 (3)42.8 (9)36.8 (3)
Microstrains, ×10−3 a.u.2.6 (3)2.0 (2)2.6 (5)0.6 (1)1.6 (3)
Weight fraction,%19.5 ± 2.180.5 ± 2.11.2 ± 0.311.1 ± 1.187.7 ± 5.1
Rwp,%5.647.37
χ21.101.18
Table 3. Photocatalytic activity of ZnFe2O4/SiO2/TiO2 (HT) in ultrapure and artificial water matrices under UV light and simulated solar irradiation.
Ultrapure H2OArtificial Sea H2O
UV LightSimulated Solar LightUV LightSimulated Solar Light
Rate
Constant,
10−3 min−1
Degradation,
%
Rate
Constant,
10−3 min−1
Degradation,
%
Rate Constant,
10−3 min−1
Degradation,
%
Rate Constant,
10−3 min−1
Degradation,
%
MGRhBMGRhBMGRhBMGRhBMGRhBMGRhBMGRhBMGRhB
9.0-80537765989853.659.5425.74.09390
Disclaimer/Publisher’s Note: The statements, opinions and data contained in all publications are solely those of the individual author(s) and contributor(s) and not of MDPI and/or the editor(s). MDPI and/or the editor(s) disclaim responsibility for any injury to people or property resulting from any ideas, methods, instructions or products referred to in the content.

