Article

Unique Splicing of Lrp5 in the Brain: A New Player in Neurodevelopment and Brain Maturation

1
Cardiovascular Program, Institut de Recerca de Sant Pau, 08025 Barcelona, Spain
2
Biomedicine Doctorate Program, Universitat de Barcelona, 08007 Barcelona, Spain
3
Centro Investigación Biomédica en Red-Cardiovascular (CIBER-CV), Instituto de Salud Carlos III, 28029 Madrid, Spain
4
Universitat Autònoma de Barcelona, 08193 Barcelona, Spain
*
Author to whom correspondence should be addressed.
Int. J. Mol. Sci. 2024, 25(12), 6763; https://doi.org/10.3390/ijms25126763
Submission received: 16 May 2024 / Revised: 11 June 2024 / Accepted: 13 June 2024 / Published: 20 June 2024
(This article belongs to the Section Molecular Genetics and Genomics)

Abstract

:
Low-density lipoprotein receptor-related protein 5 (LRP5) is a constitutively expressed receptor with observed roles in bone homeostasis, retinal development, and cardiac metabolism. However, the function of LRP5 in the brain remains unexplored. This study investigates LRP5’s role in the central nervous system by conducting an extensive analysis using RNA-seq tools and in silico assessments. Two protein-coding Lrp5 transcripts are expressed in mice: full-length Lrp5-201 and a truncated form encoded by Lrp5-202. Wt mice express Lrp5-201 in the liver and brain and do not express the truncated form. Lrp5−/− mice express Lrp5-202 in the liver and brain and do not express Lrp5-201 in the liver. Interestingly, Lrp5−/− mouse brains show full-length Lrp5-201 expression, suggesting that LRP5 has a role in preserving brain function during development. Functional gene enrichment analysis on RNA-seq unveils dysregulated expression of genes associated with neuronal differentiation and synapse formation in the brains of Lrp5−/− mice compared to Wt mice. Furthermore, Gene Set Enrichment Analysis highlights downregulated expression of genes involved in retinol and linoleic acid metabolism in Lrp5−/− mouse brains. Tissue-specific alternative splicing of Lrp5 in Lrp5−/− mice supports that the expression of LRP5 in the brain is needed for the correct synthesis of vitamins and fatty acids, and it is indispensable for correct brain development.

1. Introduction

Low-density lipoprotein receptor (LDLR)-related protein 5 (LRP5) induces the canonical WNT/β-catenin signalling pathway after the extracellular binding of WNT ligands or extracellular lipids [1,2,3]. LRP5 was identified when a loss-of-function mutation in Arrow (the Drosophila melanogaster homologue LRP5 gene) generated flies without functional wings due to impaired development [4]. In normal conditions, the canonical WNT pathway is inactive, and there is constant phosphorylation, ubiquitination and degradation of β-catenin monomers [5,6]. Canonical WNT signalling activation through LRP5 leads to β-catenin stabilisation in the cytoplasm and translocation into the nucleus where it triggers the activation of the T cell factor/Lymphoid enhancer-binding factor 1 (TCF/LEF1) transcription factors [7,8]. TCF/LEF1 recruits other transcriptional co-activators to the promoter region of targeted genes such as cyclin D1, Bmp2, and Opn, inducing their expression [9,10].
Canonical WNT signalling is crucial in the central nervous system, as it regulates, amongst other processes, brain development, synapse formation, and neurogenesis [11,12,13,14,15,16]. Defects in canonical WNT signalling have been associated with central nervous system malfunction, including neural tube closure defects, medulloblastoma, bipolar disorder, schizophrenia, and Alzheimer’s disease [17,18,19]. In the brain, there is constitutive expression of LRP5 [20]. However, there is little knowledge on the role of LRP5 in brain development. In a human meta-analysis, two different single nucleotide polymorphisms (SNPs) in LRP5 causing Ala1330Val amino acid changes have been associated with attention-deficit/hyperactivity disorder in females with altered brain maturation [21]. LRP5 is also necessary in zebrafish, where WNT3 binding to Frizzled1 activates the canonical WNT pathway that regulates brain development [22].
We have previously shown a role for LRP5 in extracranial tissues and organs. Indeed, LRP5 is involved in the healing process of the heart after myocardial infarctions in mice, pigs, and humans [23]. Furthermore, LRP5 expression is protective in the vascular wall, as LRP5 deficiency leads to increased aortic lipid accumulation, macrophage infiltration into the vessel wall, and increased pro-inflammatory cytokines in the blood of hypercholesterolemic mice [24,25]. Additionally, LRP5 is also involved in cholesterol ester accumulation in inflammatory cells [3], a process in which proprotein convertase subtilisin kexin 9 (PCSK9) is also involved [26]. Finally, LRP5 generates pro-survival signalling by stimulating the WNT/β-catenin pathway in neurons [27]. Taken together, these results indicate a protective and pro-survival role for LRP5 in tissue homeostasis.
Lrp5−/− mice are generated by the insertion of an IRES-LacZ-neomycin cassette to interrupt the sixth exon of the mouse Lrp5 gene at amino acid 373, generating a premature stop codon and blocking the synthesis of a full-length LRP5 protein [28]. This modification should affect all cells in mice. However, full-length LRP5 expression is observed in the brains of Lrp5−/− mice. To understand these data, we analysed different organs of Wt and Lrp5−/− mice.

2. Results

2.1. Non-Mendelian Pattern in Lrp5−/− Mouse Births

The analyses of the breeding of heterozygous (Hz; −/+ × −/+) mice from our Lrp5−/− mouse colony showed that the offspring did not follow a Mendelian pattern. The observed births of Lrp5−/− mice were less than expected (16.97% instead of the expected 25%), and there were increased Hz mouse births (60.57% instead of the expected 50%; Figure 1A,C). Similarly, the breeding of Hz mice to Lrp5−/− mice (−/+ × −/−) also showed decreased births of Lrp5−/− mice (93 births observed versus 107 expected; Figure 1B,D).

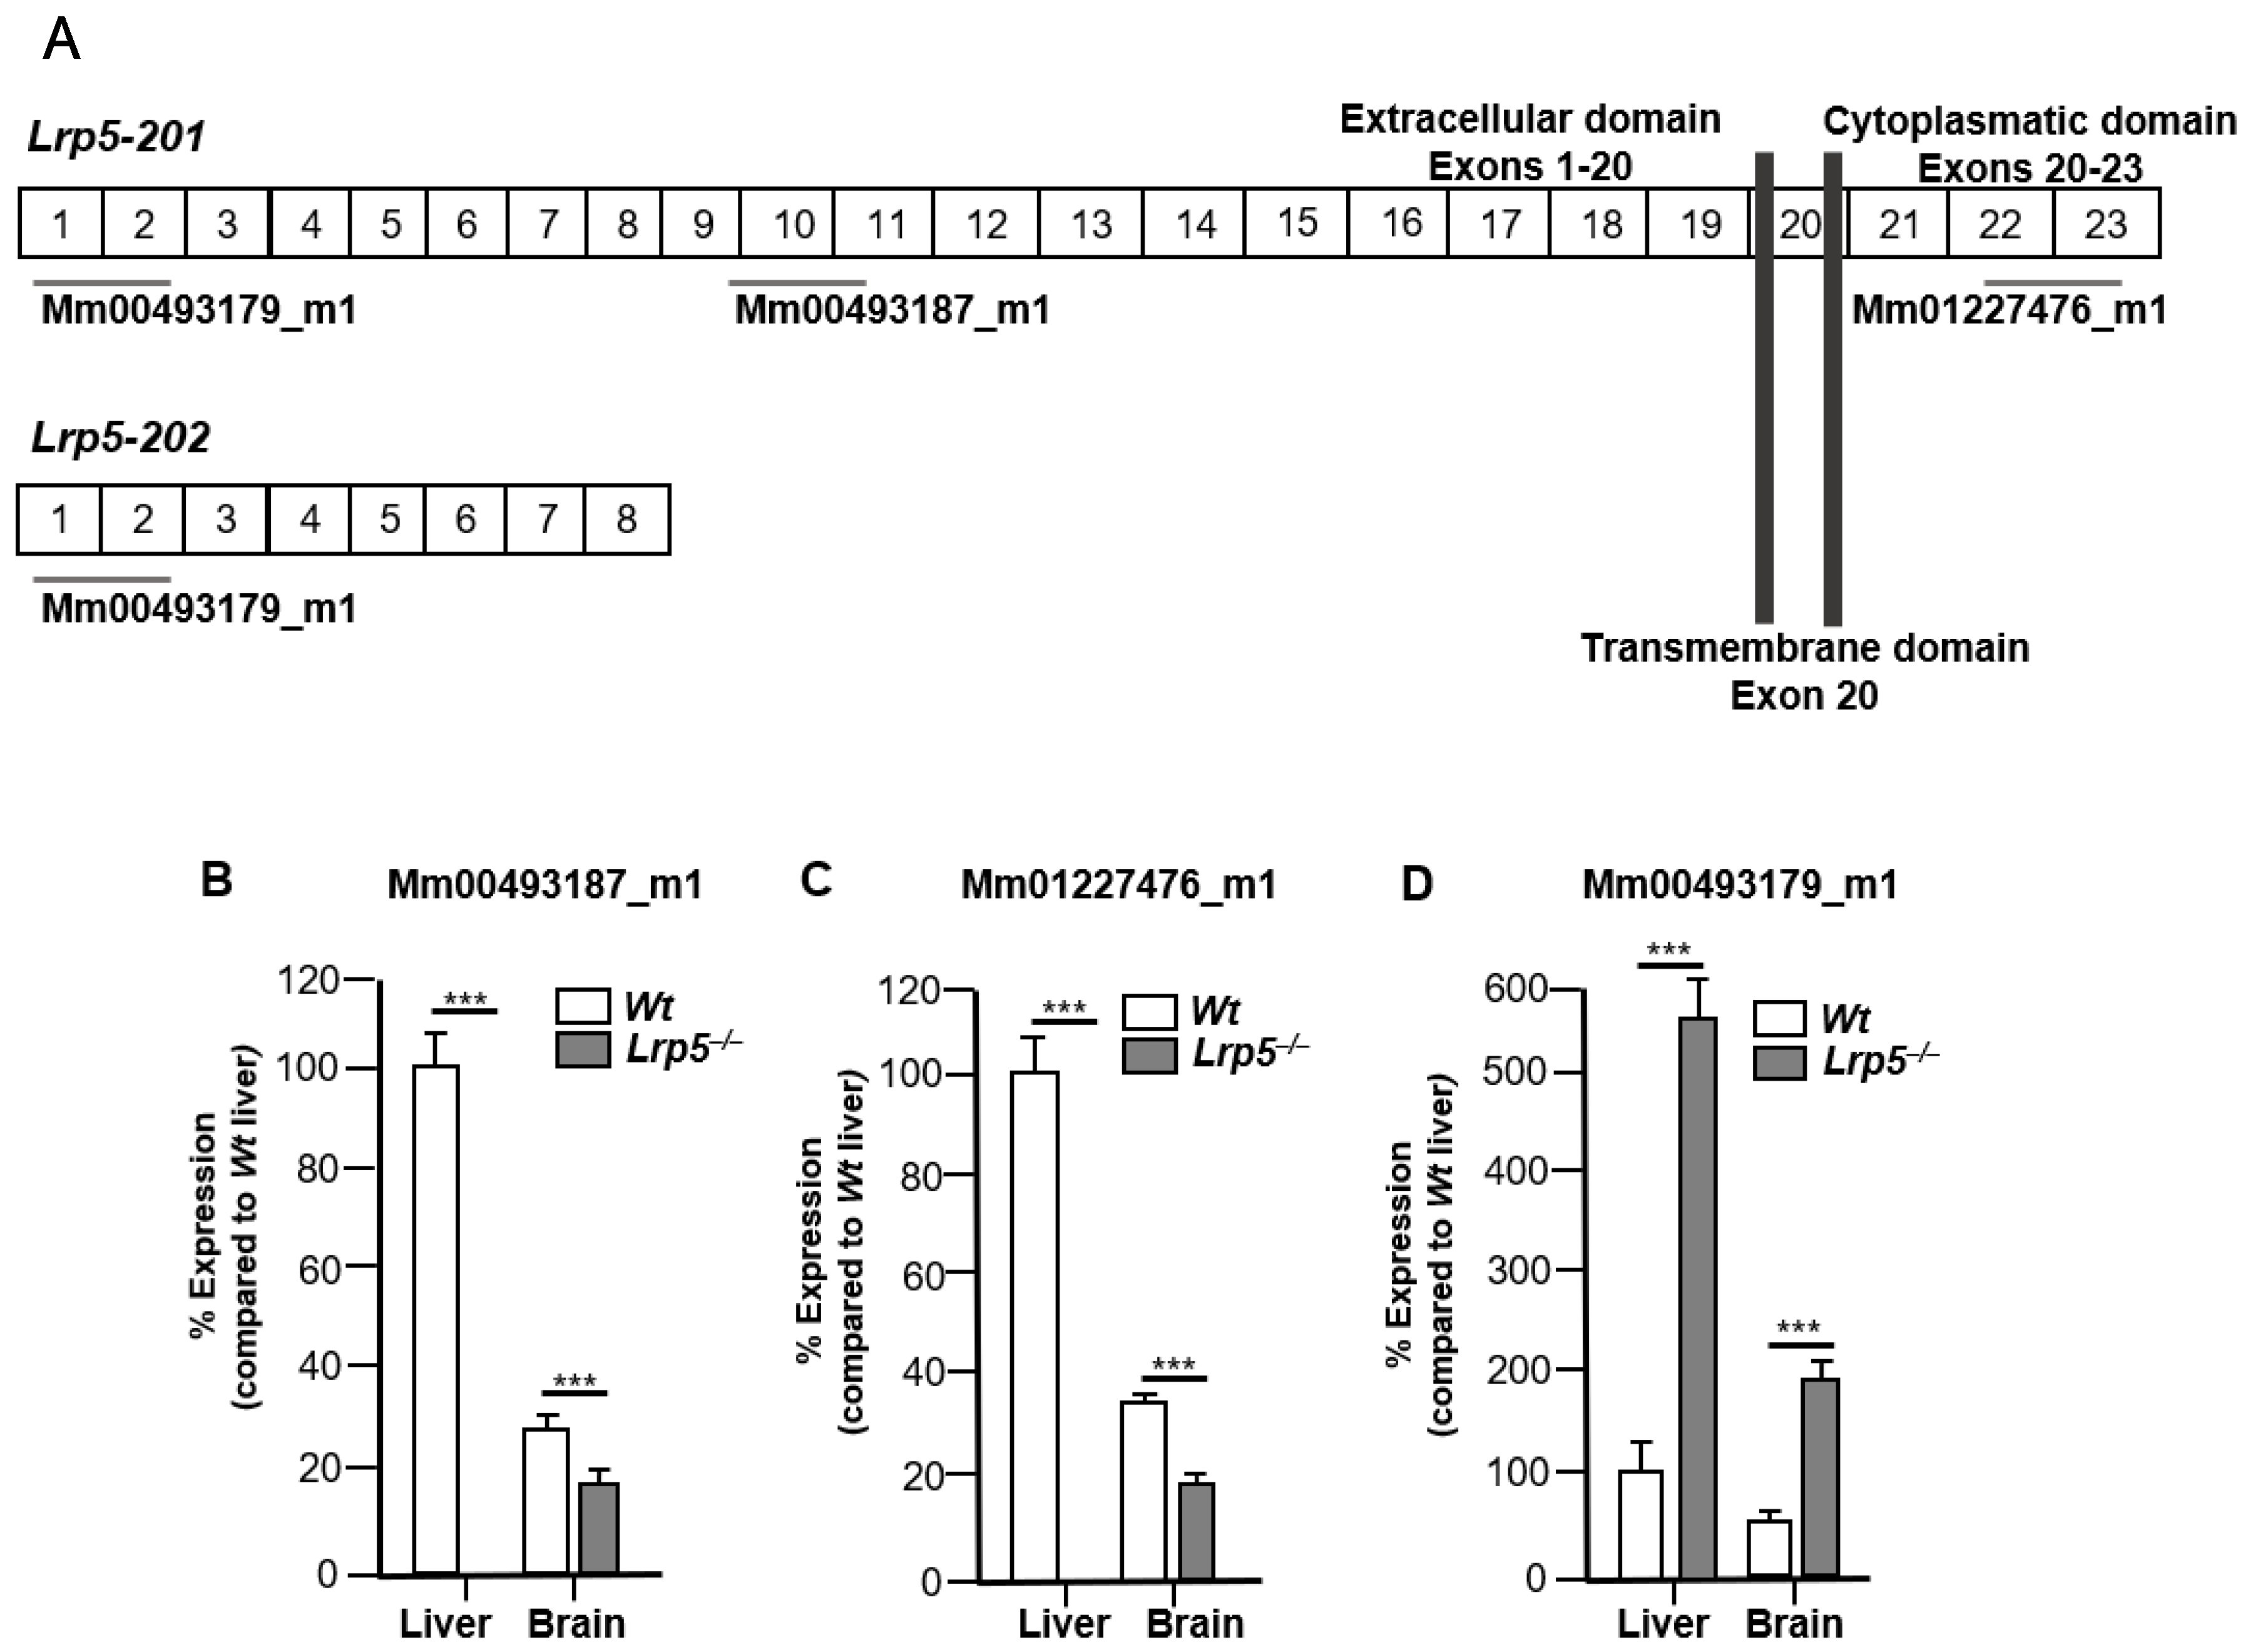
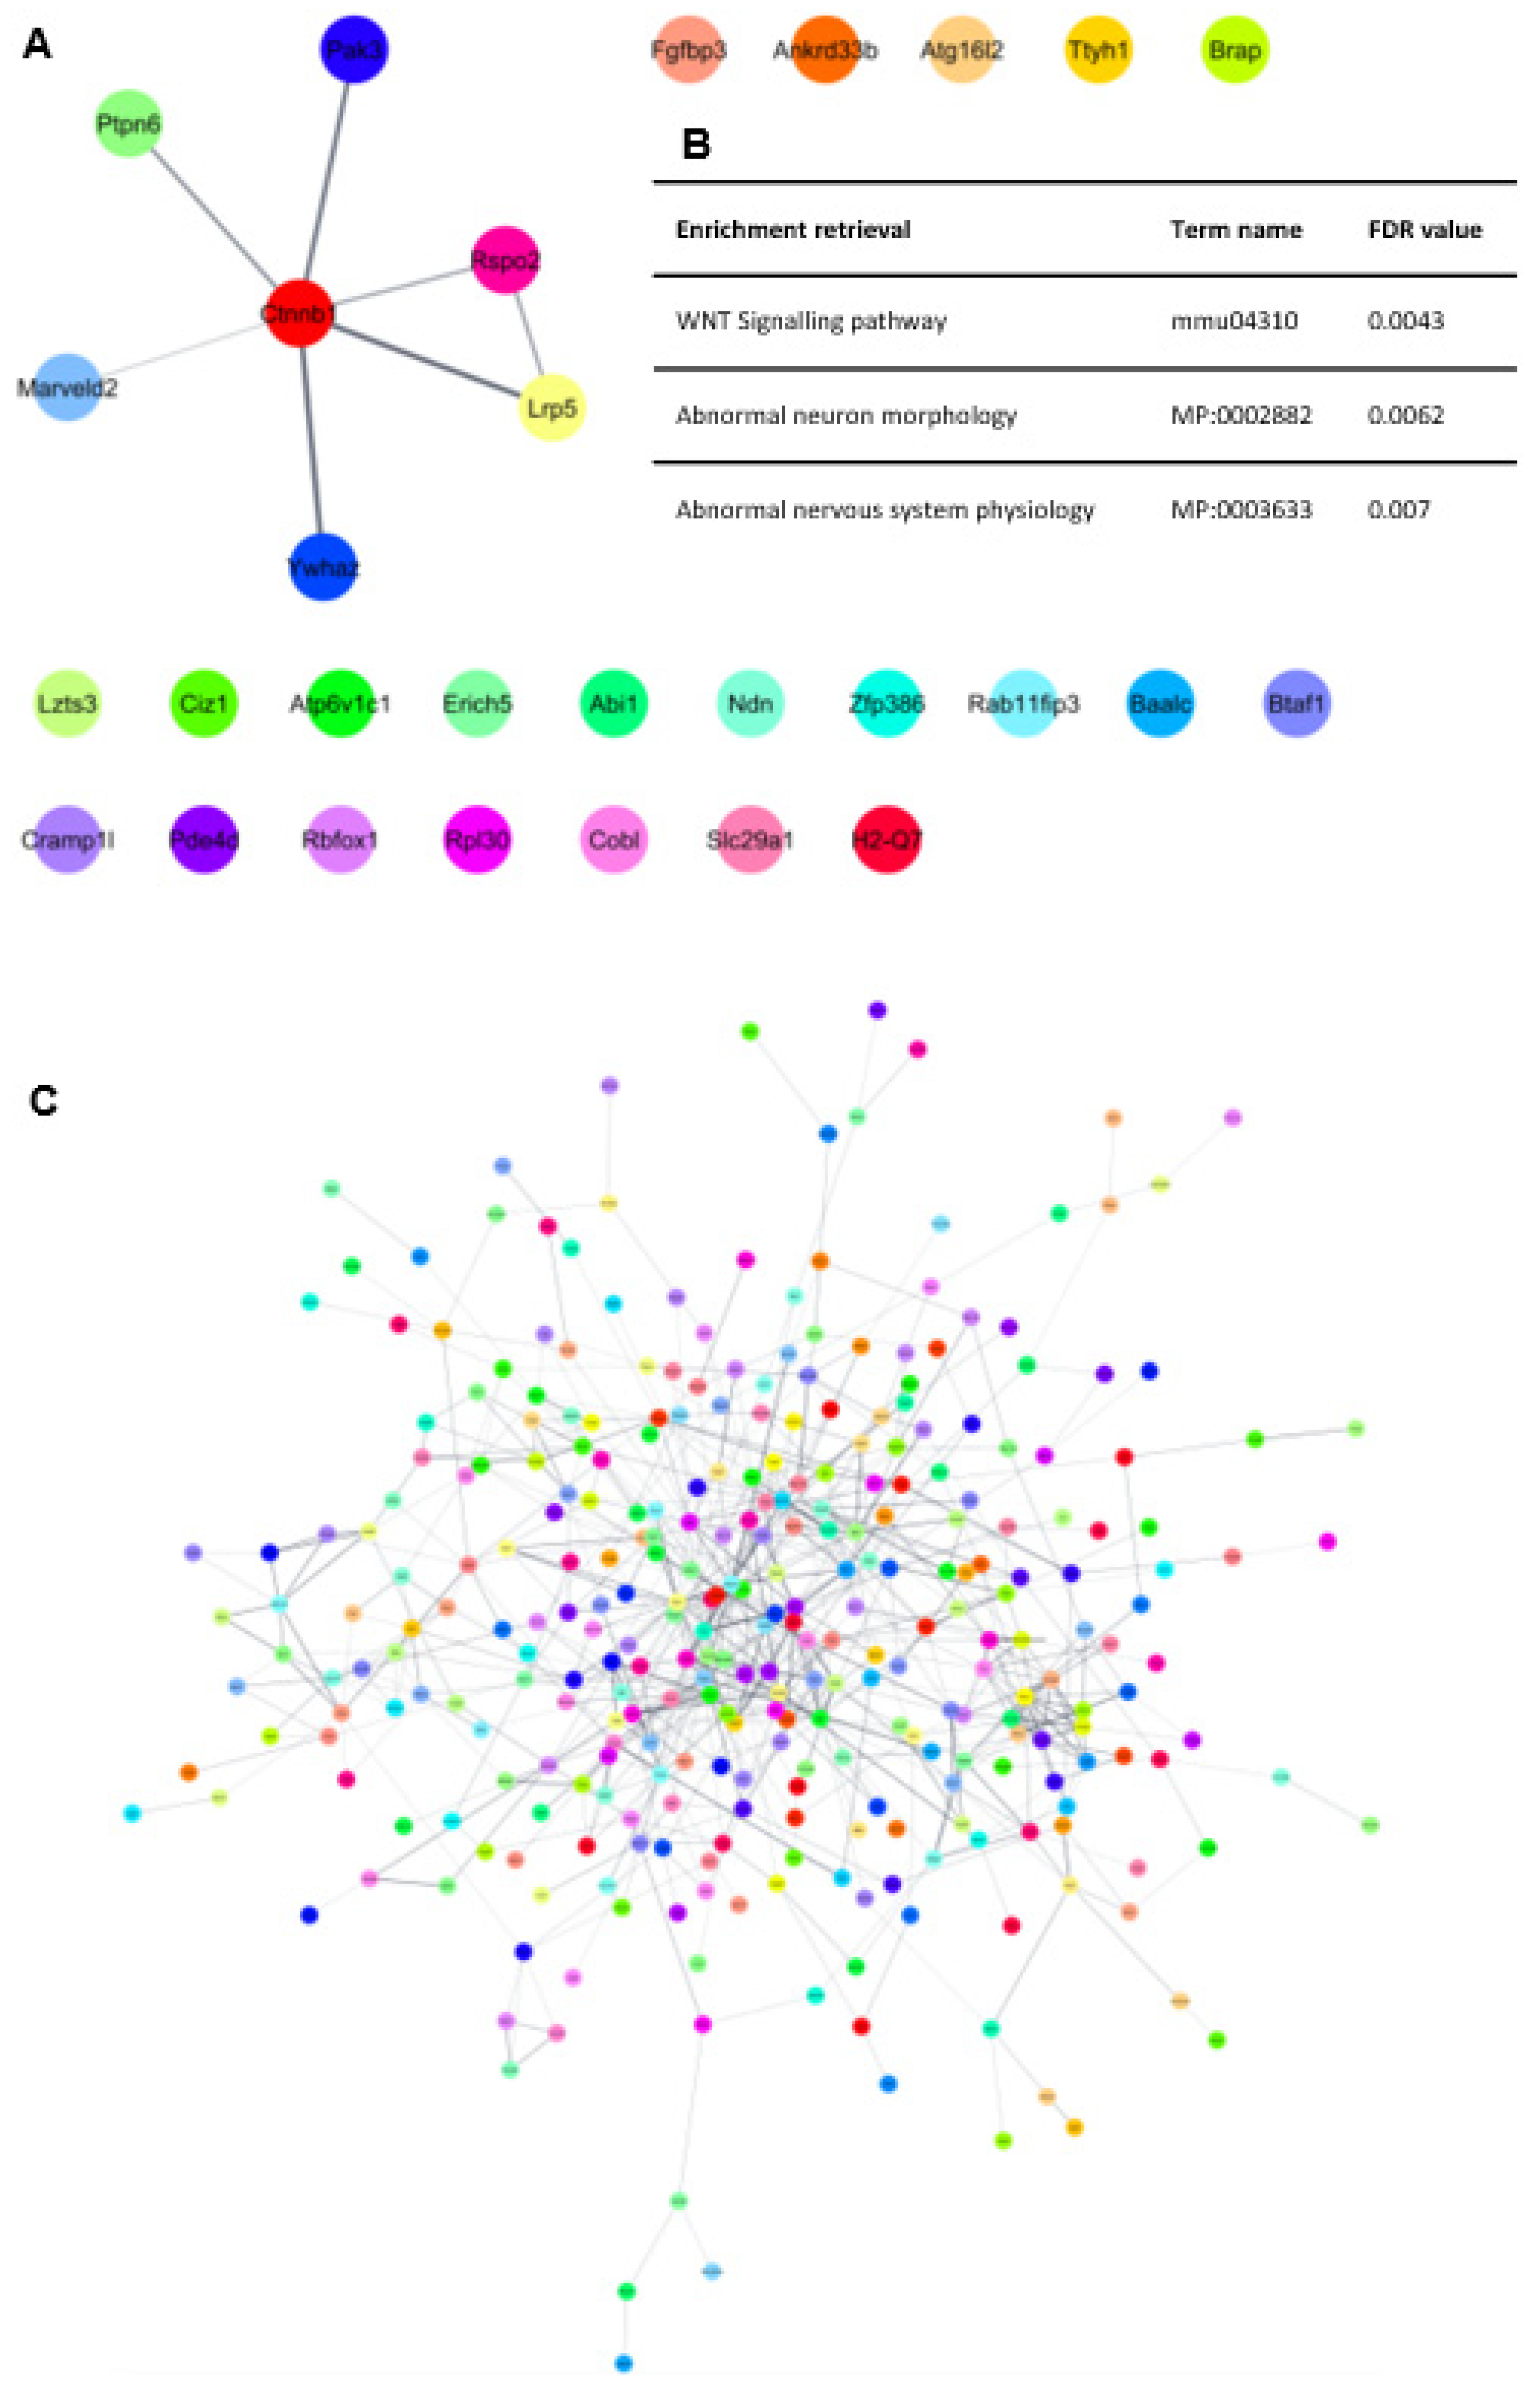
2.2. LRP5 Is Expressed in Brains of Lrp5−/− Mice

Two Lrp5 protein-coding transcripts were generated from the Lrp5 Mus musculus gene by alternative splicing according to the Ensembl database [29]. The Lrp5-201 transcript codes for the full-length LRP5 protein, containing exons 1 to 23. The Lrp5-202 transcript codes for a truncated protein containing exons 1 to 8; therefore, it codes for a short portion of the extracellular domain (Figure 2A).
We first studied Lrp5 gene expression in the brains and livers of Wt and Lrp5−/− mice. Organs were analysed with the LRP5 probe Mm_00493187, which detected exons 9–10–11. LRP5 gene expression was expected in the livers and brains of Wt mice, and no LRP5 gene expression was expected in the organs of Lrp5−/− mice. Surprisingly, low but consistent expression of LRP5 in the brains of Lrp5−/− mice was detected (Figure 2B). To further confirm this unexpected result, we used a second probe, Mm_01227476, which detected exons 22–23. Again, LRP5 expression was detected in the livers and brains of Wt mice and in the brains but not the livers of Lrp5−/− mice (Figure 2C). We then tested a third probe, Mm_00493179, which detected exons 1–2–3 and therefore detected both the full-length Lrp5-201 and the truncated Lrp5-202 transcript. The expression of LRP5 in the livers and brains of Lrp5−/− mice was greater than the expression in Wt mice, indicating that the Lrp5-202 transcript was expressed predominantly in the livers and brains of Lrp5−/− mice (Figure 2D). These results indicate that Lrp5 transcript expression is variable in different mouse tissues.

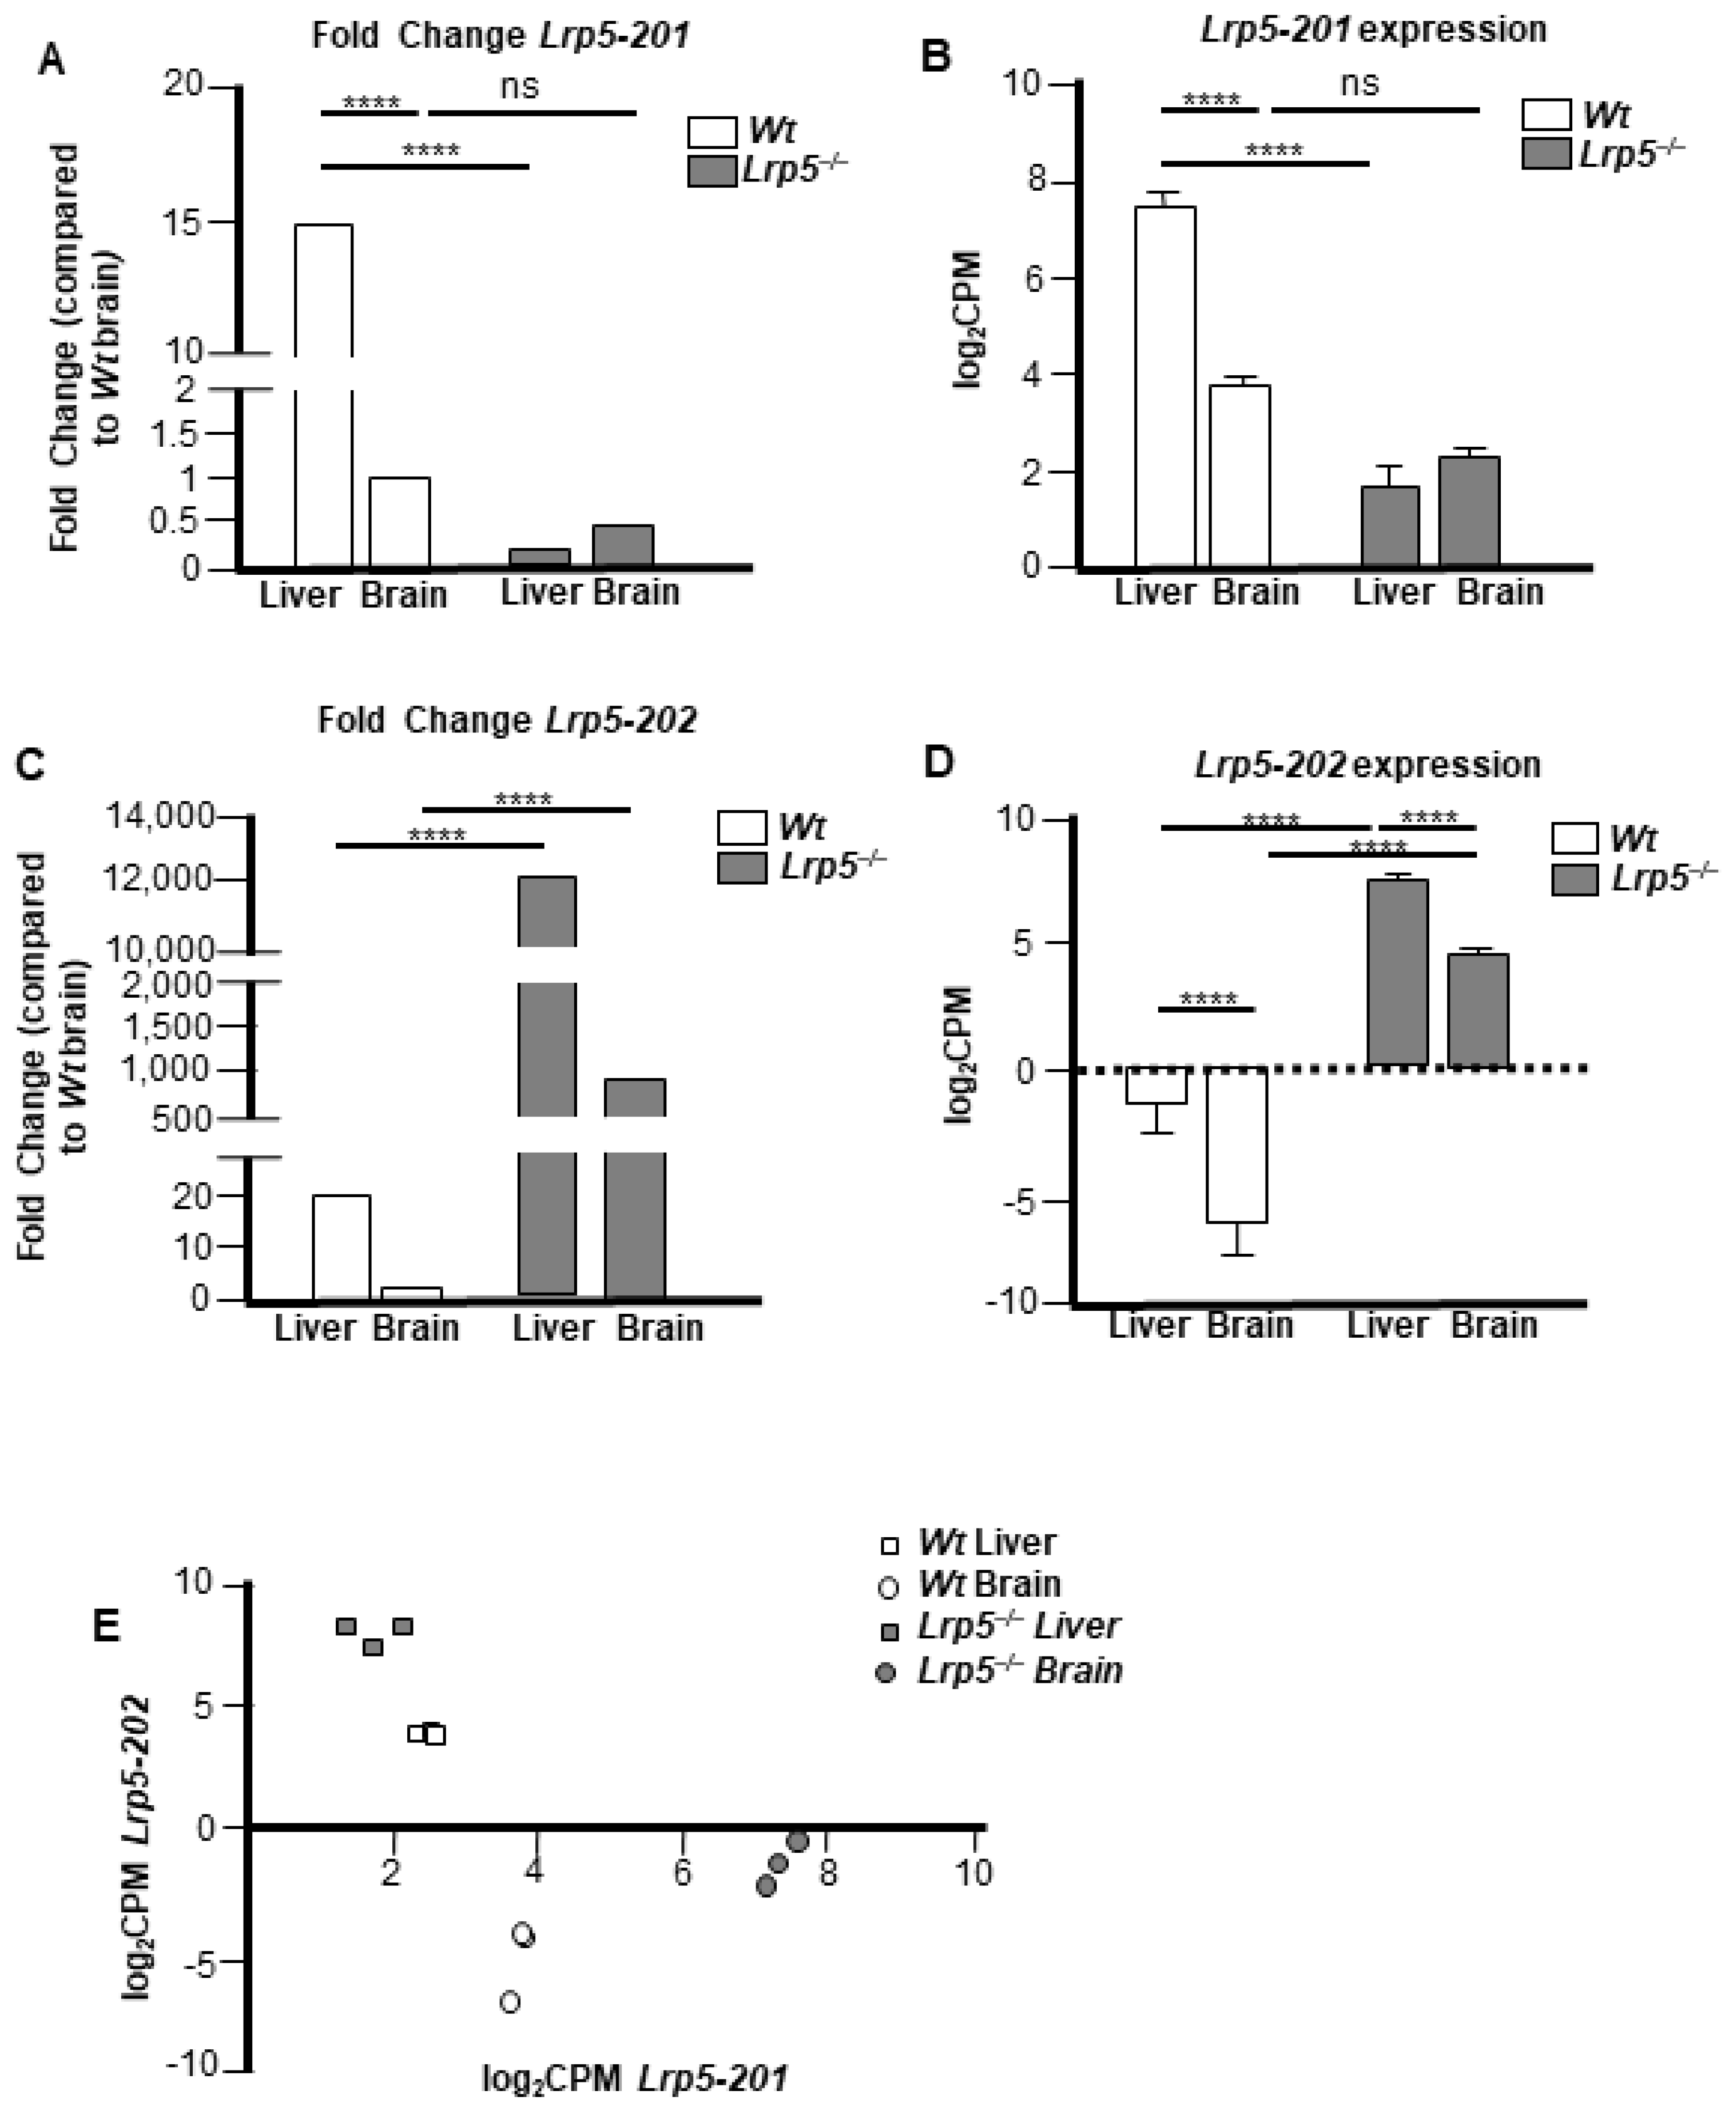
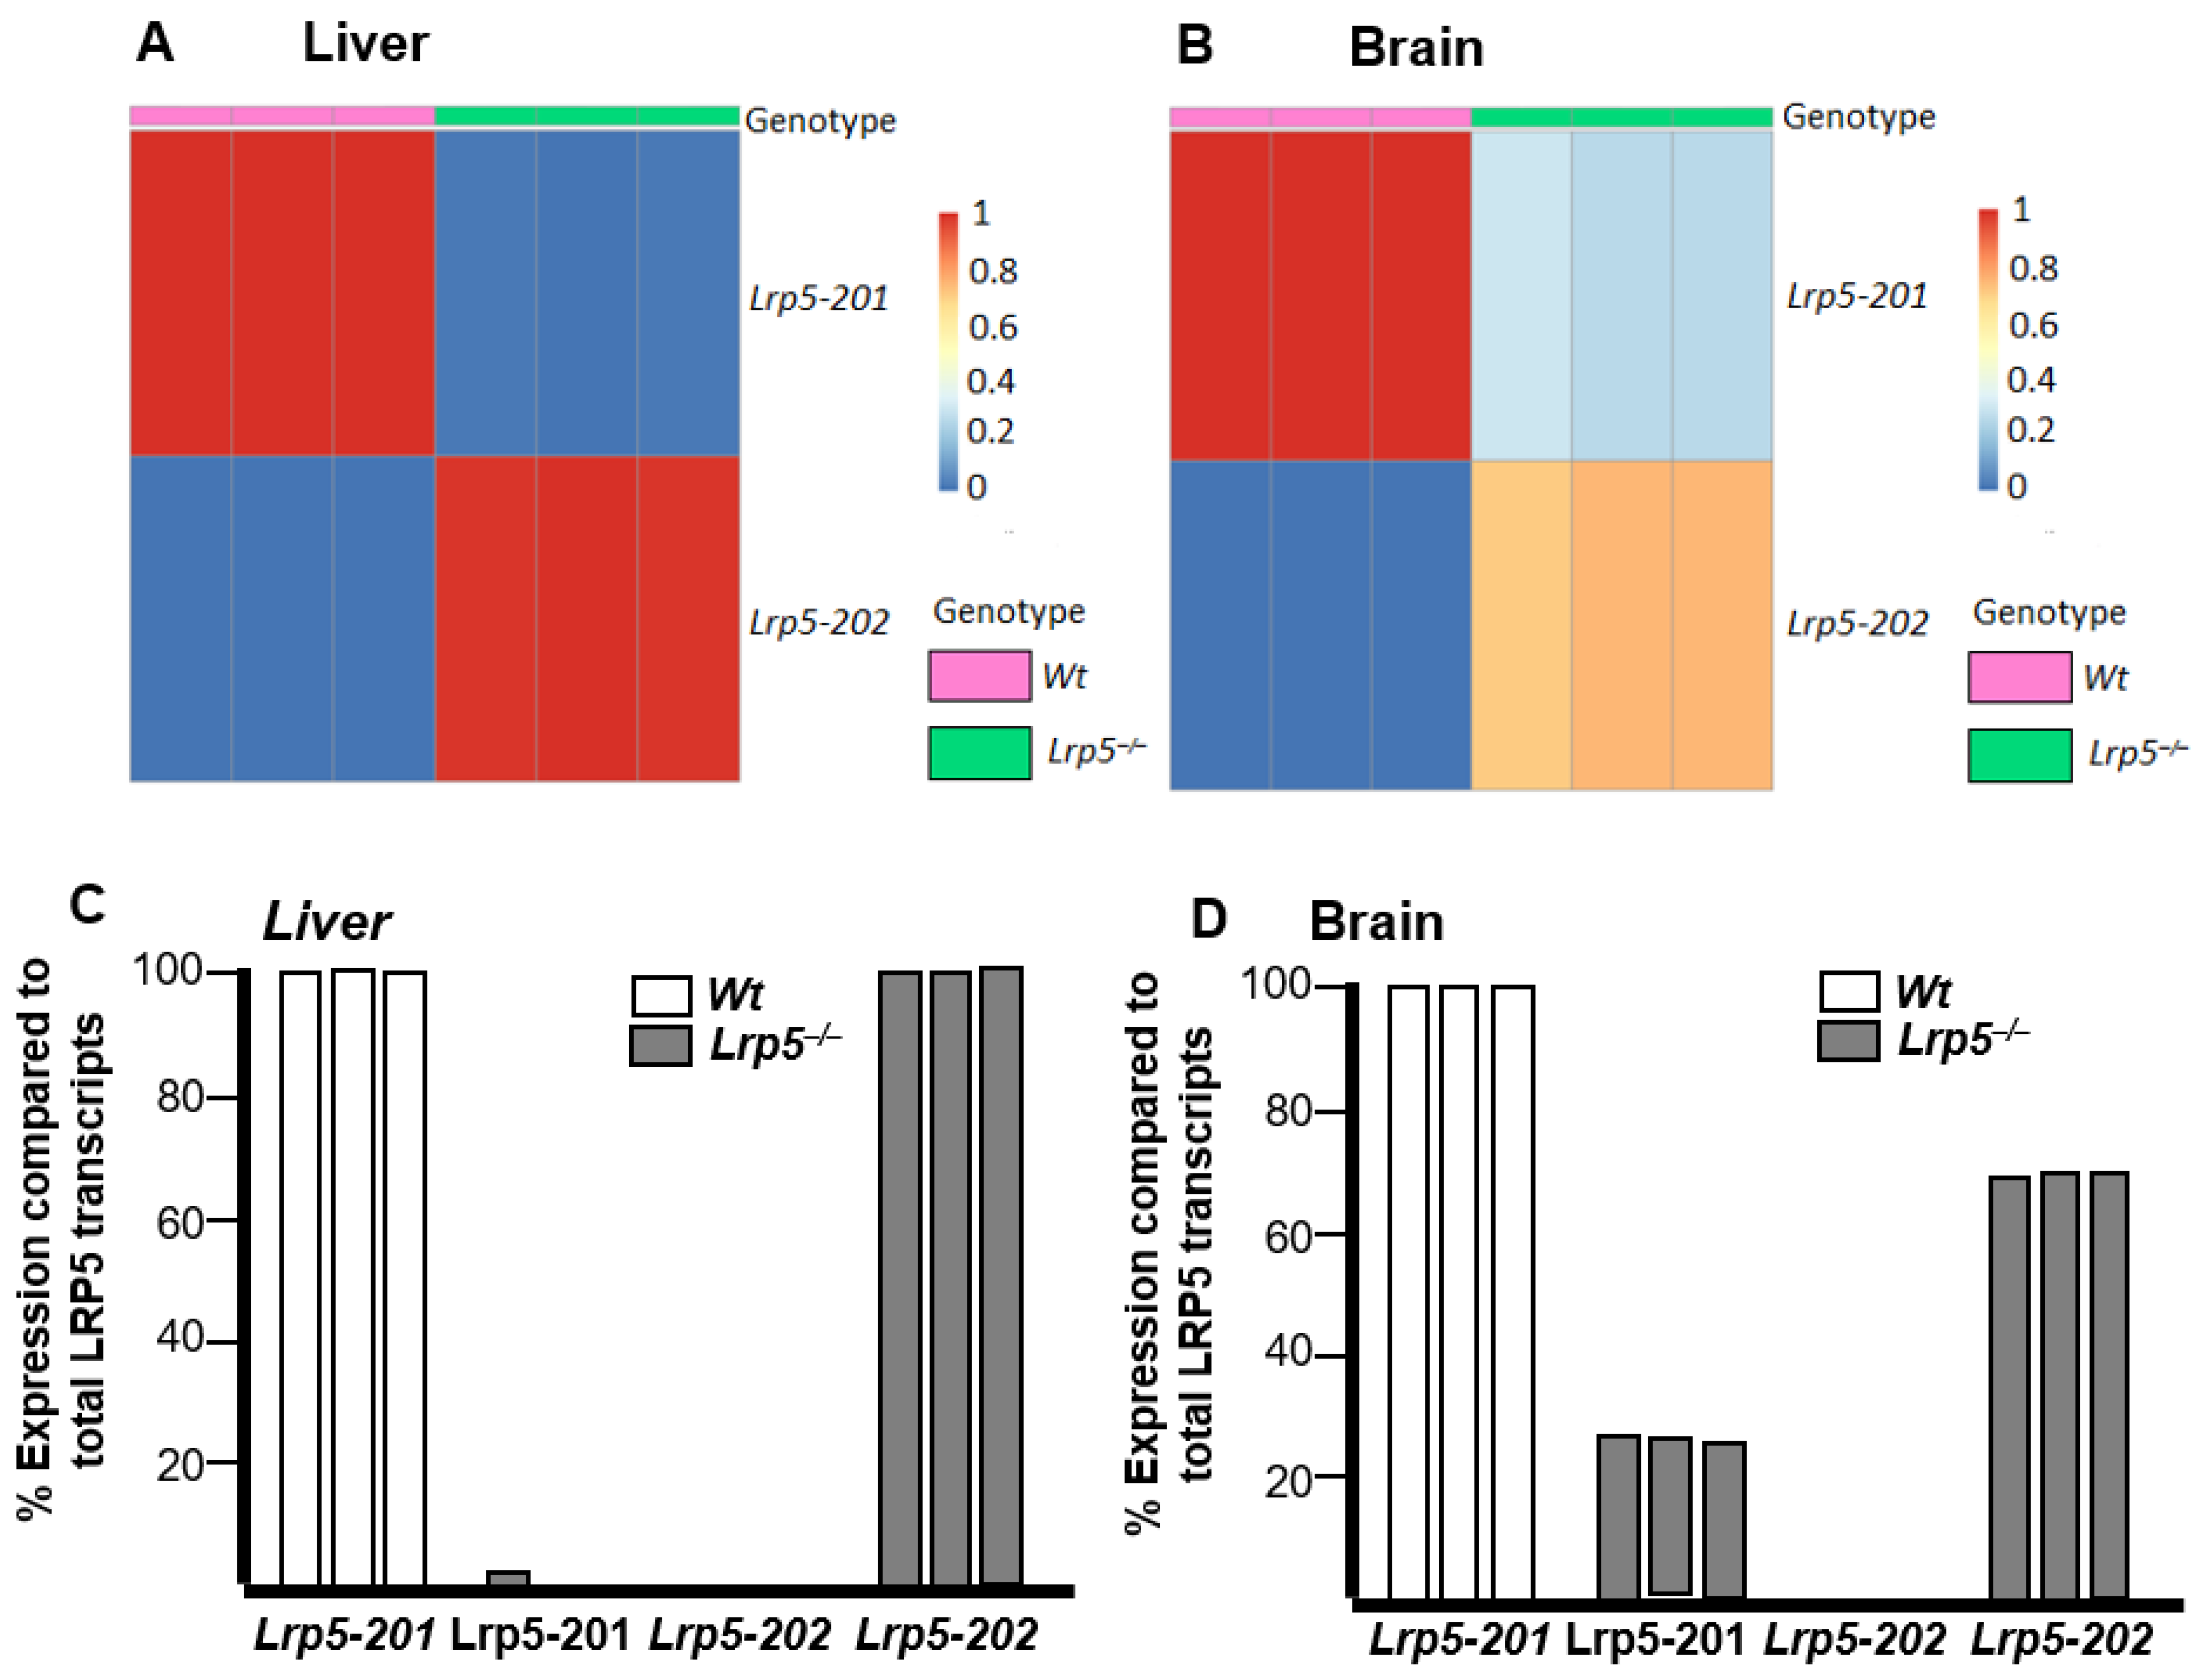
2.3. Lrp5 Transcriptome Is Different in Livers and Brains of Lrp5−/− Mice

To further understand differential Lrp5 gene expression in Lrp5−/− mouse organs, samples of livers and brains were analysed by whole-tissue RNA-seq analyses. Wt mice livers showed 15-fold increased Lrp5-201 expression compared to Wt mouse brain samples (Figure 3A), supporting the results from Figure 2B,C. Comparisons between Wt and Lrp5−/− mouse liver samples revealed that Wt mice had an approximated 100-fold increase in Lrp5-201 expression levels (Figure 3A,B). Contrarily, brain samples from Wt and Lrp5−/− animals did not show statistically significant differences in Lrp5-201 expression (Figure 3A,B).
Lrp5-202 expression was increased in the livers (450-fold) and brains (850-fold) of Lrp5−/− mice compared to Wt mice (Figure 3C,D). Similar to Lrp5-201, Lrp5-202 transcript expression was higher in the livers than that in the brains of Lrp5−/− mice (Figure 3D). These RNA-seq results confirm that the Lrp5-201 transcript is expressed in the brains of Lrp5−/− mice. More importantly, the RNA-seq analyses did not show statistical differences in Lrp5-201 expression in Wt or Lrp5−/− brain samples. The tissue expression of Lrp5-201 and Lrp5-202 using the log2CPM value in an XY axis indicated a similar Lrp5 transcript pattern expression for each sample of the same group (Figure 3E).

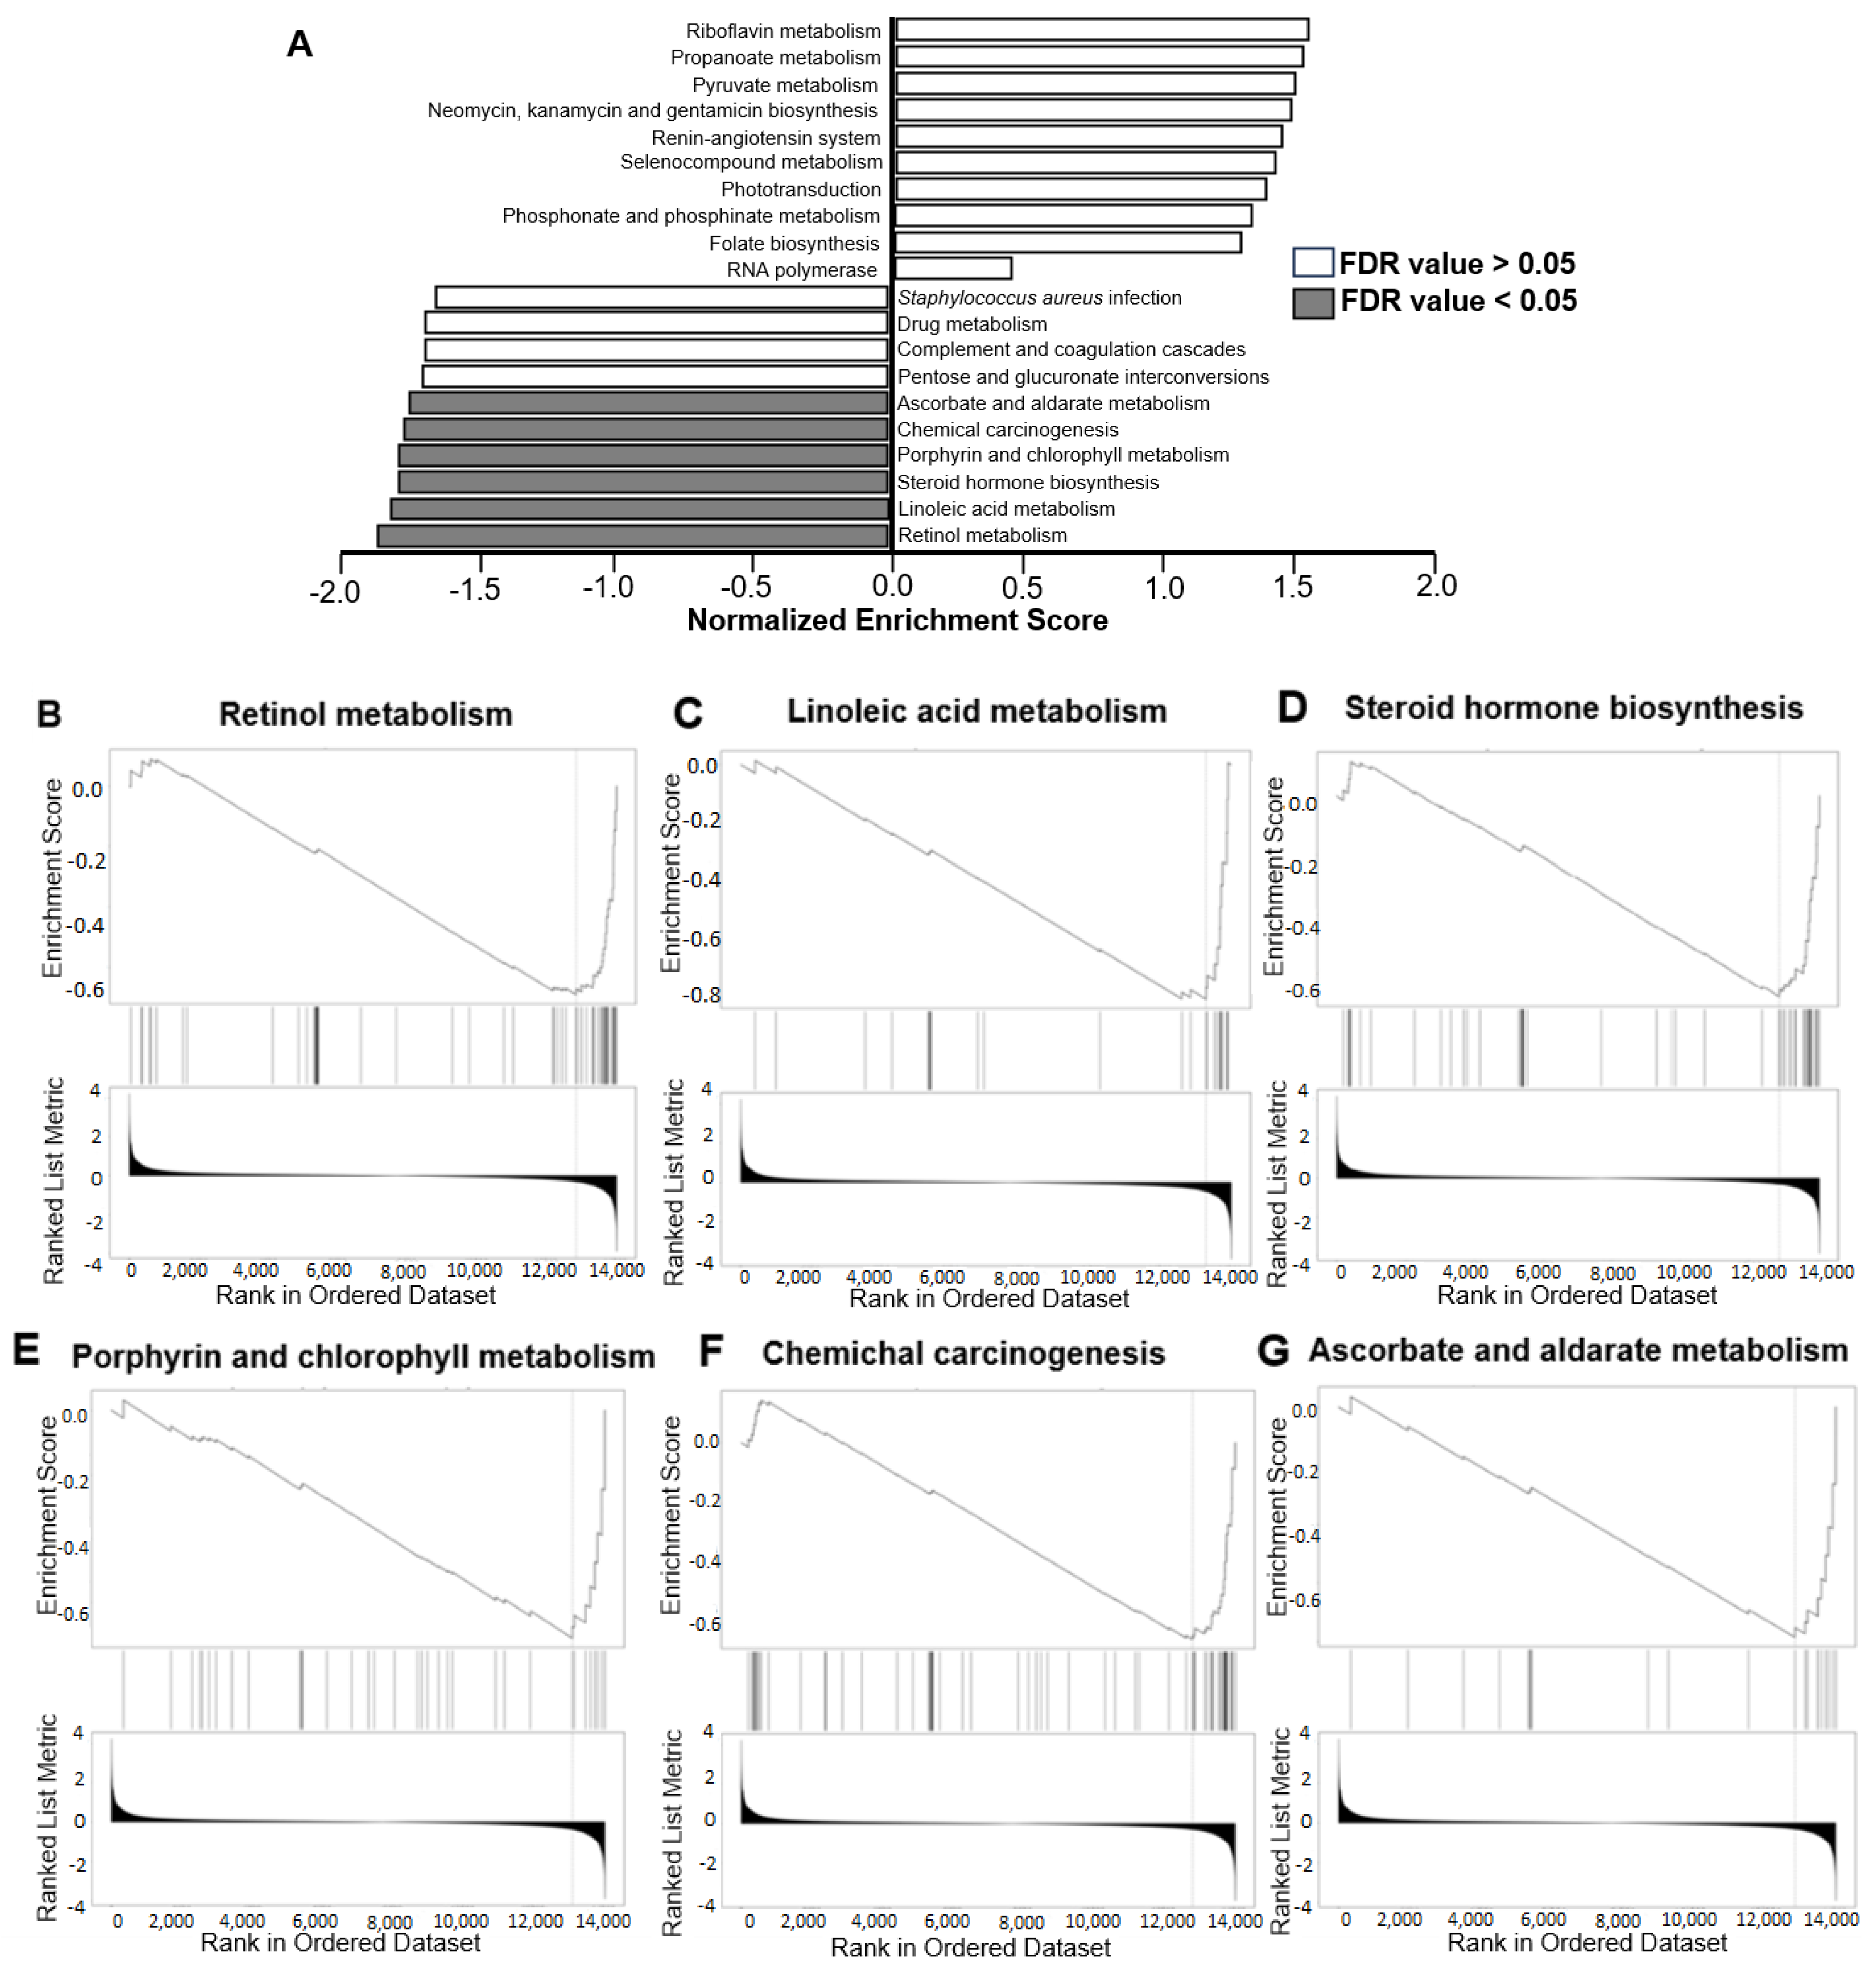
2.4. LRP5 Deficiency Leads to Alterations in the Transcriptome of Livers and Brains

To assess if LRP5 deficiency can modulate the expression of other genes, we compared gene expression in the livers of Wt and Lrp5−/− mice. The transcription factor encoded in transcript Mdfic-206, with other transcripts including non-protein coding Tcf2l7-213 or Gm12191-201 and the LRP5 truncated isoform Lrp5-202, were significantly reduced in the livers of Wt mice compared to the livers of Lrp5−/− mice, indicating that Lrp5-201 deficiency modifies the liver transcriptomic pattern (Figure 4A). Table 1 shows a list of the transcripts that were significantly modified in the livers of Lrp5−/− mice compared to Wt mice. When the brain samples of Wt and Lrp5−/− mice were analysed, the results showed increased expression of Lrp5-202 transcripts in the brains of Lrp5−/− animals. Other transcripts with modified expression in Lrp5−/− mouse brains compared to Wt mouse brains included protein-coding transcripts Rab11fip3-201, FGFbp3-201, or Rbfox1-202 (Figure 4B). Table 2 shows a list of the transcripts that were significantly modified in the brains of Lrp5−/− mice compared to Wt mice.

2.5. Lrp5 Quantity Is Different in Livers and Brains of Lrp5−/− Mice

The balance of the different Lrp5 transcripts in each tissue was then evaluated. Differential transcript usage (DTU) analysis showed that the livers and brains of Wt mice expressed only the Lrp5-201 transcript (Figure 5A,B). In Lrp5−/− mice, the liver’s Lrp5-201 transcript accounted for less than 2% of Lrp5 transcripts, whereas Lrp5-202 accounted for more than 98% (Figure 5C). However, in the brains of Lrp5−/− mice, Lrp5-201 accounted for 27% of Lrp5-encoding transcripts, whereas 73% were Lrp5-202 transcripts (Figure 5D).

2.6. Functional Studies Show Modified Functions in Brains of Lrp5−/− Mice

To study the effects of LRP5 deficiency on brain functionality, functional gene enrichment analysis was performed on RNA-seq data from the brains of Wt and Lrp5−/− mice, showing that LRP5 transcripts are associated with specific functions of the brain, including “Cell morphogenesis involved in neuron differentiation” and “Synapsis formation” (Table 3). Gene Set Enrichment Analysis (GSEA) showed that genes involved in retinol and linoleic acid metabolism are downregulated in the brains of Lrp5−/− mice compared to Wt mice (Figure 6A–C). Other pathways with downregulated gene expression in Lrp5−/− mouse brains are steroid hormone biosynthesis, porphyrin and chlorophyll metabolism, chemical carcinogenesis, and ascorbate and aldarate metabolism (Figure 6D–G).
Network analysis using Cytoscape software based on the STRING database showed that several genes with modified expression in Lrp5−/− mice not only participate in the WNT/β-catenin signalling pathway but are also involved in abnormal neuron morphology and abnormal central nervous system physiology (Figure 7A,B). All these findings suggest that dysregulation in the WNT/β-catenin pathway can be the cause for a deficient retinol acid and linoleic acid metabolism, which, in turn, can produce deficits in neuron differentiation and neuron synapsis formation.

2.7. Functional Studies Show Impaired Functions in Livers of Lrp5−/− Mice

Functional gene enrichment analysis on RNA-seq data from the livers of Wt and Lrp5−/− mice showed that over 300 liver functions were significantly modified in Lrp5−/− mice compared to Wt mice, including processes involving cellular and metabolic pathways (Table 4). Liver RNA-seq data were also subjected to network analysis, resulting in 319 proteins that had their expression modified in the livers of Lrp5−/− mice (Figure 7C). Furthermore, clustering of the network followed by functional gene enrichment analysis revealed that each group of closely interacting proteins are associated with specific modified functions (Supplementary Figure S1, Supplementary Table S1). Network analyses support that the livers of Lrp5−/− mice were more severely affected than their brains by the loss of Lrp5-201 expression as more functions were altered in their gene expression profiles.

3. Discussion

We analysed the breeding of our Lrp5−/− mice colony in the last 10 years and observed that, after mating heterozygous mice, Lrp5−/− mice were born less frequently than expected. Furthermore, the mating of heterozygous with knockout mice also showed reduced births of Lrp5−/− mice. This finding suggests that LRP5 expression might be essential for mouse embryonic development.
Lrp5-201 is not expressed in the peripheral tissues of Lrp5−/− mice, including the liver, aorta, heart, spleen, and jejunum [27], but it is expressed in their brains, showing a mosaic expression of the Lrp5-201 transcript in Lrp5−/− mice. Indeed, the protein expression pattern of full-length LRP5 resembles that of gene Lrp5-201. Interestingly, all Lrp5−/− mice showed similar Lrp5-201 expression in their brains, supporting a role for Lrp5-201 in survival. Lrp5−/− mice expressed significantly fewer Lrp5-201 transcripts than Wt mice in the brain. The insertion of the IRES-LacZ-Neomycin cassette at the end of exon 6 abrogated full-length LRP5 transcript formation; however, the brain splicing machinery could avoid the inserted sequence producing the Lrp5-201 transcript. The inserted cassette probably hampered the efficiency of the splicing process, as the immature Lrp5 transcript was mostly converted into an Lrp5-202 transcript.
Because LRP5 was not expressed in extracranial tissues in Lrp5−/− mice, LRP5 must not be required in the organogenesis of extracranial organs. However, LRP5 is active after hypercholesterolemia or ischemia [3,26,30,31], indicating that particular RNA splicing in the Lrp5 transcript must occur exclusively in the brains of Lrp5−/− mice to generate an Lrp5 transcript similar to full-length Lrp5-201 that can generate a functional protein.
Lrp5-202 expression in the livers of Lrp5−/− mice was higher than that of Lrp5-201 in the livers of Wt mice. This indicates that a lack of Lrp5-201 induces the synthesis of high levels of Lrp5-202 truncated transcripts in an attempt, probably, to counterbalance the loss of LRP5 function.
Similarly, reduced expression of Lrp5-201 transcripts in the brains of Lrp5−/− mice led to the overexpression of Lrp5-202. This could be explained because of an insufficient quantity of full-length LRP5 proteins being produced by the Lrp5-201 transcript or that the full-length LRP5 protein encoded by the Lrp5-201 transcript could not reproduce LRP5’s normal functions. We hypothesise that only those embryos that showed brain Lrp5-201 transcript expression were viable. We showed that Lrp5−/− mice had similar brain expression of Lrp5-201 transcripts (Figure 5B), further supporting that mouse embryos that do not express more than 25% of Lrp5-201 transcripts are not viable and probably die during the early gestation stages.
RNA-seq analysis revealed differential expression of Lrp5-201 and Lrp5-202 transcripts in the livers and brains of Wt mice compared to their Lrp5−/− littermates. Lrp5−/− mouse brains showed modified expression of 48 mature RNAs, 35 of which were protein coding mRNAs. In contrast, Lrp5−/− mouse livers showed modified expression of 546 transcripts, 488 of them being protein-coding mRNAs. This finding suggests that, by the preservation of full-length LRP5 expression, the brain transcriptome is less modified than the liver transcriptome, which shows a complete loss of LRP5 expression and function. This finding is further confirmed by the network in silico analysis, in which brain altered transcripts needed at least the β-catenin node addition to generate a minimum network of interacting proteins. Hence, this finding supports our hypothesis that, in Lrp5−/− mice, there is expression of fully active LRP5 and that the LRP5 brain’s expression must be preserved to ensure survival. Of note, we believe that the generation of Lrp5-201 transcripts in Lrp5−/− mouse brains is not an efficient process, as most of the LRP5 transcripts synthesised were Lrp5-202 transcripts. Hence, in order to have enough functional LRP5 in the brains of Lrp5−/− mice, vast quantities of Lrp5-202 transcripts were synthesised as a by-product.
Liver altered transcripts generated a huge network with hundreds of interacting proteins. Further clustering of liver genes followed by functional gene enrichment analysis showed that multiple functions were dysregulated in the livers of Lrp5−/−. These functions comprise essential cellular metabolic pathways, including regulation of transcription, control of mRNA splicing, catabolism, autophagy, and others.
Functional gene enrichment analysis in Wt and Lrp5−/− mouse brains revealed that different genes are involved in the same cellular functions. Also, the proteins can be grouped and associated with different pathways, including neuronal differentiation and synapsis formation. Therefore, downregulation of these pathways could explain the low number of Lrp5−/− mouse births. Furthermore, if full-length Lrp5-201 expression was completely abolished from Lrp5−/− mouse brains, increased modified gene transcripts (similar to the liver samples) would be expected.
GSEA revealed significant downregulation of genes associated with retinol, linoleic acid, and other biosynthetic pathways in the brains of Lrp5−/− mice. A deficit in retinol acid metabolism is associated with impaired neuronal plasticity and defects in the development of the central nervous system, as retinoic acid has very specific effects on neuronal differentiation [32,33,34,35]. Linoleic acid and derivates have also been involved in mouse reflex maturation and memory improvement [36], and elevated linoleic acid concentrations in the blood can lead to mouse brain malfunction and inflammation [37]. Our findings show downregulation of the retinol and linoleic acid pathways in the brains of Lrp5−/− mice, suggesting that a reduction in the expression of full-length LRP5 causes deficits in neuronal differentiation and synapsis formation.
Full-length LRP5 is transported to the cell membrane in endosomal bodies from the endoplasmic reticulum [38]. LRP5’s transmembrane domain allows the receptor’s insertion into the plasma membrane. An artificial dominant-negative soluble form of LRP5 lacking the transmembrane and cytoplasmatic domains has been used as a WNT/β-catenin pathway inhibitor. Soluble LRP5 contains the full extracellular protein sequence (exons 1–19) and shows LRP5 antagonist properties preventing WNT ligands from binding full-length LRP5, suppressing the expression of tumorigenic and metastatic proteins and inducing an epithelial to mesenchymal transition in Saos-2 cells [39]. Soluble LRP5 also reduces 143B cell tumour growth in nude mice [40]. The Lrp5-202 transcript encodes for a protein containing only a fraction of the extracellular domain (exons 1–6), opening the possibility that it can also act as a WNT pathway repressor; however, functional studies are needed to determine the possible roles for this isoform. To the best of our knowledge, no protein similar to that encoded by the Lrp5-202 transcript has been described.
This study highlights the importance of LRP5 expression in the brain. We observed fewer births of mice with a Lrp5−/− genotype as opposed to a Wt genotype and were able to demonstrate that mice unable to express full-length LRP5 in the brain die during embryonic stages. Furthermore, we showed a protective mechanism that involves the alternative splicing of Lrp5 transcripts to avoid a premature stop codon and generate a full-length Lrp5 transcript in mouse brains, suggesting a role for LRP5 in the preservation of brain function during development. Finally, Gene Set Enrichment Analysis highlighted the downregulated expression of genes involved in retinol and linoleic acid metabolism in Lrp5−/− mouse brains, supporting that the expression of LRP5 in the brain is needed for the correct synthesis of vitamins and fatty acids, and it indispensable for correct brain development.

4. Materials and Methods

4.1. Animal Models and Experimental Design

Genes and proteins from mouse and human samples are written in accordance with the guidelines from the ‘‘International Committee on Standardized Genetic Nomenclature for Mice and the Rat Genome’’, 2010. Briefly, mouse genes and transcripts are written in italics (Lrp5), human genes are written in italics and capital block letters (LRP5) and proteins from the two species are written in straight capital block letters (LRP5) [41].
The study protocols for mice were approved by the institutional Animal Care and Use Committee (ICCC051/5422) and authorised by the local government commission. Animal procedures conformed to guidelines published in directive 2010/63/EU of the European Parliament and the “Position of the American Heart Association on Research Animal use” (11 November 1984). At the research institute, we are committed to the “3R”s principle, using the minimum number of animals required to accomplish statistical significance.
Lrp5−/− mice were a kind gift from Dr. Bart Williams [42]. Mouse strains were maintained in a C57bl/6J genetic background. Animals were housed in cages under controlled monitoring of temperature (21 ± 2 °C) on a 12 h light/dark cycle with food and water ad libitum. Genotyping was performed on mice 4 weeks after birth using PCR amplification from DNA extracted from tail biopsies, resulting in the identification of Wt, Lrp5−/+, or Lrp5−/− mouse genotypes. Heterozygous Lrp5−/+ mice were discarded for this work. Adult animals were sacrificed at 16–18 weeks old after terminal anaesthesia (ketamine/medetomidine, 75 mg/kg and 1 mg/kg, respectively, i.p.). Mouse organs were collected, washed extensively in sterile saline, and frozen immediately in liquid nitrogen.

4.2. RNA Isolation and Real-Time PCR

Frozen mouse tissue samples from livers and brains were smashed to dust using mortar and liquid nitrogen. Pulverised tissues were processed for RNA extraction using RNEasy Kit from Qiagen (Qiagen, Hilden, Germany). Total RNA concentration and purity were determined using a Nanodrop ND-1000 Spectrophotometer (Nanodrop Technologies, Inc., Wilmington, DE, USA). For purity standards, only samples in which A260/A280 ratios were between 1.8 and 2.1 were considered acceptable. cDNA synthesis was performed using 1 µg RNA and cDNA reverse-transcription kit (Applied Biosystems, Foster City, CA, USA). The generated cDNA was amplified by real-time polymerase chain reaction in a 7900HT Fast Real-Time PCR System (Applied Biosystems, Foster City, CA, USA) using probes from Applied Biosystems. Different LRP5 probes were used to detect different regions of the transcript: for exons 1–2, probe Mm00493179_m1 was used; for exons 9–10–11, probe Mm00493187_m1 was used; and for exons 22–23, probe Mm01227476_m1 was used (ThermoFisher, Waltham, MA, USA). Results were normalised against r18s mRNA expression, which was measured using a specific r18s probe from Applied Biosystems.

4.3. RNA-Seq Analysis

RNA was isolated from Wt or Lrp5−/− mouse brain and liver samples using the RNAEasy extraction kit from Qiagen. RNA samples were sent to “Centro Nacional de Análisis Genómico” (CNAG) for RNA sequencing and analysis. RNA purity was checked by A260/A280 and A260/A230 ratios, and only RNA with ratios between 1.8 and 2.1 was used for this analysis. RNA integrity was further analysed by Bioanalyzer 2100 (Agilent Tech, Santa Clara, CA, USA) using an Agilent RNA nano 6000 kit (Agilent Tech, Santa Clara, CA, USA), and only RNAs with an RNA Integrity Number >8 were accepted. RNA-seq reads were trimmed with TrimGalore (version 0.6.10, 2 Feb 2023) [43] and mapped against the Mus musculus reference genome (GRCm39) with STAR/2.7.8a [44] using ENCODE parameters. Genes and isoforms were quantified with RSEM/1.3.0 [45] with default parameters using the gencode.M32 annotation. Differential expression was performed with the R Package limma-voom (https://bioconductor.org/packages/release/bioc/html/limma.html (accessed on 15 May 2024)) [46], and differential transcript usage was determined with the DTUrtle R Package (https://tobitekath.github.io/DTUrtle/ (accessed on 15 May 2024)) [47].

4.4. In Silico Systems Biology Analysis

Data from the RNA-seq analysis of differentially expressed genes were imported into Cytoscape 3.10.0 to build a protein–protein interaction (PPI) network based on STRING database interaction data. The confidence cut-off value was set to 0.4. An additional node was added to the brain network to generate a minimal network of interacting proteins. To generate the networks, only protein-coding transcripts that showed altered expression between tissues from animals of different genotypes in the RNA-seq analysis were included for this study. In order to identify protein–protein interaction clusters, the community cluster strategy GLay algorithm was used. Functional enrichment was performed with g:profiler [48] using as input a list of differentially expressed genes.
Gene Set Enrichment Analysis (GSEA) was performed using WebGestalt: update 2013 (Web-based Gene Set Analysis Toolkit) [49], and the “Geneontology” functional database was selected for the analysis. The top 10 most significant categories are shown in the results. Significance was considered for FDR values < 0.05. For GSEA, we used log2FC values, comparing the transcript expression of Lrp5−/− brain samples against Wt brain samples to rank genes.

4.5. Statistical Analysis

Experimental data were expressed as mean ± S.E.M. To assess alterations in the frequency of the genotypes of the different born mice, the chi-squared goodness-of-fit test was used. To establish significance, data were subjected to a one-way ANOVA followed by Bonferroni’s multiple-comparisons test using GraphPad Prism software statistical package 10 (GraphPad Software, San Diego, CA, USA). The criterion for significance was set as a p value ≤ 0.05.

5. Conclusions

We describe for the first time that LRP5 pre-mRNA undergoes differential splicing during mRNA maturation and that this splicing is tissue-dependent. Lrp5−/− mice that are unable to generate brain full-length LRP5 cannot develop during the embryonic stages, explaining the unbalanced Mendelian pattern observed at birth. Our results support that LRP5’s brain expression is needed for the correct synthesis of vitamins and fatty acids, and subsequently, it is indispensable for normal brain development.

Supplementary Materials

The supporting information can be downloaded at https://www.mdpi.com/article/10.3390/ijms25126763/s1.

Author Contributions

Conceptualisation, A.L. and M.B.-P.; methodology, A.L.; software, A.L. and N.P.; validation, G.V., L.B. and M.B.-P.; formal analysis, A.L. and M.B.-P.; investigation, A.L., N.P. and M.B.-P.; resources, G.V., L.B. and M.B.-P.; data curation, A.L., N.P. and M.B.-P.; writing—original draft preparation, A.L. and M.B.-P.; writing—review and editing, G.V. and M.B.-P.; visualisation, L.B. and M.B.-P.; supervision, M.B.-P.; project administration, L.B. and M.B.-P.; funding acquisition, G.V., L.B. and M.B.-P. All authors have read and agreed to the published version of the manuscript.

Funding

This work was supported by the Spanish Ministry of Economy and Competitiveness of Science “Agencia Estatal de Investigación (AEI)” Proj. Ref. AEI/10.13039/501100011033-[PID2019-107160RB-I00]; Project PMP22/00108 to LB cofounded by FEDER “Una Manera de Hacer Europa”; the Institute of Health Carlos III (ISCIII) CIBERCV-CB16/11/00411 and ERA-CVD JTC 202-023/AC 209-00054 to LB and PI23-00589 to MBP; Red RICORS TERAV-RD21/0017/0013 to LB; FEC 2022 to MBP and Marato de TV3 202304-10 to MBP. AL is a predoctoral fellow (PRE2020-096422) associated to LB’s grant PID2019-107160RB-I00. NP is part of the INVESTIGO-Program of the Spanish Ministery of Science.

Institutional Review Board Statement

The study protocol was conducted in conformity with the Public Health Service (PHS) Policy on Humane Care and Use of Laboratory Animals and was approved by the local institutional animal research committee (ICCC051/5422 date 11 March 2021).

Informed Consent Statement

Not applicable.

Data Availability Statement

The data that support the findings of this study are available from the corresponding author (MBP) upon reasonable request.

Acknowledgments

We thank S. Huertas for excellent technical assistance. We also thank A. Esteve and the CNAG team for assistance with the RNA-seq analysis.

Conflicts of Interest

Badimon L. declares to have acted as an SAB member of Sanofi, Novo Nordisk, Ionis, and IAF. Badimon L. and Vilahur G. are co-founders of the spin-off Ivestatin Therapeutics SL (unrelated to this work). The remaining authors have nothing to disclose.

References

  1. Bhanot, P.; Brink, M.; Samos, C.H.; Hsieh, J.C.; Wang, Y.; Macke, J.P.; Andrew, D.; Nathans, J.N.R. A new member of the frizzled family from Drosophila functions as a Wingless receptor. Nature 1996, 382, 225–230. [Google Scholar] [CrossRef] [PubMed]
  2. Yang-Snyder, J.; Miller, J.R.; Brown, J.D.; Lai, C.J.; Moon, R.T. A frizzled homolog functions in a vertebrate Wnt signaling pathway. Curr. Biol. 1996, 6, 1302–1306. [Google Scholar] [CrossRef] [PubMed]
  3. Borrell-Pags, M.; Romero, J.C.; Juan-Babot, O.; Badimon, L. Wnt pathway activation, cell migration, and lipid uptake is regulated by low-density lipoprotein receptor-related protein 5 in human macrophages. Eur. Heart J. 2011, 32, 2841–2850. [Google Scholar] [CrossRef] [PubMed]
  4. Wehrli, M.; Dougan, S.T.; Caldwell, K.; O’Keefe, L.; Schwartz, S.; Valzel-Ohayon, D.; Schejter, E.; Tomlinson, A.; DiNardo, S. Arrow encodes an LDL-receptor-related protein essential for Wingless signalling. Nature 2000, 407, 527–530. [Google Scholar] [CrossRef] [PubMed]
  5. Siegfried, E.; Chou, T.B.; Perrimon, N. wingless signaling acts through zeste-white 3, the drosophila homolog of glycogen synthase kinase-3, to regulate engrailed and establish cell fate. Cell 1992, 71, 1167–1179. [Google Scholar] [CrossRef] [PubMed]
  6. Behrens, J.; Jerchow, B.A.; Würtele, M.; Grimm, J.; Asbrand, C.; Wirtz, R.; Kühl, M.; Wedlich, D.; Birchmeier, W. Functional interaction of an axin homolog, conductin, with β-catenin, APC, and GSK3β. Science 1998, 280, 596–599. [Google Scholar] [CrossRef]
  7. Behrens, J.; Von Kries, J.P.; Kühl, M.; Bruhn, L.; Wedlich, D.; Grosschedl, R.; Birchmeier, W. Functional interaction of β-catenin with the transcription factor LEF- 1. Nature 1996, 382, 638–642. [Google Scholar] [CrossRef] [PubMed]
  8. Billin, A.N.; Thirlwell, H.; Ayer, D.E. β-Catenin–Histone Deacetylase Interactions Regulate the Transition of LEF1 from a Transcriptional Repressor to an Activator. Mol. Cell. Biol. 2000, 20, 6882–6890. [Google Scholar] [CrossRef]
  9. He, T.C.; Sparks, A.B.; Rago, C.; Hermeking, H.; Zawel, L.; Da Costa, L.T.; Morin, P.J.; Vogelstein, B.; Kinzler, K.W. Identification of c-MYC as a target of the APC pathway. Science 1998, 281, 1509–1512. [Google Scholar] [CrossRef]
  10. Shtutman, M.; Zhurinsky, J.; Simcha, I.; Albanese, C.; D’Amico, M.; Pestell, R.; Ben-Ze’ev, A. The cyclin D1 gene is a target of the β-catenin/LEF-1 pathway. Proc. Natl. Acad. Sci. USA 1999, 96, 5522–5527. [Google Scholar] [CrossRef]
  11. Carter, M.; Chen, X.; Slowinska, B.; Minnerath, S.; Glickstein, S.; Shi, L.; Campagne, F.; Weinstein, H.; Ross, M.E. Crooked tail (Cd) model of human folate-responsive neural tube defects is mutated in Wnt coreceptor lipoprotein receptor-related protein 6. Proc. Natl. Acad. Sci. USA 2005, 102, 12843–12848. [Google Scholar] [CrossRef] [PubMed]
  12. Ciani, L.; Salinas, P.C. WNTs in the vertebrate nervous system: From patterning to neuronal connectivity. Nat. Rev. Neurosci. 2005, 6, 351–362. [Google Scholar] [CrossRef] [PubMed]
  13. Ahmad-Annuar, A.; Ciani, L.; Simeonidis, I.; Herreros, J.; Fredj, N.B.; Rosso, S.B.; Hall, A.; Brickley, S.; Salinas, P.C. Signaling across the synapse: A role for Wnt and Dishevelled in presynaptic assembly and neurotransmitter release. J. Cell Biol. 2006, 174, 127–139. [Google Scholar] [CrossRef] [PubMed]
  14. Zechner, D.; Müller, T.; Wende, H.; Walther, I.; Taketo, M.M.; Crenshaw, E.B.; Treier, M.; Birchmeier, W.; Birchmeier, C. Bmp and Wnt/β-catenin signals control expression of the transcription factor Olig3 and the specification of spinal cord neurons. Dev. Biol. 2007, 303, 181–190. [Google Scholar] [CrossRef] [PubMed]
  15. Varela-Nallar, L.; Alfaro, I.E.; Serrano, F.G.; Parodi, J.; Inestrosa, N.C. Wingless-type family member 5A (Wnt-5a) stimulates synaptic differentiation and function of glutamatergic synapses. Proc. Natl. Acad. Sci. USA 2010, 107, 21164–21169. [Google Scholar] [CrossRef] [PubMed]
  16. Clark, C.E.J.; Nourse, C.C.; Cooper, H.M. The tangled web of non-canonical wnt signalling in neural migration. NeuroSignals 2012, 20, 202–220. [Google Scholar] [CrossRef] [PubMed]
  17. Okerlund, N.D.; Cheyette, B.N.R. Synaptic Wnt signaling-a contributor to major psychiatric disorders? J. Neurodev. Disord. 2011, 3, 162–174. [Google Scholar] [CrossRef] [PubMed]
  18. Valvezan, A.J.; Klein, P.S. GSK-3 and Wnt signaling in neurogenesis and bipolar disorder. Front. Mol. Neurosci. 2012, 5, 1. [Google Scholar] [CrossRef] [PubMed]
  19. Jia, L.; Piña-Crespo, J.; Li, Y. Restoring Wnt/β-catenin signaling is a promising therapeutic strategy for Alzheimer’s disease. Mol. Brain 2019, 12, 104. [Google Scholar] [CrossRef]
  20. Ren, Q.; Chen, J.; Liu, Y. LRP5 and LRP6 in Wnt Signaling: Similarity and Divergence. Front. Cell Dev. Biol. 2021, 9, 670960. [Google Scholar] [CrossRef]
  21. Grünblatt, E.; Nemoda, Z.; Werling, A.M.; Roth, A.; Angyal, N.; Tarnok, Z.; Thomsen, H.; Peters, T.; Hinney, A.; Hebebrand, J.; et al. The involvement of the canonical Wnt-signaling receptor LRP5 and LRP6 gene variants with ADHD and sexual dimorphism: Association study and meta-analysis. Am. J. Med. Genet. Part B Neuropsychiatr. Genet. 2019, 180, 365–376. [Google Scholar] [CrossRef]
  22. Veerapathiran, S.; Teh, C.; Zhu, S.; Kartigayen, I.; Korzh, V.; Matsudaira, P.T.; Wohland, T. Wnt3 distribution in the zebrafish brain is determined by expression, diffusion and multiple molecular interactions. eLife 2020, 9, e59489. [Google Scholar] [CrossRef]
  23. Borrell-Pages, M.; Vilahur, G.; Romero, J.C.; Casaní, L.; Bejar, M.T.; Badimon, L. LRP5/canonical Wnt signalling and healing of ischemic myocardium. Basic. Res. Cardiol. 2016, 111, 67. [Google Scholar] [CrossRef]
  24. Borrell-Pagès, M.; Romero, J.C.; Badimon, L. LRP5 deficiency down-regulates Wnt signalling and promotes aortic lipid infiltration in hypercholesterolaemic mice. J. Cell. Mol. Med. 2015, 19, 770–777. [Google Scholar] [CrossRef]
  25. Borrell-Pages, M.; Carolina Romero, J.; Badimon, L. LRP5 and plasma cholesterol levels modulate the canonical Wnt pathway in peripheral blood leukocytes. Immunol. Cell Biol. 2015, 93, 653–661. [Google Scholar] [CrossRef]
  26. Badimon, L.; Luquero, A.; Crespo, J.; Peña, E.; Borrell-Pages, M. PCSK9 and LRP5 in macrophage lipid internalization and inflammation. Cardiovasc. Res. 2021, 117, 2054–2068. [Google Scholar] [CrossRef]
  27. Borrell-Pages, M.; Luquero, A.; Vilahur, G.; Padró, T.; Badimon, L. Canonical Wnt pathway and the LDL receptor superfamily in neuronal cholesterol homeostasis and function. Cardiovasc. Res. 2023, 120, 140–151. [Google Scholar] [CrossRef]
  28. Kato, M.; Patel, M.S.; Levasseur, R.; Lobov, I.; Chang, B.H.J.; Glass, D.A.; Hartmann, C.; Li, L.; Hwang, T.H.; Brayton, C.F.; et al. Cbfa1-independent decrease in osteoblast proliferation, osteopenia, and persistent embryonic eye vascularization in mice deficient in Lrp5, a Wnt coreceptor. J. Cell Biol. 2002, 157, 303–314. [Google Scholar] [CrossRef]
  29. Ensembl. Mouse LRP5 Gene [Internet]. Available online: https://www.ensembl.org/Mus_musculus/Gene/Summary?db=core;g=ENSMUSG00000024913;r=19:3634828-3736564 (accessed on 1 May 2023).
  30. Badimon, L.; Casaní, L.; Camino-Lopez, S.; Juan-Babot, O.; Borrell-Pages, M. GSK3β inhibition and canonical Wnt signaling in mice hearts after myocardial ischemic damage. PLoS ONE 2019, 14, e0218098. [Google Scholar] [CrossRef]
  31. Luquero, A.; Vilahur, G.; Casani, L.; Badimon, L.; Borrell-Pages, M. Differential cholesterol uptake in liver cells: A role for PCSK9. FASEB J. 2022, 36, e22291. [Google Scholar] [CrossRef]
  32. McCaffery, P.; Dräger, U.C. Regulation of retinoic acid signaling in the embryonic nervous system: A master differentiation factor. Cytokine Growth Factor. Rev. 2000, 11, 233–249. [Google Scholar] [CrossRef] [PubMed]
  33. Maden, M. Retinoid signalling in the development of the central nervous system. Nat. Rev. Neurosci. 2002, 3, 843–853. [Google Scholar] [CrossRef] [PubMed]
  34. Glaser, T.; Brüstle, O. Retinoic acid induction of ES-cell-derived neurons: The radial glia connection. Trends Neurosci. 2005, 28, 397–400. [Google Scholar] [CrossRef] [PubMed]
  35. Olson, C.R.; Mello, C.V. Significance of vitamin A to brain function, behavior and learning. Mol. Nutr. Food Res. 2010, 54, 489–495. [Google Scholar] [CrossRef] [PubMed]
  36. Queiroz, M.P.; Da Silva Lima, M.; Barbosa, M.Q.; De Melo, M.F.F.T.; De Menezes Santos Bertozzo, C.C.; De Oliveira, M.E.G.; Branquinho Bessa, R.J.; Almeida Alves, S.P.; Souza, M.I.A.; de Cassia Ramos do Egypto Queiroga, R.; et al. Effect of conjugated linoleic acid on memory and reflex maturation in rats treated during early life. Front. Neurosci. 2019, 13, 370. [Google Scholar] [CrossRef] [PubMed]
  37. Taha, A.Y. Linoleic acid–good or bad for the brain? NPJ Sci. Food 2020, 4, 1. [Google Scholar] [CrossRef] [PubMed]
  38. Wolffe, A.P.; Cooper, G.M. The Cell: A Molecular Approach. Q. Rev. Biol. 1998, 73, 69–70. [Google Scholar] [CrossRef]
  39. Guo, Y.; Zi, X.; Koontz, Z.; Kim, A.; Xie, J.; Gorlick, R.; Holcombe, R.F.; Hoang, B.H. Blocking Wnt/LRP5 signaling by a soluble receptor modulates the epithelial to mesenchymal transition and suppresses met and metalloproteinases in osteosarcoma Saos-2 cells. J. Orthop. Res. 2007, 25, 964–971. [Google Scholar] [CrossRef]
  40. Guo, Y.; Rubin, E.M.; Xie, J.; Zi, X.H.B. Dominant Negative LRP5 Decreases Tumorigenicity and Metastasis of Osteosarcoma in an Animal Model. Clin. Orthop. Relat. Res. 2008, 466, 2039–2045. [Google Scholar] [CrossRef]
  41. Davisson, M.T. Rules and guidelines for nomenclature of mouse genes. Gene 1994, 147, 157–160. [Google Scholar] [CrossRef]
  42. Holmen, S.L.; Giambernardi, T.A.; Zylstra, C.R.; Buckner-Berghuis, B.D.; Resau, J.H.; Hess, J.F.; Glatt, V.; Bouxsein, M.L.; Ai, M.; Warman, M.L.; et al. Decreased BMD and limb deformities in mice carrying mutations in both Lrp5 and Lrp6. J. Bone Miner. Res. 2004, 19, 2033–2040. [Google Scholar] [CrossRef] [PubMed]
  43. Krueger, F. TrimGalore [Internet]. Available online: https://github.com/FelixKrueger/TrimGalore (accessed on 1 May 2023).
  44. Dobin, A.; Davis, C.A.; Schlesinger, F.; Drenkow, J.; Zaleski, C.; Jha, S.; Batut, P.; Chaisson, M.; Gingeras, T.R. STAR: Ultrafast universal RNA-seq aligner. Bioinformatics 2013, 29, 15–21. [Google Scholar] [CrossRef] [PubMed]
  45. Li, B.; Dewey, C.N. RSEM: Accurate transcript quantification from RNA-Seq data with or without a reference genome. BMC Bioinform. 2011, 12, 323. [Google Scholar] [CrossRef] [PubMed]
  46. Ritchie, M.E.; Phipson, B.; Wu, D.; Hu, Y.; Law, C.W.; Shi, W.; Smyth, G.K. Limma powers differential expression analyses for RNA-sequencing and microarray studies. Nucleic Acids Res. 2015, 43, e47. [Google Scholar] [CrossRef] [PubMed]
  47. Tekath, T.; Dugas, M. Differential transcript usage analysis of bulk and single-cell RNA-seq data with DTUrtle. Bioinformatics 2021, 37, 3781–3787. [Google Scholar] [CrossRef] [PubMed]
  48. Raudvere, U.; Kolberg, L.; Kuzmin, I.; Arak, T.; Adler, P.; Peterson, H.; Vilo, J. G:Profiler: A web server for functional enrichment analysis and conversions of gene lists (2019 update). Nucleic Acids Res. 2019, 47, W191–W198. [Google Scholar] [CrossRef]
  49. Wang, J.; Duncan, D.; Shi, Z.; Zhang, B. WEB-based GEne SeT AnaLysis Toolkit (WebGestalt): Update 2013. Nucleic Acids Res. 2013, 41, W77–W83. [Google Scholar] [CrossRef]
Figure 1. Analysis of Lrp5−/− mouse offspring. Observed and expected births of wildtype (Wt; +/+), heterozygous (Hz; −/+), and knockout (Lrp5−/−; −/−) mice from (A,C) Hz crossbreeding (−/+ × −/+; p < 0.001) or (B,D) Hz and Lrp5−/− crossbreeding (−/+ × −/−; p = 0.05) for over 10 years.
Ijms 25 06763 g001
Figure 2. LRP5 gene expression in the brains and livers of Wt and Lrp5−/− mice. (A) The Lrp5-201 transcript was detected by LP5 probes against exons 1–2, exons 9–10–11, and exons 22–23, whereas the Lrp5-202 transcript was only detected by the LRP5 probe against exons 1-2. LRP5 gene expression in the liver and brain tissues of Wt and Lrp5−/− mice using (B) LRP5 probe Mm00493187_m1; (C) LRP5 probe Mm_01227476; and (D) LRP5 probe Mm_00493179. *** p < 0.001.
Ijms 25 06763 g002
Figure 3. Lrp5-201 and Lrp5-202 transcript expression in the livers and brains of Wt and Lrp5−/− mice. (A) Fold change in Lrp5-201 transcript expression. (B) Lrp5-201 transcript expression in the brains and livers of Wt and Lrp5−/− mice expressed in log2CPM. (C) Same as (A) for Lrp5-202. (D) Same as (B) for Lrp5-202. (E) Lrp5-201 transcript expression on the X axis and Lrp5-202 transcript expression on the Y axis for each tissue sample. Data are expressed as mean ± S.E.M. **** p < 0.0001; ns: non-statistically significant.
Ijms 25 06763 g003
Figure 4. Volcano plots for liver and brain samples. Volcano plot comparing transcript expression in (A) livers of Lrp5−/− mice vs. livers of Wt mice and in (B) brains of Lrp5−/− mice vs. brains of Wt mice. Data are expressed as log2FC on the X axis and as (−)log10AdjPvalue on the Y axis. Transcripts above the horizontal grey dotted line (···) show significantly modified expression in Lrp5−/− mice compared to Wt mice. Vertical grey bar-dot lines (― · ― ·) indicate thresholds where transcripts reduced expression by ½-fold or increased by 2-fold in mouse Lrp5−/− tissue compared to Wt mice tissue. Empty dots (○) indicate transcripts with highly modified expression in Lrp5−/− tissues. ↑ indicates that the transcript expression is significantly higher in animals of the genotype and ↓ indicates that transcript expression is significantly lower in animals of the genotype.
Ijms 25 06763 g004
Figure 5. Lrp5 transcript variability depending on tissue and mouse genotype. Heat map with the number of Lrp5-201 and Lrp5-202 transcripts in the (A) livers and (B) brains of Wt and Lrp5−/− mice. Lrp5-201 and Lrp5-202 expression compared to total Lrp5 transcripts in Wt and Lrp5−/− mouse (C) livers and (D) brains.
Ijms 25 06763 g005
Figure 6. Gene Set Enrichment Analyses (GSEA) on the brains of Wt and Lrp5−/− mice. (A) List of the top 10 most dysregulated pathways in the brains of Lrp5−/− mice. Positive values on the X axis indicate upregulation, and negative values on the X axis indicate downregulation compared to the brains of Wt mice. (BG) GSEA plots for pathways with FDR < 0.05, (B) retinol metabolism, (C) linoelic acid metabolism, (D) steroid hormone biosynthesis, (E) porphyrin and chlorophyll metabolism, (F) chemichal carcinogenesis, and (G) ascorbate and aldarate metabolism. All gene sets available in the Gene Ontology database were considered. Figures (BG): X-axis is the Rank in Ordered Dataset ranging from 0 to 14,000; superior Y-axis is the Enrichment Score ranging from 0.0 to −0.8; inferior Y-axis is the Ranked List Metric ranging from 4 to −4.
Ijms 25 06763 g006
Figure 7. Network analysis of RNA-seq data. (A) Protein–protein interaction network of transcripts with modified expression in Lrp5−/− mice brains. Only interactions with a confidence score higher than 0.4 are shown. A β-catenin node was added to generate a cluster of interacting proteins. Singletons were included in the figure to show that the majority of proteins with altered expression did not interact with each other. (B) Table showing functional gene enrichment retrieved from proteins forming the cluster in A. Singletons were not included for the enrichment. Term names and FDR data are included in the table. (C) Protein–protein interaction network of transcripts with modified expression in Lrp5−/− mice livers. Only interactions with a confidence score higher than 0.4 are shown.
Ijms 25 06763 g007
Table 1. List of transcripts with significantly altered expression in livers of Lrp5−/− mice compared to Wt mice. p value < 0.05.
Gene Transcripts with Altered Expression in Livers of Lrp5−/− Mice
Mdfic-206Myo5a-204Lpin2-204Wnk2-211Rida-201Fbxo16-204Otud1-201Ranbp10-2011500011B03Rik-204
Lrp5-201Dpys-201Gabrb3-201Tlcd4-207Xlr3a-201Irf6-201Aplp2-203Atp5pb-2030610030E20Rik-201
Fam222b-203Slc13a3-201Nat8f2-201Wdr77-201Eml1-202Kif26b-202Tbp-211Med13l-2011110032F04Rik-201
Tcf7l2-213Ppm1k-201Papola-202Serpinc1-207Dph7-201Zhx3-202Ifnar2-201Fech-201D5Ertd579e-201
Camsap3-209Bend6-201Sptan1-202Fus-204Fzd8-201Zfp703-202Gmppb-202Tmem25-204AW209491-202
Dctn1-203Fgd6-201Hnrnpa1-202Gsap-201Lipa-201Yy1-201Mat1a-201Btg1-202Cdc42bpb-201
Ankrd33b-202Clk3-201Zmynd8-203Xpo4-209Ppm1b-201Eif5-201Lrrc73-204Bptf-2032810021J22Rik-201
Lrp5-202Hddc3-208Dpys-202mt-Atp6-201St6gal1-205Aacs-201Ide-201Ankrd11-202A630089N07Rik-202
Ociad2-205Stom-201Pxmp2-201Tab2-204Crebrf-201Relch-205Tmpo-201Mcfd2-2042410002F23Rik-202
Meis3-205Tspyl5-201Slc8b1-202Cyp39a1-203Cog8-201Map2k3-201N4bp2l2-201Pwwp2a-203Nr1i2-201
Cps1-201Zfand5-205Irgm1-202Bet1l-201Rhod-201Hes6-202Nr1h2-201Dcaf12l1-202Wbp1l-201
Slc15a2-205Inpp5f-208Myef2-201Rab9-202Zfp120-201Wnk2-201Dst-201Elf1-201Srp54a-202
Rapgef1-207Jmy-201Rsph1-201Pxmp4-201Znfx1-201Tfdp1-204Gpbp1-202Mphosph8-201Slc4a2-201
Pnrc1-201Traf4-201Dclk2-206Rnf186-201Csnk1d-202Scaf11-204Rabep1-207Chd4-203Dtymk-201
Gamt-202Brap-201Srsf7-201Kdm2a-202Etv6-202Pik3r1-202Bhlhe41-201Pi4ka-201Ip6k2-206
Prxl2c-207Gria4-203Pdcd11-201Esyt2-201Stxbp3-201Ahctf1-201Slc38a2-201Pkp4-211Gemin5-205
Aktip-204Gabarapl1-201Slc39a14-202Qdpr-201Sgsh-201Atp6ap2-201Gpbp1l1-201Per2-201Azin1-203
Zfyve1-201Irs2-201Elfn2-201Dnajc13-203Rsph4a-201Rai1-202Cmtm4-201Slc43a1-201Zrsr2-201
Slc25a33-201Spns2-201Papss2-201Mxd4-201Fah-201Epm2aip1-201Cyp2c70-201Grb10-203Ttc14-211
Tpm1-215Dtx3l-201Uox-201Hdac5-202Csad-211Irf2bp2-201Pfkfb2-204Dusp3-201Snrnp48-201
Klf11-201Maoa-201Inf2-201Pspc1-201Prpsap1-201Tbc1d20-201Flcn-203Cebpb-201Gpcpd1-202
Dctn1-202Tor1aip2-205Epc2-201Rabggtb-201Abat-201Bdp1-204Hbp1-202Atrip-201Iigp1-202
Evi5l-207Pparg-202Dennd11-202Fn3krp-201Serpinf2-202Jmjd1c-206C9orf72-203Riok2-201Sstr4-201
Klhl24-201Cnppd1-201Foxp4-208Cdc42bpg-201Hnrnpa3-203Fnip1-201Smc5-202Bzw1-201Unc13b-201
Cyria-205Dach1-202Stk24-201Aldh3a2-202Tro-204Tmf1-202Atxn2-201Slc25a47-201Ciart-201
Il13ra1-201Erbb3-201Serpinb9-201Agxt2-204Ubiad1-201Clic5-203Chn2-202Zfp955a-201Elac1-201
Trim46-201Spryd4-201Ilrun-203Pcdh1-204Gorasp1-201Upp2-202Atpsckmt-201Ap4m1-201Nfyc-204
Gclc-201Sesn2-201Mmab-201Zfand6-208Dyrk3-201Csnk1g1-202Stat5b-201Hsd17b7-201Ipmk-203
Dgkb-203Dlg4-205Thrsp-201Fbxl19-201Blvrb-201Slc25a22-225Lats2-201Fbxl3-201Mef2d-204
Gla-201Nr2c2-201Klhl42-201Ppp1r3b-201Pcsk9-201Paqr5-201Sf3a1-201Nars-205Rnf125-202
Muc3a-202Stard4-201Tstd3-201Inf2-203Cpeb2-202Tmc6-201Map3k11-201Stau2-212Dcaf11-202
Aldh1l1-201Slc38a3-209Bcan-201Mtdh-202Gnpnat1-201Rnd1-201Tfe3-201Ss18l2-201Dhtkd1-202
Smurf1-203Ccng2-201Atad3a-201Mink1-201Zfp266-202Arhgef3-202Elp1-201Hmgb1-201Ttbk2-202
Wnt7b-201Elovl6-201Chic1-201Pck1-201Zswim4-201Aqp11-205Mthfr-201Gpr146-201Mapk3-202
Lnx2-201Psmc3-210Slc38a3-201Gtf2ird1-229Ccdc39-201Slc38a3-202Oser1-201P2ry1-203Heatr1-206
Zfp386-204Gprc5b-204Serpind1-202Fam47e-202Arg1-201Ankrd13c-202Zfp592-201Tmem98-201Tmub2-202
Creg1-202Calcoco1-201Nme5-204Map1lc3a-201Mid1ip1-201Ints6-201Net1-201Zfp322a-201Rb1cc1-214
Rbm33-204Pou2af2-202Laptm4b-201Dnajb11-203Tbcel-203Smad4-201Ewsr1-205Zkscan8-201Kdm3a-201
Fam135a-206Rpl30-201Fads6-201Ppp1r3g-201Srsf1-205Slc20a2-201Slc9a3-203Gpx6-201Map4k4-209
Rnf38-202Pde4b-207Lrfn3-201Dyrk1b-201Ddx42-201Map3k5-202Hnrnpf-202Cstf2t-201
Ephx1-201Sec24c-201Gpam-202Tacc2-205Mbd5-203Suds3-202Crebbp-205Tbc1d14-201
Rtl5-201Stard13-208Raf1-201Ttc38-203Meiob-201Plekhm1-201Proca1-201Acbd5-213
Uqcc1-204Mok-202Aox1-201Atat1-203Fem1a-201Net1-202Rims2-201Mtmr3-203
Abcb4-201Mrtfb-204Ube2h-202Wac-201Cpeb2-204Serpina3n-201Shroom1-201Cyth2-203
Cpq-201Ttll11-202Zfp446-203Fus-201Csad-205Lrp6-201Ano1-203Chrm3-202
Heca-201Septin9-204Anks4b-201Tomm40-202Mul1-201Fnbp1-210Leng8-203Opn3-201
Nlgn3-201Ctdsp2-202Kctd7-201Tesk1-201Efr3a-212Taok3-201Pnn-201H2az1-201
Map3k13-203Nfil3-201Gbp7-201Hlcs-201Evi5-201Mpv17l-201Pon2-201Ppp2r2d-201
Btg1-201Arl4a-201Ypel2-201Casp7-201Ptpn21-203Mettl1-201Hmgcr-201Nup50-201
Tcp11l2-201Zfp740-201Plec-218Rrp9-201Khnyn-203Wdr45-204Mtss1-201Magi1-203
Tmem64-201Pcdh1-203Atosa-201Hnrnpd-211Cyp39a1-204Kcna2-202Ephb6-201Mterf2-201
Zfp13-201Hsdl2-201Txndc11-202Ankrd46-203Zdhhc2-201Dtx4-201Itgb1-201Abhd8-201
Azin1-201Aldh1l1-203Nhlrc1-201Echdc3-201Lrrfip2-205Rbbp6-202Tmx2-201Akap8-206
Emc2-201Gpr17-201Znrf3-201Dnmbp-206Lcorl-212Rabl3-201Acaca-201Csad-201
Tgoln1-201Sppl3-201Pomk-201Triobp-203Rnf11-201Phf13-201Otud3-201Rdx-204
Pde4dip-201Tlcd4-203Zfp715-203Stat1-206Axin1-201Tmem44-204Ranbp10-203Snap25-201
Table 2. List of transcripts with significantly altered expression in brains of Lrp5−/− mice compared to Wt mice. p value < 0.05.
Gene Transcripts with Altered Expression in Brains of Lrp5−/− Mice
Fgfbp3-201Pde4d-202Cramp1-201Ttyh1-201Brap-205
Eps8l2-206Ankrd33b-202H2-Q7-201Erich5-201Ighg2c-202
Rab11fip3-201Cask-210Gm17167-201Ube2d2a-210Abi1-205
Lrp5-202Zfp386-204Gm8116-201Bcat2-205Atp6v1c1-202
Gm12191-201Rpl30-201Aldh1l1-204Baalc-202Ywhaz-203
Rbfox1-202Ciz1-202Atp6v1c1-201Slc29a1-222Lzts3-202
Ndn-201Atg16l2-211Fn1-204Rpl30-ps9-201Rspo2-201
Hax1-207Gm8276-201Cobl-210Ankrd46-204Pak3-210
Ptpn6-203Marveld2-201Btaf1-201Gm54215-201Meg3-201
Ankrd33b-203Ywhaz-207Eif3s6-ps2-201Ywhaz-201
Table 3. Altered functions in the brains of Lrp5−/− mice according to functional gene enrichment analysis. The 1st column indicates the altered function; the 2nd column shows the p value associated with each function; the 3rd column shows the Gene Ontology subhierarchy associated with the altered function; the 4th column lists the transcripts with altered expression in the brains of Lrp5−/− mice that are associated with the altered function (GO:BP stands for Gene Ontology:Biological Process; GO:CC stands for Gene Ontology:Cellular Component; GO:MF stands for Gene Ontology:Molecular Function).
Altered Functionp-ValueSourceSignificantly Altered Transcripts
Cell morphogenesis involved in differentiation0.00713631GO:BPNecdin-201; Ptpn6-203; Cask-210; Fn1-204; Cobl-210; Abi-205; Ltzs3-202; Pak3-210
Cell morphogenesis involved in neuron differentiation0.03526747GO:BPNecdin-201; Cask-210; Fn1-204; Cobl-210; Abi-205; Ltzs3-202; Pak3-210
Postsynaptic density0.00032878GO:CCCask-210; Rpl30-201; Ywhaz-207; Baalc-202; Abi1-205; Ltzs3-202; Pak3-210
Postsynapse0.00037269GO:CCRab11fip3-201; Slc29a1-222; Cask-210; Rpl30-201; Ywhaz-207; Baalc-202; Abi1-205; Ltzs3-202; Pak3-210
Asymmetric synapse0.00043165GO:CCCask-210; Rpl30-201; Ywhaz-207; Baalc-202; Abi1-205; Ltzs3-202; Pak3-210
Postsynaptic specialization0.00060115GO:CCCask-210; Rpl30-201; Ywhaz-207; Baalc-202; Abi1-205; Ltzs3-202; Pak3-210
Neuron to neuron synapse0.00072925GO:CCCask-210; Rpl30-201; Ywhaz-207; Baalc-202; Abi1-205; Ltzs3-202; Pak3-210
Cell junction0.00111901GO:CCRab11fip3-201; Ptpn6-203; Cask-210; Rpl30-201; Ywhaz-207; Baalc-202; Slc29a1-222; Marveld2-201; Atp6v1c1-201; Ttyh1-201; Abi1-205; Ltzs3-202; Pak3-210
Synapse0.00187814GO:CCRab11fip3-201; Slc29a1-222; Cask-210; Rpl30-201; Ywhaz-207; Baalc-202; Atp6v1c1-201; Abi1-205; Ltzs3-202; Pak3-210
Apical part of cell0.01692298GO:CCHax1-207; Pde4d-202; Marveld2-201; Atp6v1c1-201; Fn1-204; Cobl-210
Plasma membrane region0.01918133GO:CCRab11fip3-201; Eps8l2-206; Hax1-207; Pde4d-202; Cask-210; Marveld2-201; Fn1-204; Ttyh1-201; Slc29a1-222
Protein domain specific binding0.00720761GO:MFHax1-207; Ptpn6-203; Cask-210; Ywhaz-207; Fn1-204; Abi1-205; Lzts3-202; Pak3-210
Protein binding0.04096533GO:MFFgfbp3-201; Eps8l2-206; Rab11fip3-201; Ndn-201; Hax1-207; Ptpn6-203; Pde4d-204; Cask-210; Marveld2-201; Ywhaz-207; Fn1-204; Cobl-210; Ankrd46-204; Abi1-205; Lzts3-202; Pak3-210; Lrp5-202; Ankrd33b-206; Ciz1-202; Atg16l2-211; H2-Q7-201; Aldh1l1-204; Btaf1-201; Ube2d2a-210; Brap-205; Ighg2c-202; Rspo2-201
Table 4. Altered functions in livers of Lrp5−/− mice according to functional gene enrichment analysis. The 1st column indicates the altered process; the 2nd column shows the p value associated with each function; the 3rd column shows the Gene Ontology subhierarchy associated with the altered function; the 4th column shows the number of altered transcripts associated with the function. Only the 28 functions with the smallest p values are listed, as more than 300 functions were altered in the livers of Lrp5−/− mice (based on the Gene Ontology database) (GO:BP stands for Gene Ontology:Biological Process; GO:CC stands for Gene Ontology:Cellular Component; GO:MF stands for Gene Ontology:Molecular Function).
Altered Functionp-ValueSourceNumber of Significantly Altered Transcripts
Regulation of cellular metabolic process1.54 × 10−19GO:BP193
Regulation of cellular process2.68 × 10−18GO:BP325
Regulation of primary metabolic process4.22 × 10−18GO:BP199
Biological regulation1.31 × 10−16GO:BP347
Reguation of metabolic process2.41 × 10−16GO:BP223
Regulation of nitrogen compound metabolic process7.82 × 10−16GO:BP189
Regulation of biological process1.66 × 10−15GO:BP337
Organic substance biosynthetic process3.49 × 10−15GO:BP190
Biosynthetic process3.75 × 10−15GO:BP192
Cellular process6.86 × 10−15GO:BP446
Positive regulation of biological process1.45 × 10−14GO:BP207
Positive regulation of cellular process4.05 × 10−14GO:BP190
Regulation of macromolecule metabolic process2.91 × 10−13GO:BP204
Cellular metabolic process2.50 × 10−12GO:BP299
Cellular biosynthetic process3.84 × 10−12GO:BP173
Regulation of biosynthetic process1.43 × 10−11GO:BP143
Organonitrogen compund metabolic process3.46 × 10−11GO:BP192
Anatomical structural development4.95 × 10−11GO:BP186
Developmental process6.58 × 10−11GO:BP199
Metabolic process1.18 × 10−10GO:BP344
Primary metabolic process1.37 × 10−10GO:BP318
Negative regulation of cellular process1.92 × 10−10GO:BP157
Regulation of macromolecule biosynthetic process3.05 × 10−10GO:BP133
Regulation of cellular biosynthetic process3.16 × 10−10GO:BP136
Multicellular organism development3.37 × 10−10GO:BP154
Positive regulation of cellular metabolic process6.09 × 10−10GO:BP111
System development6.42 × 10−10GO:BP136
Localization1.11 × 10−9GO:BP166
·
·
·
Disclaimer/Publisher’s Note: The statements, opinions and data contained in all publications are solely those of the individual author(s) and contributor(s) and not of MDPI and/or the editor(s). MDPI and/or the editor(s) disclaim responsibility for any injury to people or property resulting from any ideas, methods, instructions or products referred to in the content.

