
Evaluation of Microvascular Density in Glioblastomas in Relation to p53 and Ki67 Immunoexpression

 , ,
, ,  ,
,
Abstract
1. Introduction
2. Results
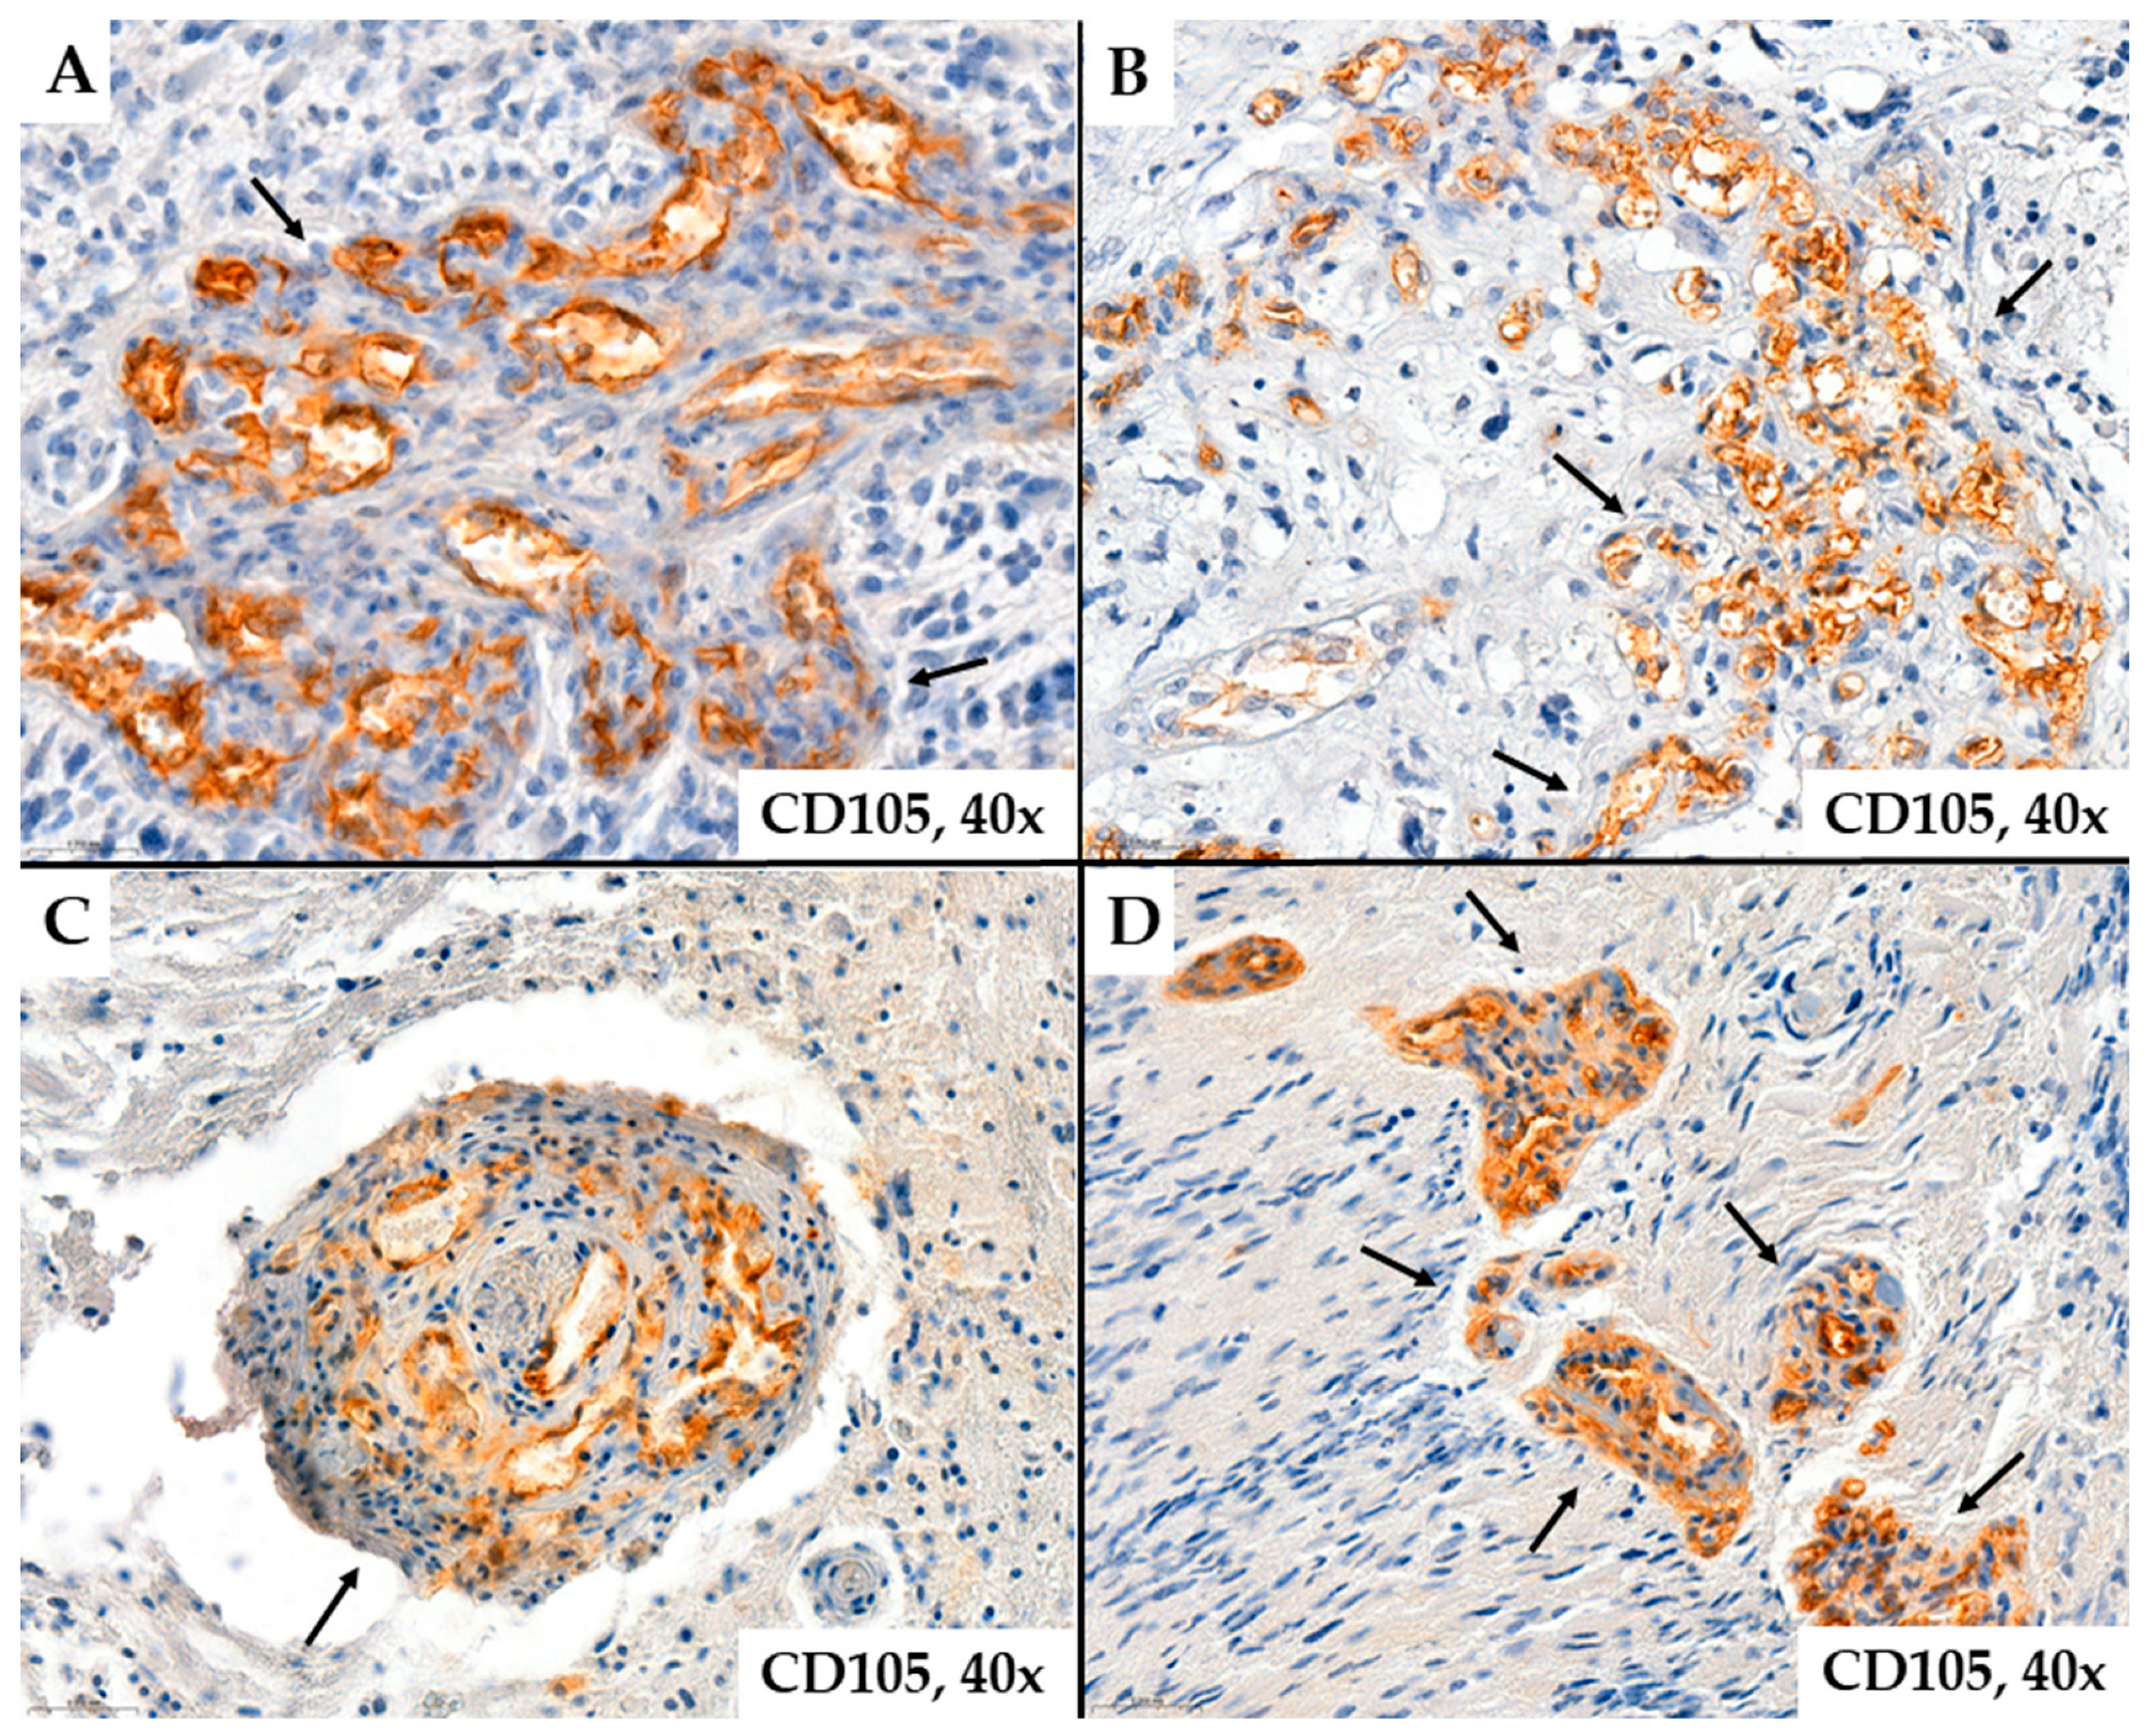
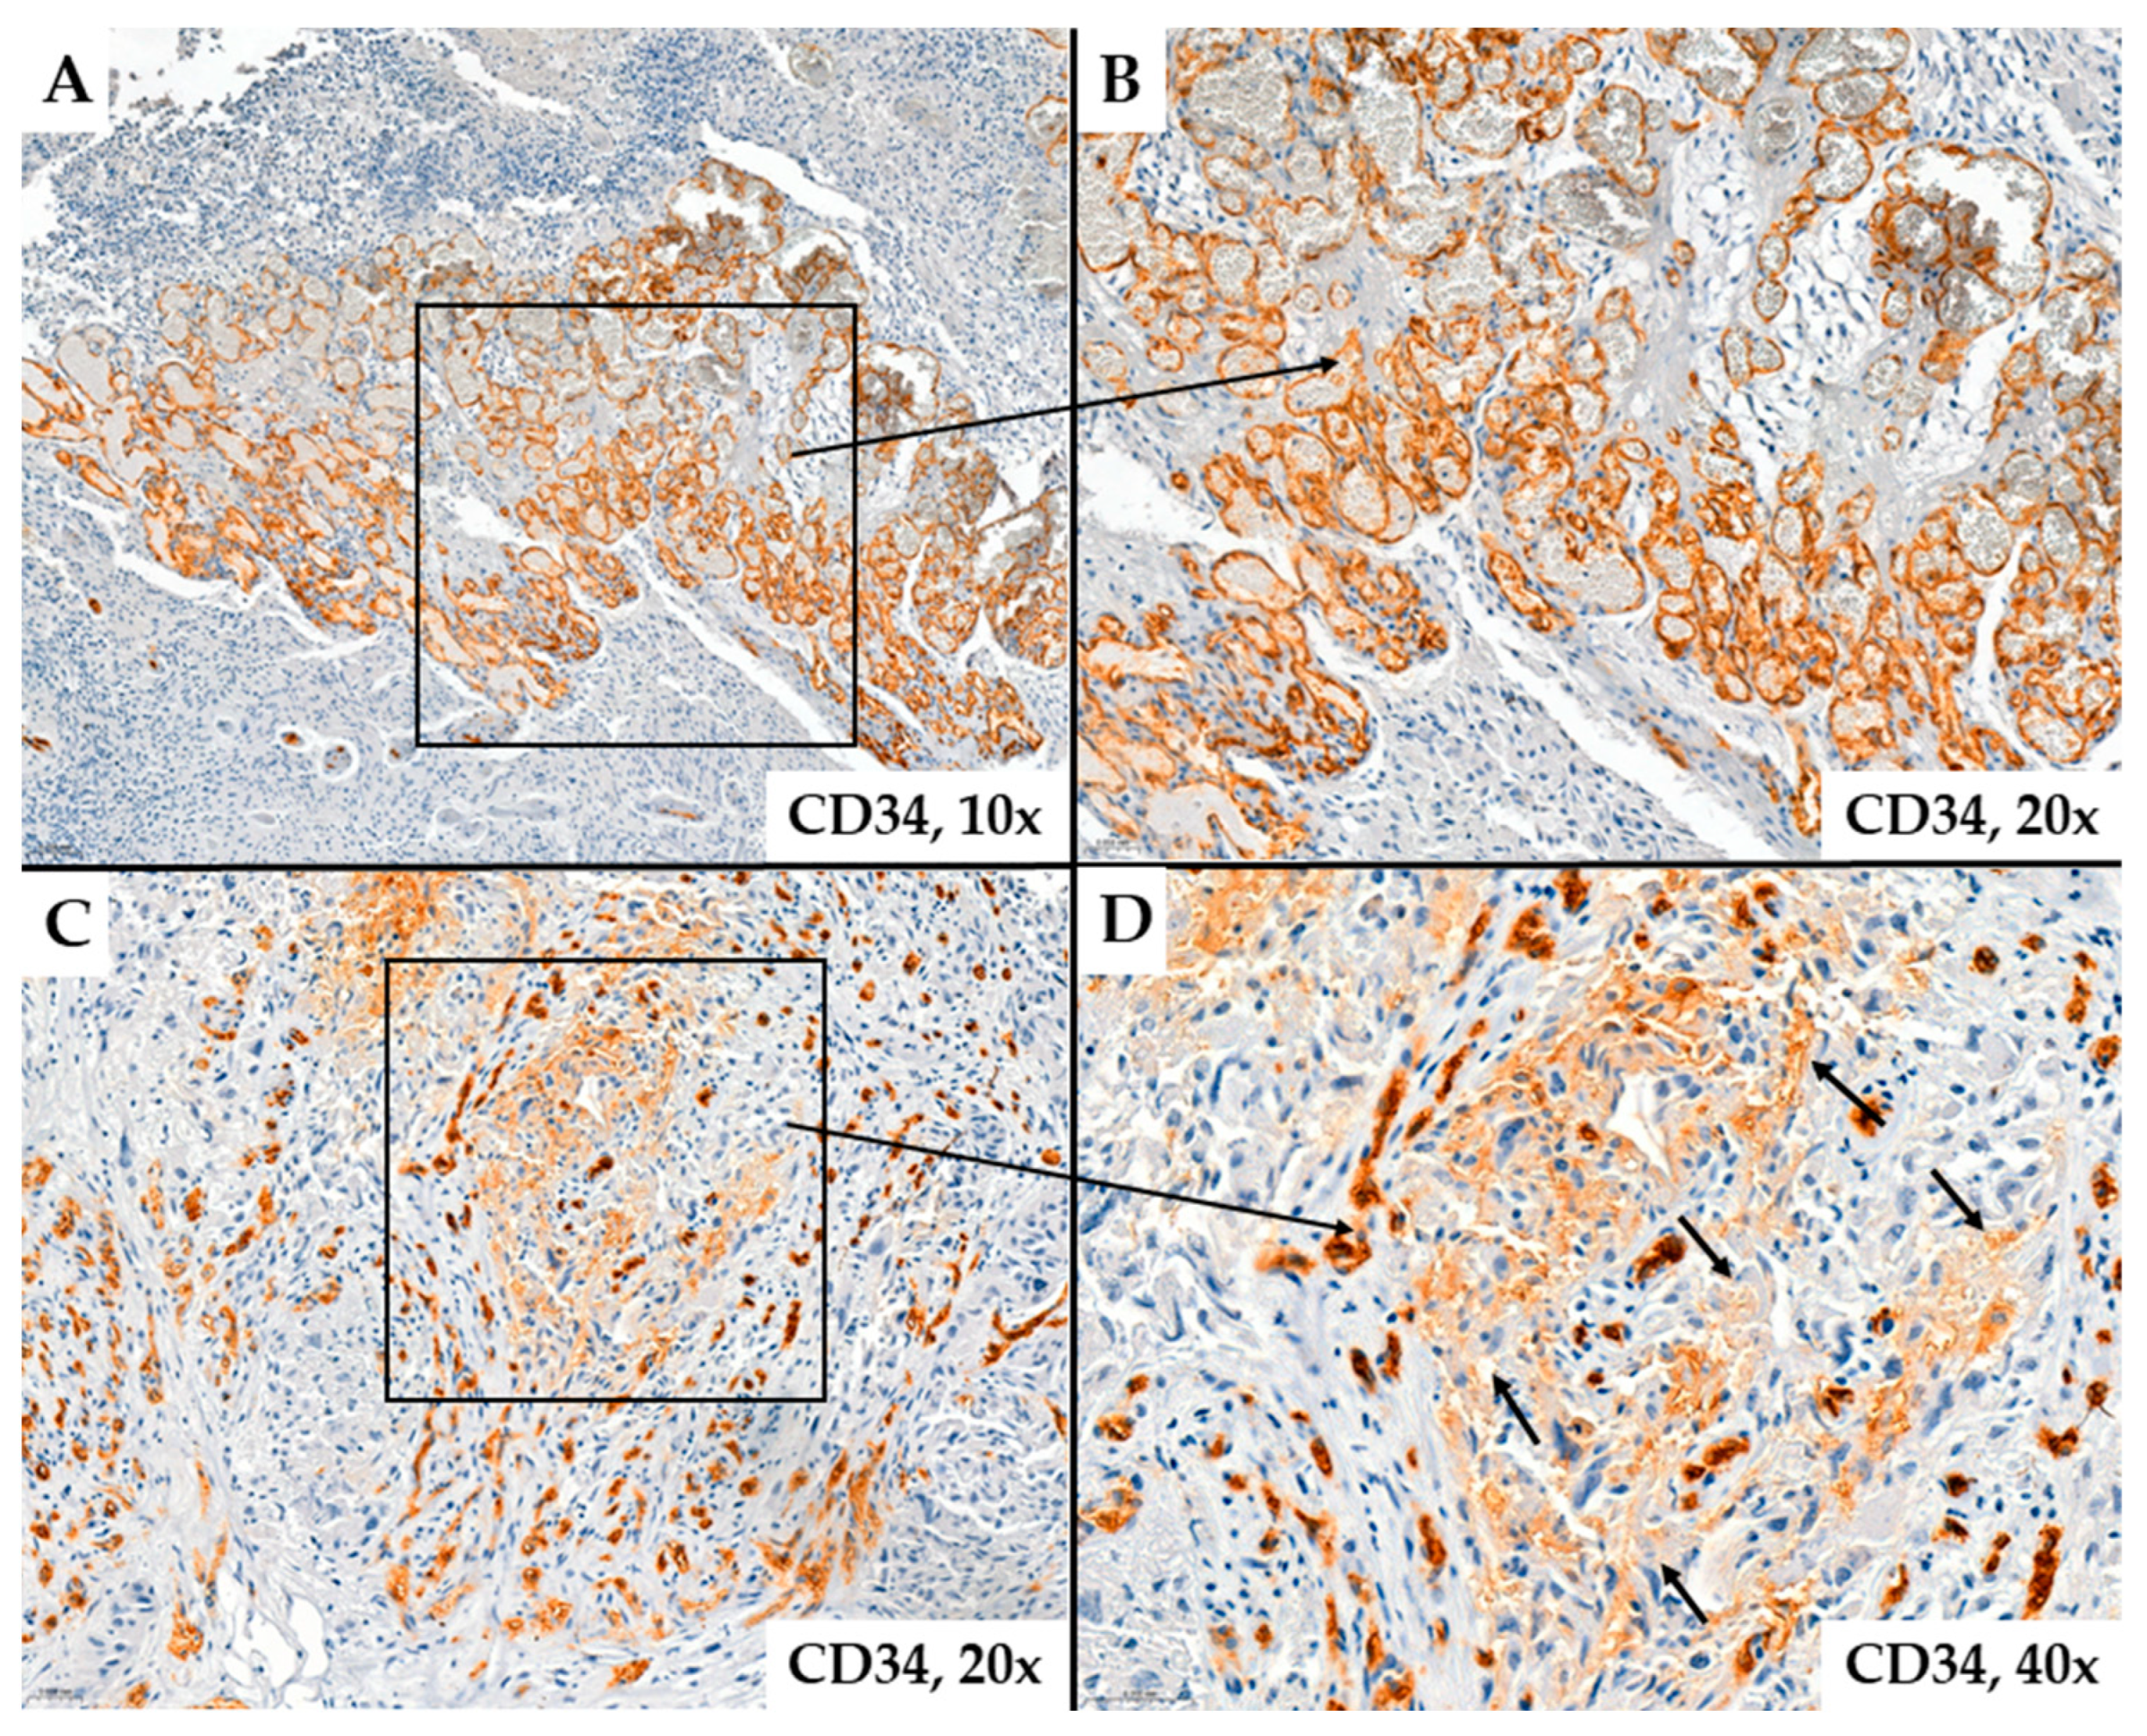
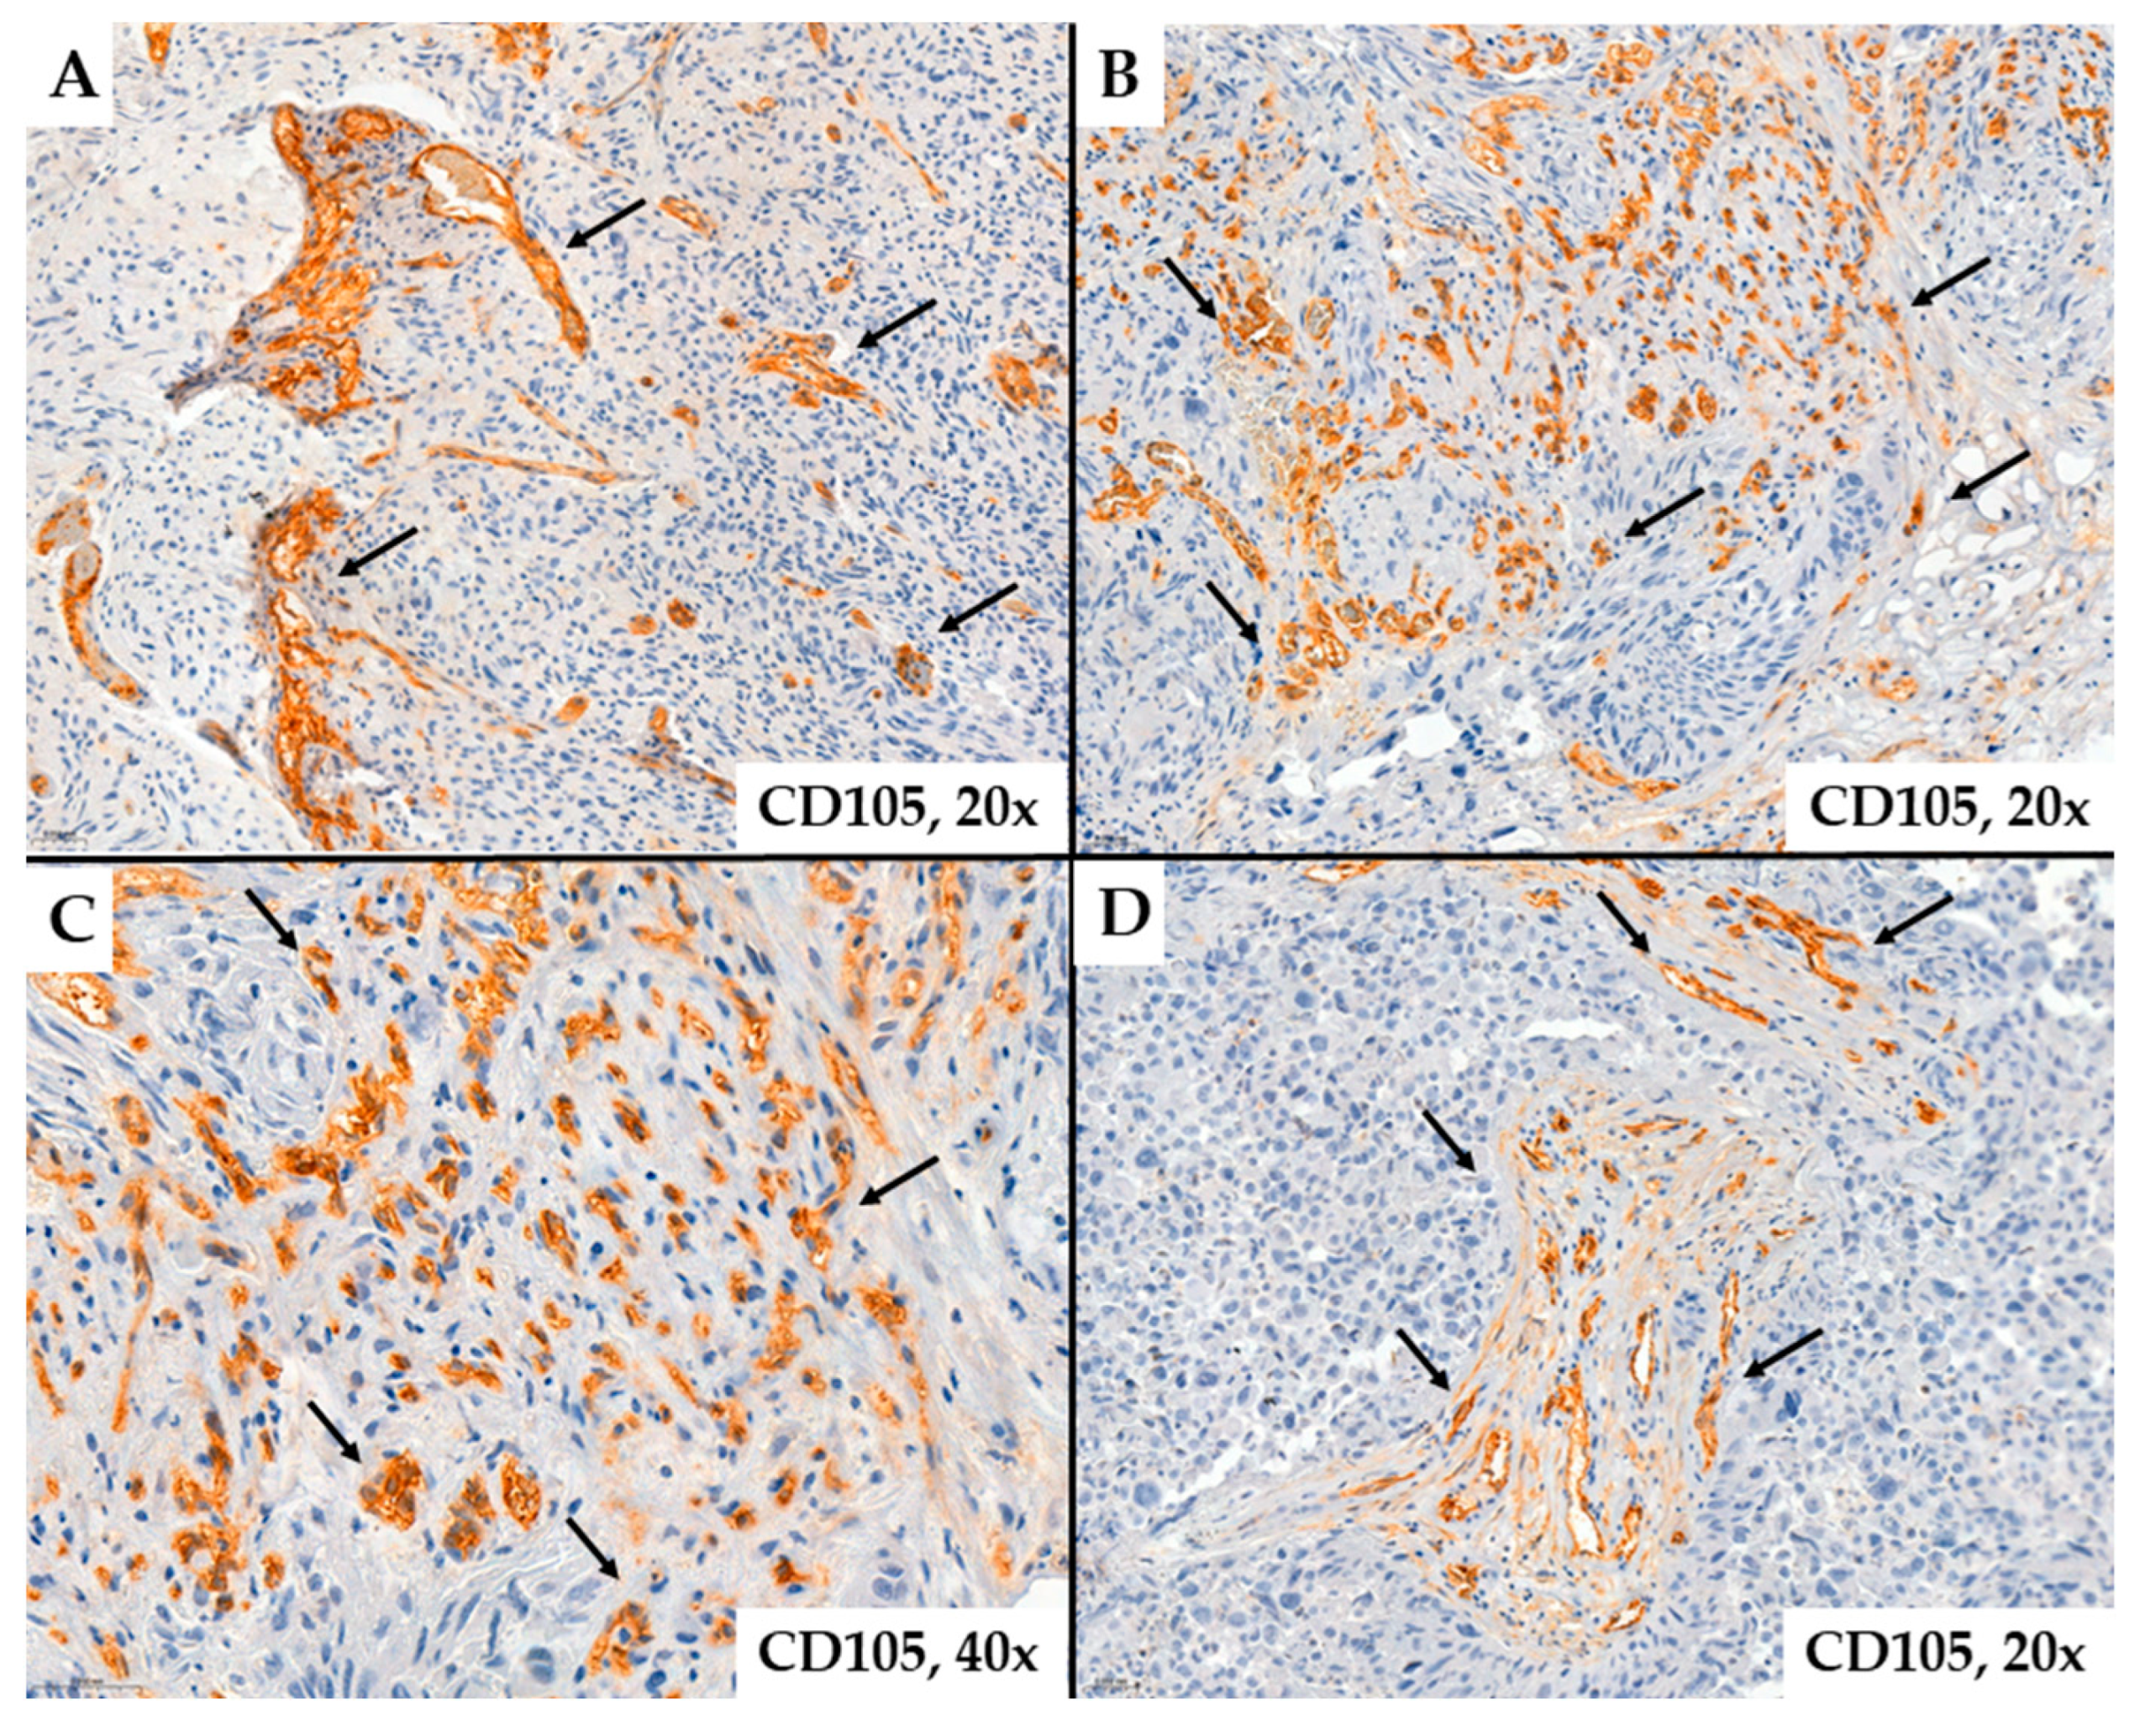
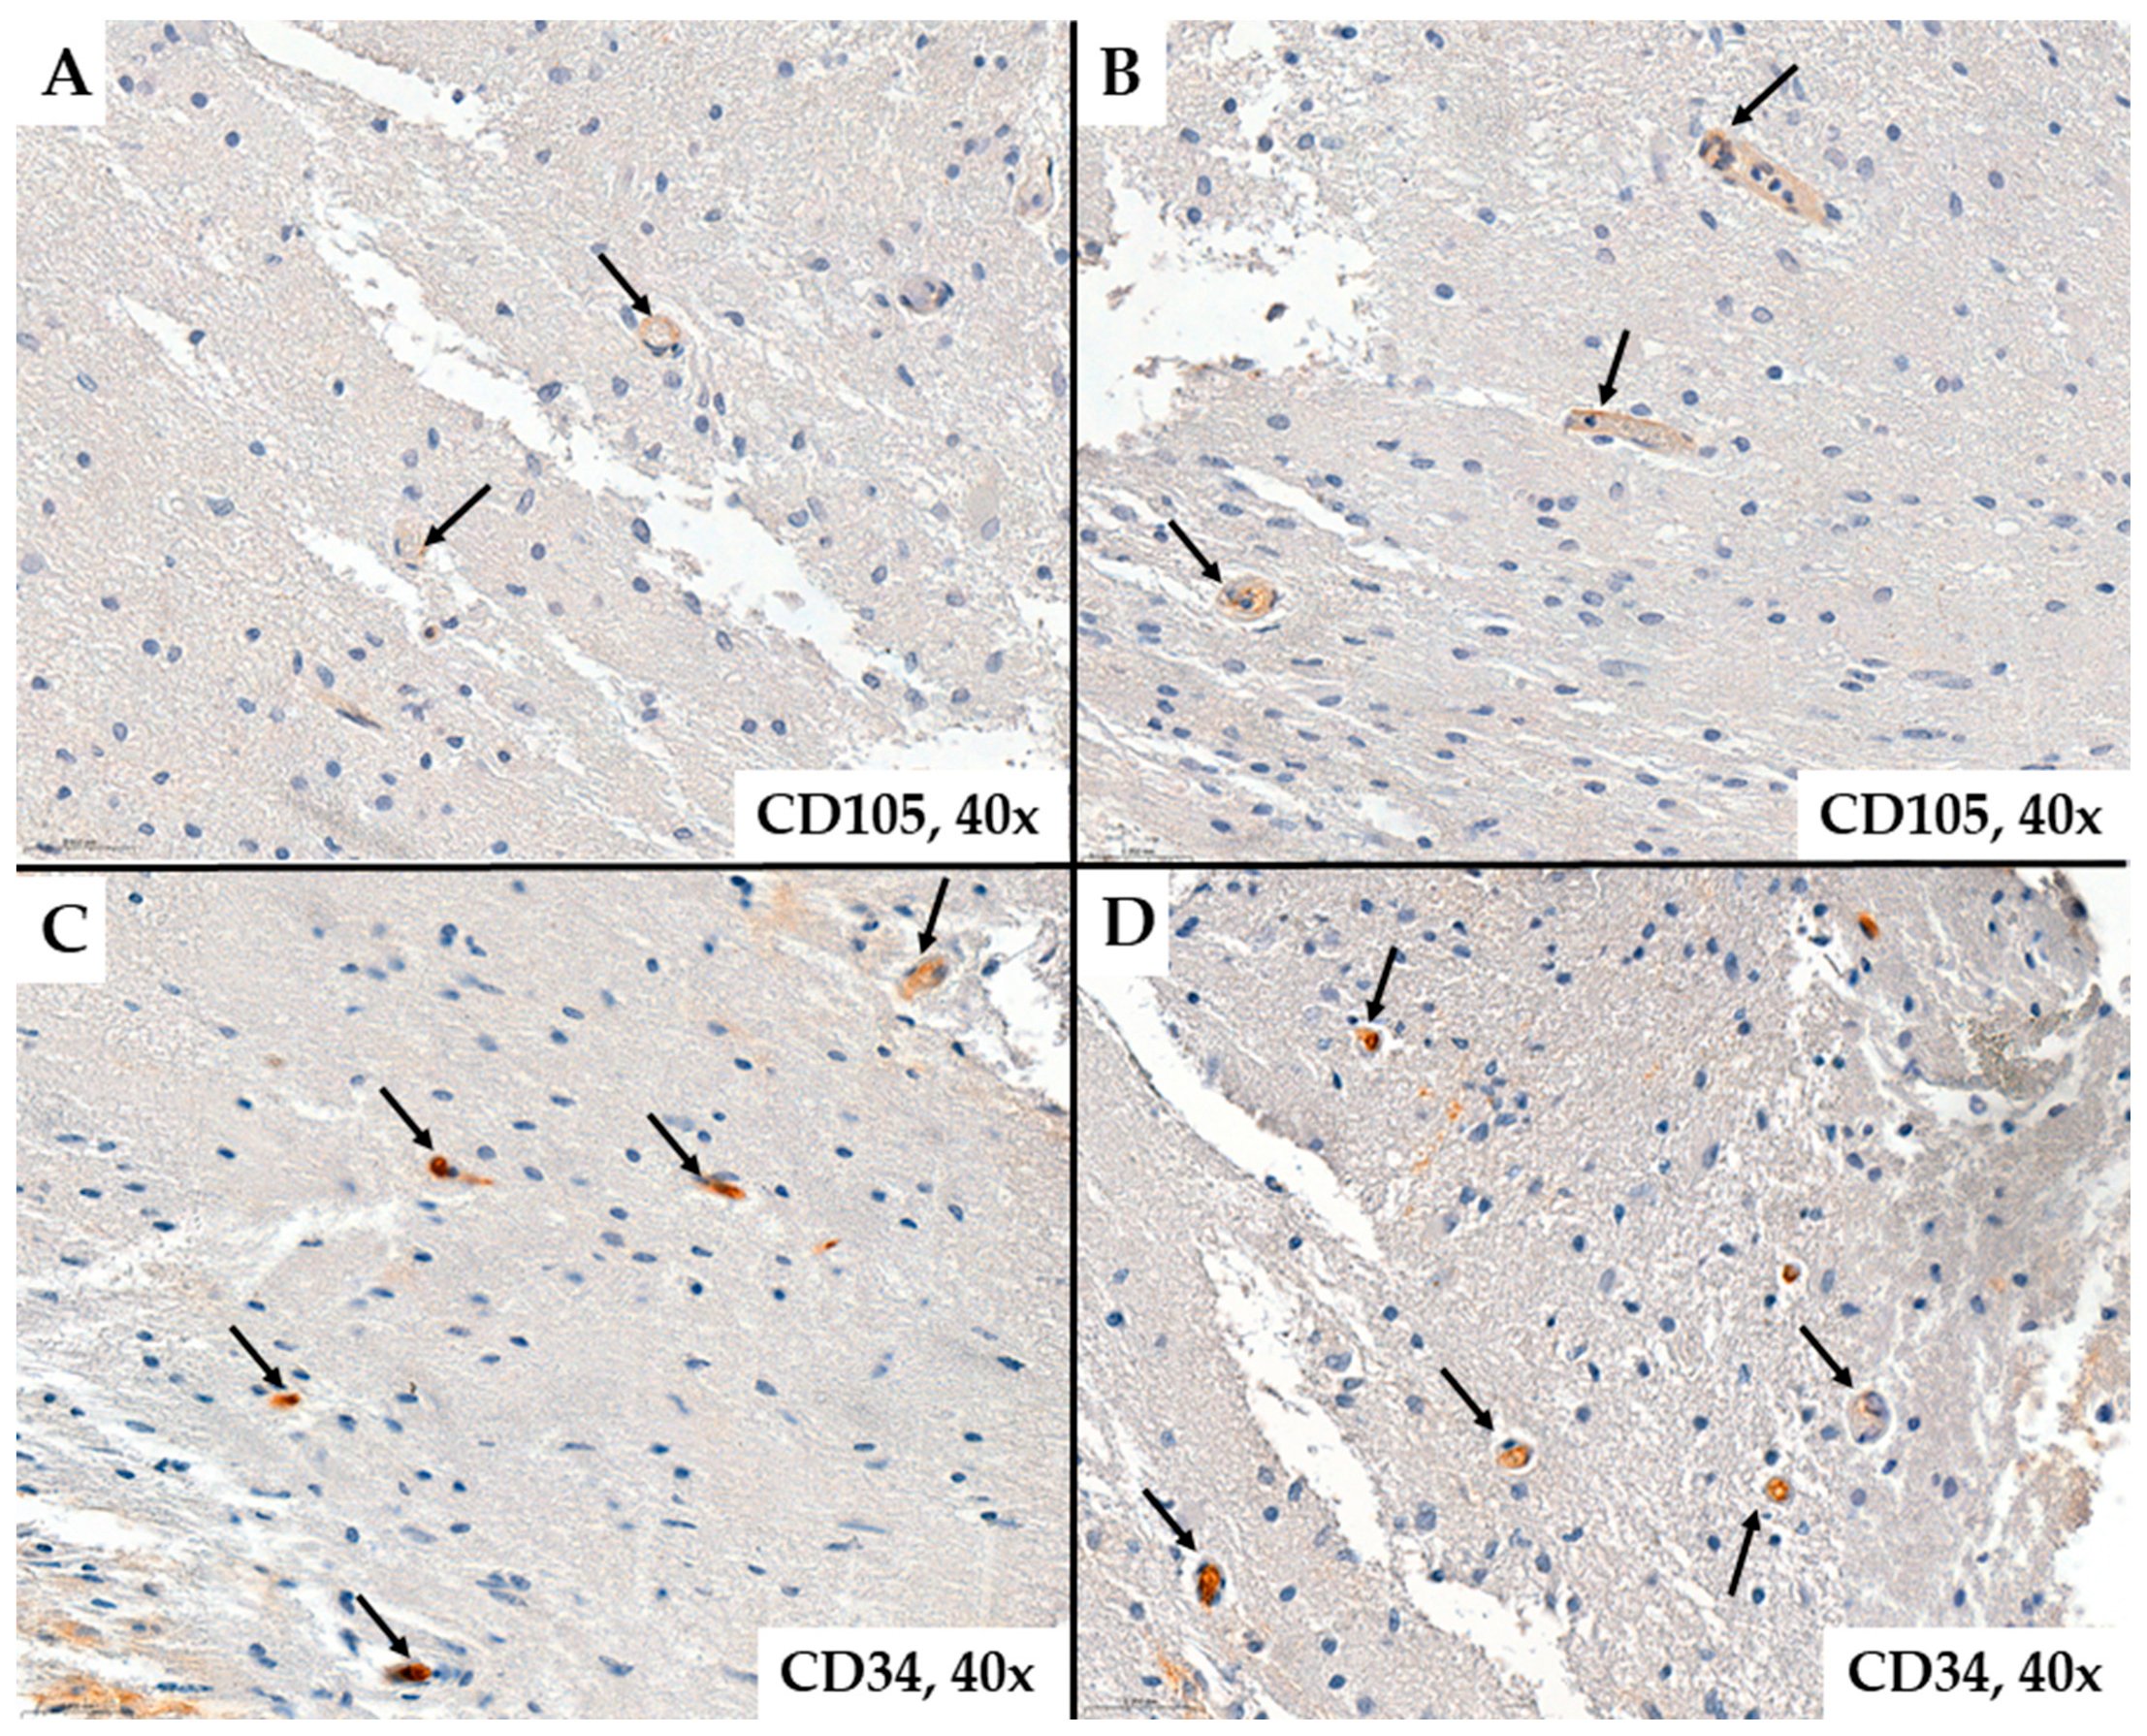
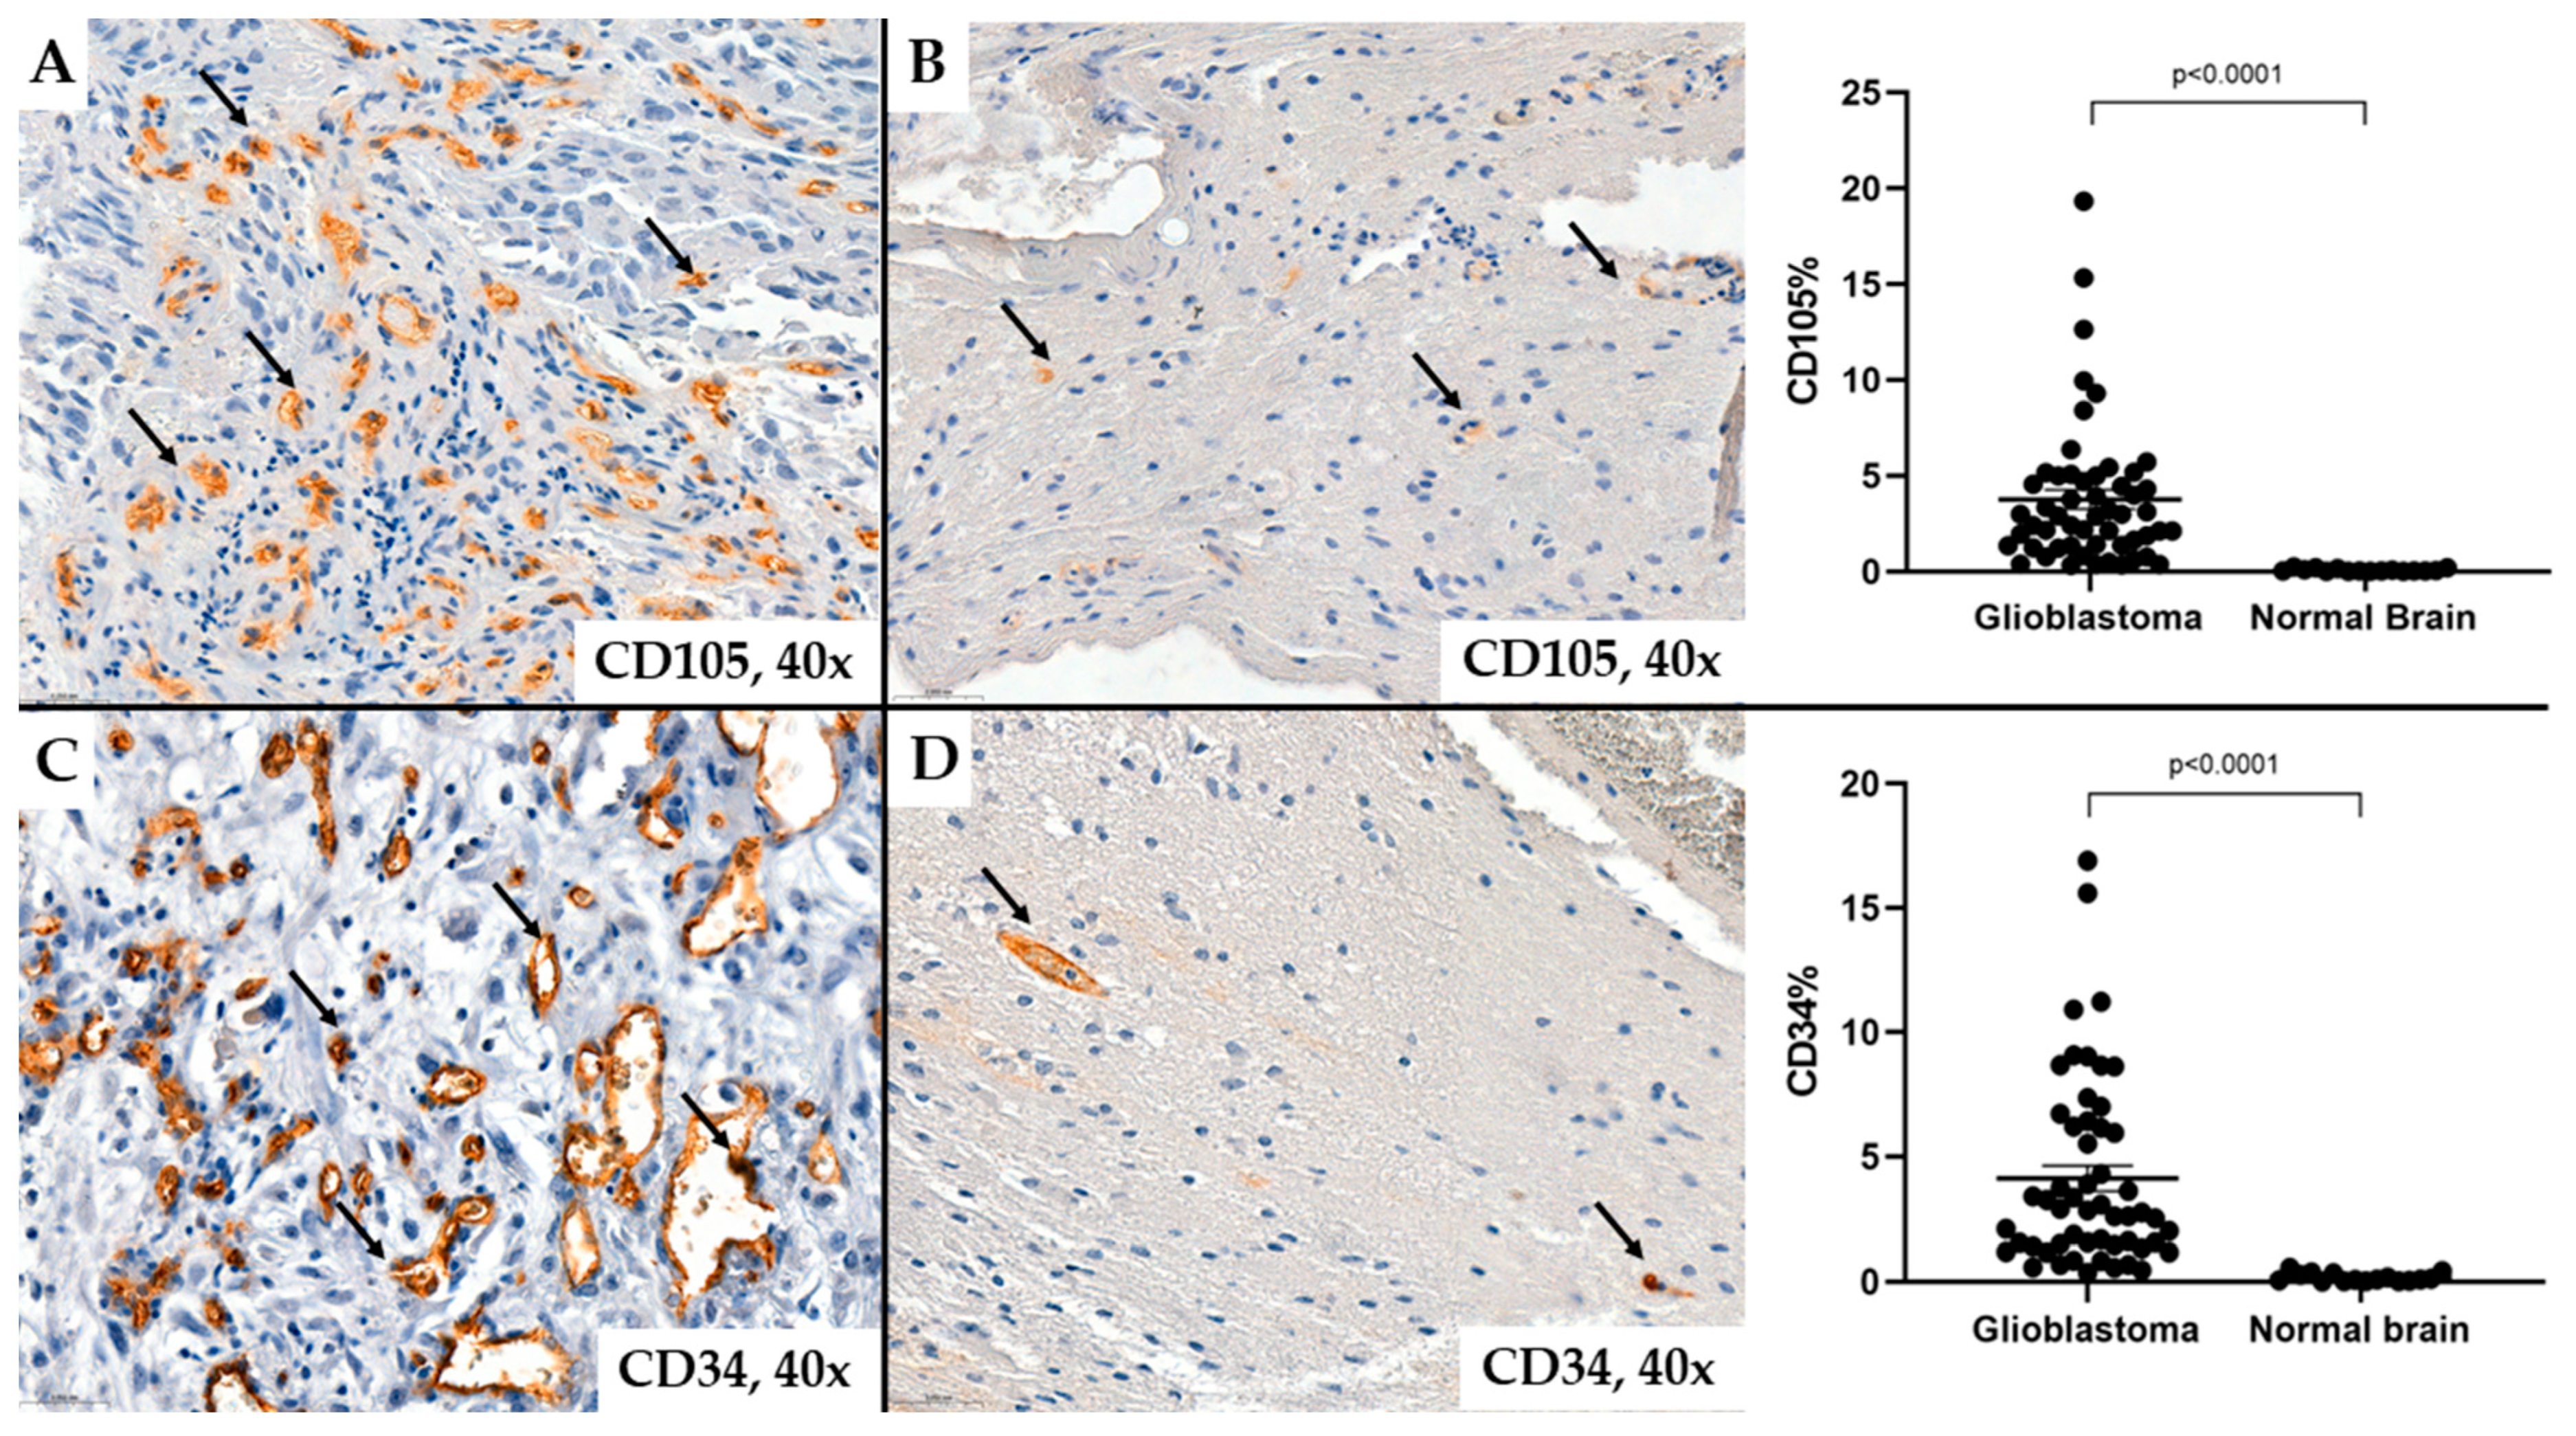
- MVD-CD34 and MVD-CD105
3. Discussion
4. Materials and Methods
4.1. Clinical Data
4.2. Immunohistochemistry
4.3. Slide Evaluation
4.4. Statistical Analysis
4.5. Study Limitation
4.6. Ethics Committee
5. Conclusions
Author Contributions
Funding
Institutional Review Board Statement
Informed Consent Statement
Data Availability Statement
Conflicts of Interest
Abbreviations
| IDH1 | isocitrate dehydrogenase 1 |
| VEGF | vascular endothelial growth factor |
| PDGF | platelet-derived growth factor |
| HIF | hypoxia-inducible factor |
| MVD | microvascular density |
| GVP | glomeruloid vascular pattern |
| MS | microvascular sprouting |
| VC | vascular cluster |
| VG | vascular garland |
References
- Wang, Y.; Luo, R.; Zhang, X.; Xiang, H.; Yang, B.; Feng, J.; Deng, M.; Ran, P.; Sujie, A.; Zhang, F.; et al. Proteogenomics of diffuse gliomas reveal molecular subtypes associated with specific therapeutic targets and immune-evasion mechanisms. Nat. Commun. 2023, 14, 505. [Google Scholar] [CrossRef] [PubMed]
- Karve, A.S.; Desai, J.M.; Gadgil, S.N.; Dave, N.; Wise-Draper, T.M.; Gudelsky, G.A.; Phoenix, T.N.; DasGupta, B.; Yogendran, L.; Sengupta, S.; et al. A Review of Approaches to Potentiate the Activity of Temozolomide against Glioblastoma to Overcome Resistance. Int. J. Mol. Sci. 2024, 25, 3217. [Google Scholar] [CrossRef] [PubMed]
- Gupta, M.; Anjari, M.; Brandner, S.; Fersht, N.; Wilson, E.; Thust, S.; Kosmin, M. Isocitrate Dehydrogenase 1/2 Wildtype Adult Astrocytoma with WHO Grade 2/3 Histological Features: Molecular Re-Classification, Prognostic Factors, Clinical Outcomes. Biomedicines 2024, 12, 901. [Google Scholar] [CrossRef] [PubMed]
- Lan, Z.; Li, X.; Zhang, X. Glioblastoma: An Update in Pathology, Molecular Mechanisms and Biomarkers. Int. J. Mol. Sci. 2024, 25, 3040. [Google Scholar] [CrossRef] [PubMed]
- Smerdi, D.; Moutafi, M.; Kotsantis, I.; Stavrinou, L.C.; Psyrri, A. Overcoming Resistance to Temozolomide in Glioblastoma: A Scoping Review of Preclinical and Clinical Data. Life 2024, 14, 673. [Google Scholar] [CrossRef]
- Grochans, S.; Cybulska, A.M.; Simińska, D.; Korbecki, J.; Kojder, K.; Chlubek, D.; Baranowska-Bosiacka, I. Epidemiology of Glioblastoma Multiforme-Literature Review. Cancers 2022, 14, 2412. [Google Scholar] [CrossRef] [PubMed]
- Ostrom, Q.T.; Price, M.; Neff, C.; Cioffi, G.; Waite, K.A.; Kruchko, C.; Barnholtz-Sloan, J.S. CBTRUS Statistical Report: Primary Brain and Other Central Nervous System Tumors Diagnosed in the United States in 2015-2019. Neuro Oncol. 2022, 24 (Suppl. 5), v1–v95. [Google Scholar] [CrossRef] [PubMed]
- Vaz-Salgado, M.A.; Villamayor, M.; Albarrán, V.; Alía, V.; Sotoca, P.; Chamorro, J.; Rosero, D.; Barrill, A.M.; Martín, M.; Fernandez, E.; et al. Recurrent Glioblastoma: A Review of the Treatment Options. Cancers 2023, 15, 4279. [Google Scholar] [CrossRef] [PubMed]
- Singh, N.; Miner, A.; Hennis, L.; Mittal, S. Mechanisms of temozolomide resistance in glioblastoma—A comprehensive review. Cancer Drug Resist. 2021, 4, 17–43. [Google Scholar] [CrossRef]
- Obrador, E.; Moreno-Murciano, P.; Oriol-Caballo, M.; López-Blanch, R.; Pineda, B.; Gutiérrez-Arroyo, J.L.; Loras, A.; Gonzalez-Bonet, L.G.; Martinez-Cadenas, C.; Estrela, J.M.; et al. Glioblastoma Therapy: Past, Present and Future. Int. J. Mol. Sci. 2024, 25, 2529. [Google Scholar] [CrossRef]
- Sadowski, K.; Jażdżewska, A.; Kozłowski, J.; Zacny, A.; Lorenc, T.; Olejarz, W. Revolutionizing Glioblastoma Treatment: A Comprehensive Overview of Modern Therapeutic Approaches. Int. J. Mol. Sci. 2024, 25, 5774. [Google Scholar] [CrossRef] [PubMed]
- Mikkelsen, V.E.; Solheim, O.; Salvesen, Ø.; Torp, S.H. The histological representativeness of glioblastoma tissue samples. Acta Neurochir. 2021, 163, 1911–1920. [Google Scholar] [CrossRef] [PubMed]
- Louis, D.N.; Perry, A.; Reifenberger, G.; Von Deimling, A.; Figarella-Branger, D.; Cavenee, W.K.; Ohgaki, H.; Wiestler, O.D.; Kleihues, P.; Ellison, D.W. The 2016 World Health Organization Classification of Tumors of the Central Nervous System: A summary. Acta Neuropathol. 2016, 131, 803–820. [Google Scholar] [CrossRef] [PubMed]
- Jaiswal, S. Role of immunohistochemistry in the diagnosis of central nervous system tumors. Neurol. India 2016, 64, 502–512. [Google Scholar] [CrossRef] [PubMed]
- Domènech, M.; Hernández, A.; Plaja, A.; Martínez-Balibrea, E.; Balañà, C. Hypoxia: The Cornerstone of Glioblastoma. Int. J. Mol. Sci. 2021, 22, 12608. [Google Scholar] [CrossRef] [PubMed]
- Wirsching, H.G.; Roth, P.; Weller, M. A vasculature-centric approach to developing novel treatment options for glioblastoma. Expert Opin. Ther. Targets 2021, 25, 87–100. [Google Scholar] [CrossRef] [PubMed]
- Jha, K.; Pant, I.; Singh, R.; Bansal, A.K.; Chaturvedi, S. Assessment of microvascular patterns and density in glioblastoma and their correlation with matrix metalloproteinase-9, p53, glial fibrillary acidic protein, and Ki-67. Glioma 2018, 1, 201. [Google Scholar] [CrossRef]
- Jhaveri, N.; Chen, T.C.; Hofman, F.M. Tumor vasculature and glioma stem cells: Contributions to glioma progression. Cancer Lett. 2016, 380, 545–551. [Google Scholar] [CrossRef]
- Maddison, K.; Bowden, N.A.; Graves, M.C.; Tooney, P.A. Characteristics of vasculogenic mimicry and tumour to endothelial transdifferentiation in human glioblastoma: A systematic review. BMC Cancer 2023, 23, 185. [Google Scholar] [CrossRef]
- Liu, X.M.; Zhang, Q.P.; Mu, Y.G.; Zhang, X.H.; Sai, K.; Pang, J.C.S.; Ng, H.K.; Chen, Z.P. Clinical significance of vasculogenic mimicry in human gliomas. J. Neurooncol. 2011, 105, 173–179. [Google Scholar] [CrossRef]
- Nery de Albuquerque Rego, G.; da Hora Alves, A.; Penteado Nucci, M.; Mamani, J.B.; de Oliveira, F.A.; Gamarra, L.F. Antiangiogenic Targets for Glioblastoma Therapy from a Pre-Clinical Approach, Using Nanoformulations. Int. J. Mol. Sci. 2020, 21, 4490. [Google Scholar] [CrossRef] [PubMed]
- Wick, W.; Gorlia, T.; Bendszus, M.; Taphoorn, M.; Sahm, F.; Harting, I.; Brandes, A.A.; Taal, W.; Domont, J.; Idbaih, A.; et al. Lomustine and Bevacizumab in Progressive Glioblastoma. N. Engl. J. Med. 2017, 377, 1954–1963. [Google Scholar] [CrossRef]
- Kong, X.; Guan, J.; Ma, W.; Li, Y.; Xing, B.; Yang, Y.; Wang, Y.; Gao, J.; Wei, J.; Yao, Y.; et al. CD34 Over-Expression is Associated With Gliomas’ Higher WHO Grade. Medicine 2016, 95, e2830. [Google Scholar] [CrossRef] [PubMed]
- Kong, X.; Wang, Y.; Liu, S.; Xing, B.; Yang, Y.; Li, Y.; Ren, Z.; Su, C.; Ma, W.; Wang, R. CD105 Over-expression Is Associated with Higher WHO Grades for Gliomas. Mol. Neurobiol. 2016, 53, 3503–3512. [Google Scholar] [CrossRef] [PubMed]
- Li, J.; Ek, F.; Olsson, R.; Belting, M.; Bengzon, J. Glioblastoma CD105+ cells define a SOX2- cancer stem cell-like subpopulation in the pre-invasive niche. Acta Neuropathol. Commun. 2022, 10, 126. [Google Scholar] [CrossRef] [PubMed]
- Tamma, R.; Ingravallo, G.; Annese, T.; d’Amati, A.; Lorusso, L.; Ribatti, D. Tumor Microenvironment and Microvascular Density in Human Glioblastoma. Cells 2022, 12, 11. [Google Scholar] [CrossRef] [PubMed]
- Lynes, J.P.; Nwankwo, A.K.; Sur, H.P.; Sanchez, V.E.; Sarpong, K.A.; Ariyo, O.I.; Dominah, G.A.; Nduom, E.K. Biomarkers for immunotherapy for treatment of glioblastoma. J. Immunother. Cancer 2020, 8, e000348. [Google Scholar] [CrossRef] [PubMed]
- Martinez-Lage, M.; Lynch, T.M.; Bi, Y.; Cocito, C.; Way, G.P.; Pal, S.; Haller, J.; Yan, R.E.; Ziober, A.; Nguyen, A.; et al. Immune landscapes associated with different glioblastoma molecular subtypes. Acta Neuropathol. Commun. 2019, 7, 203. [Google Scholar] [CrossRef] [PubMed]
- Munthe, S.; Petterson, S.A.; Dahlrot, R.H.; Poulsen, F.R.; Hansen, S.; Kristensen, B.W. Glioma Cells in the Tumor Periphery Have a Stem Cell Phenotype. PLoS ONE 2016, 11, e0155106. [Google Scholar] [CrossRef]
- Takano, S.; Ishikawa, E.; Sakamoto, N.; Matsuda, M.; Akutsu, H.; Noguchi, M.; Kato, Y.; Yamamoto, T.; Matsumura, A. Immunohistochemistry on IDH 1/2, ATRX, p53 and Ki-67 substitute molecular genetic testing and predict patient prognosis in grade III adult diffuse gliomas. Brain Tumor Pathol. 2016, 33, 107–116. [Google Scholar] [CrossRef]
- Chang, S.J.; Tu, H.P.; Lai, Y.C.; Luo, C.W.; Nejo, T.; Tanaka, S.; Chai, C.Y.; Kwan, A.L. Increased Vascular Adhesion Protein 1 (VAP-1) Levels are Associated with Alternative M2 Macrophage Activation and Poor Prognosis for Human Gliomas. Diagnostics 2020, 10, 256. [Google Scholar] [CrossRef]
- Polívka, J., Jr.; Pešta, M.; Pitule, P.; Hes, O.; Holubec, L.; Kubíková, T.; Tonar, Z. IDH1 mutation is associated with lower expression of VEGF but not microvessel formation in glioblastoma multiforme. Oncotarget 2018, 9, 16462–16476. [Google Scholar] [CrossRef] [PubMed]
- Deacu, M.; Docu Axelerad, A.; Popescu, S.; Topliceanu, T.S.; Aschie, M.; Bosoteanu, M.; Cozaru, G.C.; Cretu, A.M.; Voda, R.I.; Orasanu, C.I. Aggressiveness of Grade 4 Gliomas of Adults. Clin. Pract. 2022, 12, 701–713. [Google Scholar] [CrossRef] [PubMed]
- Chen, J.; Mao, S.; He, Z.; Yang, L.; Zhang, J.; Lin, J.-M.; Lin, Z.-X. Proteomic Distributions in CD34+ Microvascular Niche Patterns of Glioblastoma. J. Histochem. Cytochem. 2022, 70, 99–110. [Google Scholar] [CrossRef] [PubMed]
- Shamshiripour, P.; Hajiahmadi, F.; Lotfi, S.; Esmaeili, N.R.; Zare, A.; Akbarpour, M.; Ahmadvand, D. Next-Generation Anti-Angiogenic Therapies as a Future Prospect for Glioma Immunotherapy; From Bench to Bedside. Front. Immunol. 2022, 13, 859633. [Google Scholar] [CrossRef] [PubMed]
- Rosińska, S.; Gavard, J. Tumor Vessels Fuel the Fire in Glioblastoma. Int. J. Mol. Sci. 2021, 22, 6514. [Google Scholar] [CrossRef] [PubMed]
- Fan, C.; Zhang, J.; Liu, Z.; He, M.; Kang, T.; Du, T.; Song, Y.; Fan, Y.; Xu, J. Prognostic role of microvessel density in patients with glioma. Medicine 2019, 98, e14695. [Google Scholar] [CrossRef] [PubMed]
- Clara, C.A.; Marie, S.K.; de Almeida, J.R.; Wakamatsu, A.; Oba-Shinjo, S.M.; Uno, M.; Neville, M.; Rosemberg, S. Angiogenesis and expression of PDGF-C, VEGF, CD105 and HIF-1α in human glioblastoma. Neuropathology 2014, 34, 343–352. [Google Scholar] [CrossRef] [PubMed]
- Afshar Moghaddam, N.; Mahsuni, P.; Taheri, D. Evaluation of Endoglin as an Angiogenesis Marker in Glioblastoma. Iran J. Pathol. 2015, 10, 89–96. [Google Scholar] [PubMed]
- Mikkelsen, V.E.; Stensjøen, A.L.; Granli, U.S.; Berntsen, E.M.; Salvesen, Ø.; Solheim, O.; Torp, S.H. Angiogenesis and radiological tumor growth in patients with glioblastoma. BMC Cancer 2018, 18, 862. [Google Scholar] [CrossRef] [PubMed]
- McGahan, B.G.; Neilsen, B.K.; Kelly, D.L.; McComb, R.D.; Kazmi, S.A.J.; White, M.L.; Zhang, Y.; Aizenberg, M.R. Assessment of vascularity in glioblastoma and its implications on patient outcomes. J. Neurooncol. 2017, 132, 35–44. [Google Scholar] [CrossRef] [PubMed]
- Alkhaibary, A.; Alassiri, A.H.; AlSufiani, F.; Alharbi, M.A. Ki-67 labeling index in glioblastoma; does it really matter? Hematol. Oncol. Stem Cell Ther. 2019, 12, 82–88. [Google Scholar] [CrossRef] [PubMed]
- Bastos, A.G.P.; Carvalho, B.; Silva, R.; Leitão, D.; Linhares, P.; Vaz, R.; Lima, J. Endoglin (CD105) and proliferation index in recurrent glioblastoma treated with anti-angiogenic therapy. Front. Oncol. 2022, 12, 910196. [Google Scholar] [CrossRef]
- Burghardt, I.; Ventura, E.; Weiss, T.; Schroeder, J.J.; Seystahl, K.; Zielasek, C.; Gramatzki, D.; Weller, M. Endoglin and TGF-β signaling in glioblastoma. Cell Tissue Res. 2021, 384, 613–624. [Google Scholar] [CrossRef]
- Mihić, J.; Rotim, K.; Vučić, M.; Hude Dragičević, I.; Borić, M.; Lugović-Mihić, L. Prognostic Role of Cd44 Expression and Neovascularization Determined by Endoglin (Cd105) in Glioblastoma Patients. Acta Clin. Croat. 2019, 58, 455–462. [Google Scholar] [CrossRef]
- Behrem, S.; Zarkovic, K.; Eskinja, N.; Jonjic, N. Endoglin is a better marker than CD31 in evaluation of angiogenesis in glioblastoma. Croat. Med. J. 2005, 46, 417–422. [Google Scholar]
- Tamura, R.; Ohara, K.; Sasaki, H.; Morimoto, Y.; Yoshida, K.; Toda, M. Histopathological vascular investigation of the peritumoral brain zone of glioblastomas. J. Neurooncol. 2018, 136, 233–241. [Google Scholar] [CrossRef]
- Maddison, K.; Faulkner, S.; Graves, M.C.; Fay, M.; Bowden, N.A.; Tooney, P.A. Vasculogenic Mimicry Occurs at Low Levels in Primary and Recurrent Glioblastoma. Cancers 2023, 15, 3922. [Google Scholar] [CrossRef] [PubMed]
- Pellerino, A.; Bruno, F.; Soffietti, R.; Rudà, R. Antiangiogenic Therapy for Malignant Brain Tumors: Does It Still Matter? Curr. Oncol. Rep. 2023, 25, 777–785. [Google Scholar] [CrossRef]
- Mosteiro, A.; Pedrosa, L.; Ferrés, A.; Diao, D.; Sierra, À.; González, J.J. The Vascular Microenvironment in Glioblastoma: A Comprehensive Review. Biomedicines 2022, 10, 1285. [Google Scholar] [CrossRef]
- Ahluwalia, M.S.; Rogers, L.R.; Chaudhary, R.; Newton, H.; Ozair, A.; Khosla, A.A.; Nixon, A.B.; Adams, B.J.; Seon, B.K.; Peereboom, D.M.; et al. Endoglin inhibitor TRC105 with or without bevacizumab for bevacizumab-refractory glioblastoma (ENDOT): A multicenter phase II trial. Commun. Med. 2023, 3, 120. [Google Scholar] [CrossRef] [PubMed] [PubMed Central]
- Cruz Da Silva, E.; Mercier, M.C.; Etienne-Selloum, N.; Dontenwill, M.; Choulier, L. A Systematic Review of Glioblastoma-Targeted Therapies in Phases II, III, IV Clinical Trials. Cancers 2021, 13, 1795. [Google Scholar] [CrossRef] [PubMed]
- Mu, L.; Yang, C.; Gao, Q.; Long, Y.; Ge, H.; DeLeon, G.; Jin, L.; Chang, Y.E.; Sayour, E.J.; Ji, J.; et al. CD4+ and Perivascular Foxp3+ T Cells in Glioma Correlate with Angiogenesis and Tumor Progression. Front. Immunol. 2017, 8, 1451. [Google Scholar] [CrossRef] [PubMed] [PubMed Central]
- Haarmann, A.; Zimmermann, L.; Bieber, M.; Silwedel, C.; Stoll, G.; Schuhmann, M.K. Regulation and Release of Vasoactive Endoglin by Brain Endothelium in Response to Hypoxia/Reoxygenation in Stroke. Int. J. Mol. Sci. 2022, 23, 7085. [Google Scholar] [CrossRef] [PubMed]
- Sipos, T.-C.; Kövecsi, A.; Ovidiu-Ioan, Ș.; Zsuzsánna, P. General Clinico-Pathological Characteristics in Glioblastomas in Correlation with p53 and Ki67. Medicina 2023, 59, 1918. [Google Scholar] [CrossRef] [PubMed]


| N (nr) | MVD-CD34 | MVD-CD105 | ||||||
|---|---|---|---|---|---|---|---|---|
| <2% | 2–5% | >5% | p | <2% | 2–5% | >5% | p | |
| AGE | ||||||||
| <50 years | 7 | 5 | 7 | 0.24 | 7 | 6 | 6 | 0.54 |
| 50–65 years | 4 | 8 | 5 | 6 | 7 | 4 | ||
| >65 years | 10 | 3 | 5 | 6 | 10 | 2 | ||
| GENDER | ||||||||
| Male | 11 | 9 | 9 | 0.97 | 8 | 15 | 6 | 0.31 |
| Female | 10 | 7 | 8 | 11 | 8 | 6 | ||
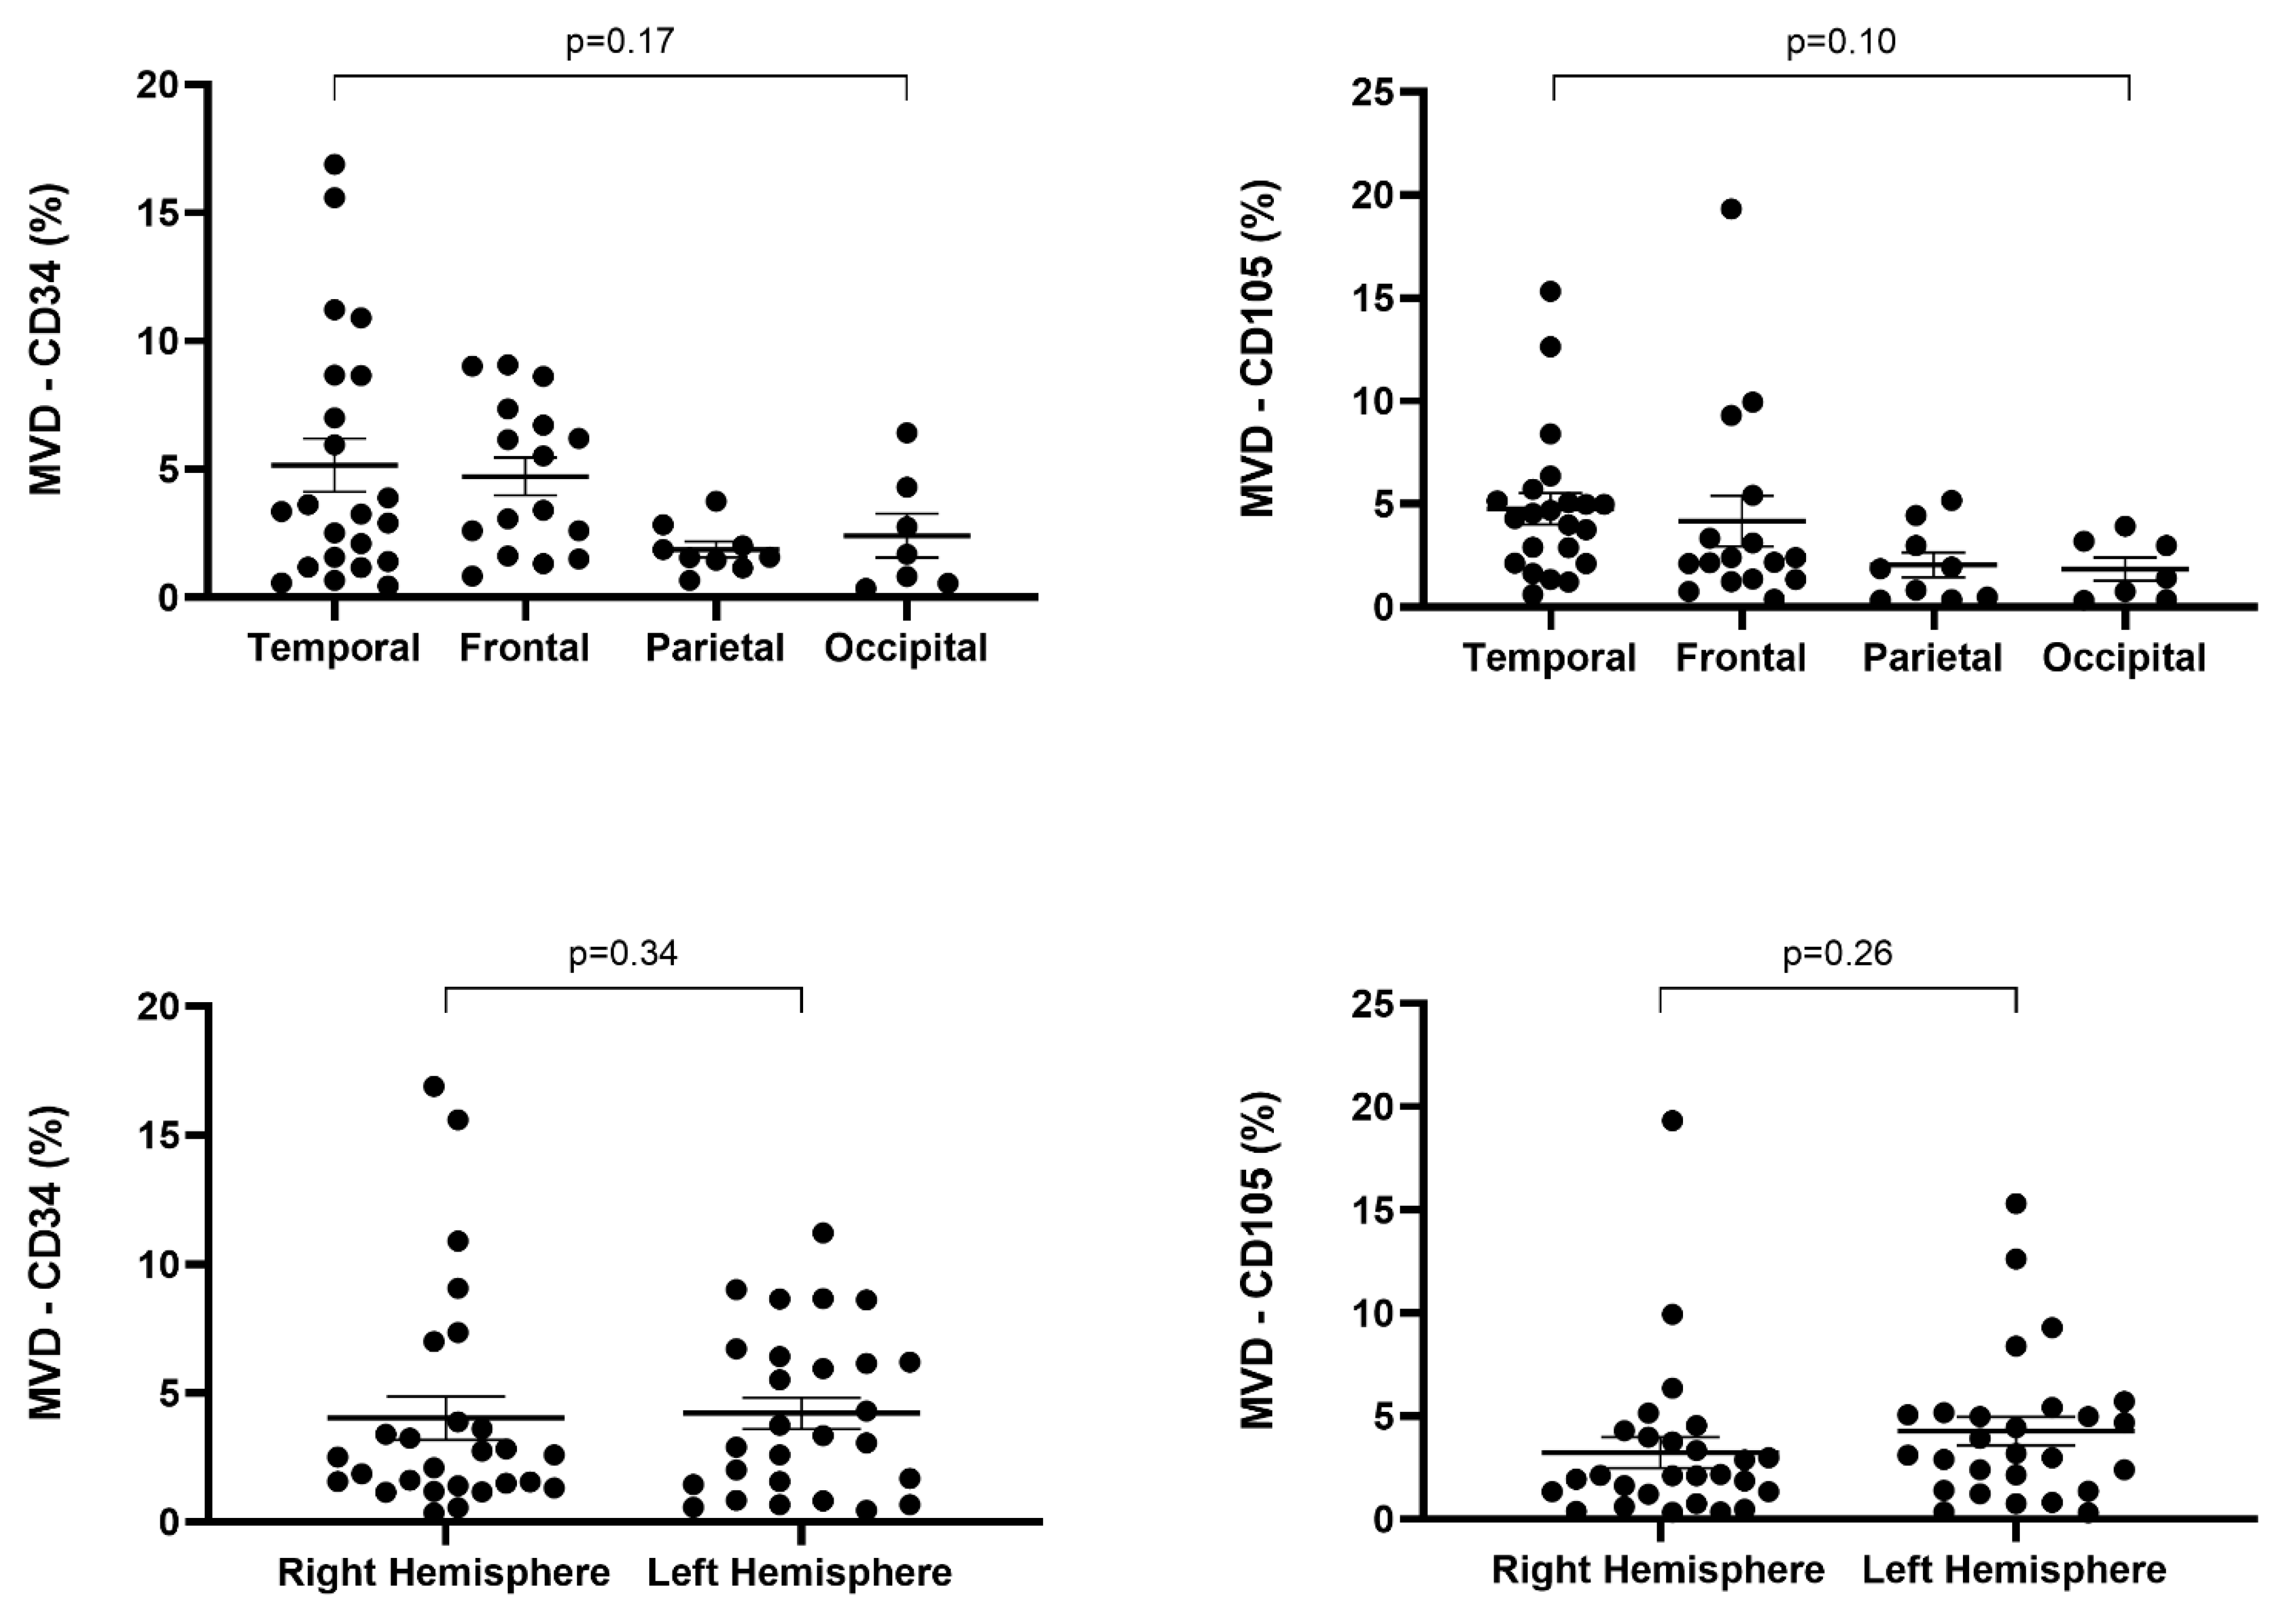
| LOCALIZATION (lobe) | ||||||||
| Frontal | 4 | 4 | 8 | 0.17 | 5 | 7 | 4 | 0.10 |
| Temporal | 7 | 7 | 8 | 4 | 11 | 7 | ||
| Parietal | 6 | 3 | 0 | 6 | 3 | 0 | ||
| Occipital | 4 | 2 | 1 | 4 | 3 | 0 | ||
| LATERALITY | ||||||||
| Right hemisphere | 12 | 9 | 6 | 0.34 | 12 | 11 | 4 | 0.26 |
| Left hemisphere | 9 | 7 | 11 | 7 | 12 | 8 | ||
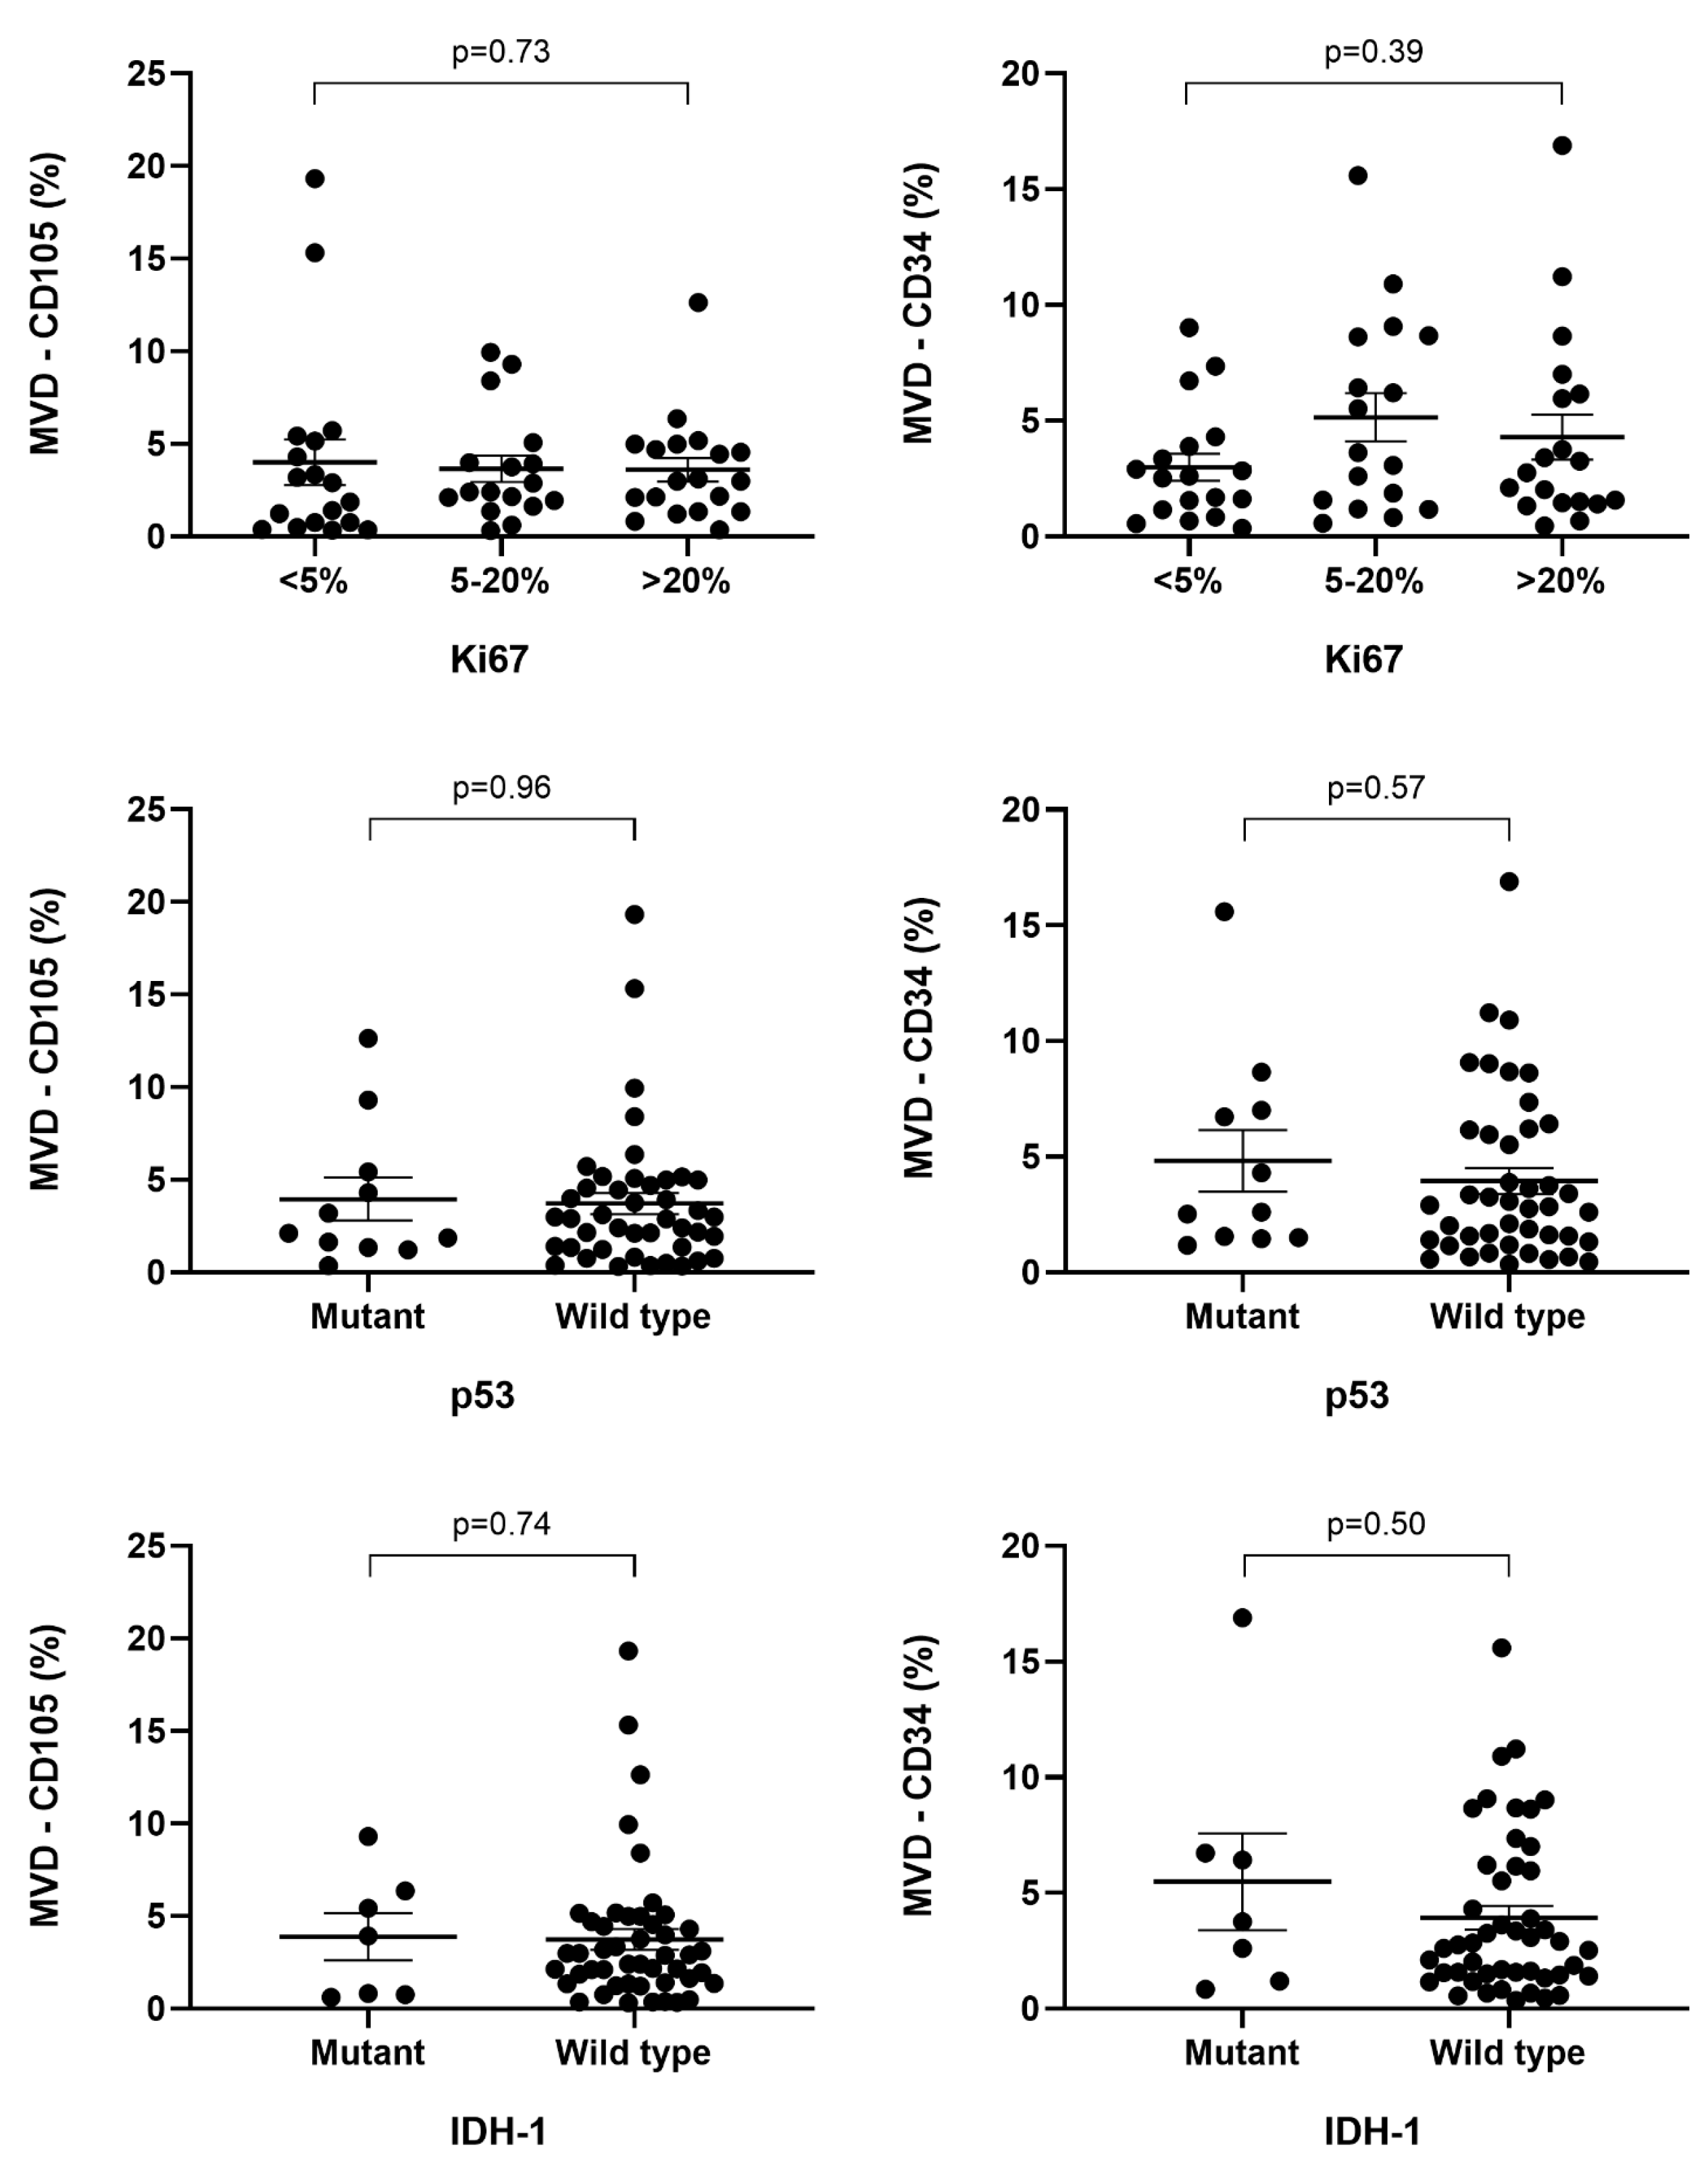
| IDH1 MUTATION | ||||||||
| IDH1 Wild Type | 19 | 14 | 14 | 0.75 | 16 | 22 | 9 | 0.2 |
| IDH1 Mutant Type | 2 | 2 | 3 | 3 | 1 | 3 | ||
| p53 MUTATION | ||||||||
| Mutant type | 4 | 3 | 4 | 0.92 | 5 | 3 | 3 | 0.51 |
| Wild type | 17 | 13 | 13 | 14 | 20 | 9 | ||
| Ki67 | ||||||||
| <5% | 8 | 7 | 3 | 0.38 | 9 | 4 | 5 | 0.26 |
| 5–20% | 6 | 3 | 8 | 5 | 8 | 4 | ||
| >20% | 7 | 6 | 6 | 5 | 11 | 3 | ||
| ATRX | ||||||||
| Wild type | 17 | 11 | 11 | 0.5 | 14 | 19 | 6 | 0.12 |
| Mutant type | 4 | 5 | 6 | 5 | 4 | 6 | ||
| IDH1 | ||||
| Mutant | Wild | p | ||
| CD34% | 3.75 (1.89–6.57) | 2.76 (1.48–6.05) | 0.503 | |
| CD105% | 3.92 (0.80–5.90) | 2.89 (1.38–4.63) | 0.748 | |
| p53 | ||||
| Mutant | Wild | p | ||
| CD34% | 2.6 (1.53–6.86) | 2.84 (1.36–6.05) | 0.577 | |
| CD105% | 2.12 (1.48–4.87) | 2.9 (1.36–4.84) | 0.966 | |
| ATRX | ||||
| Mutant | Wild | p | ||
| CD34% | 3.75 (2.11–7.69) | 2.53 (1.43–5.74) | 0.105 | |
| CD105% | 3.92 (1.03–6.04) | 2.4 (1.38–4.50) | 0.39 | |
| Ki67 | ||||
| <5% | 5–20% | >20% | p | |
| CD34% | 2.56 (1.16–3.89) | 3.62 (1.57–8.63) | 2.76 (1.48–6.05) | 0.393 |
| CD105% | 2.39 (0.76–5.15) | 2.39 (1.95–3.99) | 2.99 (1.73–4.84) | 0.73 |
Disclaimer/Publisher’s Note: The statements, opinions and data contained in all publications are solely those of the individual author(s) and contributor(s) and not of MDPI and/or the editor(s). MDPI and/or the editor(s) disclaim responsibility for any injury to people or property resulting from any ideas, methods, instructions or products referred to in the content. |
© 2024 by the authors. Licensee MDPI, Basel, Switzerland. This article is an open access article distributed under the terms and conditions of the Creative Commons Attribution (CC BY) license (https://creativecommons.org/licenses/by/4.0/).
Share and Cite
Sipos, T.-C.; Kövecsi, A.; Kocsis, L.; Nagy-Bota, M.; Pap, Z. Evaluation of Microvascular Density in Glioblastomas in Relation to p53 and Ki67 Immunoexpression. Int. J. Mol. Sci. 2024, 25, 6810. https://doi.org/10.3390/ijms25126810
Sipos T-C, Kövecsi A, Kocsis L, Nagy-Bota M, Pap Z. Evaluation of Microvascular Density in Glioblastomas in Relation to p53 and Ki67 Immunoexpression. International Journal of Molecular Sciences. 2024; 25(12):6810. https://doi.org/10.3390/ijms25126810
Chicago/Turabian StyleSipos, Tamás-Csaba, Attila Kövecsi, Lóránd Kocsis, Monica Nagy-Bota, and Zsuzsánna Pap. 2024. "Evaluation of Microvascular Density in Glioblastomas in Relation to p53 and Ki67 Immunoexpression" International Journal of Molecular Sciences 25, no. 12: 6810. https://doi.org/10.3390/ijms25126810
APA StyleSipos, T.-C., Kövecsi, A., Kocsis, L., Nagy-Bota, M., & Pap, Z. (2024). Evaluation of Microvascular Density in Glioblastomas in Relation to p53 and Ki67 Immunoexpression. International Journal of Molecular Sciences, 25(12), 6810. https://doi.org/10.3390/ijms25126810