Article

Chronic Epinephrine-Induced Endoplasmic Reticulum and Oxidative Stress Impairs Pancreatic β-Cells Function and Fate

1
College of Animal Science and Technology, Southwest University, Chongqing 400715, China
2
School of Animal and Comparative Biomedical Sciences, The University of Arizona, Tucson, AZ 85721, USA
*
Author to whom correspondence should be addressed.
Current address: Yunnan Center for Animal Disease Control and Prevention, Kunming 650201, China.
Int. J. Mol. Sci. 2024, 25(13), 7029; https://doi.org/10.3390/ijms25137029
Submission received: 8 May 2024 / Revised: 13 June 2024 / Accepted: 25 June 2024 / Published: 27 June 2024
(This article belongs to the Special Issue Advanced Research on the Adrenal Gland and Hormones)

Abstract

:
Epinephrine influences the function of pancreatic β-cells, primarily through the α2A-adrenergic receptor (α2A-AR) on their plasma membrane. Previous studies indicate that epinephrine transiently suppresses insulin secretion, whereas prolonged exposure induces its compensatory secretion. Nonetheless, the impact of epinephrine-induced α2A-AR signaling on the survival and function of pancreatic β-cells, particularly the impact of reprogramming after their removal from sustained epinephrine stimulation, remains elusive. In the present study, we applied MIN6, a murine insulinoma cell line, with 3 days of high concentration epinephrine incubation and 2 days of standard incubation, explored cell function and activity, and analyzed relevant regulatory pathways. The results showed that chronic epinephrine incubation led to the desensitization of α2A-AR and enhanced insulin secretion. An increased number of docked insulin granules and impaired Syntaxin-2 was found after chronic epinephrine exposure. Growth curve and cell cycle analyses showed the inhibition of cell proliferation. Transcriptome analysis showed the occurrence of endoplasmic reticulum stress (ER stress) and oxidative stress, such as the presence of BiP, CHOP, IRE1, ATF4, and XBP, affecting cellular endoplasmic reticulum function and survival, along with UCP2, OPA1, PINK, and PRKN, associated with mitochondrial dysfunction. Consequently, we conclude that chronic exposure to epinephrine induces α2A-AR desensitization and leads to ER and oxidative stress, impairing protein processing and mitochondrial function, leading to modified pancreatic β-cell secretory function and cell fate.

1. Introduction

Type 2 diabetes mellitus (T2DM) is a chronic metabolic disease characterized primarily by elevated blood glucose. Insulin, as the only hormone in the body that lowers blood glucose, is essential for glucose metabolism and overall metabolic balance. T2DM occurs when pancreatic β-cells fail to release enough insulin to meet the demands of insulin-responsive tissues [1]. In addition to insulin resistance in the peripheral tissues, β-cell dysfunction is also a major characteristic in T2DM [2]. These conditions are usually caused by poor lifestyle habits, unbalanced diet, and a lack of exercise [3]. Likewise, a regular physical activity routine, coupled with a well-balanced nutritional intake, positively affects individuals suffering from diabetes [4]. Accumulating evidence suggests that pancreatic β-cells exhibit significant plasticity during the development of T2DM [5], and that under normal physiological conditions, pancreatic β-cells can cope with short-term stress through a range of adaptive responses, but when they exceed a certain threshold, β-cell properties are progressively lost [6,7].
Multiple hormonal factors influence β-cell responsiveness. Chronic stress leads to the disruption of the hypothalamic–pituitary–adrenal (HPA) axis balance, triggering an overabundance of stress hormones such as glucocorticoids and catecholamine [8,9]. This hormonal imbalance has been observed to negatively impact the functionality of β-cells across various experimental settings, including in vitro insulin-secreting cell lines, rodent and human pancreatic islets in culture, and in vivo rodent and ovine models [10,11]. The secretion of catecholamines, while influenced by both the nervous system and the adrenal glands, is predominantly driven by the adrenal glands, as confirmed by adrenalectomy studies [12]. It is significant to note that catecholamines are pivotal in the body’s immediate response to chronic stress, acting as the initial signaling molecules that regulate the stress response.
Adrenergic receptors are activated by catecholamines, such as epinephrine and norepinephrine, which are triggered during exercise or stress. Usually, catecholamines attenuate β-cell activity and inhibit insulin release by activating α2-adrenergic receptors on the plasma membrane of the β-cells, mainly by decreasing the production of cAMP and by having a desensitizing effect on intracellular Ca2+ concentration during the later stages of the cytotoxic process [13]. A recent study has shown that elevated fetal catecholamines are associated with neonatal β-cell physiology, suggesting a mechanistic link between prenatal or perinatal stress and subsequent neonatal hyperinsulinemic hypoglycemia [14]. This is consistent with findings that injection of norepinephrine into fetal sheep for 7 consecutive days resulted in a compensatory enhancement of insulin secretion [11]. In addition, MIN6 (mouse insulinoma 6) showed differential expression of metabolic-related proteins after acute adrenergic stimulation [15]. In previous reports, chronic adrenergic stimulation the lower UCP2 abundance of β-cells and induced ROS accumulation, which contributed to oxidative damage and cytotoxicity [10,15]. But how adrenergic receptors impact β-cell survival is still unknown.
Survival is another important aspect of pancreatic β-cell function, as it determines the β-cell mass and the ability to compensate for insulin resistance. There are multiple transcription factors (PDX1, MafA, and NeuroD1) and growth factors, (IGF-1 and VEGF) that regulate β-cell development, function, and survival [16]. Moreover, cellular senescence is closely related to cellular stresses, including ER stress, which causes β-cell dysfunction [17]. Pancreatic β-cells experience high levels of ER stress due to their role in insulin secretion [18]. In order to relieve ER stress, the cells activate the unfolded protein response (UPR), which enhances ER function. However, prolonged or excessive ER stress can trigger apoptosis through the activation of transcription factors such as CHOP and ATF4, as well as the induction of pro-apoptotic proteins such as BIM and BAX [19]. In conclusion, although mild to moderate ER stress promotes β-cell proliferation and insulin synthesis through UPR activation, persistent insulin demand and insulin resistance may lead to excessive ER stress, triggering β-cell dysfunction and apoptosis [20]. To systematically explore the effects of chronic adrenergic signaling exposure on β-cell survival, in this study, we measured insulin secretion, cell proliferation, and apoptosis in MIN6 cells. We also evaluated cellular ultrastructure and analyzed associated regulatory mechanisms. Understanding the impact of adrenergic signaling on β-cell survival will provide important knowledge to find specific targets to resolve the issue.

2. Results

2.1. Glucose Stimulated Insulin Responsiveness

MIN6 cells were cultured in stimulatory concententrations of epinephrine for 3 days followed by 2 days of epinephrine withdrawal (Figure 1A). The expression levels of α2A-AR were measured on the third and fifth day of the experiment, and glucose-stimulated insulin secretion (GSIS) was assessed on the fifth day. Despite removal of epinephrine, α2A-AR RNA expression did not show reversible features (Figure 1B). In response to 20 mM glucose, the absolute insulin released into the media increased by 33% (Figure 1C) and insulin content increased by 43% (Figure 1D). These results indicate that MIN6 cells exhibit a persistent state of insulin hypersecretion, even when epinephrine is withdrawn.

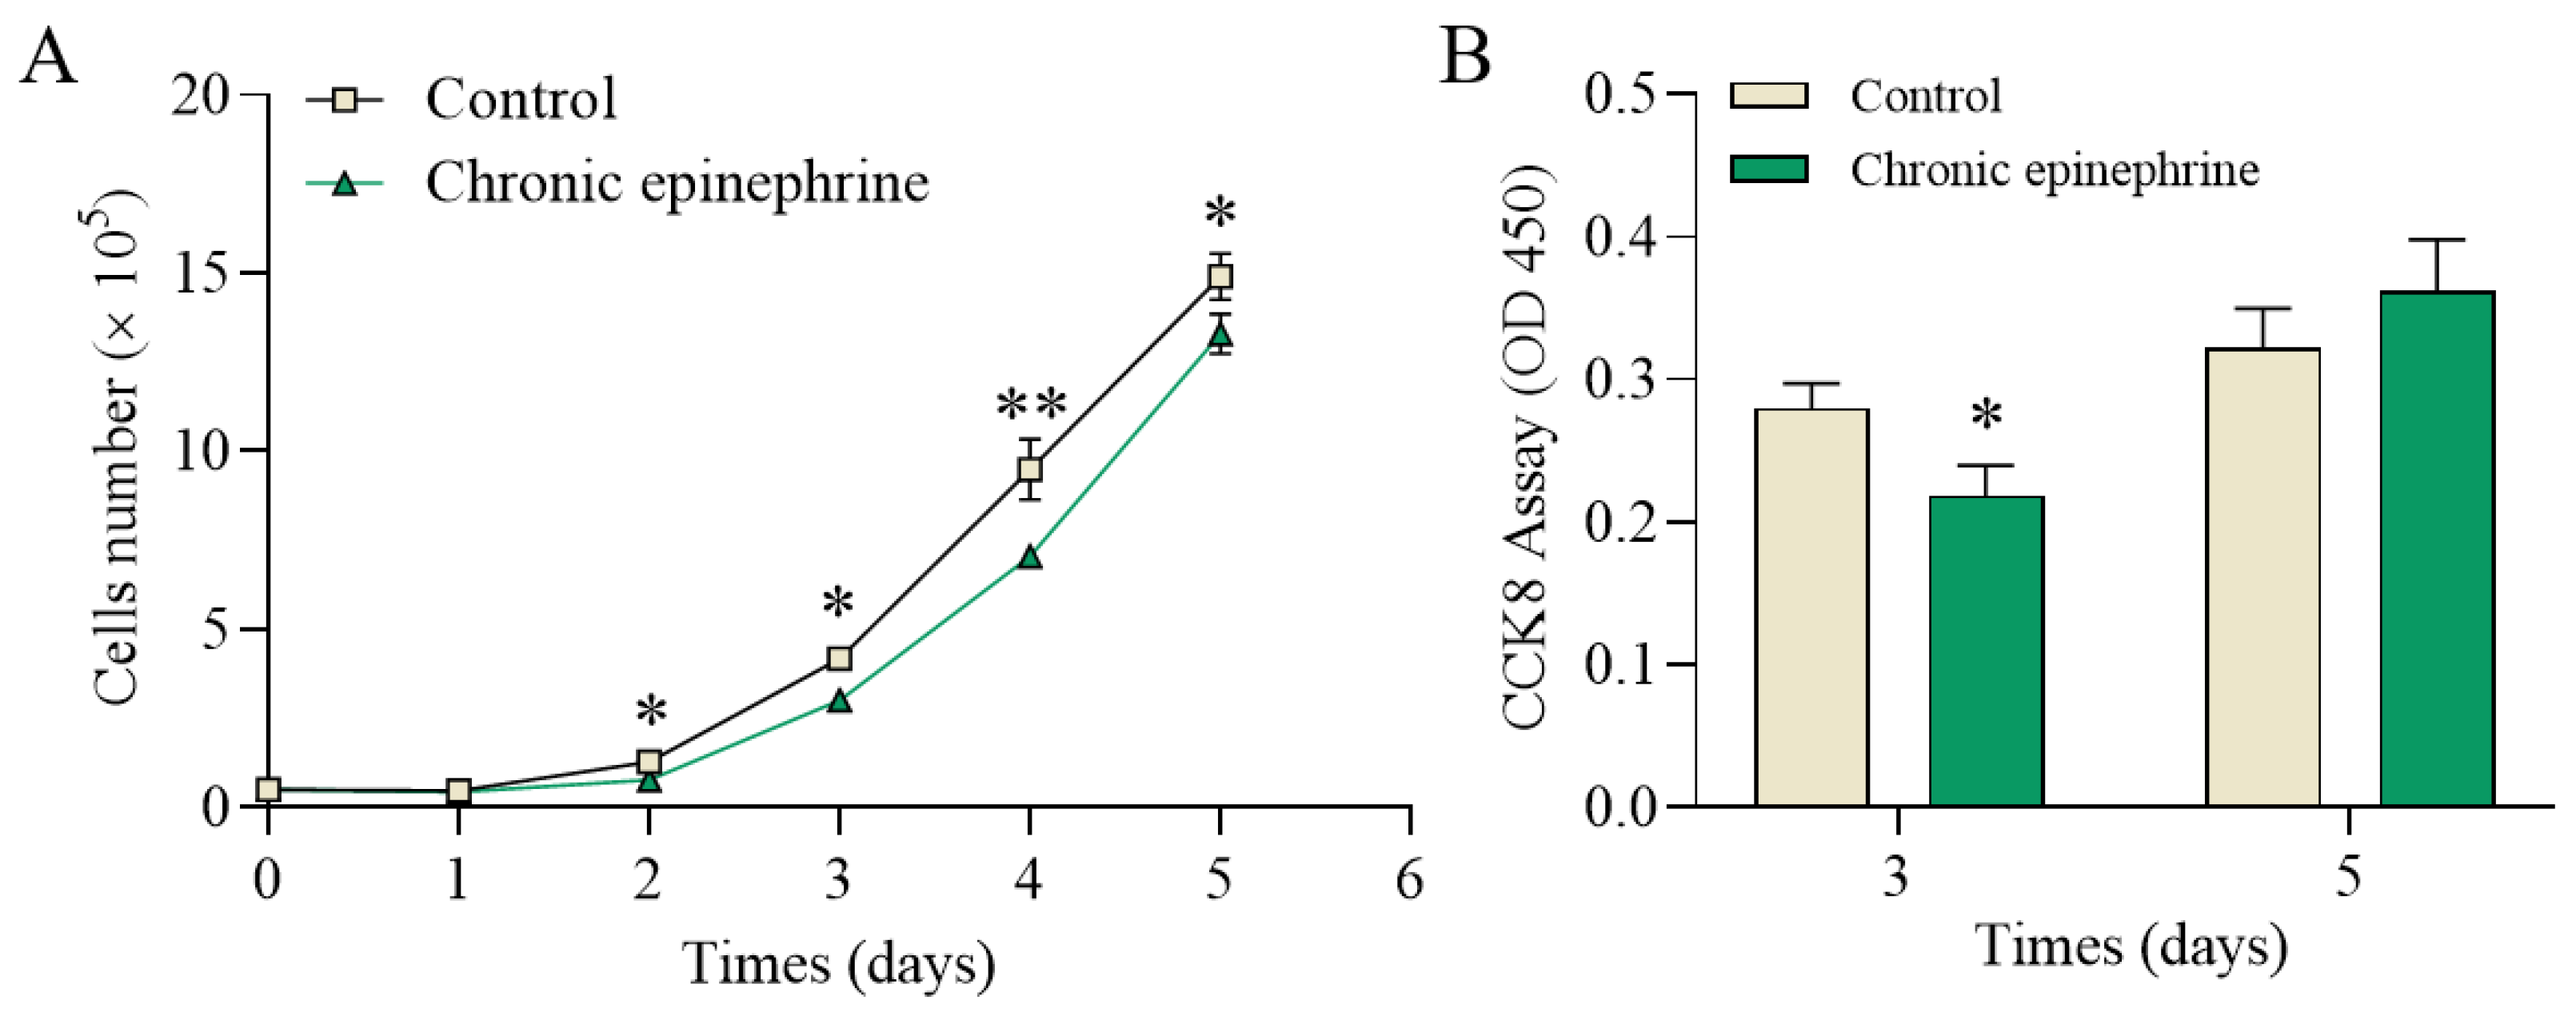
2.2. Cell Proliferation and Viability

Cell numbers were measured each day, and were significantly reduced in the epinephrine-exposed group compared to the control group (Figure 2A). The cell viability assay also showed that the cell proliferation rate was low after epinephrine exposure, although there was no difference on day 5 (Figure 2B).

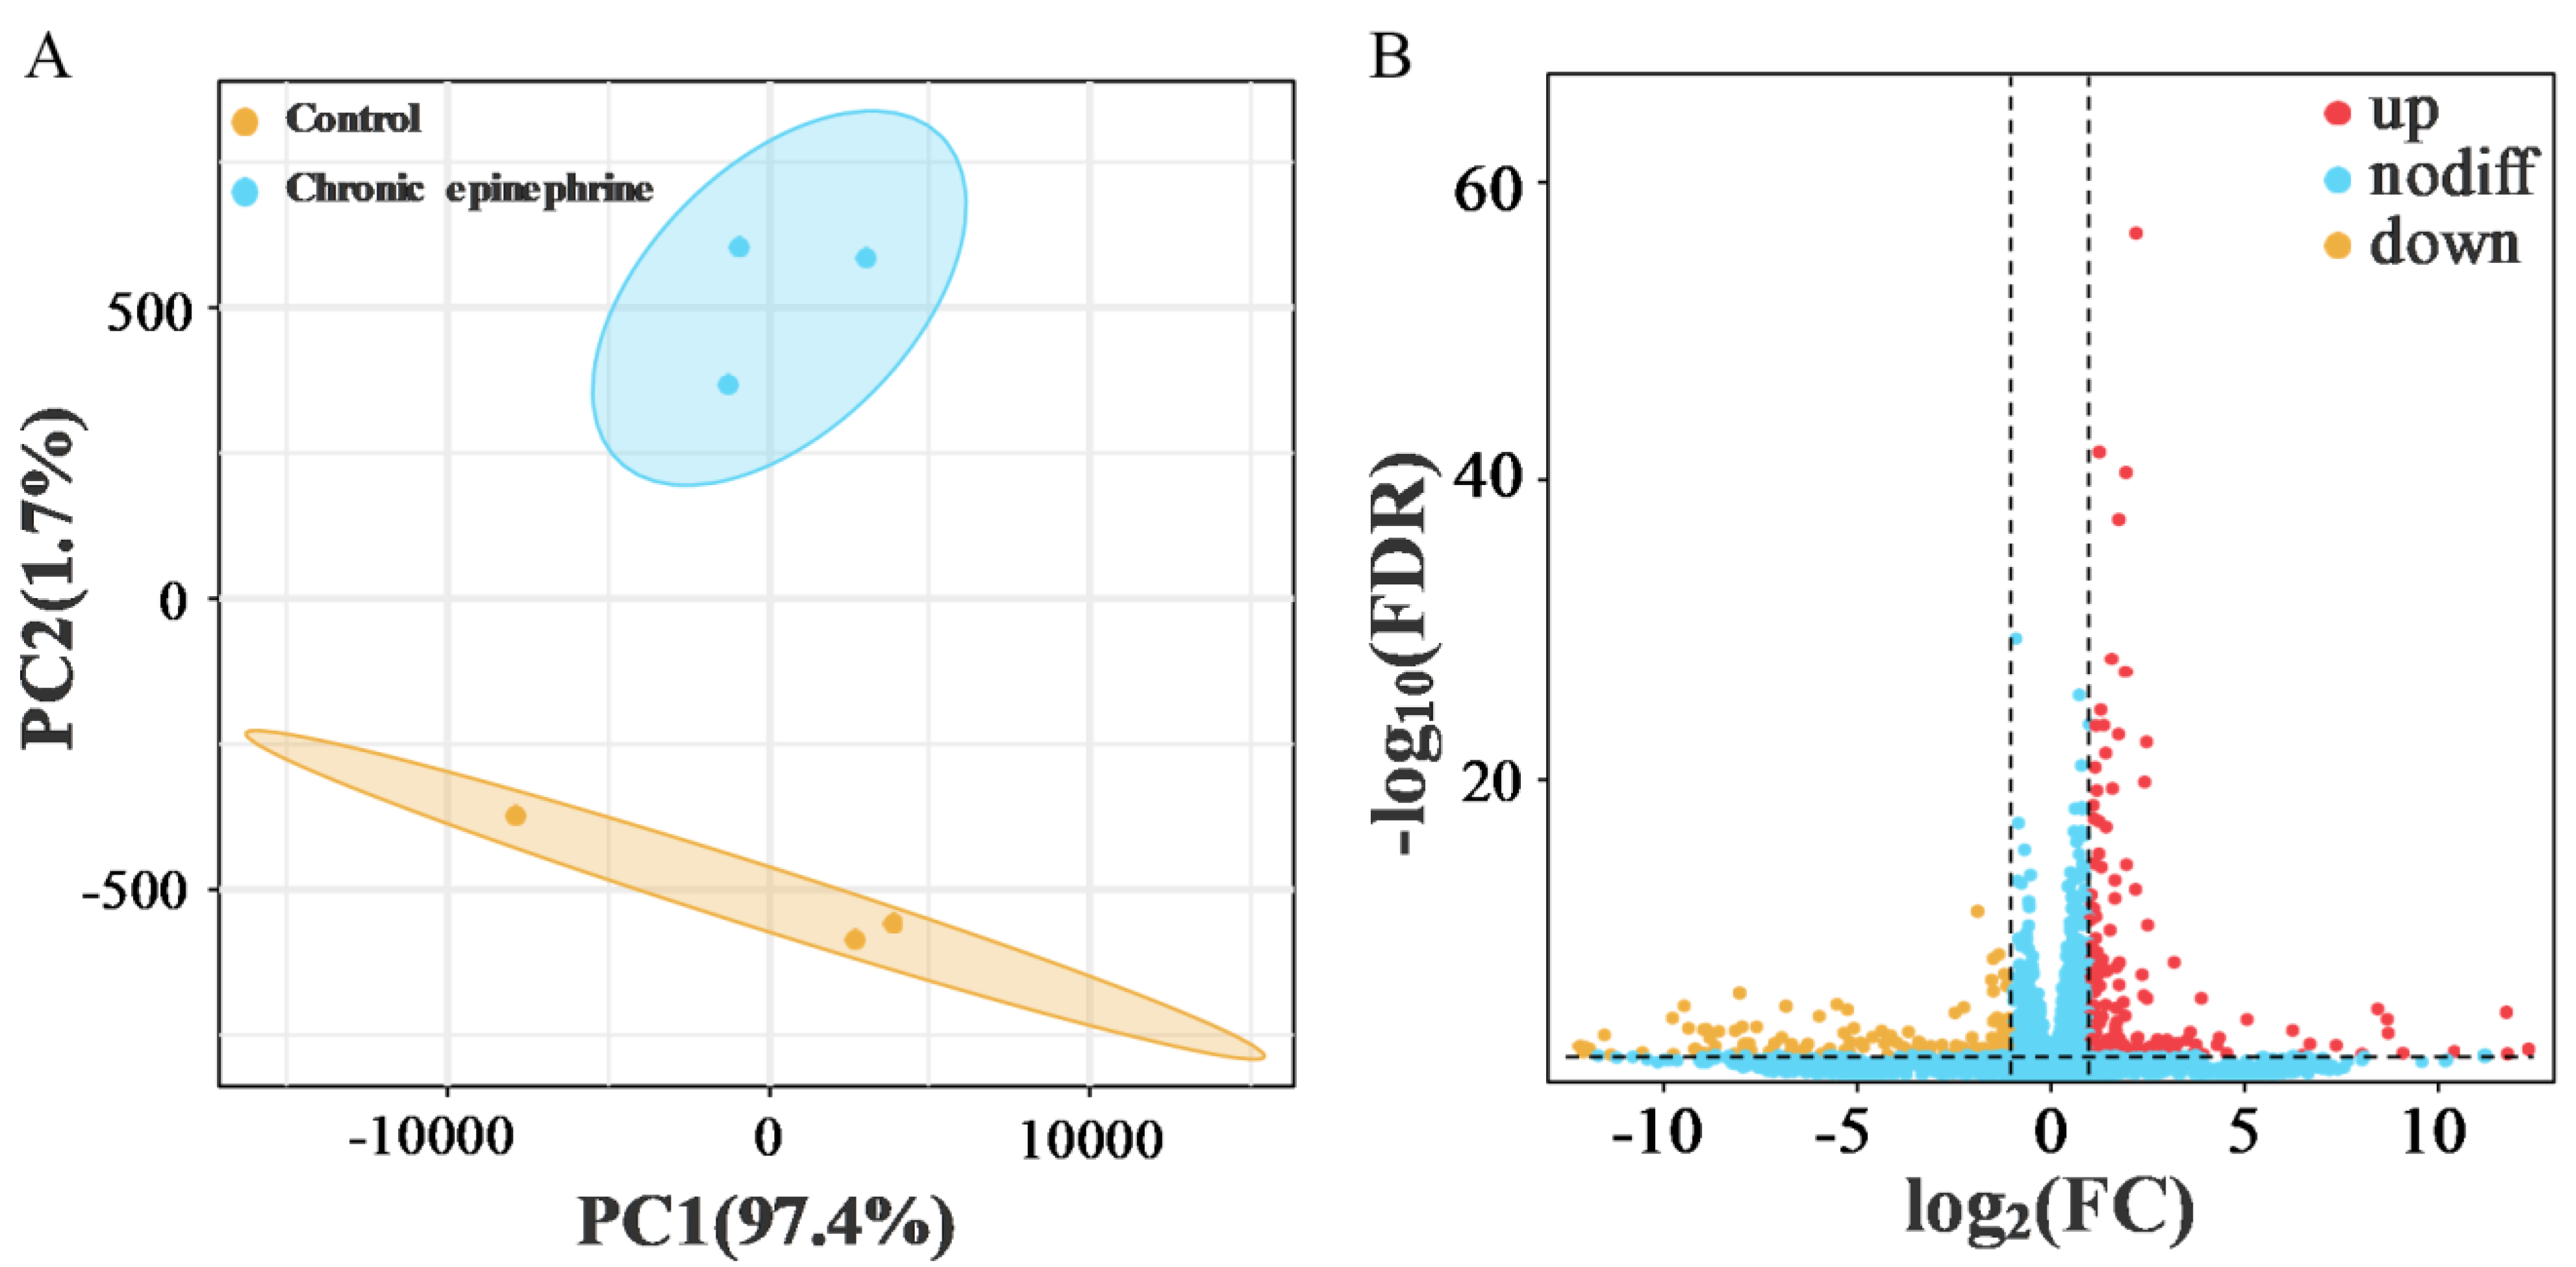
2.3. Differential Gene Expression of RNA-Seq

PCA plots showed good intra-group reproducibility and clear inter-group differences, and volcano plots illustrated that a total of 125 differentially expressed genes (DEGs) were identified, of which 86 genes were upregulated and 39 genes were downregulated, compared with the control group (Figure 3B). These changes in gene expression may involve multiple biological processes in the response of the MIN6 cells to epinephrine. Further differential gene pathway enrichment analysis showed (Figure 4A,B) that enriched KEGG pathways were related to the insulin secretion process, such as endoplasmic reticulum protein processing (e.g., CHOP, IRE1, ATF4, BiP, and XBP), ribosome production, protein export, Syntaxin-2 health, etc., and GO was mainly enriched in regards to cell fate and oxidative stress-related pathways, such as the response to ER stress, the response to oxidative stress, and the regulation of the apoptotic process.

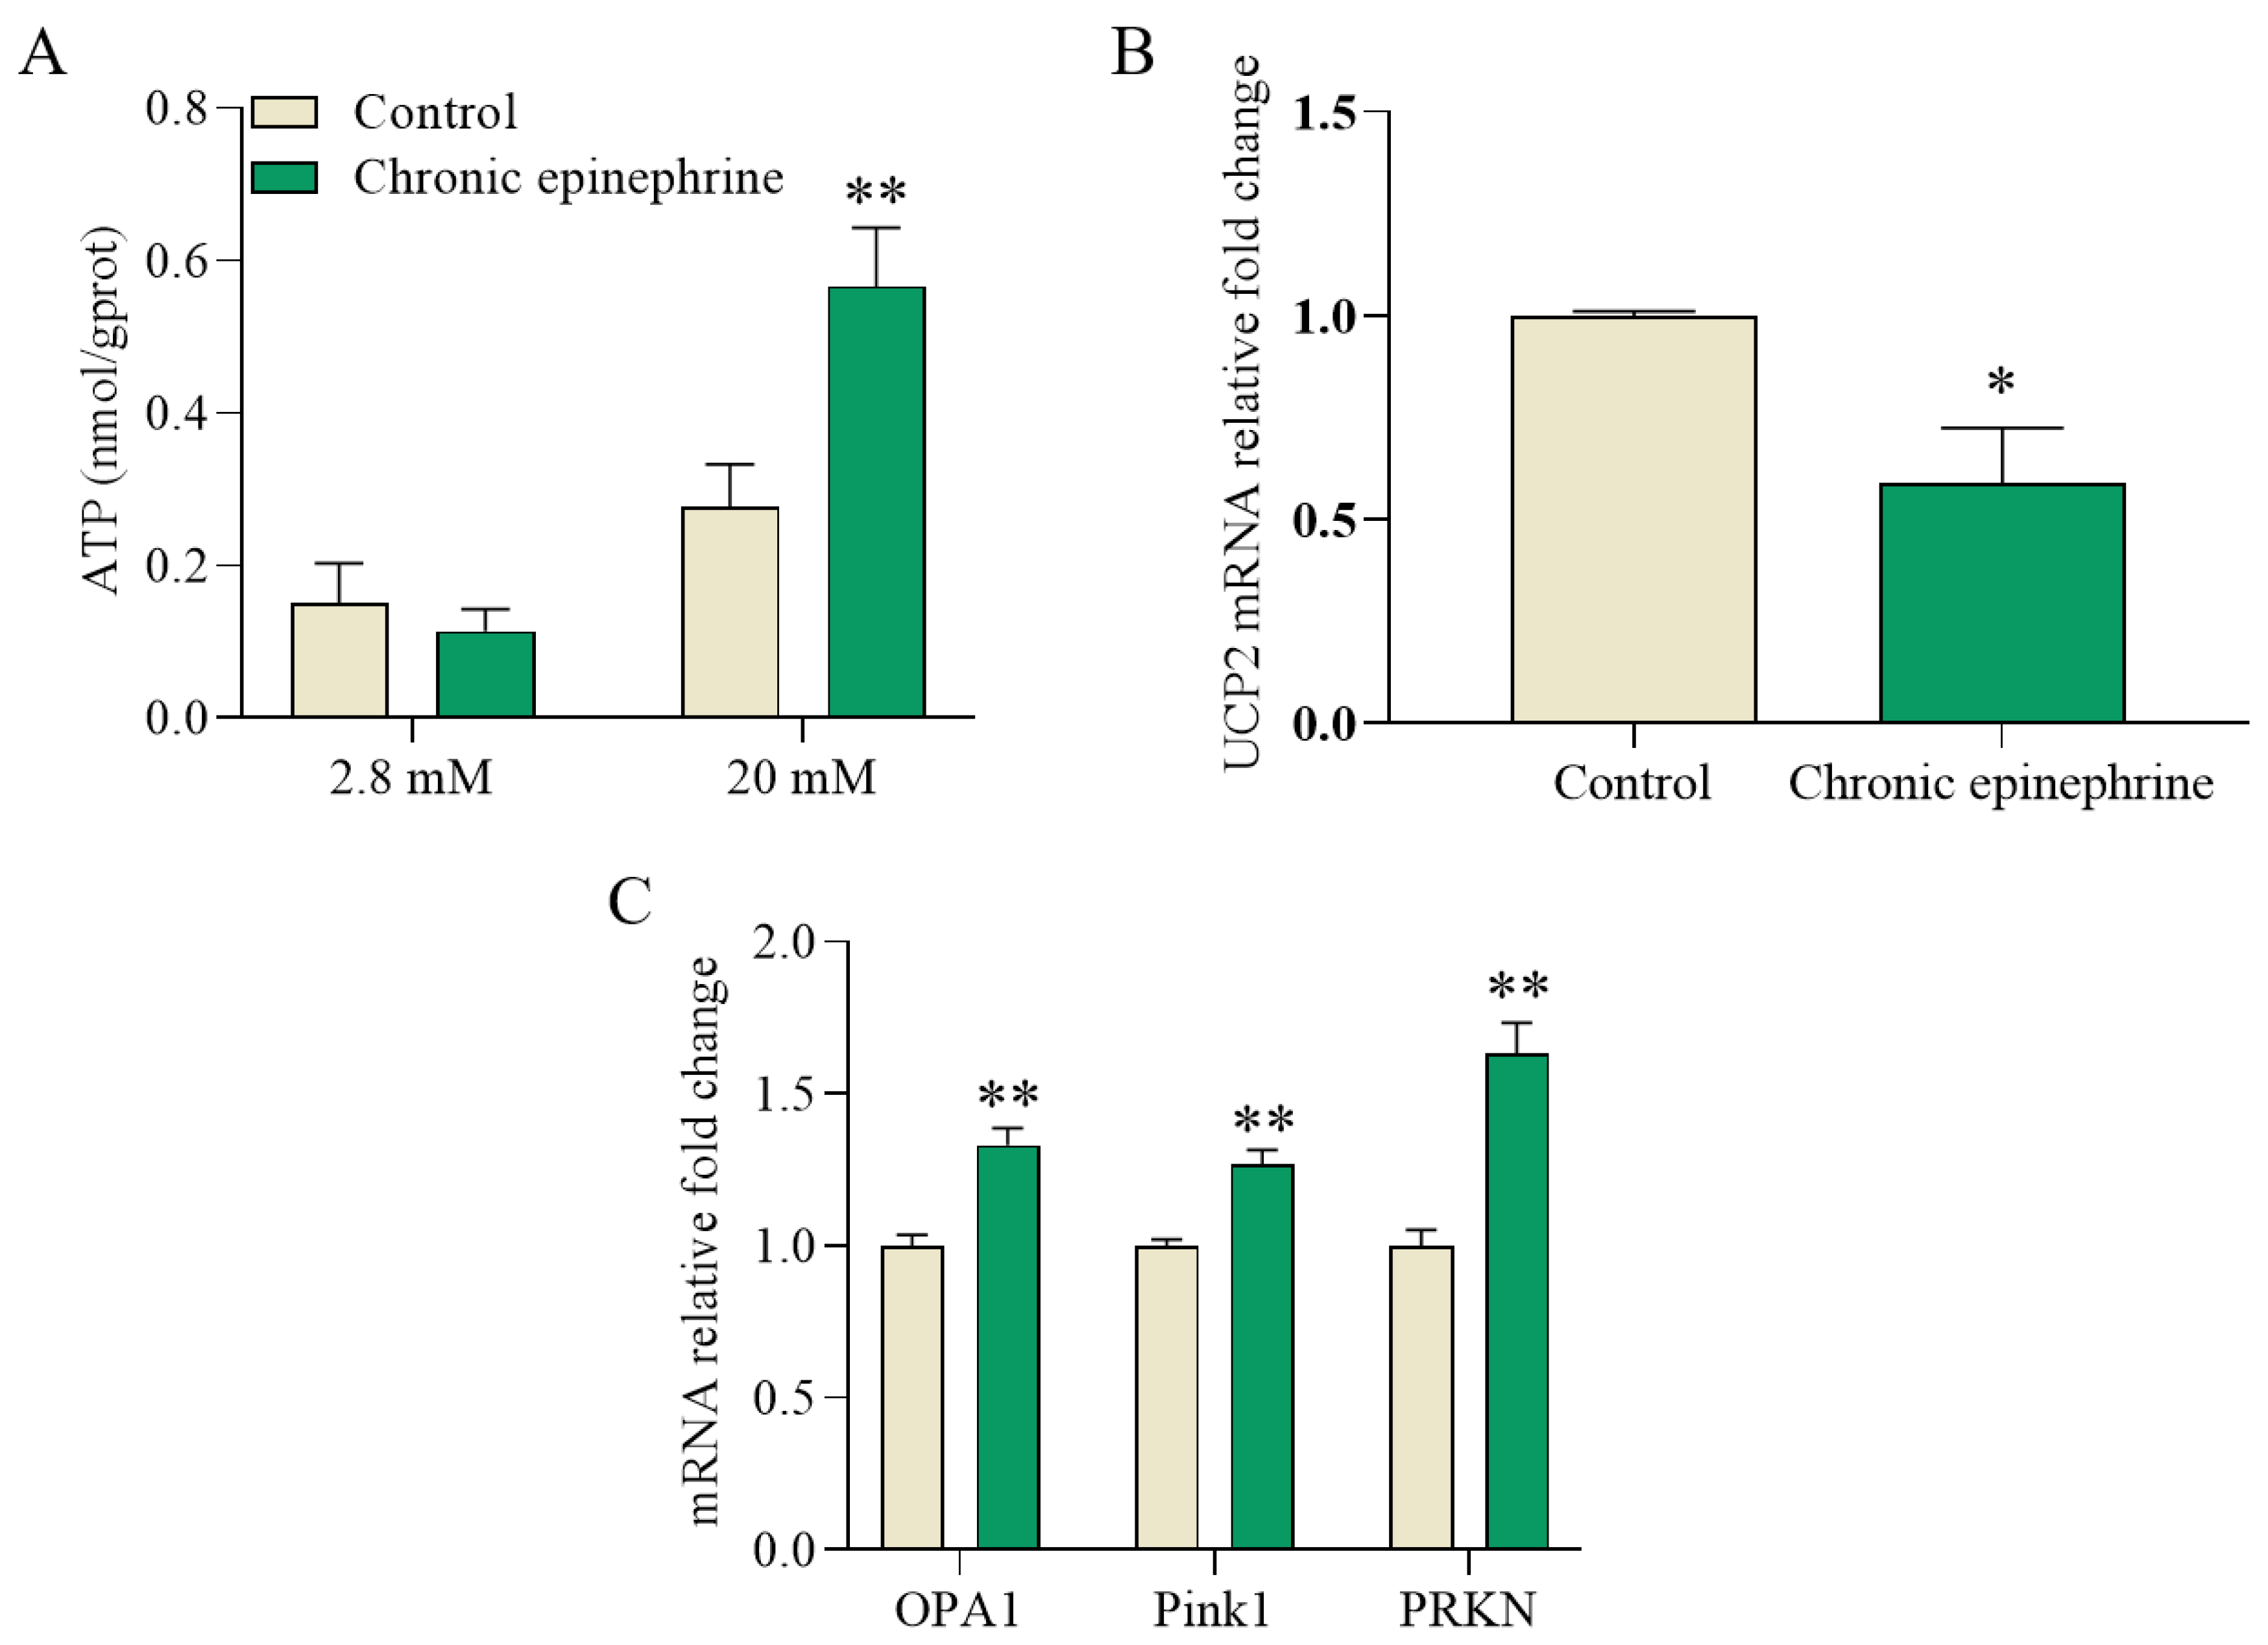
2.4. Impaired Mitochondria Signaling

The GO enrichment analysis identified metabolic processes, which subsequently showed that the levels of ETC and ATP synthase subunits were upregulated, indicating a disruption in mitochondria ATP synthesis (Figure 4B). ATP concentrations and mitochondria-related gene expression were measured in the MIN6 cells on the fifth day. Under high-glucose stimulation, ATP concentrations doubled (Figure 5A). In addition, OPA1, Pink1, and PRKN gene expression levels were upregulated by 32%, 26%, and 62%, respectively, and UCP2 expression was reduced by 42% (Figure 5B,C).

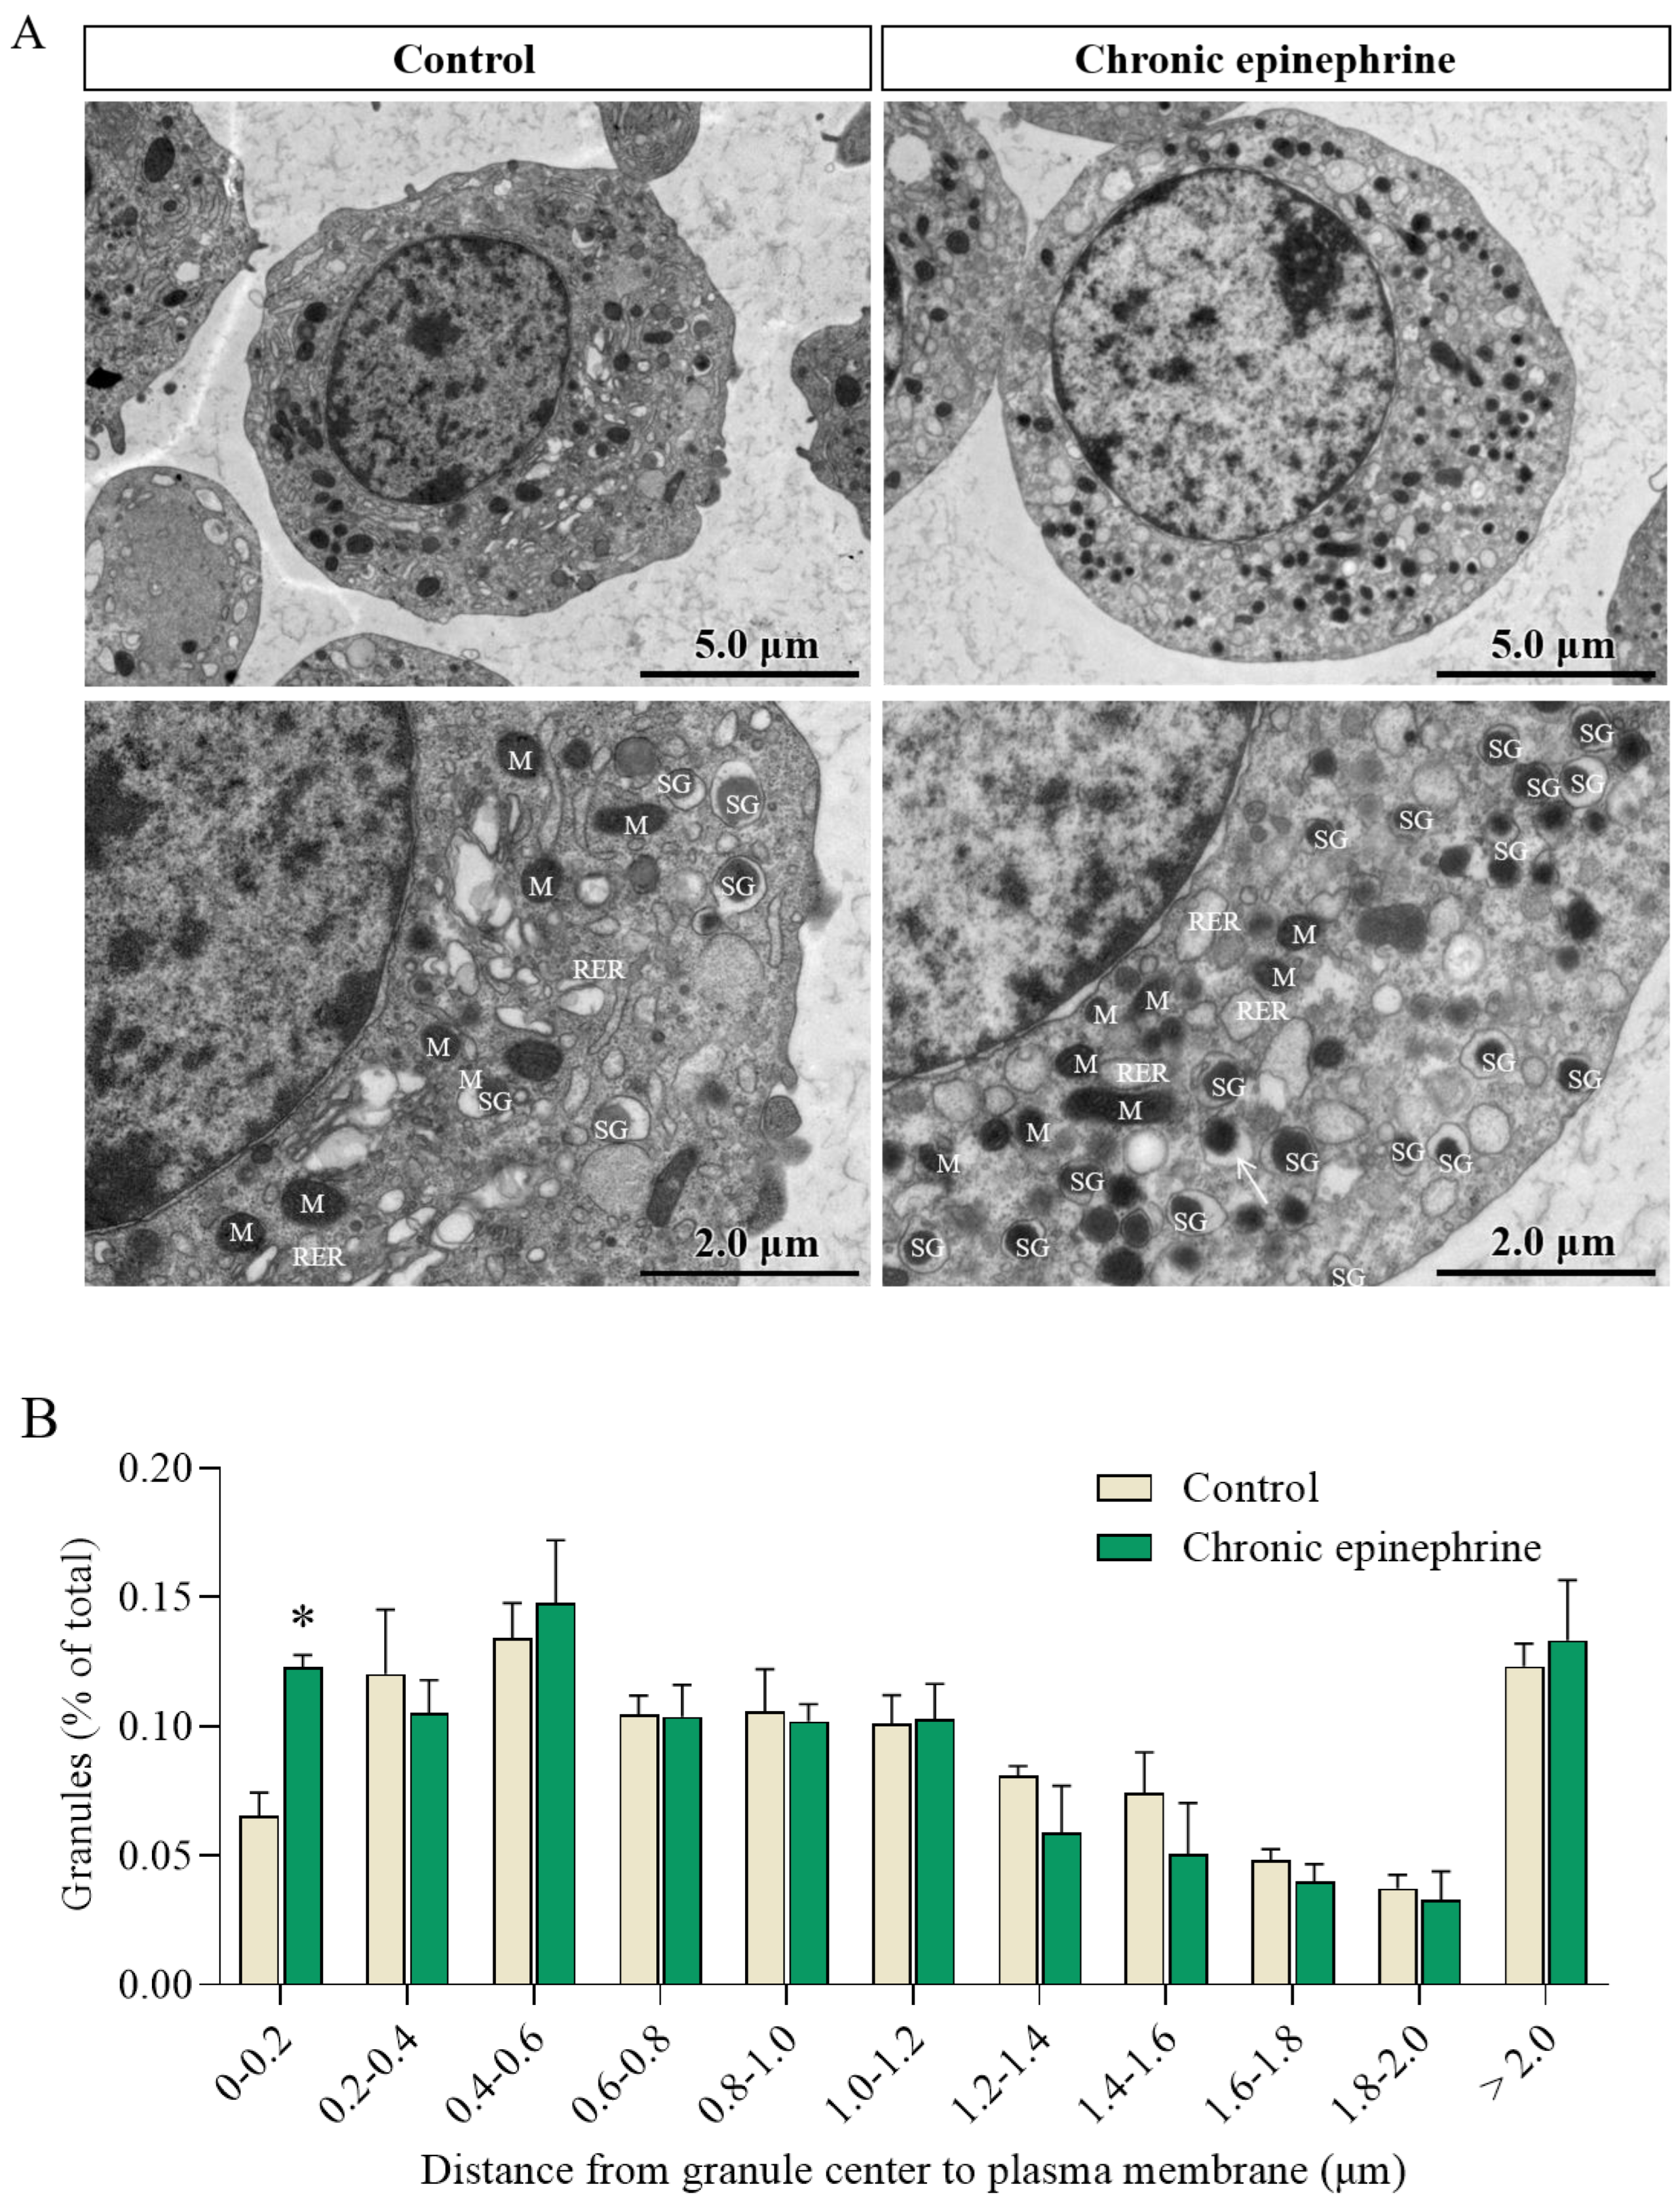
2.5. Ultrastructural Observation of MIN6

Transmission electron microscopy ultrastructural analysis showed that MIN6 cells exhibited hyperfunction after exposure to epinephrine, with marked dilation of the rough endoplasmic reticulum (RER), many flocculent aggregates visible in the endoplasmic reticulum (ER) pools, and insulin granules of variable size (Figure 6A), with a dense core spilling out (Figure 6A, white arrow). In contrast, the control cells were in an active state, with more insulin granules of uniform size. The counting of insulin granules revealed a significant increase in the number of docked insulin granules after exposure to epinephrine (Figure 6B).

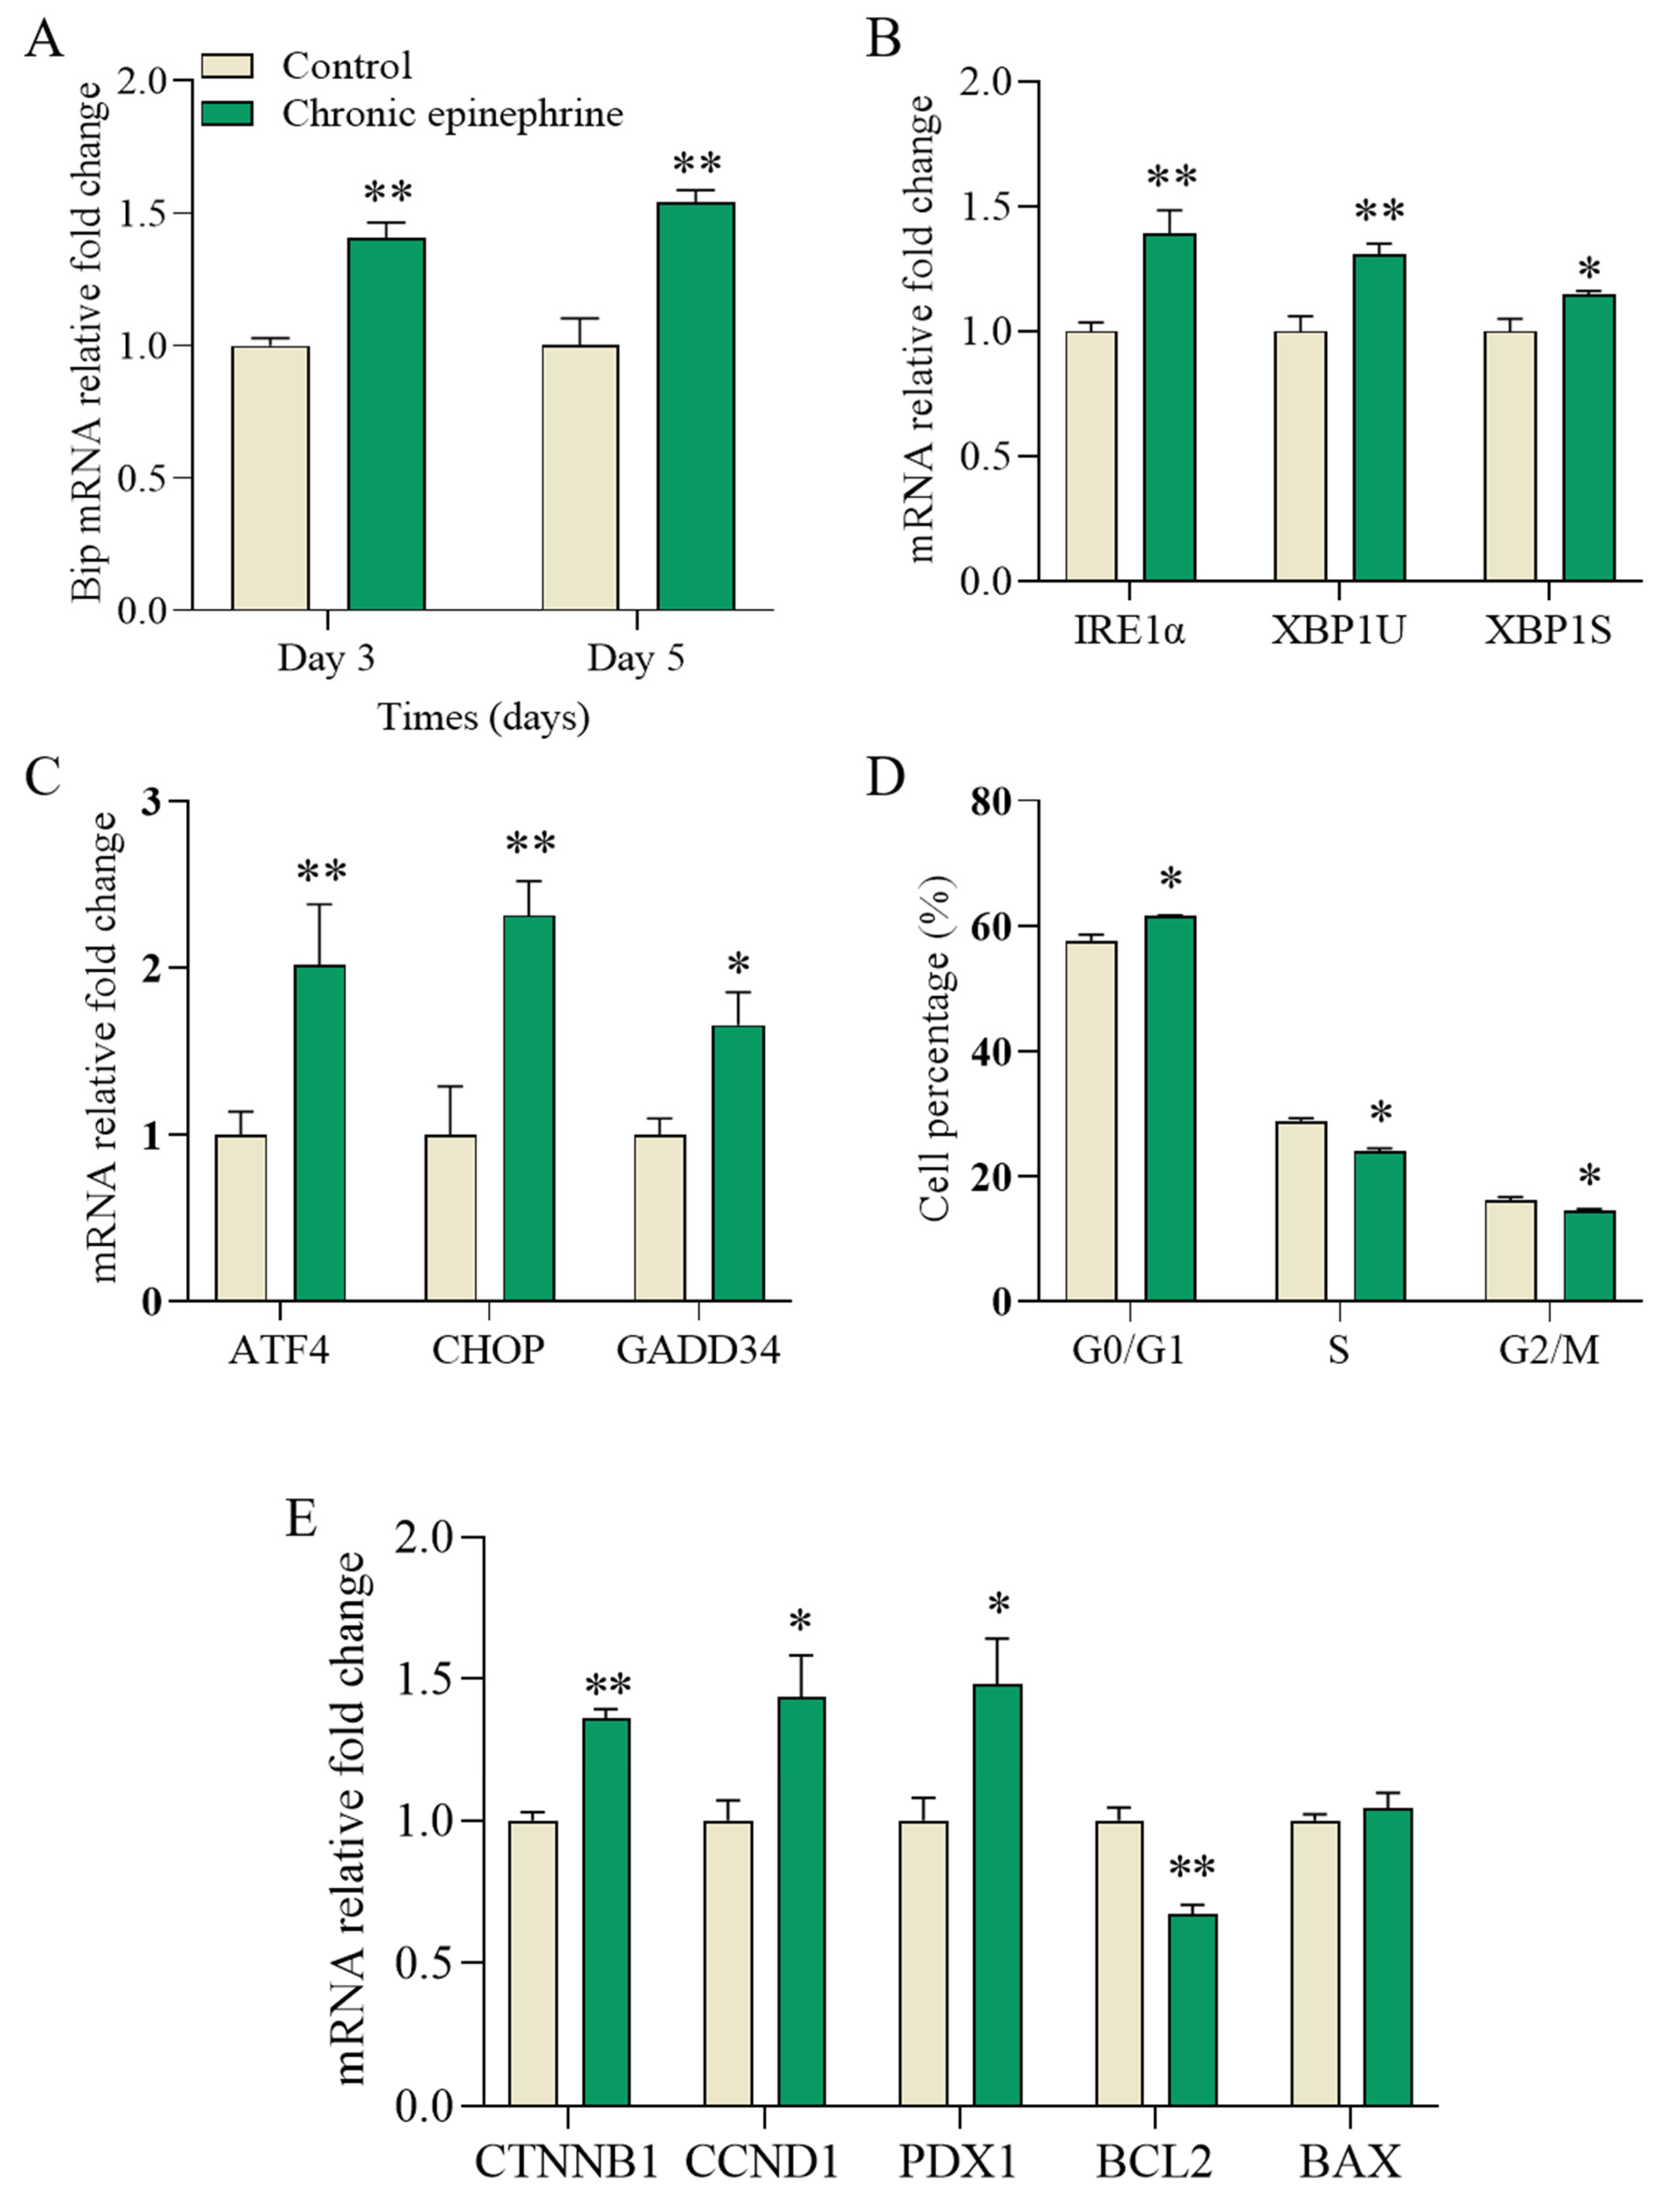
2.6. Cell Fate Signaling Pathway

The expression of BiP was upregulated by 40% on day 3 and by 55% on day 5 compared to that of the control group (Figure 7A). Additionally, the expression of IRE1α and its downstream signal transducers XBP1u and XBP1s were upregulated by 39%, 31%, and 15%, respectively (Figure 7B), while the downstream signals of PERK, ATF4, CHOP, and GADD34 were upregulated by 101%, 131%, and 65%, respectively (Figure 7C). Cell cycle analysis showed a 4% increase in the percentage of cells in the G0/G1 phase and a decrease in the percentage of cells in the S and G2/M phases (Figure 7D). CTNNB1, CCND1, and PDX1 were associated with cell proliferation, which was upregulated by 36% and 44%, respectively; BCL2 and BAX were associated with apoptosis, with BCL2 downregulated by 33% and BAX showing no significant change.

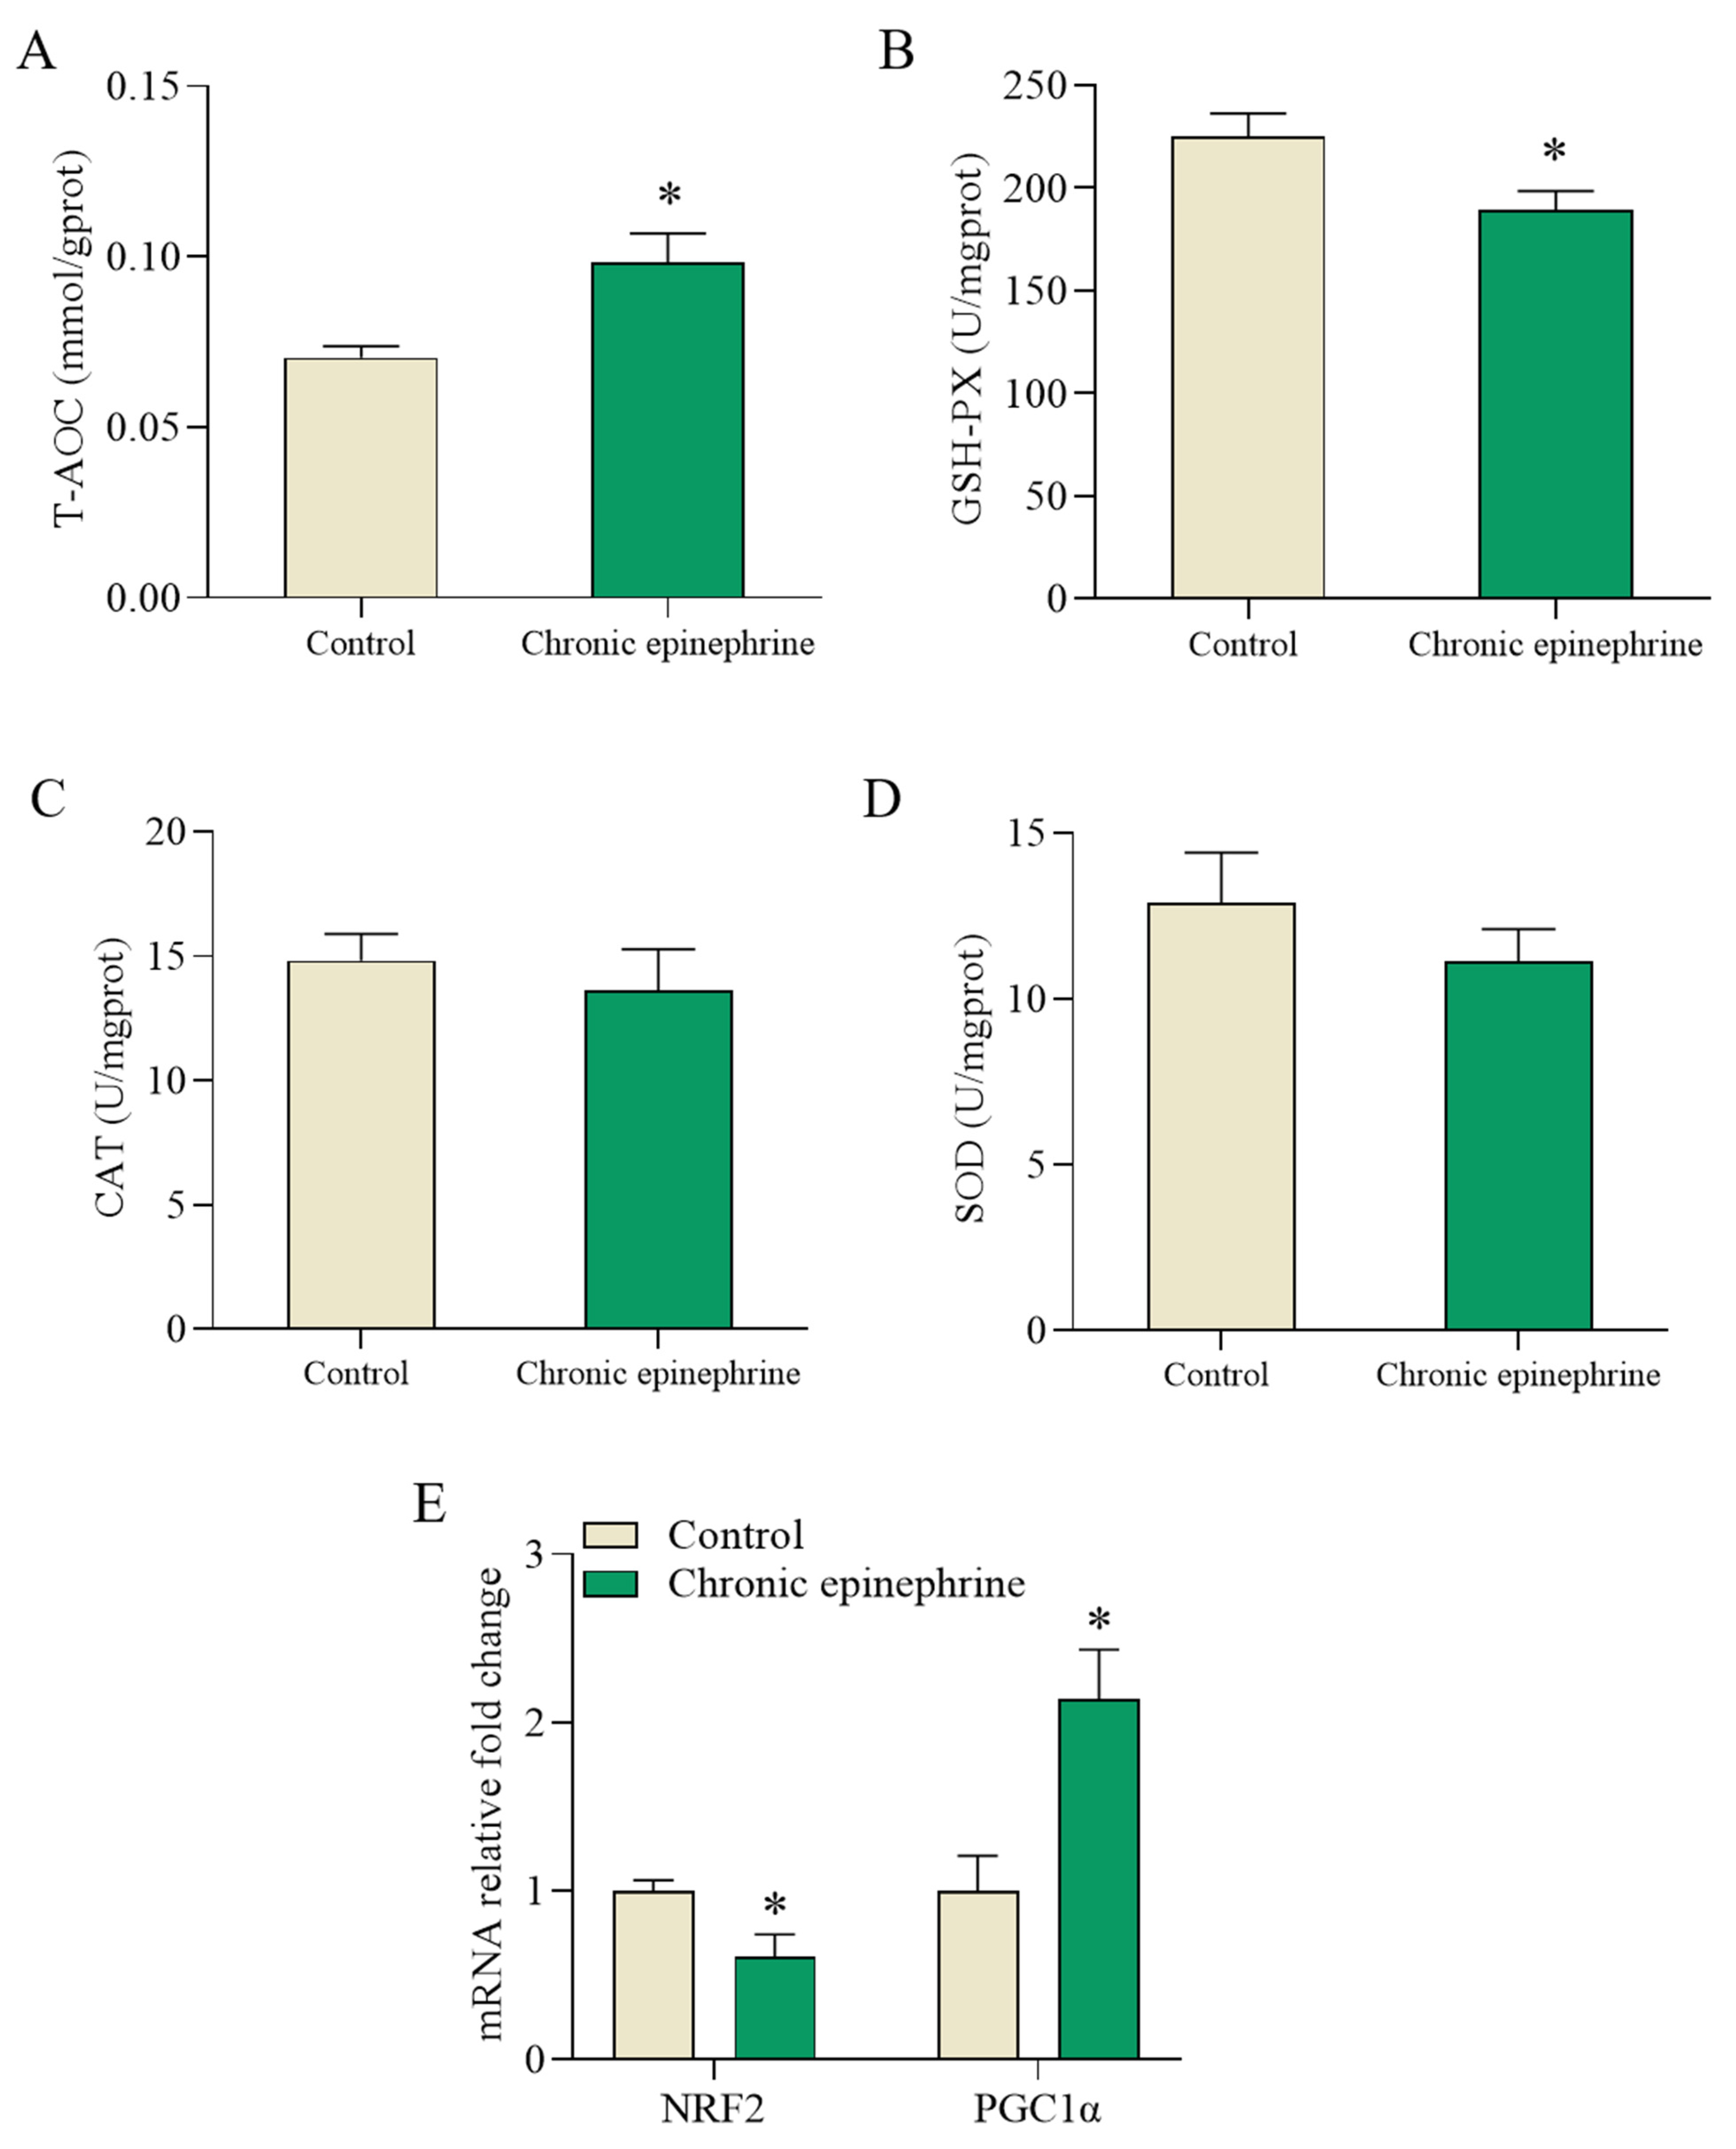
2.7. Impaired ROS Regulation

Compared to that of the control cells, the total antioxidant capacity (T-AOC) was increased by about 66% (Figure 8A), glutathione peroxidase (GSH-Px) activity was decreased by about 21% (Figure 8B), and superoxide dismutase (SOD) and catalase (CAT) activities were unchanged (Figure 8C,D). The expression level of NRF2, a gene associated with regulating the expression of antioxidant enzymes, decreased by 38%, whereas the expression level of PGC1α doubled (Figure 8E).

3. Discussion

Previous studies have demonstrated that chronic adrenergic receptor stimulation has a significant effect on pancreatic β-cell function. In contrast to the acute epinephrine response mechanism, insulin secretion decreased rather than increased when MIN6 cells were exposed to epinephrine for 72 h [21,22], This indicates that prolonged exposure to stimulatory concentrations of epinephrine increases the total insulin content, but the desensitization of adrenergic receptors has not previously been observed [10]. This study further illustrates that prolonged exposure to epinephrine enhances the GSIS capacity of MIN6 cells. This enhancement was sufficient to counteract the inhibitory effect of adrenaline on insulin secretion. Remarkably, even after removal of epinephrine and continued incubation for two days, the MIN6 cells still showed compensatory enhancement (Figure 1C,D). This finding indicates that the effects of this compensatory mechanism may be beyond the range of conventional responses and cannot be reversed by a simple recovery process.
Adrenergic signaling is also an important factor contributing to β-cell dysfunction [23], consistent with previous findings that desensitization of its receptor, α2A-AR, occurs in the presence of prolonged stimulation [22]. At the same time, we still observed a lower α2A-AR expression after the withdraw of epinephrine (Figure 1B). α2A-AR, as a G-protein-coupled receptor, normally inhibits insulin release by inhibiting cAMP production [24], but desensitization of α2A-AR in response to prolonged adrenergic action may lead to a diminution of this inhibitory effect, possibly through UCP2 altering the ATP/ADP ratio (Figure 5B), which in turn increases insulin secretion in a high-glucose environment.
Insulin hyper-secretion responsiveness as an adaptive compensatory mechanism in pancreatic β-cells leads to an increased burden of protein synthesis at the cellular interior, which causes ER stress [25]. As expected, we observed that the rough endoplasmic reticulum of the cells underwent expansion and spillover of the dense core (Figure 6A), and the occurrence of ER stress was confirmed by detecting the level of the ER stress marker BiP (Figure 7A) [26]. When ER stress reaches a certain level, the unfolded protein response (UPR) is activated [27,28], and if the UPR is not effective in relieving ER stress, prolonged stress may lead to pancreatic β-cell dysfunction and even cell death [27,29].
To investigate the compensatory enhanced secretion of insulin, we also observed a significant increase in the number of docked insulin granules in response to prolonged epinephrine stimulation (Figure 6B). The docking and fusion of insulin particles with the plasma membrane is an essential step in the insulin exocytosis process, in which soluble N-ethylmaleimide-sensitive factor attachment protein receptors (SNAREs) play a crucial role [30]. Our transcriptomic data also revealed that Syntaxin-2 (Stx2), a SNARE protein, was impaired following prolonged epinephrine exposure (Figure 4A). The flipping of Stx2 can modulate its inhibitory effect on insulin granule exocytosis, thereby affecting insulin secretion [31]. Thus, the impairment of Stx2 induced by epinephrine potentially disrupted insulin granule exocytosis.
Through the cell growth curves and cell cycle (Figure 2 and Figure 7D), we found that cell number and viability was consistently inhibited throughout the study period, even with the removal of epinephrine. This result supports previous findings that adrenergic signaling inhibits MIN6 cell proliferation [21]. However, how epinephrine affects β-cell survival through its specific receptors has not been thoroughly investigated. In this study, we found that under chronic epinephrine condition, MIN6 cells induced the expression of many genes known to be involved in endoplasmic reticulum processing, including key differential genes such as CHOP, IRE1, ATF4, BiP, and XBP (Figure 4A). The activation of CHOP, a classical proapoptotic protein in ER stress, is an important response to the PERK, ATF6, and IRE1 activation of important proapoptotic signals [32,33,34]. Under ER stress, the activation of these three sensor proteins can lead to the initiation of UPR, in which the upregulation of CHOP is a vital step in the promotion of apoptosis, which promotes cells towards apoptosis by affecting the expression of several apoptosis-related genes, especially when ER stress remains unalleviated [29,35]. Therefore, we examined the gene expression levels of the PERK-ATF4-CHOP and IRE1α-XBP1s pathways, the activation of which reflects the cellular response to chronic epinephrine, leading to cellular dysfunction and apoptosis.
Reactive oxygen species (ROS) are highly reactive molecules that can impair β-cell function by decreasing insulin secretion, increasing insulin resistance, and altering gene expression. Oxidative stress and ER stress are highly interrelated biological processes that coexist and induce each other [36]; during ER stress, oxidative protein folding load and capacity are enhanced, leading to increased ROS production [37,38,39]. However, the endoplasmic reticulum antioxidant enzyme system has limited protective effects, which predisposes the intracellular oxidative and antioxidant systems to become imbalanced under ER stress in favor of an oxidized state, which in turn induces oxidative stress [38,40,41]. In the oxidative stress state, the levels of intracellular antioxidant enzymes are increased to adapt to the oxidative stress (Figure 8A–D). Consistent with previous studies, decreased expression of antioxidant genes due to NRF2 downregulation (Figure 8E), as well as decreased UCP2, induces ROS accumulation (Figure 5B), which in turn leads to oxidative damage and cytotoxicity in β-cells. In addition, elevated expression levels of OPA1, Pink1, and PRKN were also detected, which may imply mitochondrial damage (Figure 5C). Thus, ROS production is associated with UPR under ER stress and induces the mitochondria to produce ROS as well, leading to oxidative stress, and oxidative stress predominantly arises from an imbalance between the generation of ROS and the protective mechanisms afforded by the corresponding antioxidants. In conclusion, prolonged exposure to epinephrine leads to increased ROS production. Despite the upregulation of antioxidant enzyme activities, the persistence of oxidative stress impairs the function and viability of pancreatic β-cells.

4. Materials and Methods

4.1. Cell Culture

MIN6 cells were originated from Prof. Jun-ichi Miyazaki (Osaka University, Japan) and were transferred from the West China Medical College of Sichuan University. Epinephrine for cell culture was obtained from the Animal Hospital of Southwest University, and the concentration used in this study was 100 nM. The experiments were conducted on MIN6 cells, with between 32 and 40 passages. The cells were grown in RPMI 1640 medium (Solarbio, Beijing, China), supplemented with 10% FBS (Gibco) and 50 µM β-mercaptoethanol (Gibco) in a humidified atmosphere of 5% CO2 at 37 °C.

4.2. Cell Number, Cell Viability, and Cycle Assays

Cell count: The procedure commenced with the detachment of cells utilizing Trypsin-EDTA, followed by their resuspension in a medium integrated with 0.4% Trypan Blue at a concentration of 10%. Subsequently, the cell suspension was transferred to a conventional hemocytometer for microscopic analysis at 10-fold magnification. To ensure accuracy, the enumeration process involved triplicate assessments of cell counts within a delineated grid. The arithmetic mean of these counts was then computed to ascertain the viable cell concentration per milliliter.
Cell viability assay: Cells (1 × 10⁴ cells/well) were inoculated in 96-well plates, and 100 μL of the compounds were added to fresh medium and incubated for 24 h. The cell culture medium was removed, 10% CCK8 (Beyotime, Shanghai, China) solution was applied to the medium, and it was reincubated for 2 h. The absorbance at 450 nm was measured using a microplate reader (Bio-Rad, Hercules, CA, USA).
Cell cycle assay: The cells were fixed using pre-cooled 70% ethanol at 4 °C for 24 h, followed by the addition of 0.5 mL of propidium iodide staining solution (Beyotime) in a warm bath at 37 °C, away from light, for 30 min. Red fluorescence was detected using a flow cytometer (ACEC) at an excitation wavelength of 488 nm, and data were processed using FlowJo software v10.

4.3. Insulin Secretion Assay

Glucose-stimulated insulin secretion was achieved in MIN6 cells, as described previously [5]. Briefly, MIN6 cells were incubated in Kreb’s buffer (118 mM NaCl, 4.8 mM KCl, 1.2 mM MgSO4, 1.2 mM KH2PO4, 2.5 mM NaHCO3, 2.5 mM CaCl2·2H2O (pH 7.4)) for half an hour, and then in Kreb’s buffer containing 0, 2.8, 10, and 20 mM glucose for 1 h, and the supernatant was removed for insulin assay. The cells were lysed with cold lysis buffer, and the total protein content was determined by BCA protein assay (Beyotime). The insulin content was measured using an insulin radioimmunoassay kit (BNIBT, F01TB) and normalized to the total protein content.

4.4. RNA Sequencing and Analysis

After different treatments, MIN6 cells (control, n = 3; chronic epinephrine exposure, n = 3) were collected and submitted to Gene Denovo Biotechnology (Guangzhou, China) for high-throughput RNA sequencing (RNA-seq). Briefly, total RNA was extracted using a Trizol kit (Invitrogen, Carlsbad, CA, USA), according to the manufacturer’s experimental protocols, and RNA integrity was assessed on a NanoPhotometer spectrophotometer and an Agilent 2100 Bioanalyzer system (Agilent Technologies, Santa Clara, CA, USA) to assess RNA integrity, and the resulting cDNA libraries were sequenced using an Illumina Novaseq6000. Statistical analysis was performed using DESeq2 and edgeR [42,43]. The GO and Kyoto Encyclopedia of Genes and Genomes (KEGG) terms, with corrected p < 0.05, were defined as significantly enriched by the commonly expressed genes (CEGs) and differently expressed genes (DEGs) [44].

4.5. Biochemical Parameters Assays

The samples were collected and centrifuged briefly to obtain a clear supernatant for analysis. Total antioxidant capacity (T-AOC assay kit, A015-3), superoxide dismutase box (SOD assay kit, A001-3-2), catalase (CAT assay kit, A007-1), glutathione peroxidase (GSH-Px assay kit, A005-1-2), and ATP content (ATP assay kit, A095-1-1) were assayed, in accordance with the production instructions of Nanjing Jiancheng Bioengineering Institute (Nanjing, China).

4.6. Transmission Electron Microscopy (TEM)

Well-treated cells were fixed using 2.5% glutaraldehyde at 4 °C for 4 h (Servicebio) and submitted to Servicebio Biotechnology (Wuhan, China) for ultrathin sectioning (70 nm) and transmission electron microscopy imaging (HITACHI HT7700). For quantification of the docked insulin granules, at least six random sections were used per group, and vesicles with dense bodies within 0.2 μm of the plasma membrane were considered to be docked insulin granules.

4.7. Quantitative Real Time PCR

Total RNA was extracted from MIN6 cells using Trizol reagent (Thermo Fisher Scientific, Waltham, MA, USA), and mRNA was reverse transcribed into cDNA using PrimeScriptTM RT reagent and gDNA Eraser (RR047A, Takara, Beijing, China). For each sample, TB Green Premix Ex TaqTM II (RR820A, Takara, Beijing, China), combined with CFX96 TouchTM Real-time qPCR Detection system (Bio-Rad, Hercules, CA, USA), was used to quantify the relative expression of mRNA. The primer sequences are shown in Table S1.

4.8. Statistical Analysis

Quantitative data were expressed as mean ± standard error of the mean (SEM). Statistical analysis was performed using GraphPad Prism 8.0.2 software. The statistical significance of the difference between the groups was determined by t-test, and the difference was statistically significant at p < 0.05. The data were from at least three biological replicates, and “n” represents the number of independent samples in each group. * p < 0.05; ** p < 0.01.

5. Conclusions

Our research reveals profound effects of chronic epinephrine exposure on MIN6 cell function. Through high-throughput RNA sequencing, we identified multiple differentially expressed genes whose changes point to the regulation of key biological processes, including insulin secretion, cell fate, and oxidative stress. In particular, the inability of pancreatic β-cells to recover from prolonged adrenergic stimulation leads to the development of ER and oxidative stress, which impair islet β-cell function and survival (Figure 9). Furthermore, our data suggest a complex interaction between α2A-AR desensitization and the regulation of insulin secretion.

Supplementary Materials

The following supporting information can be downloaded at: https://www.mdpi.com/article/10.3390/ijms25137029/s1.

Author Contributions

Conceptualization, X.C. and S.W.L.; formal analysis, X.C.; data curation, X.C., R.Z. and B.Y.; writing—original draft preparation, X.C., R.Z. and B.Y.; writing—review and editing, X.C., R.Z., B.Y., R.L., S.W.L. and Y.Z.; funding acquisition, X.C. and Y.Z. All authors have read and agreed to the published version of the manuscript.

Funding

This research was funded by the National Natural Science Foundation of China (Grant No. 31602021, X.C., principal investigator), and the Collection, Utilization and Innovation of Animal Resources by Research Institutes and Enterprises of Chongqing (No. qnyncw-kqlhtxm).

Institutional Review Board Statement

Not applicable.

Informed Consent Statement

Not applicable.

Data Availability Statement

The RNA-seq data is accessible at Gene Expression Omnibus (accession number: GSE269666). All remaining data are included in the article and Supplementary Materials files or are available from the authors upon reasonable request.

Acknowledgments

We especially appreciate Huanyun Zhao and Yiqin Zhao for their assistance in data collation.

Conflicts of Interest

The authors declare no conflicts of interest.

References

  1. Lyssenko, V.; Almgren, P.; Anevski, D.; Perfekt, R.; Lahti, K.; Nissén, M.; Isomaa, B.; Forsen, B.; Homström, N.; Saloranta, C.; et al. Predictors of and Longitudinal Changes in Insulin Sensitivity and Secretion Preceding Onset of Type 2 Diabetes. Diabetes 2005, 54, 166–174. [Google Scholar] [CrossRef] [PubMed]
  2. Krentz, N.A.J.; Gloyn, A.L. Insights into pancreatic islet cell dysfunction from type 2 diabetes mellitus genetics. Nat. Rev. Endocrinol. 2020, 16, 202–212. [Google Scholar] [CrossRef] [PubMed]
  3. Ahmad, E.; Lim, S.; Lamptey, R.; Webb, D.R.; Davies, M.J. Type 2 diabetes. Lancet 2022, 400, 1803–1820. [Google Scholar] [CrossRef] [PubMed]
  4. Cannataro, R.; Cione, E.; Cerullo, G.; Rondanelli, M.; Micheletti, P.; Crisafulli, O.; Micheli, M.L.; D’Antona, G. Type 1 diabetes management in a competitive athlete: A five-year case report. Physiol. Rep. 2023, 11, e15740. [Google Scholar] [CrossRef] [PubMed]
  5. Wang, R.R.; Qiu, X.; Pan, R.; Fu, H.; Zhang, Z.; Wang, Q.; Chen, H.; Wu, Q.Q.; Pan, X.; Zhou, Y.; et al. Dietary intervention preserves β cell function in mice through CTCF-mediated transcriptional reprogramming. J. Exp. Med. 2022, 219, e20211779. [Google Scholar] [CrossRef] [PubMed]
  6. Chen, C.W.; Guan, B.J.; Alzahrani, M.R.; Gao, Z.; Gao, L.; Bracey, S.; Wu, J.; Mbow, C.A.; Jobava, R.; Haataja, L.; et al. Adaptation to chronic ER stress enforces pancreatic β-cell plasticity. Nat. Commun. 2022, 13, 4621. [Google Scholar] [CrossRef] [PubMed]
  7. Prentki, M.; Nolan, C.J. Islet beta cell failure in type 2 diabetes. J. Clin. Investig. 2006, 116, 1802–1812. [Google Scholar] [CrossRef] [PubMed]
  8. Krizanova, O.; Babula, P.; Pacak, K. Stress, catecholaminergic system and cancer. Stress 2016, 19, 419–428. [Google Scholar] [CrossRef] [PubMed]
  9. Lara-Cinisomo, S.; Grewen, K.M.; Girdler, S.S.; Wood, J.; Meltzer-Brody, S. Perinatal Depression, Adverse Life Events, and Hypothalamic-Adrenal-Pituitary Axis Response to Cold Pressor Stress in Latinas: An Exploratory Study. Womens Health Issues 2017, 27, 673–682. [Google Scholar] [CrossRef] [PubMed]
  10. Li, R.; Huang, H.; Limesand, S.W.; Chen, X. Pancreatic Islets Exhibit Dysregulated Adaptation of Insulin Secretion after Chronic Epinephrine Exposure. Curr. Issues Mol. Biol. 2021, 43, 240–250. [Google Scholar] [CrossRef] [PubMed]
  11. Chen, X.; Green, A.S.; Macko, A.R.; Yates, D.T.; Kelly, A.C.; Limesand, S.W. Enhanced insulin secretion responsiveness and islet adrenergic desensitization after chronic norepinephrine suppression is discontinued in fetal sheep. Am. J. Physiol. Endocrinol. Metab. 2014, 306, E58–E64. [Google Scholar] [CrossRef] [PubMed]
  12. Yates, D.T.; Macko, A.R.; Chen, X.; Green, A.S.; Kelly, A.C.; Anderson, M.J.; Fowden, A.L.; Limesand, S.W. Hypoxaemia-induced catecholamine secretion from adrenal chromaffin cells inhibits glucose-stimulated hyperinsulinaemia in fetal sheep. J. Physiol. 2012, 590, 5439–5447. [Google Scholar] [CrossRef] [PubMed]
  13. Ashcroft, F.M.; Rorsman, P. Diabetes mellitus and the β cell: The last ten years. Cell 2012, 148, 1160–1171. [Google Scholar] [CrossRef] [PubMed]
  14. Hoermann, H.; van Faassen, M.; Roeper, M.; Hagenbeck, C.; Herebian, D.; Muller Kobold, A.C.; Dukart, J.; Kema, I.P.; Mayatepek, E.; Meissner, T.; et al. Association of Fetal Catecholamines with Neonatal Hypoglycemia. JAMA Pediatr. 2024, 577–585. [Google Scholar] [CrossRef] [PubMed]
  15. Kelly, A.C.; Camacho, L.E.; Pendarvis, K.; Davenport, H.M.; Steffens, N.R.; Smith, K.E.; Weber, C.S.; Lynch, R.M.; Papas, K.K.; Limesand, S.W. Adrenergic receptor stimulation suppresses oxidative metabolism in isolated rat islets and Min6 cells. Mol. Cell Endocrinol. 2018, 473, 136–145. [Google Scholar] [CrossRef] [PubMed]
  16. Ackermann, A.M.; Gannon, M. Molecular regulation of pancreatic beta-cell mass development, maintenance, and expansion. J. Mol. Endocrinol. 2007, 38, 193–206. [Google Scholar] [CrossRef] [PubMed]
  17. Lee, J.H.; Lee, J. Endoplasmic Reticulum (ER) Stress and Its Role in Pancreatic β-Cell Dysfunction and Senescence in Type 2 Diabetes. Int. J. Mol. Sci. 2022, 23, 4843. [Google Scholar] [CrossRef] [PubMed]
  18. Sharma, R.B.; Landa-Galván, H.V.; Alonso, L.C. Living Dangerously: Protective and Harmful ER Stress Responses in Pancreatic β-Cells. Diabetes 2021, 70, 2431–2443. [Google Scholar] [CrossRef] [PubMed]
  19. Shrestha, N.; De Franco, E.; Arvan, P.; Cnop, M. Pathological β-Cell Endoplasmic Reticulum Stress in Type 2 Diabetes: Current Evidence. Front. Endocrinol. 2021, 12, 650158. [Google Scholar] [CrossRef] [PubMed]
  20. Sharma, R.B.; O’Donnell, A.C.; Stamateris, R.E.; Ha, B.; McCloskey, K.M.; Reynolds, P.R.; Arvan, P.; Alonso, L.C. Insulin demand regulates β cell number via the unfolded protein response. J. Clin. Investig. 2015, 125, 3831–3846. [Google Scholar] [CrossRef] [PubMed]
  21. Kelly, A.C.; Bidwell, C.A.; Chen, X.; Macko, A.R.; Anderson, M.J.; Limesand, S.W. Chronic Adrenergic Signaling Causes Abnormal RNA Expression of Proliferative Genes in Fetal Sheep Islets. Endocrinology 2018, 159, 3565–3578. [Google Scholar] [CrossRef] [PubMed]
  22. Ito, K.; Dezaki, K.; Yoshida, M.; Yamada, H.; Miura, R.; Rita, R.S.; Ookawara, S.; Tabei, K.; Kawakami, M.; Hara, K.; et al. Endogenous α2A-Adrenoceptor-Operated Sympathoadrenergic Tones Attenuate Insulin Secretion via cAMP/TRPM2 Signaling. Diabetes 2017, 66, 699–709. [Google Scholar] [CrossRef]
  23. Kalwat, M.A.; Huang, Z.; Binns, D.D.; McGlynn, K.; Cobb, M.H. α(2)-Adrenergic Disruption of β Cell BDNF-TrkB Receptor Tyrosine Kinase Signaling. Front. Cell Dev. Biol. 2020, 8, 576396. [Google Scholar] [CrossRef] [PubMed]
  24. Komatsu, M.; McDermott, A.M.; Gillison, S.L.; Sharp, G.W. Time course of action of pertussis toxin to block the inhibition of stimulated insulin release by norepinephrine. Endocrinology 1995, 136, 1857–1863. [Google Scholar] [CrossRef] [PubMed]
  25. Kaufman, R.J. Stress signaling from the lumen of the endoplasmic reticulum: Coordination of gene transcriptional and translational controls. Genes. Dev. 1999, 13, 1211–1233. [Google Scholar] [CrossRef] [PubMed]
  26. Lee, A.S. The ER chaperone and signaling regulator GRP78/BiP as a monitor of endoplasmic reticulum stress. Methods 2005, 35, 373–381. [Google Scholar] [CrossRef] [PubMed]
  27. Ron, D.; Walter, P. Signal integration in the endoplasmic reticulum unfolded protein response. Nat. Rev. Mol. Cell Biol. 2007, 8, 519–529. [Google Scholar] [CrossRef] [PubMed]
  28. Wang, S.; Kaufman, R.J. The impact of the unfolded protein response on human disease. J. Cell Biol. 2012, 197, 857–867. [Google Scholar] [CrossRef]
  29. Kim, I.; Xu, W.; Reed, J.C. Cell death and endoplasmic reticulum stress: Disease relevance and therapeutic opportunities. Nat. Rev. Drug Discov. 2008, 7, 1013–1030. [Google Scholar] [CrossRef] [PubMed]
  30. Gaisano, H.Y. Recent new insights into the role of SNARE and associated proteins in insulin granule exocytosis. Diabetes Obes. Metab. 2017, 19 (Suppl. 1), 115–123. [Google Scholar] [CrossRef] [PubMed]
  31. Kang, F.; Xie, L.; Qin, T.; Miao, Y.; Kang, Y.; Takahashi, T.; Liang, T.; Xie, H.; Gaisano, H.Y. Plasma membrane flipping of Syntaxin-2 regulates its inhibitory action on insulin granule exocytosis. Nat. Commun. 2022, 13, 6512. [Google Scholar] [CrossRef]
  32. Li, Y.; Guo, Y.; Tang, J.; Jiang, J.; Chen, Z. New insights into the roles of CHOP-induced apoptosis in ER stress. Acta Biochim. Biophys. Sin. 2014, 46, 629–640. [Google Scholar] [CrossRef] [PubMed]
  33. Nishitoh, H. CHOP is a multifunctional transcription factor in the ER stress response. J. Biochem. 2011, 151, 217–219. [Google Scholar] [CrossRef] [PubMed]
  34. Hu, H.; Tian, M.; Ding, C.; Yu, S. The C/EBP Homologous Protein (CHOP) Transcription Factor Functions in Endoplasmic Reticulum Stress-Induced Apoptosis and Microbial Infection. Front. Immunol. 2018, 9, 3083. [Google Scholar] [CrossRef] [PubMed]
  35. Kadowaki, H.; Nishitoh, H.; Ichijo, H. Survival and apoptosis signals in ER stress: The role of protein kinases. J. Chem. Neuroanat. 2004, 28, 93–100. [Google Scholar] [CrossRef] [PubMed]
  36. Malhotra, J.D.; Kaufman, R.J. Endoplasmic reticulum stress and oxidative stress: A vicious cycle or a double-edged sword? Antioxid. Redox Signal 2007, 9, 2277–2293. [Google Scholar] [CrossRef] [PubMed]
  37. Back, S.H.; Scheuner, D.; Han, J.; Song, B.; Ribick, M.; Wang, J.; Gildersleeve, R.D.; Pennathur, S.; Kaufman, R.J. Translation attenuation through eIF2alpha phosphorylation prevents oxidative stress and maintains the differentiated state in beta cells. Cell Metab. 2009, 10, 13–26. [Google Scholar] [CrossRef]
  38. Haynes, C.M.; Titus, E.A.; Cooper, A.A. Degradation of misfolded proteins prevents ER-derived oxidative stress and cell death. Mol. Cell 2004, 15, 767–776. [Google Scholar] [CrossRef] [PubMed]
  39. Cao, S.S.; Kaufman, R.J. Endoplasmic reticulum stress and oxidative stress in cell fate decision and human disease. Antioxid. Redox Signal 2014, 21, 396–413. [Google Scholar] [CrossRef]
  40. Santos, C.X.; Tanaka, L.Y.; Wosniak, J.; Laurindo, F.R. Mechanisms and implications of reactive oxygen species generation during the unfolded protein response: Roles of endoplasmic reticulum oxidoreductases, mitochondrial electron transport, and NADPH oxidase. Antioxid. Redox Signal 2009, 11, 2409–2427. [Google Scholar] [CrossRef] [PubMed]
  41. Li, G.; Scull, C.; Ozcan, L.; Tabas, I. NADPH oxidase links endoplasmic reticulum stress, oxidative stress, and PKR activation to induce apoptosis. J. Cell Biol. 2010, 191, 1113–1125. [Google Scholar] [CrossRef] [PubMed]
  42. Love, M.I.; Huber, W.; Anders, S. Moderated estimation of fold change and dispersion for RNA-seq data with DESeq2. Genome Biol. 2014, 15, 550. [Google Scholar] [CrossRef] [PubMed]
  43. Robinson, M.D.; McCarthy, D.J.; Smyth, G.K. edgeR: A Bioconductor package for differential expression analysis of digital gene expression data. Bioinformatics 2010, 26, 139–140. [Google Scholar] [CrossRef]
  44. Luo, N.; Cheng, W.; Zhou, Y.; Gu, B.; Zhao, Z.; Zhao, Y. Screening Candidate Genes Regulating Placental Development from Trophoblast Transcriptome at Early Pregnancy in Dazu Black Goats (Capra hircus). Animals 2021, 11, 2132. [Google Scholar] [CrossRef] [PubMed]
Figure 1. Chronic epinephrine exposure increases insulin secretion responsiveness in MIN6 cells. (A) Schematic illustration of the experimental design (n = 4). (B) Detection of α2A-AR in MIN6 cells on days 3 and 5 by RT-qPCR (n = 4). (C) Glucose-induced insulin secretion from MIN6 cells incubated at 0, 2.8, 10, and 20 mM of glucose for 1 h (n = 4). (D) Total insulin content of MIN6 secreted after chronic epinephrine incubation (n = 4). * p < 0.05.
Ijms 25 07029 g001
Figure 2. Chronic epinephrine stimulation slowed MIN6 cell proliferation. (A) Cell counts for days 1–5 (n > 4). (B) Cell Counting Kit 8 (CCK8) assay showing cell viability (n = 4). * p < 0.05; ** p < 0.01.
Ijms 25 07029 g002
Figure 3. (A) PCA score plot representing the difference between the control and chronic epinephrine exposure. (B) Volcano plot of global gene expression. The statistically significant genes with a ≥2.0-fold change and a false discovery rate of less than 0.05 are plotted in red (upregulated genes) and yellow (downregulated genes). FDR, false discovery rate; FC, fold change.
Ijms 25 07029 g003
Figure 4. KEGG and GO enrichment analysis. (A) Top 10 KEGG enrichment pathway annotation classification results (p value < 0.05). (B) GO enrichment analysis of biological processes. KEGG, Kyoto Encyclopedia of Genes and Genomes; GO, Gene Ontology.
Ijms 25 07029 g004
Figure 5. Glucose stimulated increased ATP synthesis and the expression of mitochondria-related genes after chronic epinephrine exposure. (A) Cellular ATP concentrations in response to 20 mM glucose (n = 9). (B) The gene expression level of UCP2 in MIN6 cells (n = 4). (C) Expression of genes related to mitochondrial dynamics (n = 4). * p < 0.05; ** p < 0.01.
Ijms 25 07029 g005
Figure 6. Transmission electron microscopy (TEM) images of MIN6 cells. (A) Ultrastructure of insulin granules (SG), mitochondria (M), and rough endoplasmic reticulum (RER). Scale bar = 2 μm. (B) The histograms delineate the distribution of insulin granules, derived from an analysis of their relative positioning in the vicinity of the cell membrane using TEM images (n = 3). * p < 0.05.
Ijms 25 07029 g006
Figure 7. mRNA expression levels and the cell cycle in MIN6 cells. (A) Heavy-chain binding protein (BiP). (B) Inositol-requiring enzyme 1α (IRE1α) and X-box binding protein 1 (XBP1u, XBP1s). (C) Activating transcription factor 4 (ATF4), C/EBP homologous protein (CHOP), and growth arrest and DNA damage-inducible protein (GADD34). (D) Cell cycle detection by flow cytometry. (E) Expression levels of genes associated with proliferation in MIN6 cells (CTNNB1, CCND1, and PDX1); apoptosis in MIN6 cells (BCL2, BAX). These data were obtained from four biological replicates (n = 4). * p < 0.05; ** p < 0.01.
Ijms 25 07029 g007
Figure 8. Adaptive response of MIN6 cells to oxidative stress. (A) Superoxide dismutase (SOD) activity. (B) Glutathione peroxidase (GSH-Px) activity. (C) Catalase (CAT) activity. (D) Total antioxidant capacity (T-AOC). (E) Changes in NRF2 and PGC1α gene expression after chronic epinephrine exposure in MIN6 cells. These data were obtained from at least four biological replicates. * p < 0.05.
Ijms 25 07029 g008
Figure 9. Summary of the effects of chronic epinephrine exposure on MIN6 cell function and fate.
Ijms 25 07029 g009
Disclaimer/Publisher’s Note: The statements, opinions and data contained in all publications are solely those of the individual author(s) and contributor(s) and not of MDPI and/or the editor(s). MDPI and/or the editor(s) disclaim responsibility for any injury to people or property resulting from any ideas, methods, instructions or products referred to in the content.

