
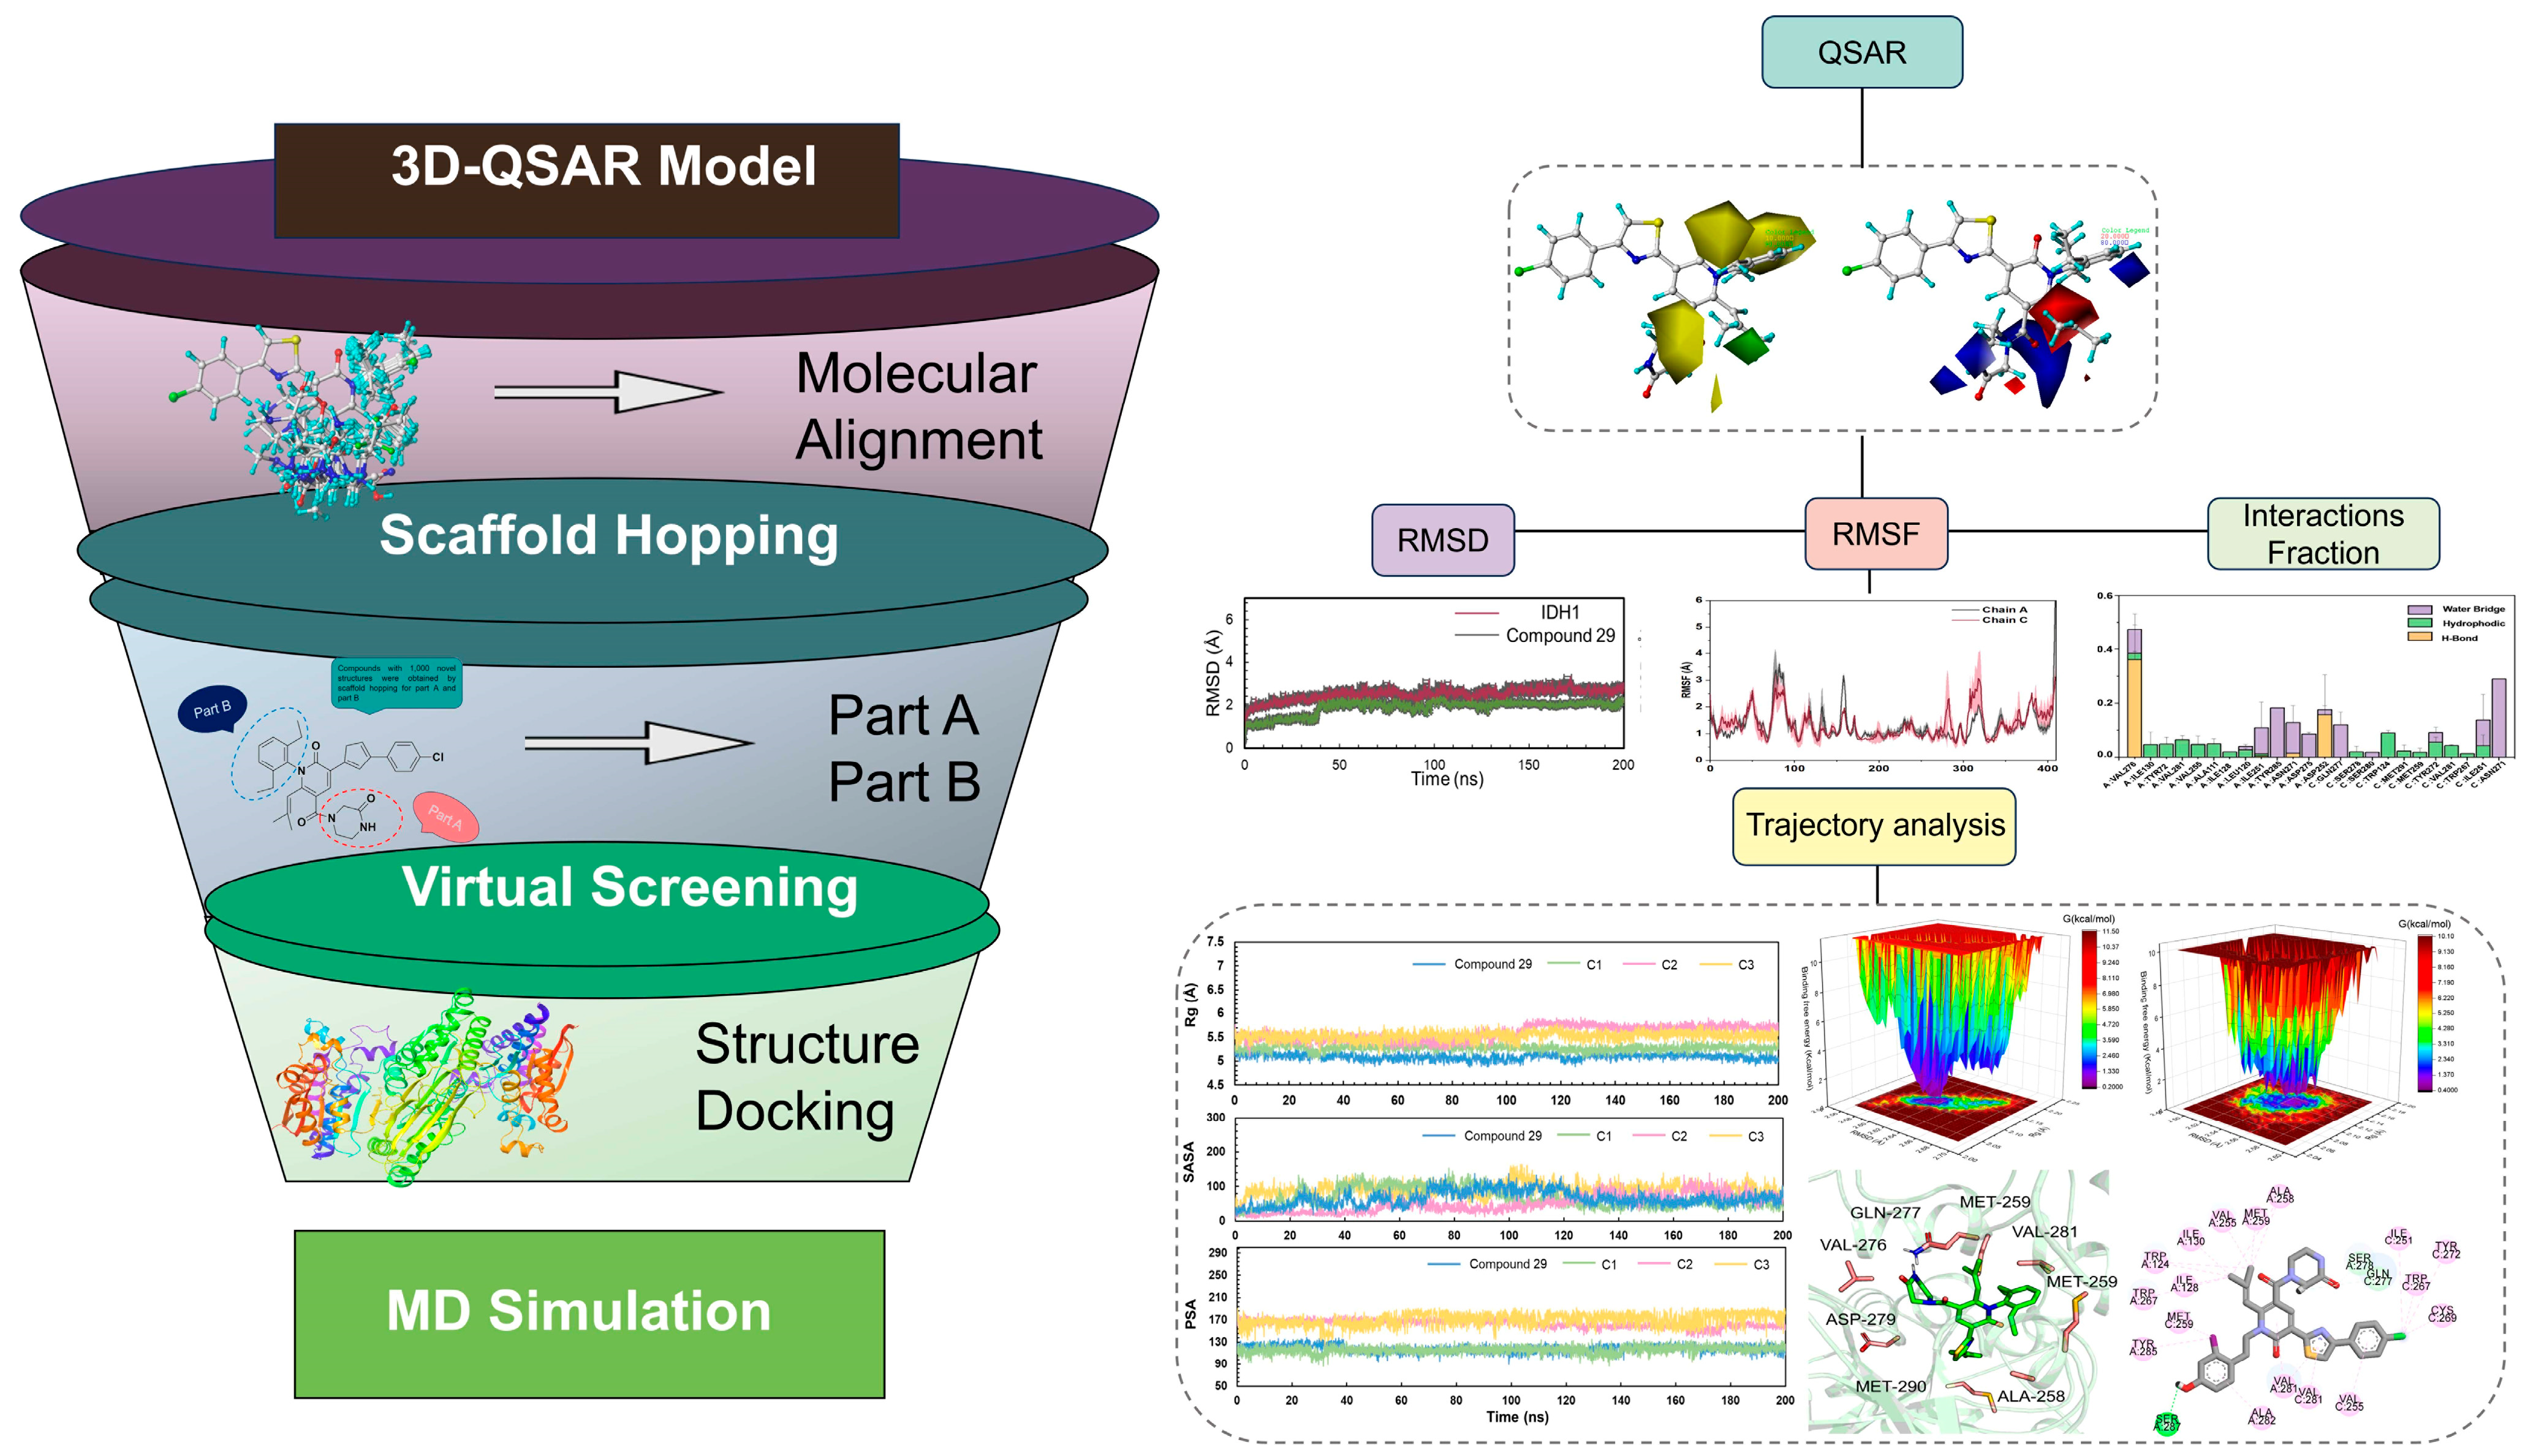
3D-QSAR, Scaffold Hopping, Virtual Screening, and Molecular Dynamics Simulations of Pyridin-2-one as mIDH1 Inhibitors


Abstract
:1. Introduction
2. Results
2.1. Data Sets and Molecular Alignment
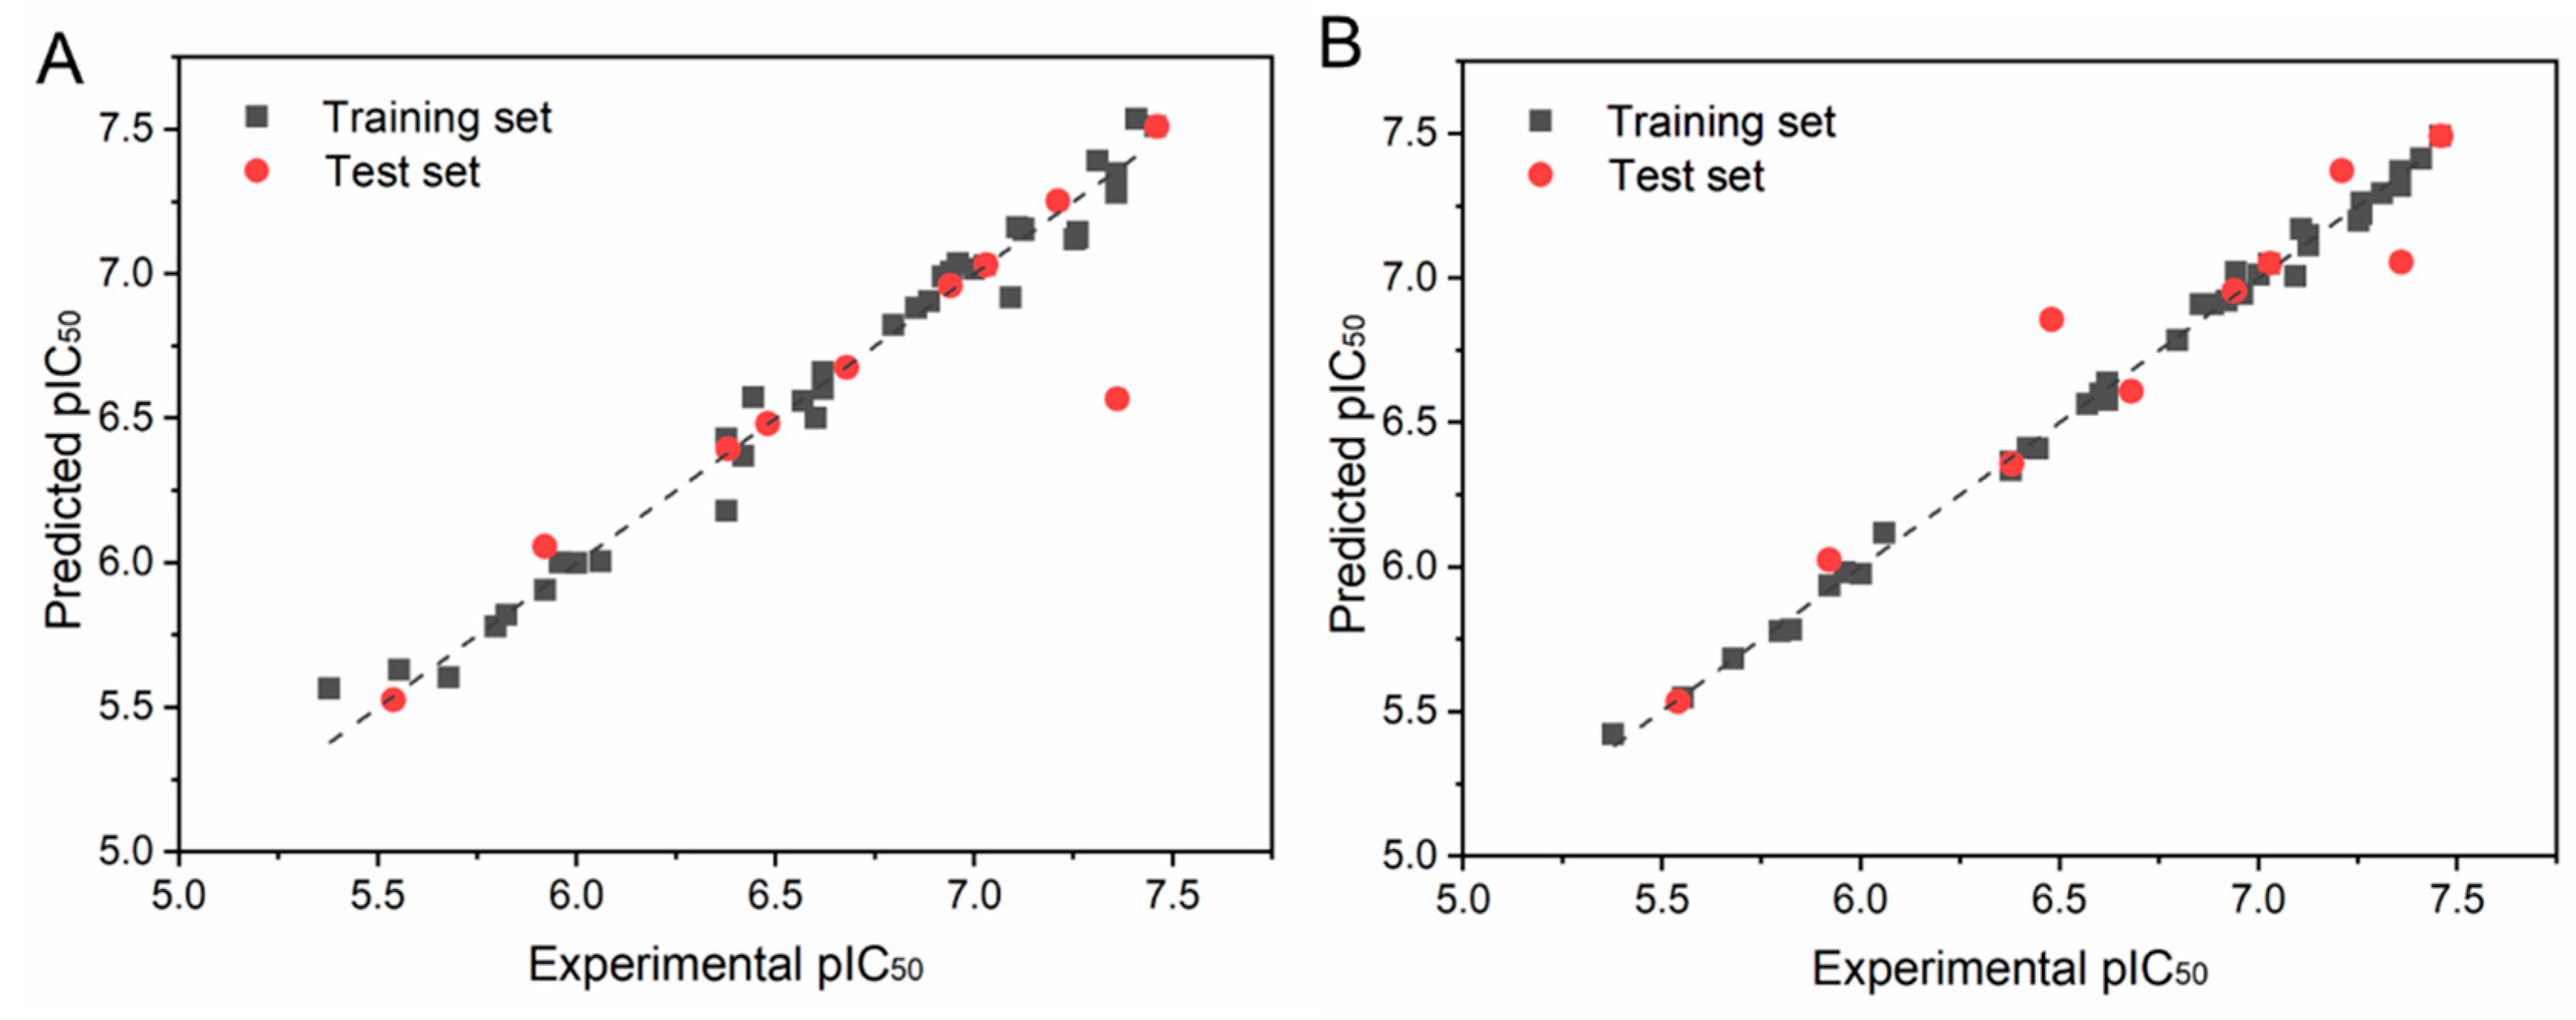
2.2. CoMFA and CoMSIA
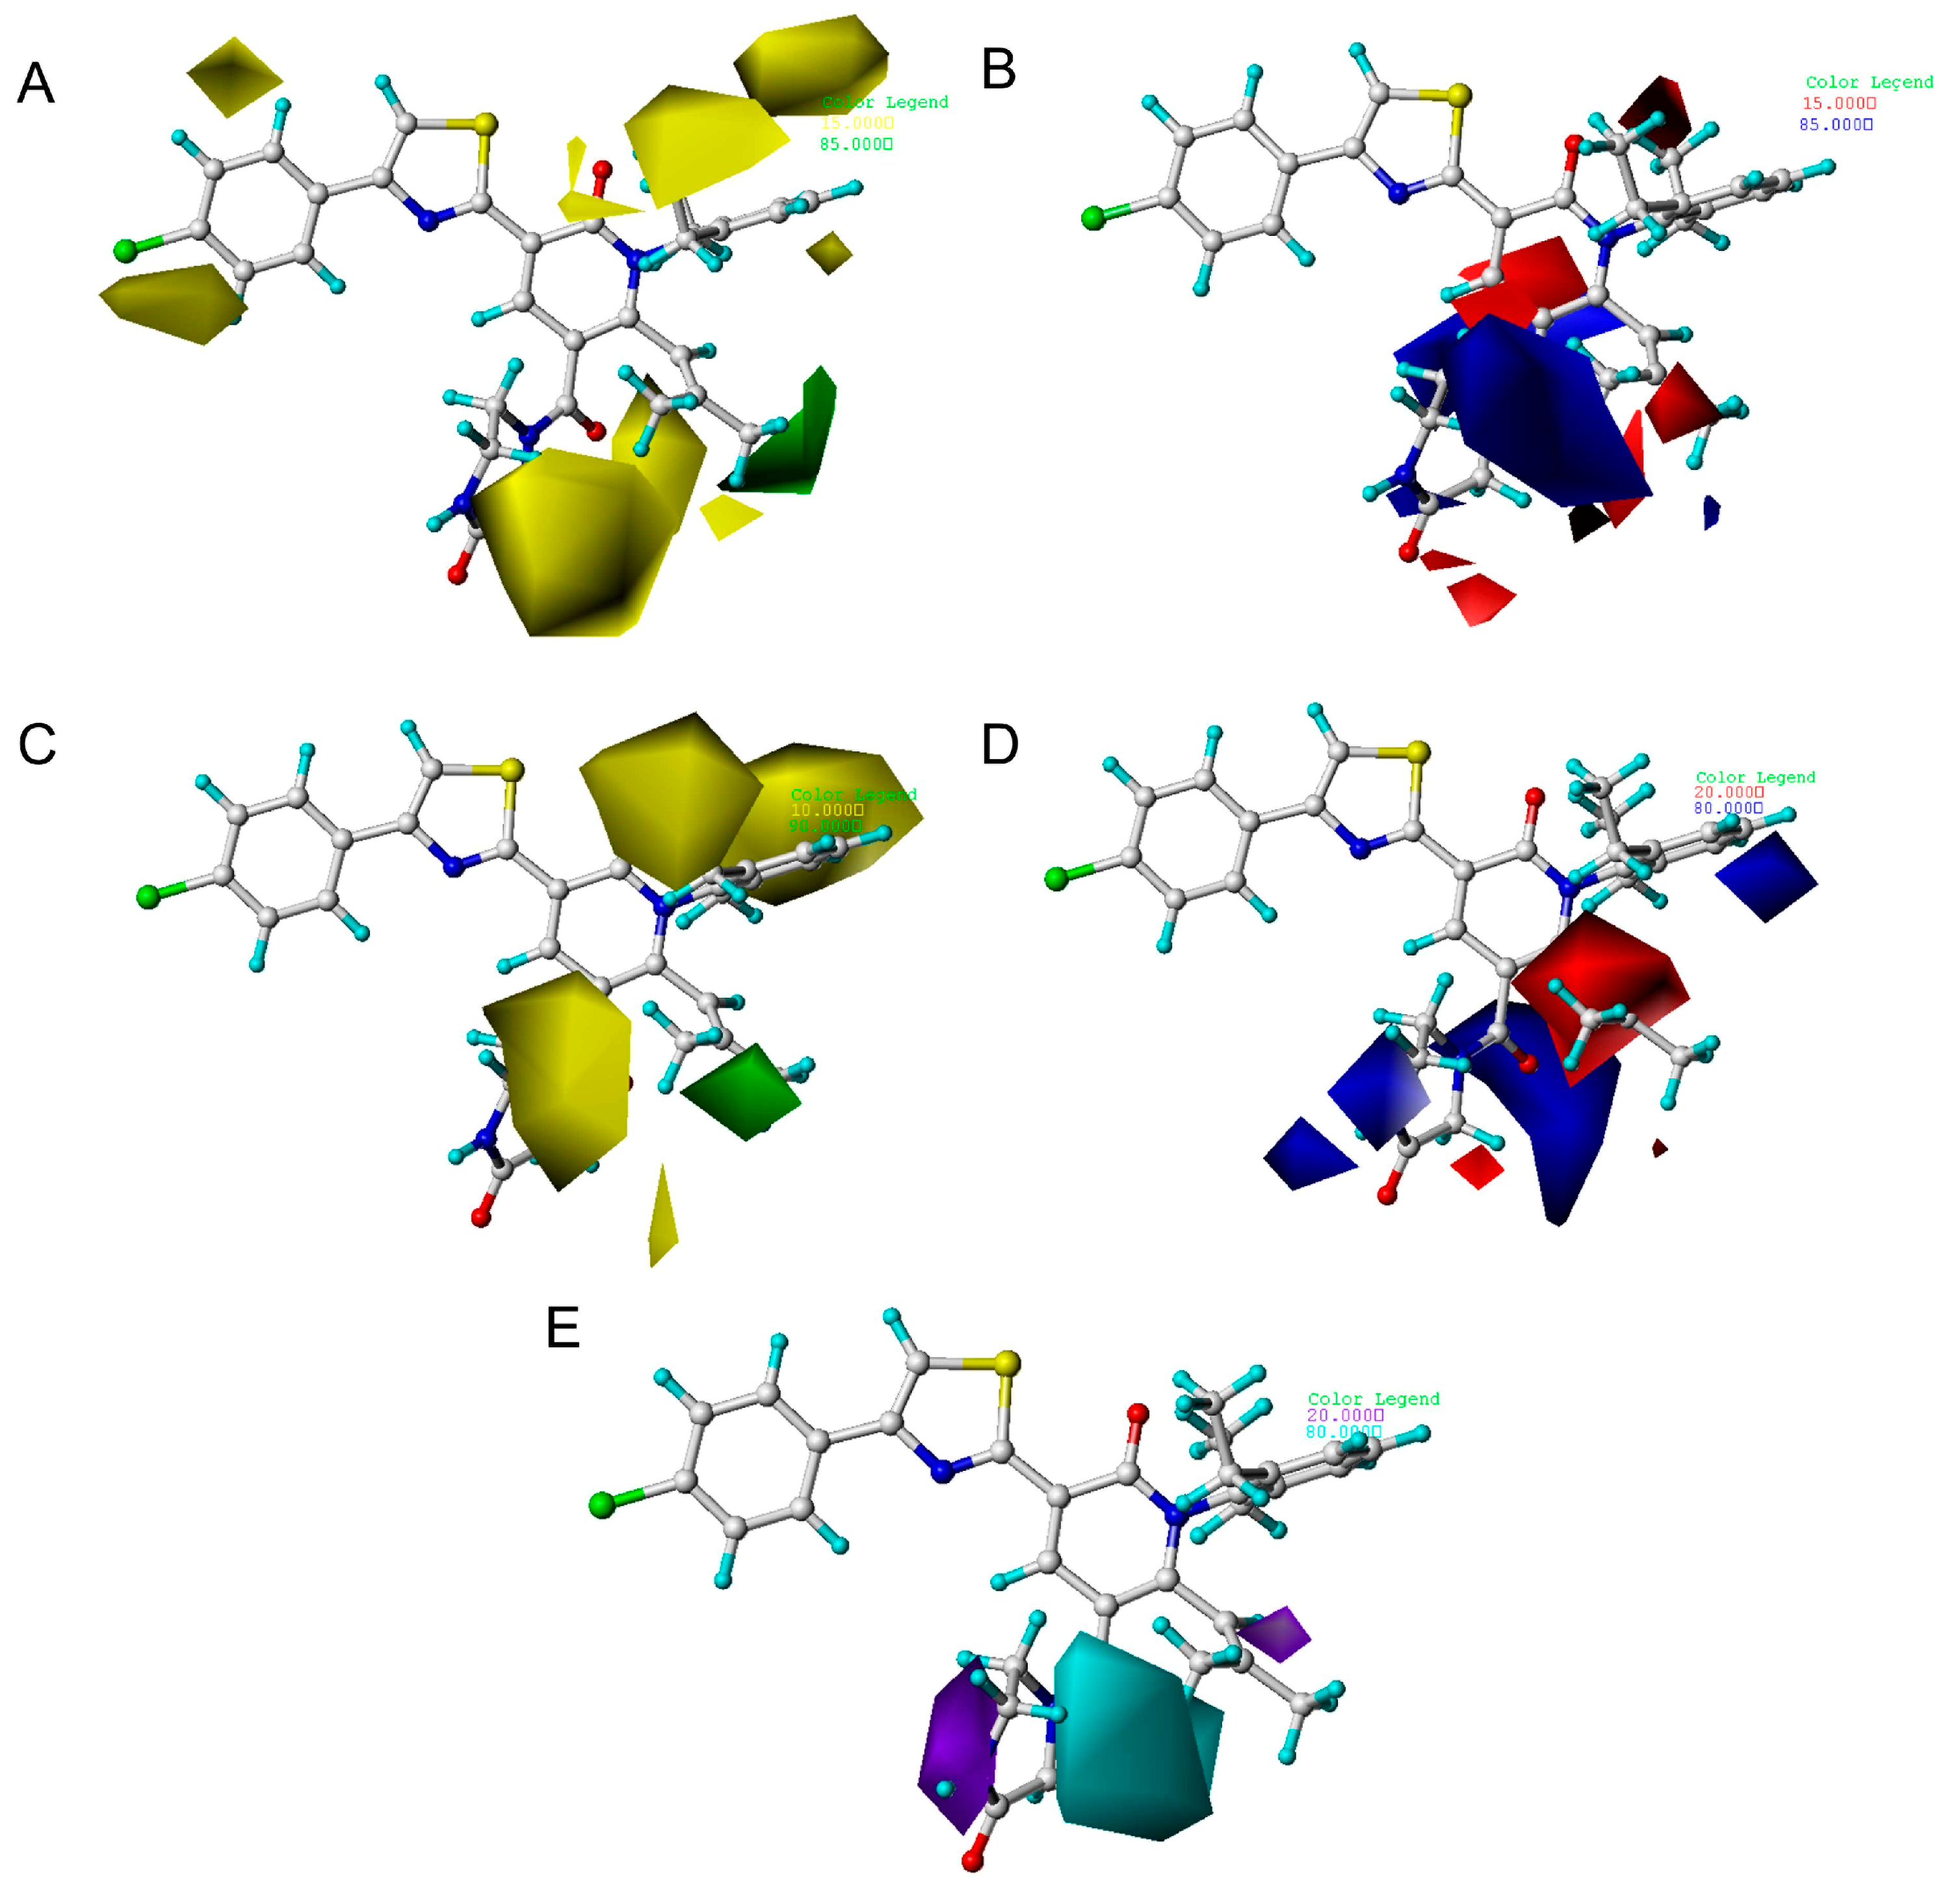
2.3. The Analysis of 3D Contour Maps
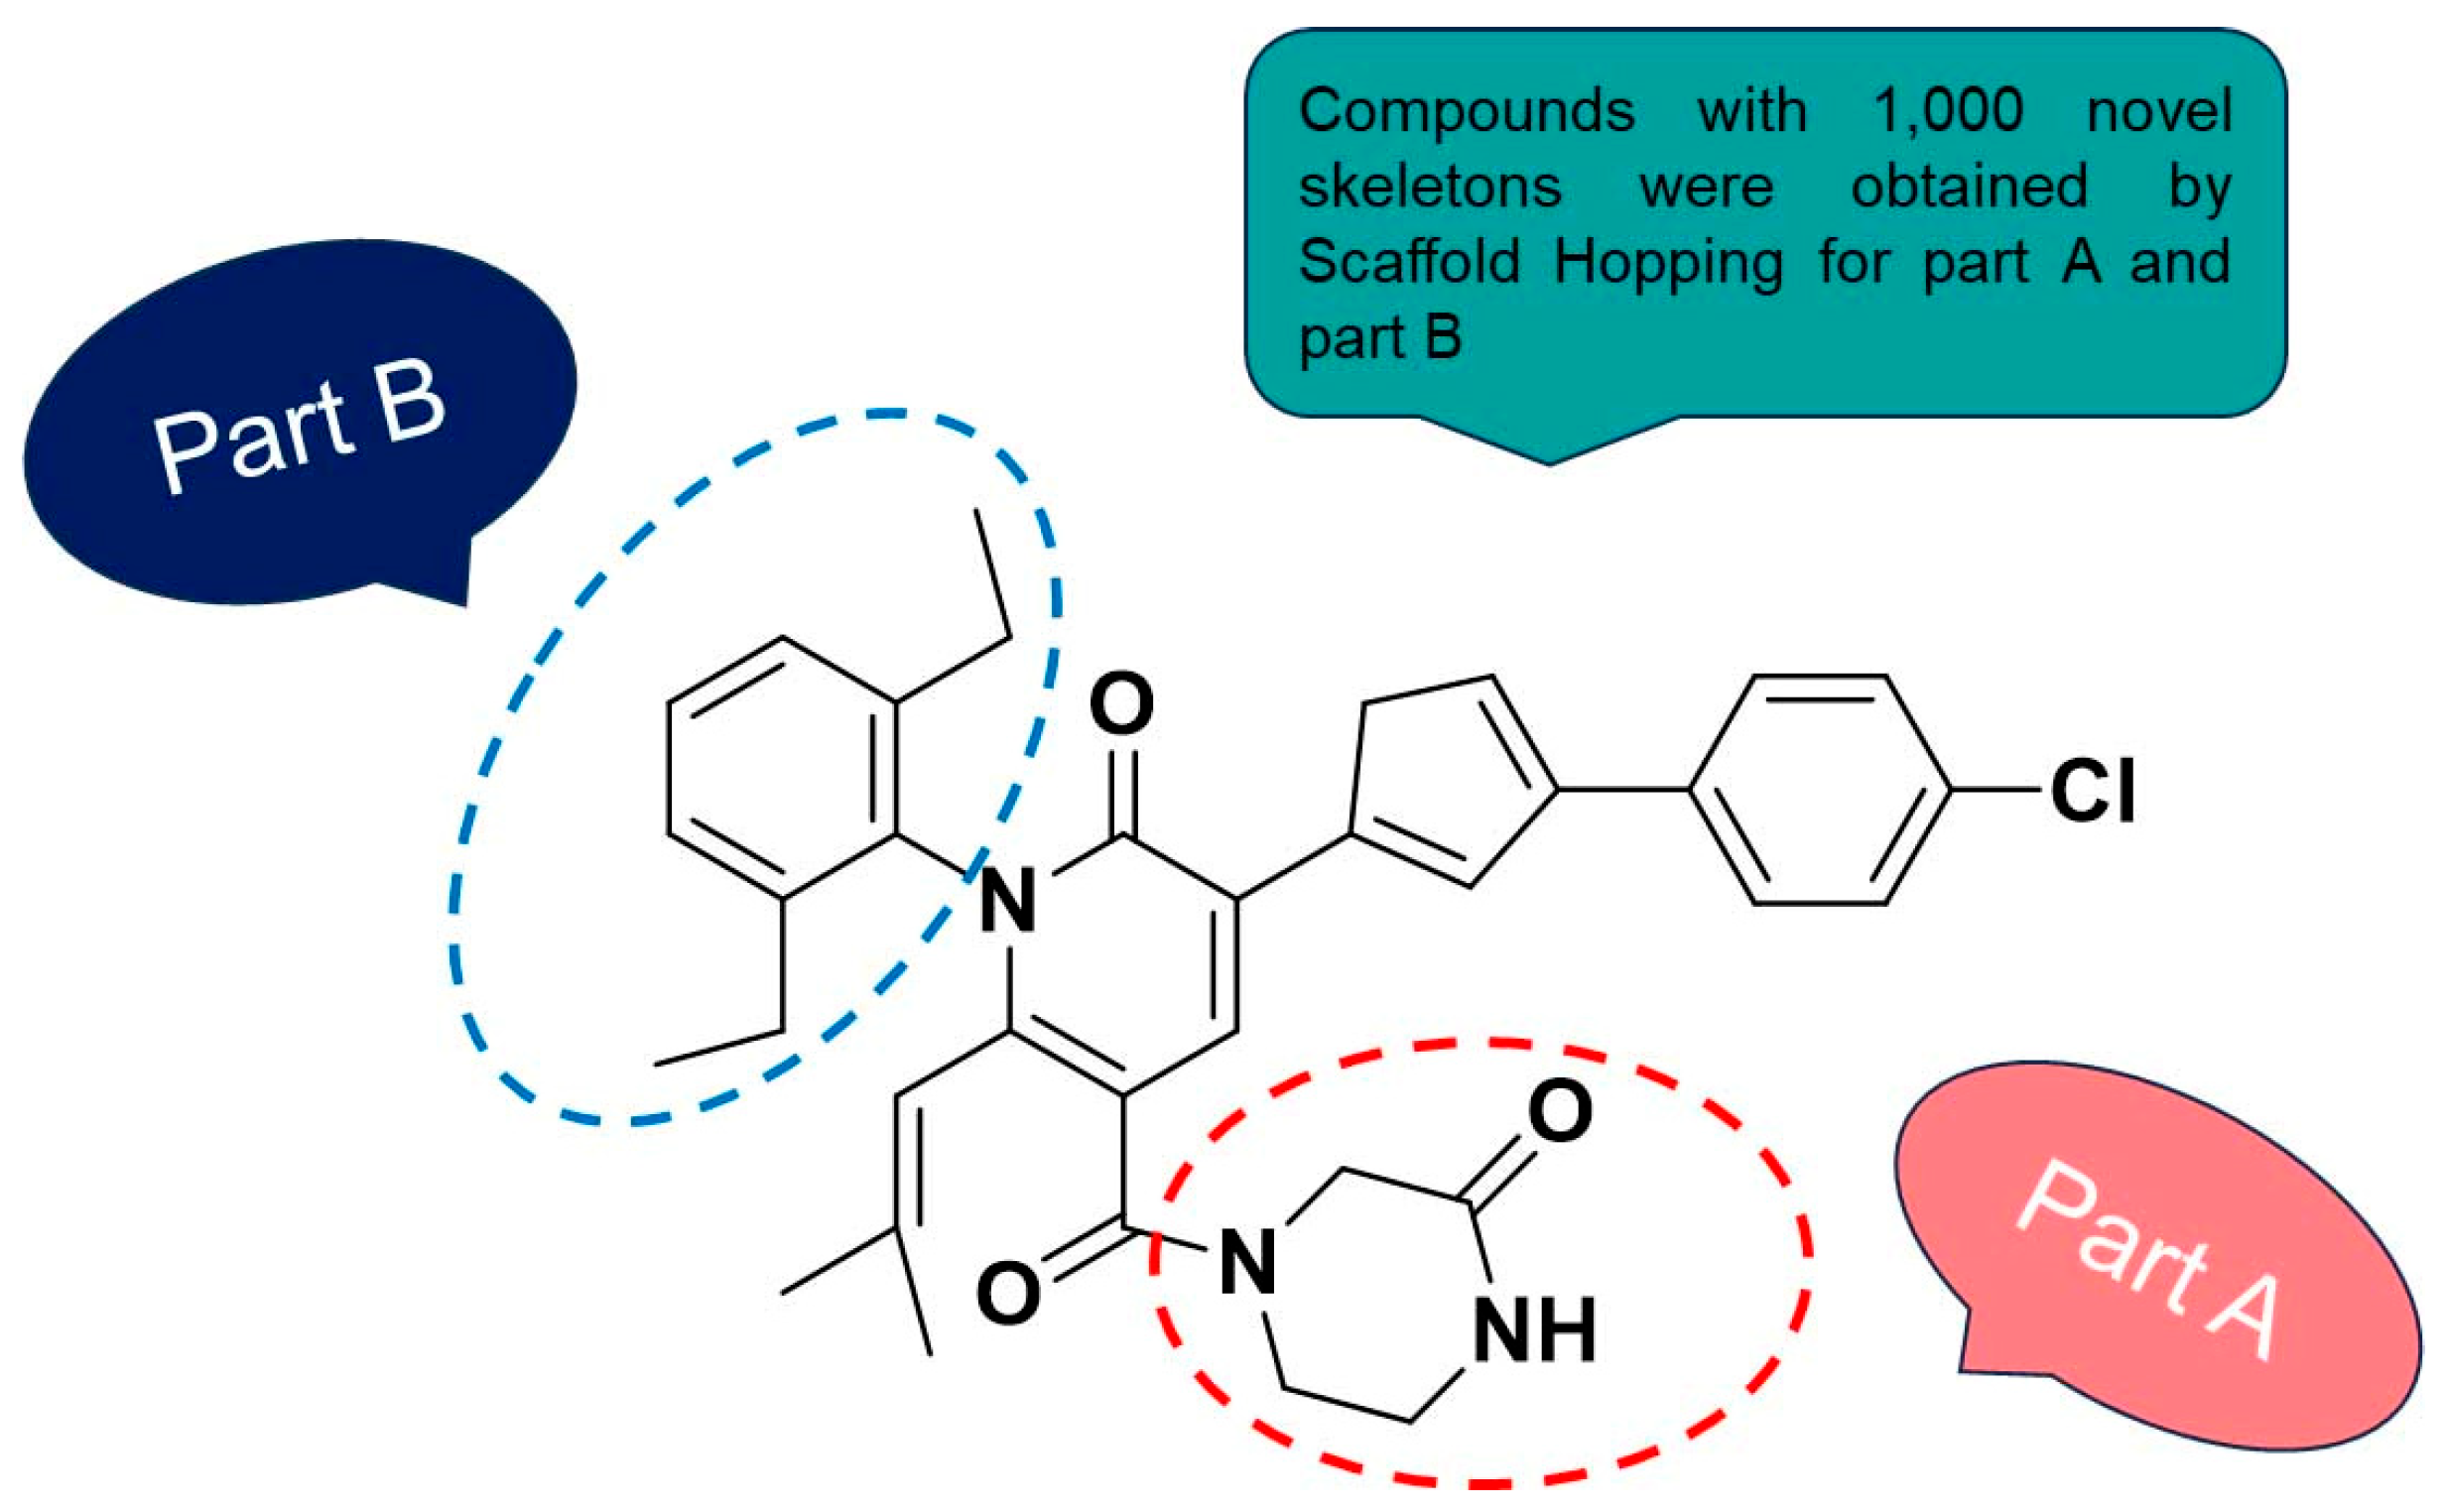
2.4. Scaffold Hopping and Virtual Screening
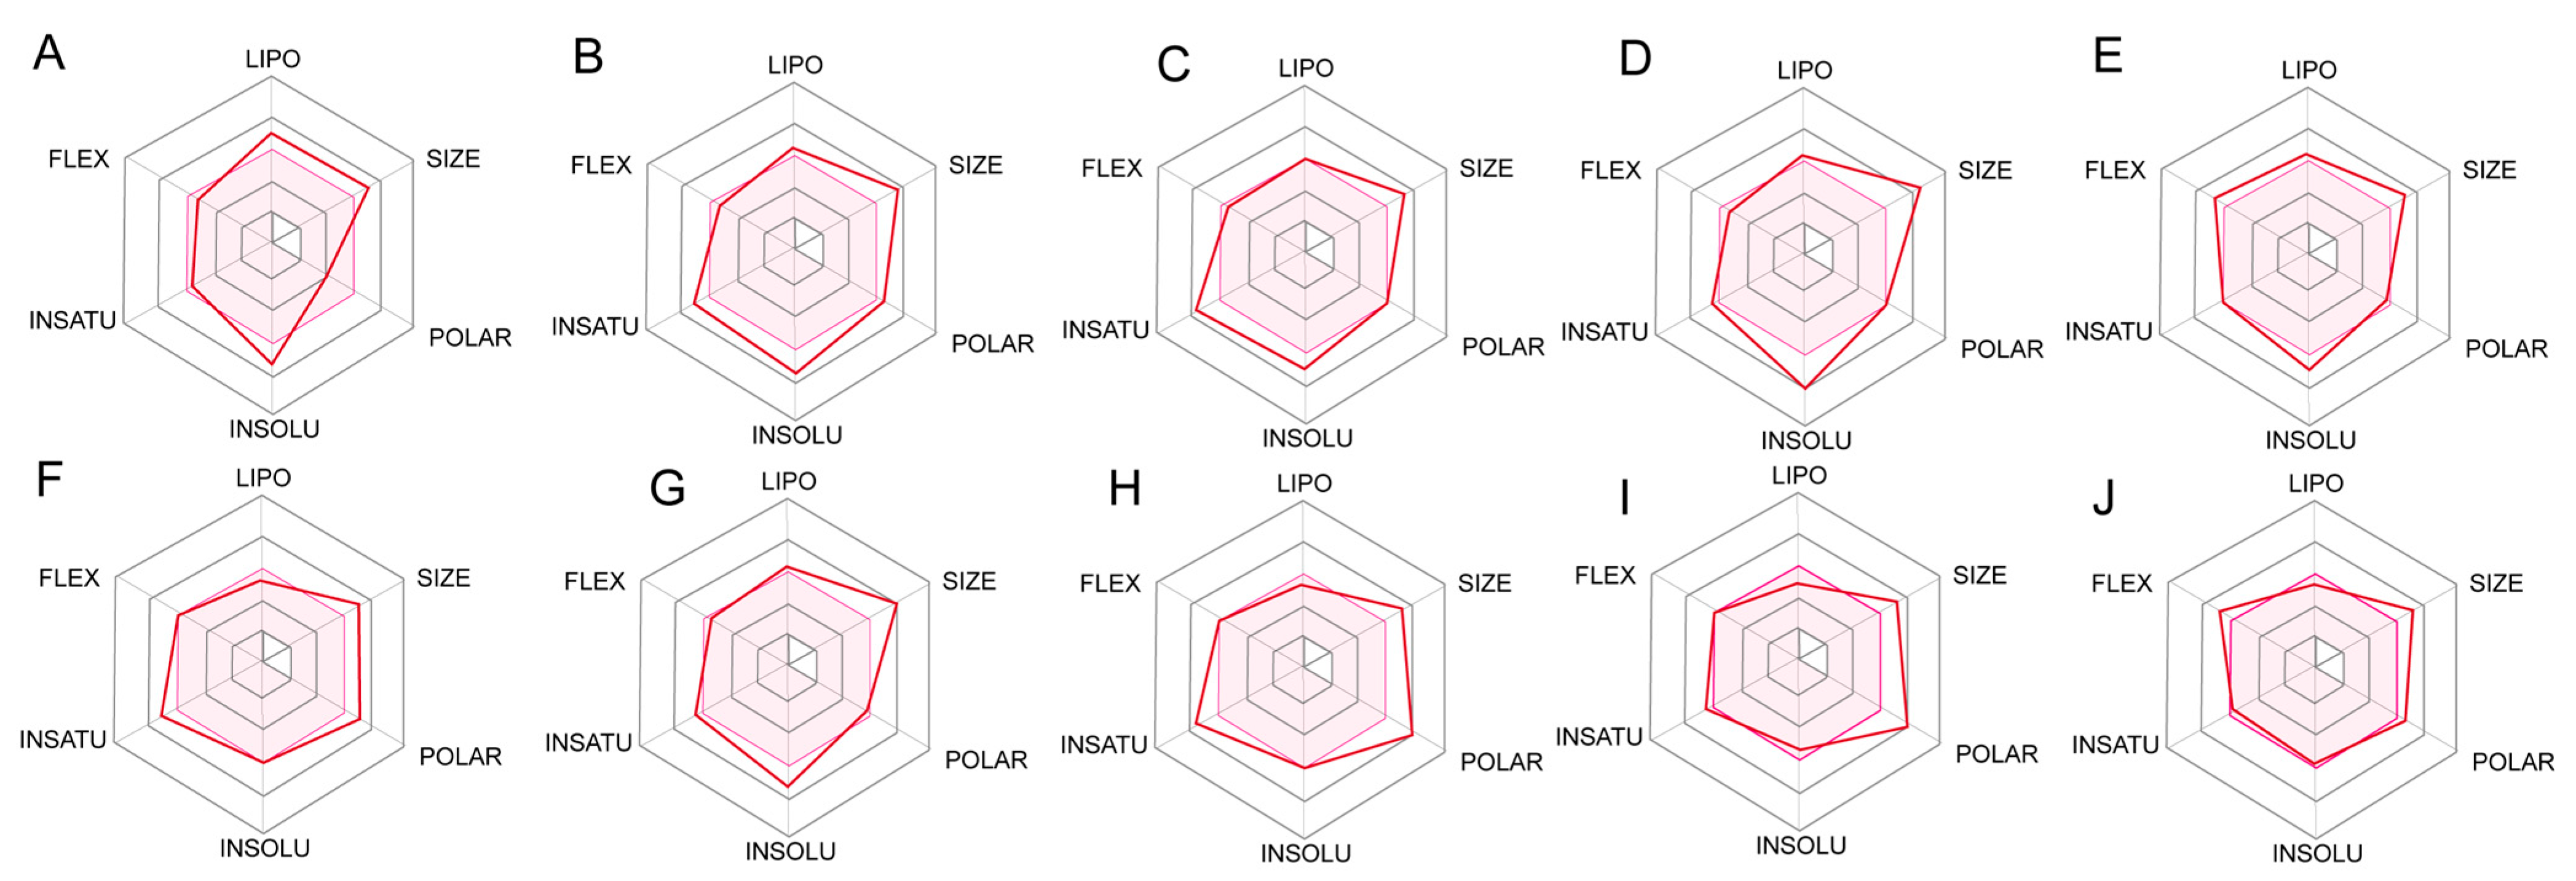
2.5. ADME Prediction for Designed Compounds
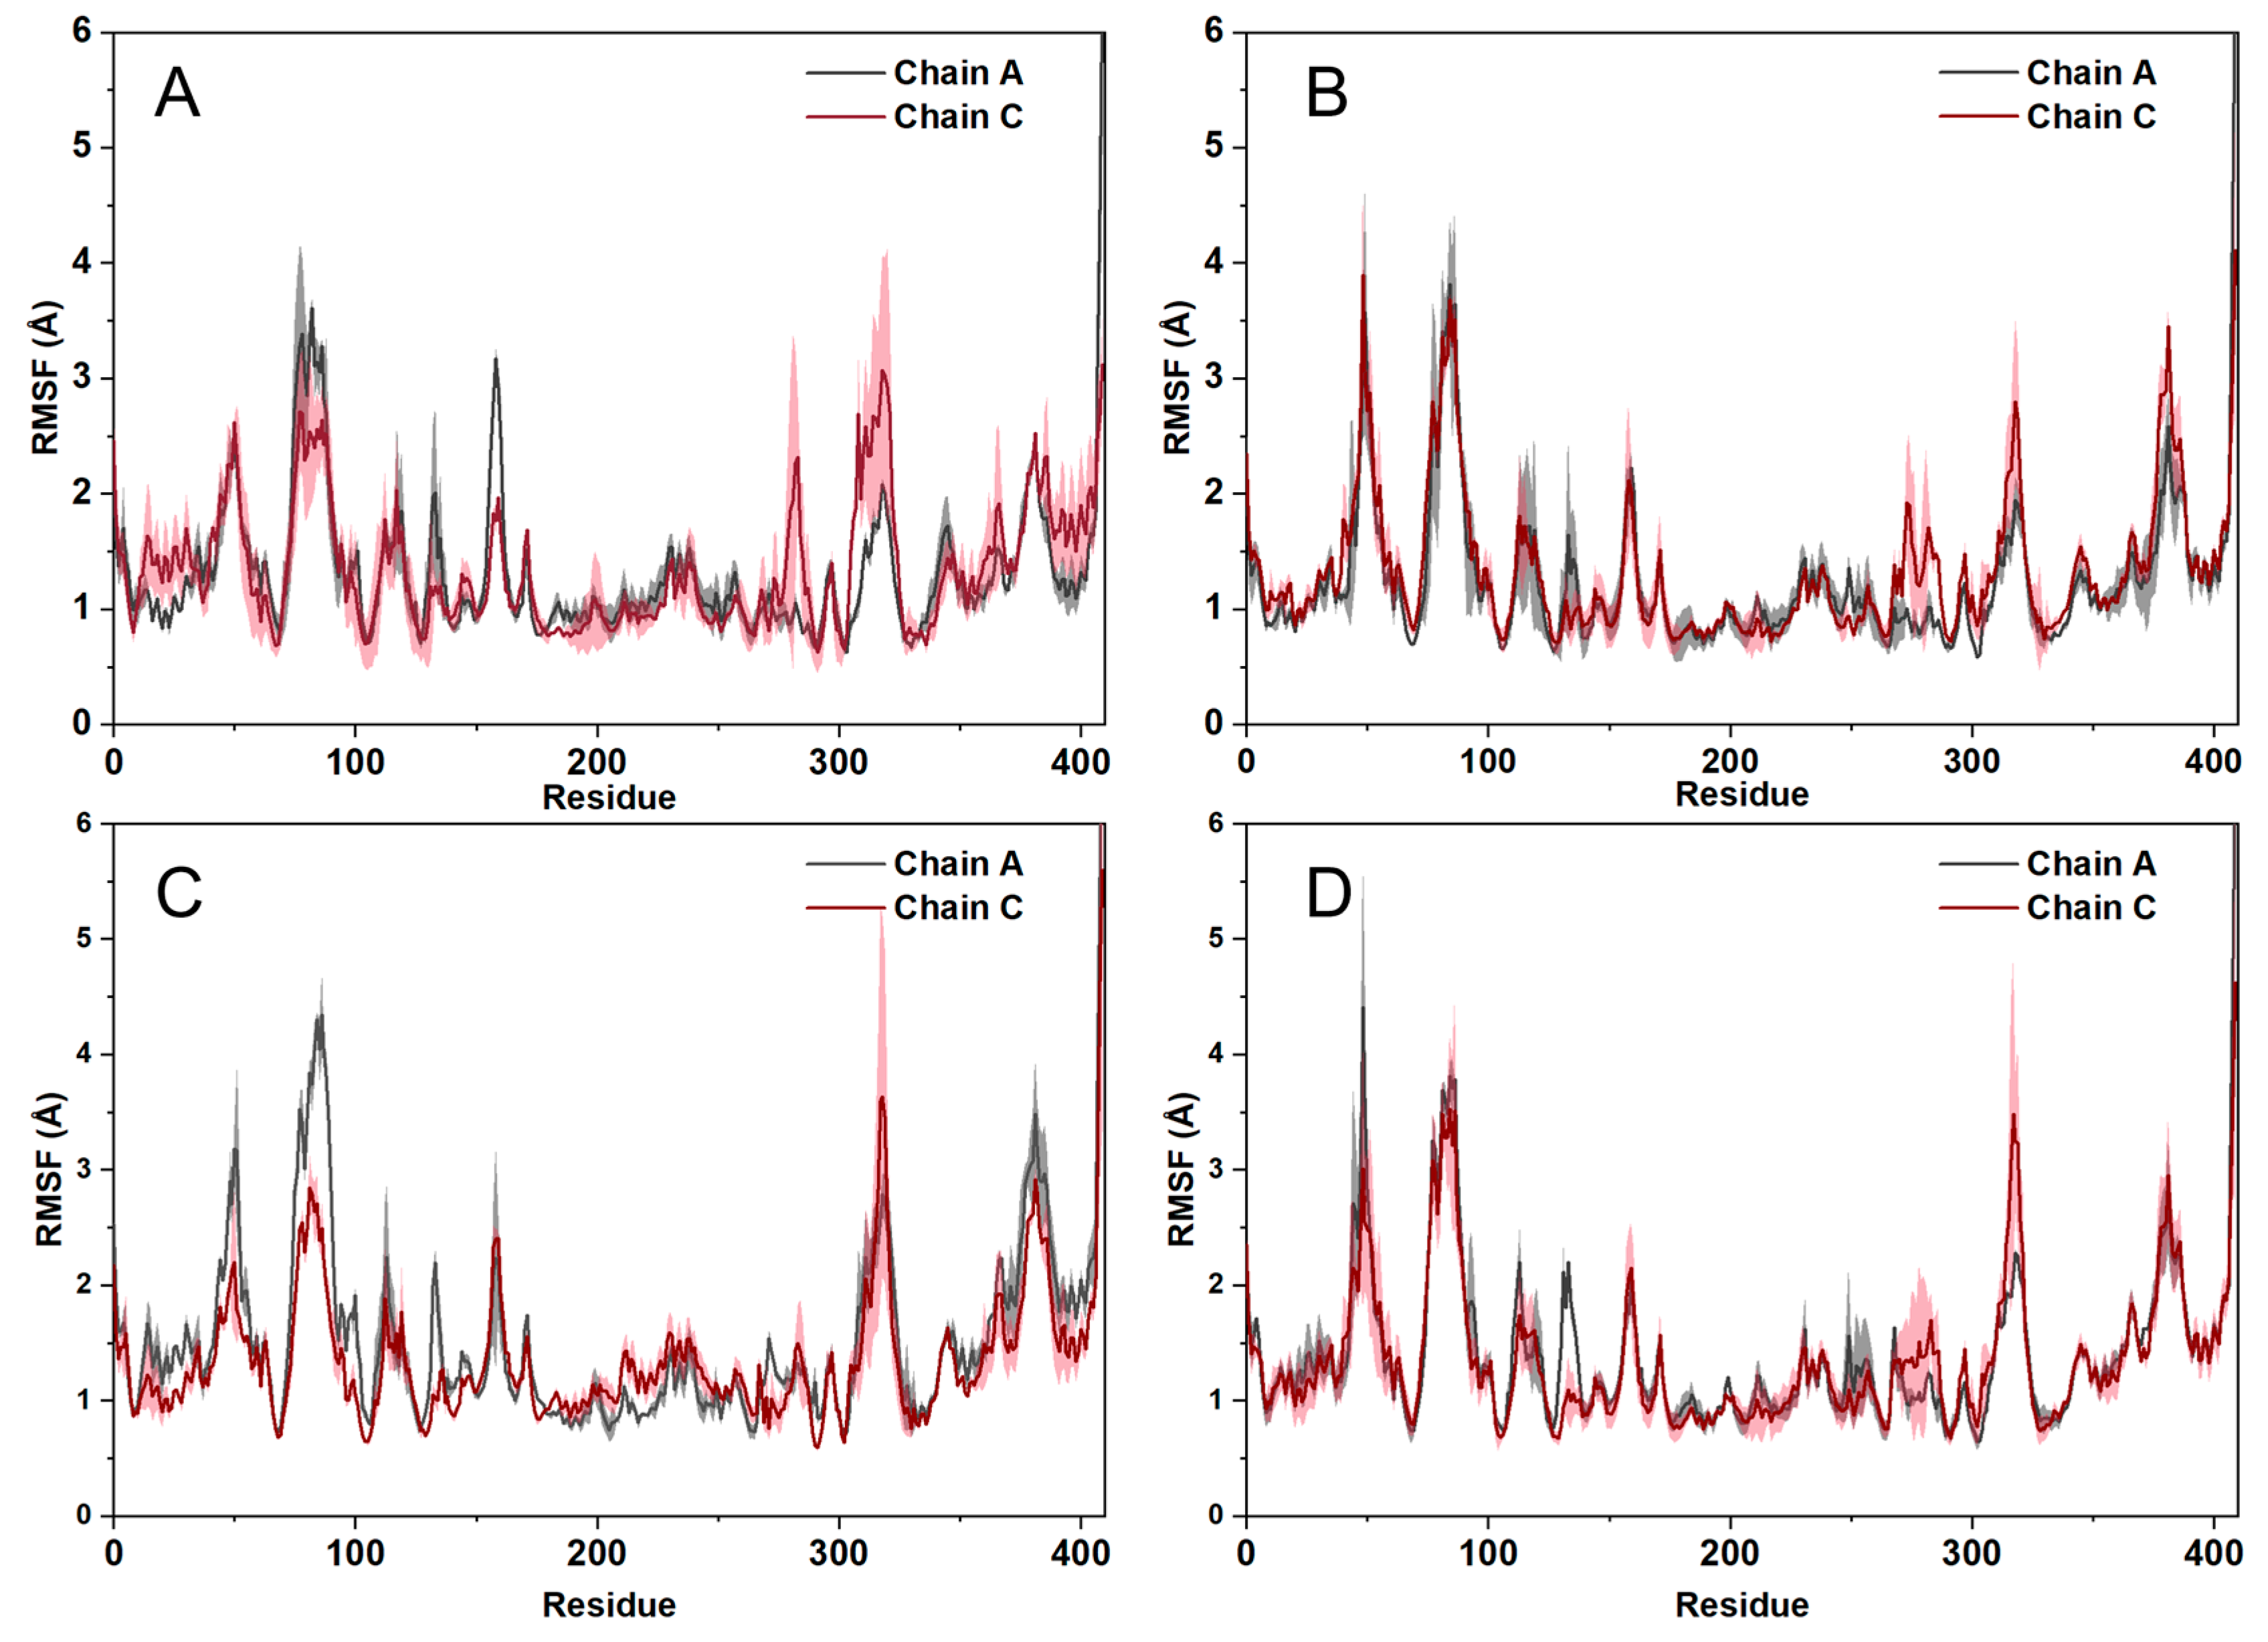
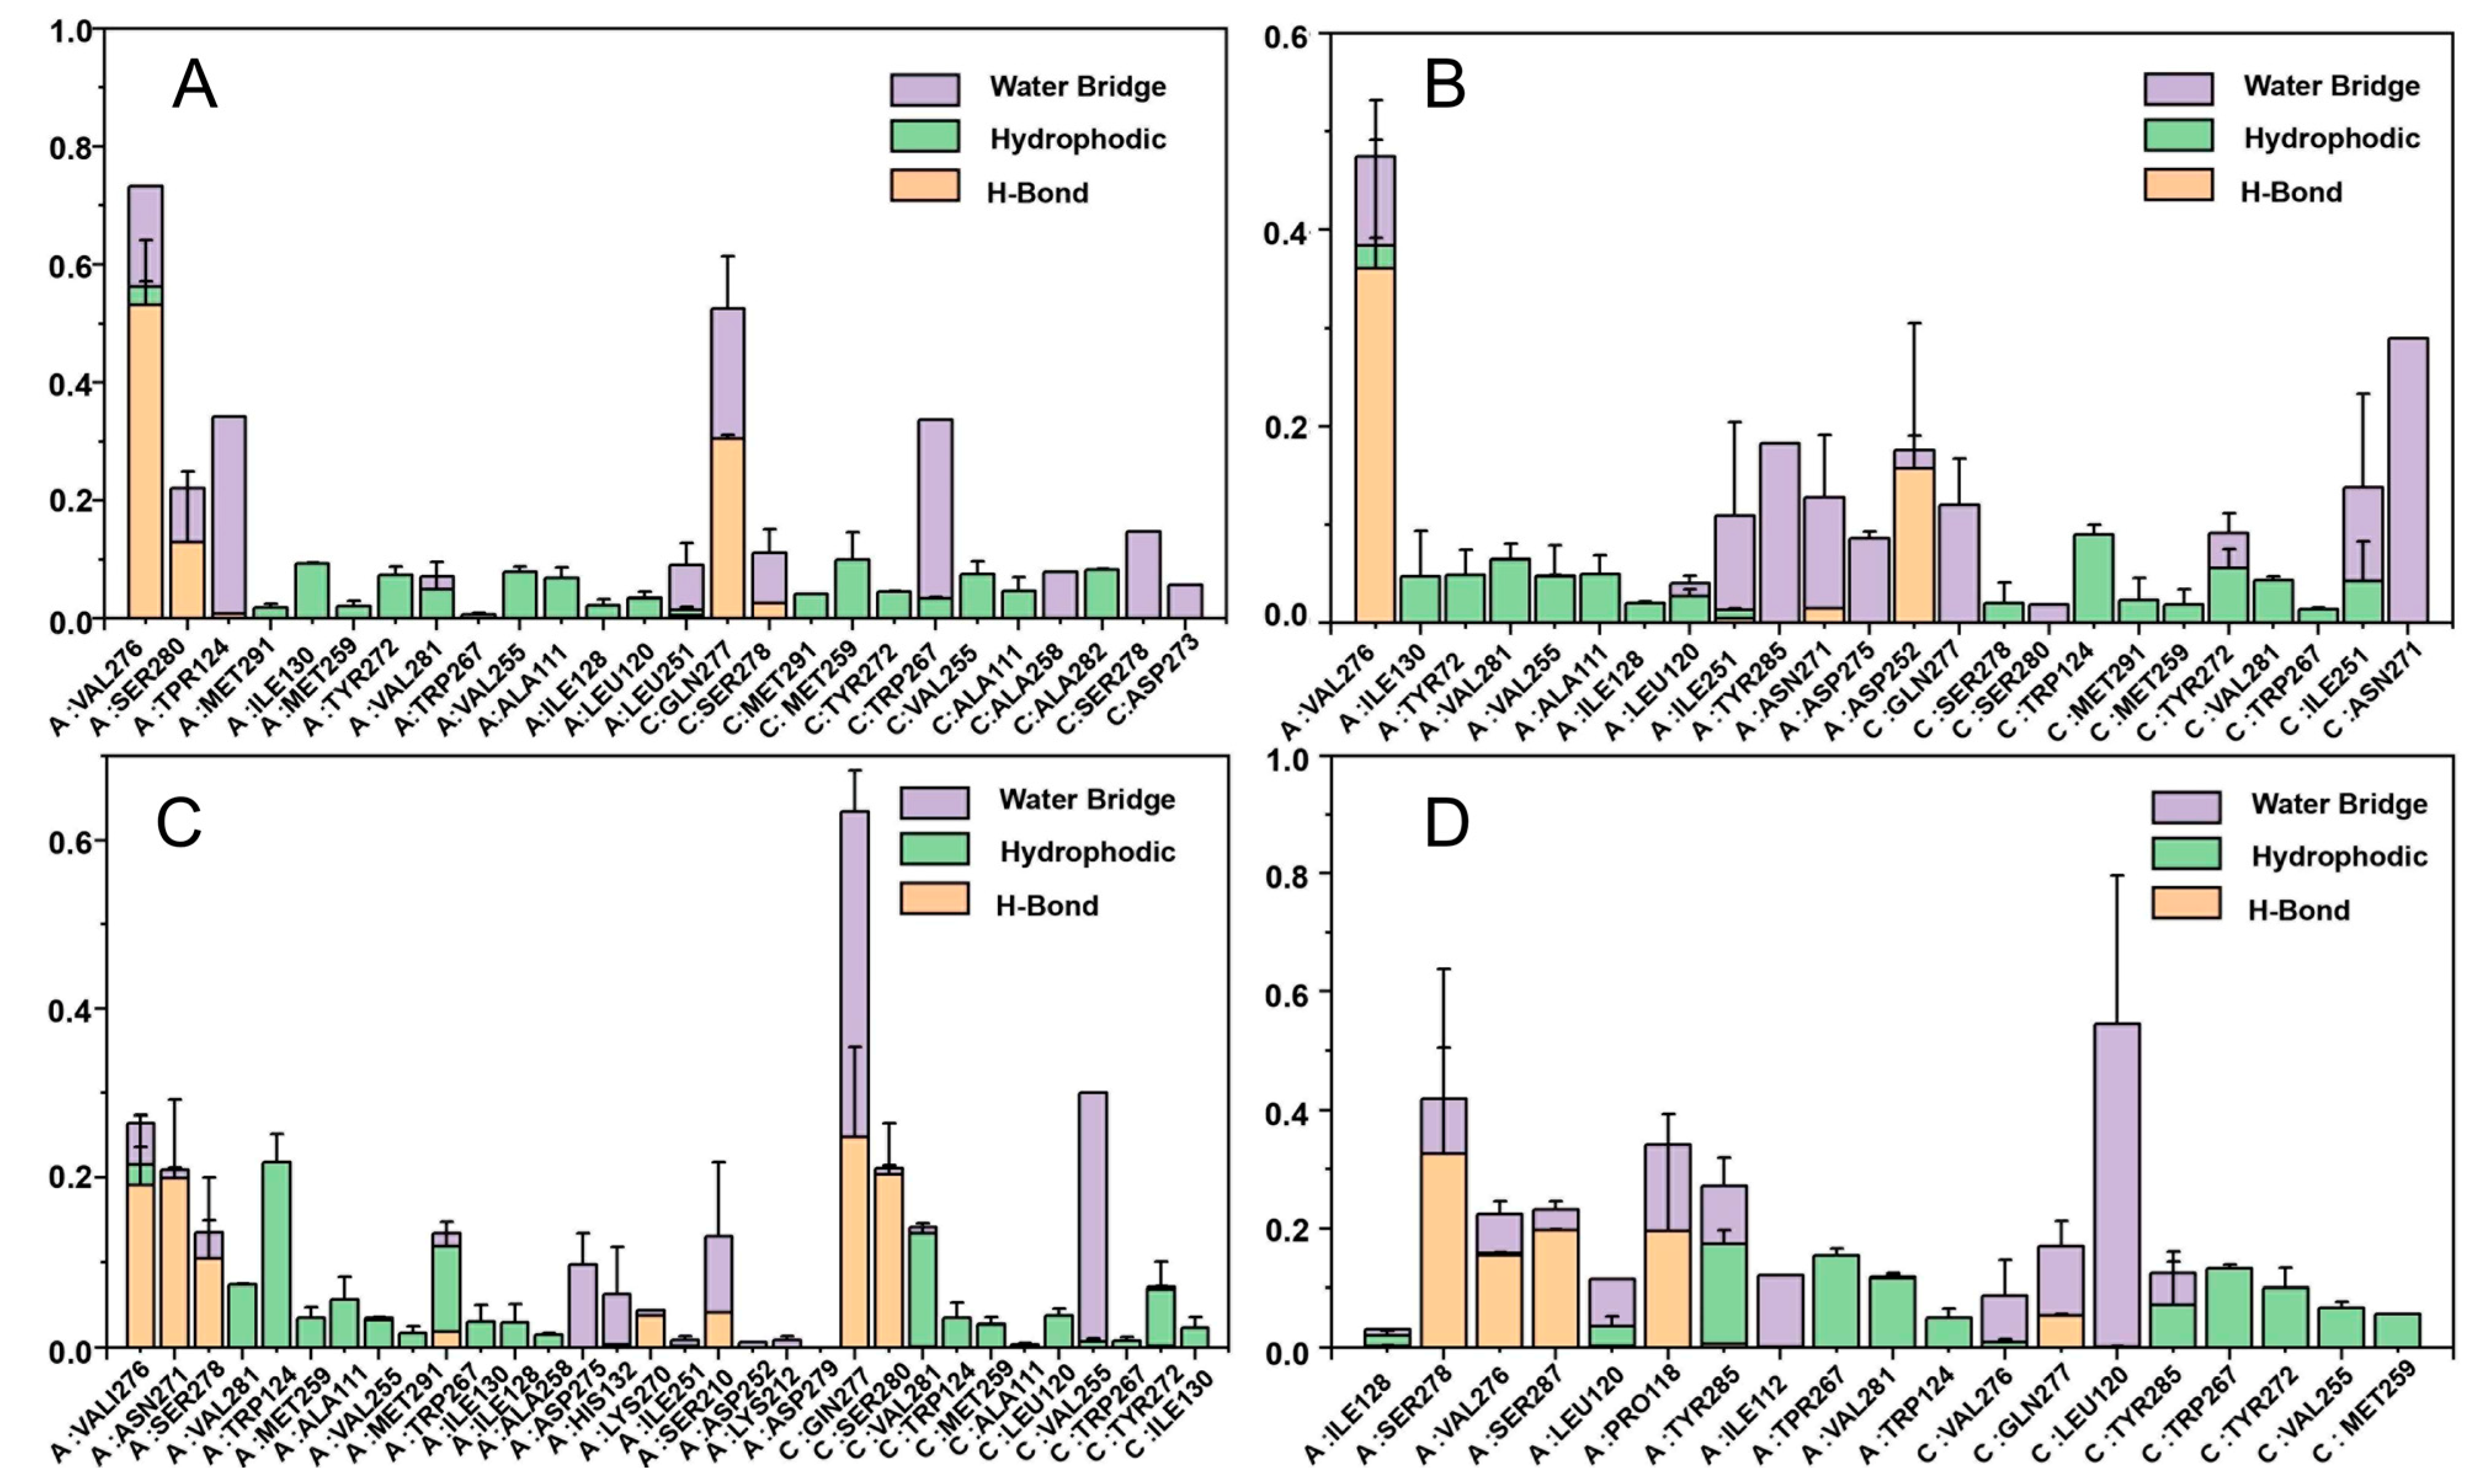
2.6. Molecular Dynamics Simulations
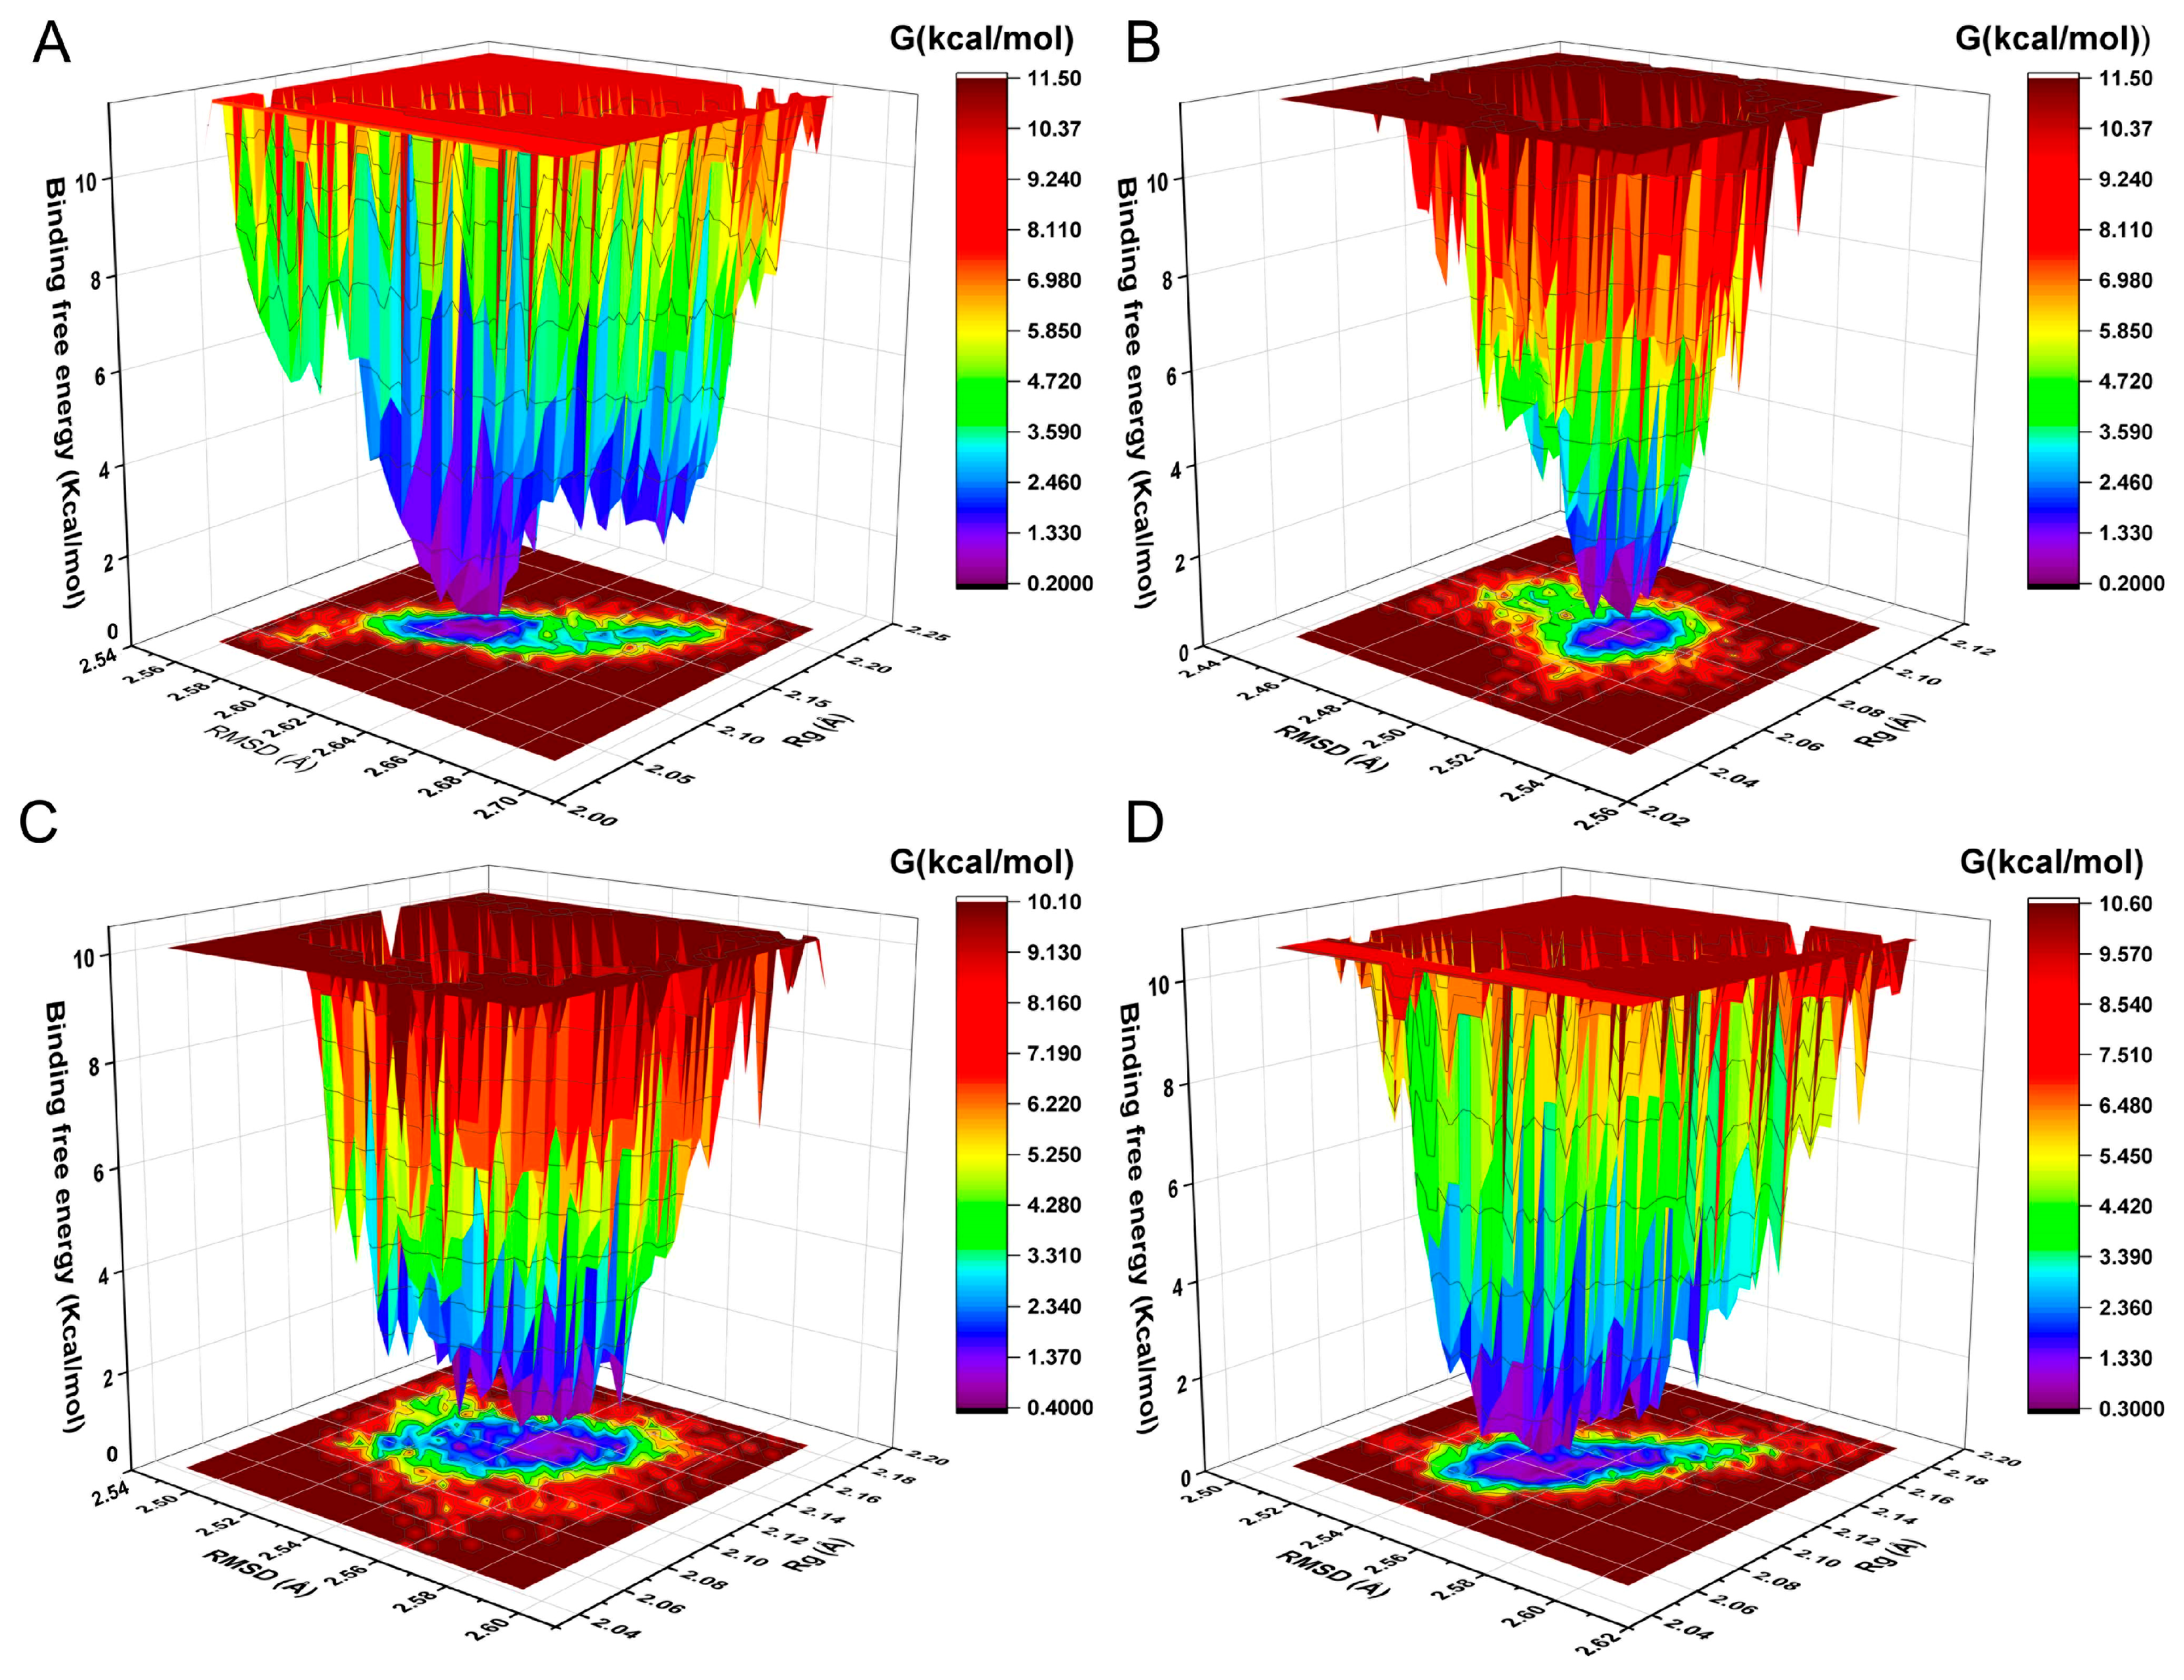
2.7. The Analysis of Free Energy Landscape, Radius of Gyration, Solvent Accessible Surface Area, and Polar Surface Area
2.8. Binding Free Energy Calculation
3. Discussion
4. Materials and Methods
4.1. Data Sets and Biological Activities
4.2. Molecular Construction and Structure Optimization
4.3. Molecular Alignment
4.4. Construction and Validation of 3D-QSAR Model
4.5. Scaffold Hopping and Virtual Screening
4.6. Prediction ADME
4.7. Molecular Dynamics Simulations
4.8. Trajectory Analysis
4.9. MM-GBSA
5. Conclusions
Author Contributions
Funding
Institutional Review Board Statement
Informed Consent Statement
Data Availability Statement
Conflicts of Interest
References
- Tian, W.; Zhang, W.; Wang, Y.; Jin, R.; Wang, Y.; Guo, H.; Tang, Y.; Yao, X. Recent advances of IDH1 mutant inhibitor in cancer therapy. Front. Pharmacol. 2022, 13, 982424. [Google Scholar] [CrossRef] [PubMed]
- Zhang, C.; Moore, L.M.; Li, X.; Yung, W.K.; Zhang, W. IDH1/2 mutations target a key hallmark of cancer by deregulating cellular metabolism in glioma. Neuro-Oncol. 2013, 15, 1114–1126. [Google Scholar] [CrossRef]
- Zhuang, X.; Pei, H.Z.; Li, T.; Huang, J.; Guo, Y.; Zhao, Y.; Yang, M.; Zhang, D.; Chang, Z.; Zhang, Q.; et al. The Molecular Mechanisms of Resistance to IDH Inhibitors in Acute Myeloid Leukemia. Front. Oncol. 2022, 12, 931462. [Google Scholar] [CrossRef] [PubMed]
- Dang, L.; White, D.W.; Gross, S.; Bennett, B.D.; Bittinger, M.A.; Driggers, E.M.; Fantin, V.R.; Jang, H.G.; Jin, S.; Keenan, M.C.; et al. Cancer-associated IDH1 mutations produce 2-hydroxyglutarate. Nature 2009, 462, 739–744. [Google Scholar] [CrossRef] [PubMed]
- Lee, K.; Song, Y.S.; Shin, Y.; Wen, X.; Kim, Y.; Cho, N.Y.; Bae, J.M.; Kang, G.H. Intrahepatic cholangiocarcinomas with IDH1/2 mutation-associated hypermethylation at selective genes and their clinicopathological features. Sci. Rep. 2020, 10, 15820. [Google Scholar] [CrossRef] [PubMed]
- Ni, Y.; Shen, P.; Wang, X.; Liu, H.; Luo, H.; Han, X. The roles of IDH1 in tumor metabolism and immunity. Future Oncol. 2022, 18, 3941–3953. [Google Scholar] [CrossRef] [PubMed]
- Megías-Vericat, J.E.; Ballesta-López, O.; Barragán, E.; Montesinos, P. IDH1-mutated relapsed or refractory AML: Current challenges and future prospects. Blood Lymphat. Cancer Targets Ther. 2019, 9, 19–32. [Google Scholar] [CrossRef] [PubMed]
- Mondesir, J.; Willekens, C.; Touat, M.; de Botton, S. IDH1 and IDH2 mutations as novel therapeutic targets: Current perspectives. J. Blood Med. 2016, 7, 171–180. [Google Scholar] [CrossRef]
- Mellinghoff, I.K.; Ellingson, B.M.; Touat, M.; Maher, E.; De La Fuente, M.I.; Holdhoff, M.; Cote, G.M.; Burris, H.; Janku, F.; Young, R.J.; et al. Ivosidenib in Isocitrate Dehydrogenase 1-Mutated Advanced Glioma. J. Clin. Oncol. Off. J. Am. Soc. Clin. Oncol. 2020, 38, 3398–3406. [Google Scholar] [CrossRef] [PubMed]
- Liu, Y.; Xu, W.; Li, M.; Yang, Y.; Sun, D.; Chen, L.; Li, H.; Chen, L. The regulatory mechanisms and inhibitors of isocitrate dehydrogenase 1 in cancer. Acta Pharm. Sin. B 2023, 13, 1438–1466. [Google Scholar] [CrossRef]
- Rohde, J.M.; Karavadhi, S.; Pragani, R.; Liu, L.; Fang, Y.; Zhang, W.; McIver, A.; Zheng, H.; Liu, Q.; Davis, M.I.; et al. Discovery and Optimization of 2H-1λ(2)-Pyridin-2-one Inhibitors of Mutant Isocitrate Dehydrogenase 1 for the Treatment of Cancer. J. Med. Chem. 2021, 64, 4913–4946. [Google Scholar] [CrossRef] [PubMed]
- Sabando, M.V.; Ponzoni, I.; Milios, E.E.; Soto, A.J. Using molecular embeddings in QSAR modeling: Does it make a difference? Brief. Bioinform. 2022, 23, bbab365. [Google Scholar] [CrossRef] [PubMed]
- Salum, L.B.; Andricopulo, A.D. Fragment-based QSAR: Perspectives in drug design. Mol. Divers. 2009, 13, 277–285. [Google Scholar] [CrossRef]
- Shakour, N.; Hadizadeh, F.; Kesharwani, P.; Sahebkar, A. 3D-QSAR Studies of 1,2,4-Oxadiazole Derivatives as Sortase A Inhibitors. BioMed Res. Int. 2021, 2021, 6380336. [Google Scholar] [CrossRef] [PubMed]
- Myint, K.Z.; Xie, X.Q. Recent advances in fragment-based QSAR and multi-dimensional QSAR methods. Int. J. Mol. Sci. 2010, 11, 3846–3866. [Google Scholar] [CrossRef] [PubMed]
- Zanni, R.; Gálvez-Llompart, M.; Gálvez, J.; García-Domenech, R. QSAR multi-target in drug discovery: A review. Curr. Comput.-Aided Drug Des. 2014, 10, 129–136. [Google Scholar] [CrossRef] [PubMed]
- Poustforoosh, A.; Faramarz, S.; Nematollahi, M.H.; Hashemipour, H.; Tüzün, B.; Pardakhty, A.; Mehrabani, M. 3D-QSAR, molecular docking, molecular dynamics, and ADME/T analysis of marketed and newly designed flavonoids as inhibitors of Bcl-2 family proteins for targeting U-87 glioblastoma. J. Cell. Biochem. 2022, 123, 390–405. [Google Scholar] [CrossRef] [PubMed]
- Sharma, R.; Dhingra, N.; Patil, S. CoMFA, CoMSIA, HQSAR and Molecular Docking Analysis of Ionone-based Chalcone Derivatives as Antiprostate Cancer Activity. Indian J. Pharm. Sci. 2016, 78, 54–64. [Google Scholar] [CrossRef]
- Zhao, X.; Chen, M.; Huang, B.; Ji, H.; Yuan, M. Comparative Molecular Field Analysis (CoMFA) and Comparative Molecular Similarity Indices Analysis (CoMSIA) studies on α(1A)-adrenergic receptor antagonists based on pharmacophore molecular alignment. Int. J. Mol. Sci. 2011, 12, 7022–7037. [Google Scholar] [CrossRef]
- Singh, M.; Singh, S.K.; Chhabria, M.T.; Vasu, K.; Pandya, D. CoMFA and CoMSIA 3D QSAR models for a series of some condensed thieno[2,3-d]pyrimidin-4(3H)-ones with antihistaminic (H1) activity. Med. Chem. 2013, 9, 389–401. [Google Scholar] [CrossRef]
- Zhu, T.; Chen, W.; Cheng, H.; Wang, Y.; Singh, R.P. Prediction of polydimethylsiloxane-water partition coefficients based on the pp-LFER and QSAR models. Ecotoxicol. Environ. Saf. 2019, 182, 109374. [Google Scholar] [CrossRef]
- Singh, H.; Raja, A.; Prakash, A.; Medhi, B. Gmx_qk: An Automated Protein/Protein-Ligand Complex Simulation Workflow Bridged to MM/PBSA, Based on Gromacs and Zenity-Dependent GUI for Beginners in MD Simulation Study. J. Chem. Inf. Model. 2023, 63, 2603–2608. [Google Scholar] [CrossRef] [PubMed]
- da Fonseca, A.M.; Caluaco, B.J.; Madureira, J.M.C.; Cabongo, S.Q.; Gaieta, E.M.; Djata, F.; Colares, R.P.; Neto, M.M.; Fernandes, C.F.C.; Marinho, G.S.; et al. Screening of Potential Inhibitors Targeting the Main Protease Structure of SARS-CoV-2 via Molecular Docking, and Approach with Molecular Dynamics, RMSD, RMSF, H-Bond, SASA and MMGBSA. Mol. Biotechnol. 2023. [Google Scholar] [CrossRef] [PubMed]
- Ghahremanian, S.; Rashidi, M.M.; Raeisi, K.; Toghraie, D. Molecular dynamics simulation approach for discovering potential inhibitors against SARS-CoV-2: A structural review. J. Mol. Liq. 2022, 354, 118901. [Google Scholar] [CrossRef] [PubMed]
- Çınaroğlu, S.S.; Timuçin, E. Comprehensive evaluation of the MM-GBSA method on bromodomain-inhibitor sets. Brief. Bioinform. 2020, 21, 2112–2125. [Google Scholar] [CrossRef]
- Taylor, M.; Ho, J. MM/GBSA prediction of relative binding affinities of carbonic anhydrase inhibitors: Effect of atomic charges and comparison with Autodock4(Zn). J. Comput.-Aided Mol. Des. 2023, 37, 167–182. [Google Scholar] [CrossRef]
- Garro Martinez, J.C.; Vega-Hissi, E.G.; Andrada, M.F.; Estrada, M.R. QSAR and 3D-QSAR studies applied to compounds with anticonvulsant activity. Expert Opin. Drug Discov. 2015, 10, 37–51. [Google Scholar] [CrossRef]
- Wang, Y.; Guo, Y.; Qiang, S.; Jin, R.; Li, Z.; Tang, Y.; Leung, E.L.H.; Guo, H.; Yao, X. 3D-QSAR, Molecular Docking, and MD Simulations of Anthraquinone Derivatives as PGAM1 Inhibitors. Front. Pharmacol. 2021, 12, 764351. [Google Scholar] [CrossRef]
- Lazzara, P.R.; Moore, T.W. Scaffold-hopping as a strategy to address metabolic liabilities of aromatic compounds. RSC Med. Chem. 2020, 11, 18–29. [Google Scholar] [CrossRef]
- Ishida, H.; Kono, H. Free Energy Landscape of H2A-H2B Displacement from Nucleosome. J. Mol. Biol. 2022, 434, 167707. [Google Scholar] [CrossRef]
- Al-Khafaji, K.; Taskin Tok, T. Molecular dynamics simulation, free energy landscape and binding free energy computations in exploration the anti-invasive activity of amygdalin against metastasis. Comput. Methods Programs Biomed. 2020, 195, 105660. [Google Scholar] [CrossRef]
- Liu, Y.; Wang, L.; Zhao, L.; Zhang, Y.; Li, Z.T.; Huang, F. Multiple hydrogen bonding driven supramolecular architectures and their biomedical applications. Chem. Soc. Rev. 2024, 53, 1592–1623. [Google Scholar] [CrossRef]
- Nguyen, A.; Huang, Y.C.; Tremouilhac, P.; Jung, N.; Bräse, S. CHEMSCANNER: Extraction and re-use(ability) of chemical information from common scientific documents containing ChemDraw files. J. Cheminform. 2019, 11, 77. [Google Scholar] [CrossRef] [PubMed]
- Feng, Z.; Alqarni, M.H.; Yang, P.; Tong, Q.; Chowdhury, A.; Wang, L.; Xie, X.Q. Modeling, molecular dynamics simulation, and mutation validation for structure of cannabinoid receptor 2 based on known crystal structures of GPCRs. J. Chem. Inf. Model. 2014, 54, 2483–2499. [Google Scholar] [CrossRef] [PubMed]
- Kumar, V.; Liu, H.; Wu, C. Drug repurposing against SARS-CoV-2 receptor binding domain using ensemble-based virtual screening and molecular dynamics simulations. Comput. Biol. Med. 2021, 135, 104634. [Google Scholar] [CrossRef]
- Cramer, R.D.; Patterson, D.E.; Bunce, J.D. Comparative molecular field analysis (CoMFA). 1. Effect of shape on binding of steroids to carrier proteins. J. Am. Chem. Soc. 1988, 110, 5959–5967. [Google Scholar] [CrossRef] [PubMed]
- Chhatbar, D.M.; Chaube, U.J.; Vyas, V.K.; Bhatt, H.G. CoMFA, CoMSIA, Topomer CoMFA, HQSAR, molecular docking and molecular dynamics simulations study of triazine morpholino derivatives as mTOR inhibitors for the treatment of breast cancer. Comput. Biol. Chem. 2019, 80, 351–363. [Google Scholar] [CrossRef] [PubMed]
- Dowlati Beirami, A.; Hajimahdi, Z.; Zarghi, A. Docking-based 3D-QSAR (CoMFA, CoMFA-RG, CoMSIA) study on hydroquinoline and thiazinan-4-one derivatives as selective COX-2 inhibitors. J. Biomol. Struct. Dyn. 2019, 37, 2999–3006. [Google Scholar] [CrossRef]
- Hu, R.; Barbault, F.; Delamar, M.; Zhang, R. Receptor- and ligand-based 3D-QSAR study for a series of non-nucleoside HIV-1 reverse transcriptase inhibitors. Bioorg. Med. Chem. 2009, 17, 2400–2409. [Google Scholar] [CrossRef]
- Fatemi, M.H.; Shakoori, Z.; Samghani, K. Comparative molecular field analysis of chromatographic hydrophobicity indices for some coumarin analogs. Biomed. Chromatogr. BMC 2017, 31, e3876. [Google Scholar] [CrossRef] [PubMed]
- Krishnan, A.; Williams, L.J.; McIntosh, A.R.; Abdi, H. Partial Least Squares (PLS) methods for neuroimaging: A tutorial and review. NeuroImage 2011, 56, 455–475. [Google Scholar] [CrossRef] [PubMed]
- Qian, H.; Chen, J.; Pan, Y.; Chen, J. Molecular Modeling Studies of 11β-Hydroxysteroid Dehydrogenase Type 1 Inhibitors through Receptor-Based 3D-QSAR and Molecular Dynamics Simulations. Molecules 2016, 21, 1222. [Google Scholar] [CrossRef]
- Zheng, X.; Zhou, S.; Zhang, C.; Wu, D.; Luo, H.B.; Wu, Y. Docking-assisted 3D-QSAR studies on xanthones as α-glucosidase inhibitors. J. Mol. Model. 2017, 23, 272. [Google Scholar] [CrossRef]
- Wang, S.B.; Liu, H.; Li, G.Y.; Li, J.; Li, X.J.; Lei, K.; Wei, L.C.; Quan, Z.S.; Wang, X.K.; Liu, R.M. Coumarin and 3,4-dihydroquinolinone derivatives: Synthesis, antidepressant activity, and molecular docking studies. Pharmacol. Rep. 2019, 71, 1244–1252. [Google Scholar] [CrossRef]
- Ertl, P.; Schuffenhauer, A. Estimation of synthetic accessibility score of drug-like molecules based on molecular complexity and fragment contributions. J Cheminform 2009, 1, 8. [Google Scholar] [CrossRef]
- Friesner, R.A.; Murphy, R.B.; Repasky, M.P.; Frye, L.L.; Greenwood, J.R.; Halgren, T.A.; Sanschagrin, P.C.; Mainz, D.T. Extra precision glide: Docking and scoring incorporating a model of hydrophobic enclosure for protein-ligand complexes. J. Med. Chem. 2006, 49, 6177–6196. [Google Scholar] [CrossRef] [PubMed]
- Durán-Iturbide, N.A.; Díaz-Eufracio, B.I.; Medina-Franco, J.L. In Silico ADME/Tox Profiling of Natural Products: A Focus on BIOFACQUIM. ACS Omega 2020, 5, 16076–16084. [Google Scholar] [CrossRef]
- van den Anker, J.; Reed, M.D.; Allegaert, K.; Kearns, G.L. Developmental Changes in Pharmacokinetics and Pharmacodynamics. J. Clin. Pharmacol. 2018, 58 (Suppl. S10), S10–S25. [Google Scholar] [CrossRef] [PubMed]
- Benny, S.; Rajappan Krishnendu, P.; Kumar, S.; Bhaskar, V.; Manisha, D.S.; Abdelgawad, M.A.; Ghoneim, M.M.; Naguib, I.A.; Pappachen, L.K.; Mary Zachariah, S.; et al. A computational investigation of thymidylate synthase inhibitors through a combined approach of 3D-QSAR and pharmacophore modelling. J. Biomol. Struct. Dyn. 2023, 1–20. [Google Scholar] [CrossRef]
- Kumar, H.B.; Manandhar, S.; Rathi, E.; Kabekkodu, S.P.; Mehta, C.H.; Nayak, U.Y.; Kini, S.G.; Pai, K.S.R. Identification of potential Akt activators: A ligand and structure-based computational approach. Mol. Divers. 2023. [Google Scholar] [CrossRef]
- Jawarkar, R.D.; Bakal, R.L.; Zaki, M.E.A.; Al-Hussain, S.; Ghosh, A.; Gandhi, A.; Mukerjee, N.; Samad, A.; Masand, V.H.; Lewaa, I. QSAR based virtual screening derived identification of a novel hit as a SARS CoV-229E 3CL(pro) Inhibitor: GA-MLR QSAR modeling supported by molecular Docking, molecular dynamics simulation and MMGBSA calculation approaches. Arab. J. Chem. 2022, 15, 103499. [Google Scholar] [CrossRef] [PubMed]
- Genheden, S.; Ryde, U. The MM/PBSA and MM/GBSA methods to estimate ligand-binding affinities. Expert Opin. Drug Discov. 2015, 10, 449–461. [Google Scholar] [CrossRef]
- Sahakyan, H. Improving virtual screening results with MM/GBSA and MM/PBSA rescoring. J. Comput.-Aided Mol. Des. 2021, 35, 731–736. [Google Scholar] [CrossRef] [PubMed]
- Lambo, D.J.; Lebedenko, C.G.; McCallum, P.A.; Banerjee, I.A. Molecular dynamics, MMGBSA, and docking studies of natural products conjugated to tumor-targeted peptide for targeting BRAF V600E and MERTK receptors. Mol. Divers. 2023, 27, 389–423. [Google Scholar] [CrossRef] [PubMed]
- Jupudi, S.; Rajagopal, K.; Murugesan, S.; Kumar, B.K.; Raman, K.; Byran, G.; Chennaiah, J.; Muthiah, V.P.; Dasan, P.B.; Sankaran, S. Identification of Papain-Like Protease inhibitors of SARS CoV-2 through HTVS, Molecular docking, MMGBSA and Molecular dynamics approach. S. Afr. J. Bot. Off. J. S. Afr. Assoc. Bot. = Suid-Afr. Tydskr. Plantkd. Amptelike Tydskr. Suid-Afr. Genootskap Plantkd. 2022, 151, 82–91. [Google Scholar] [CrossRef] [PubMed]


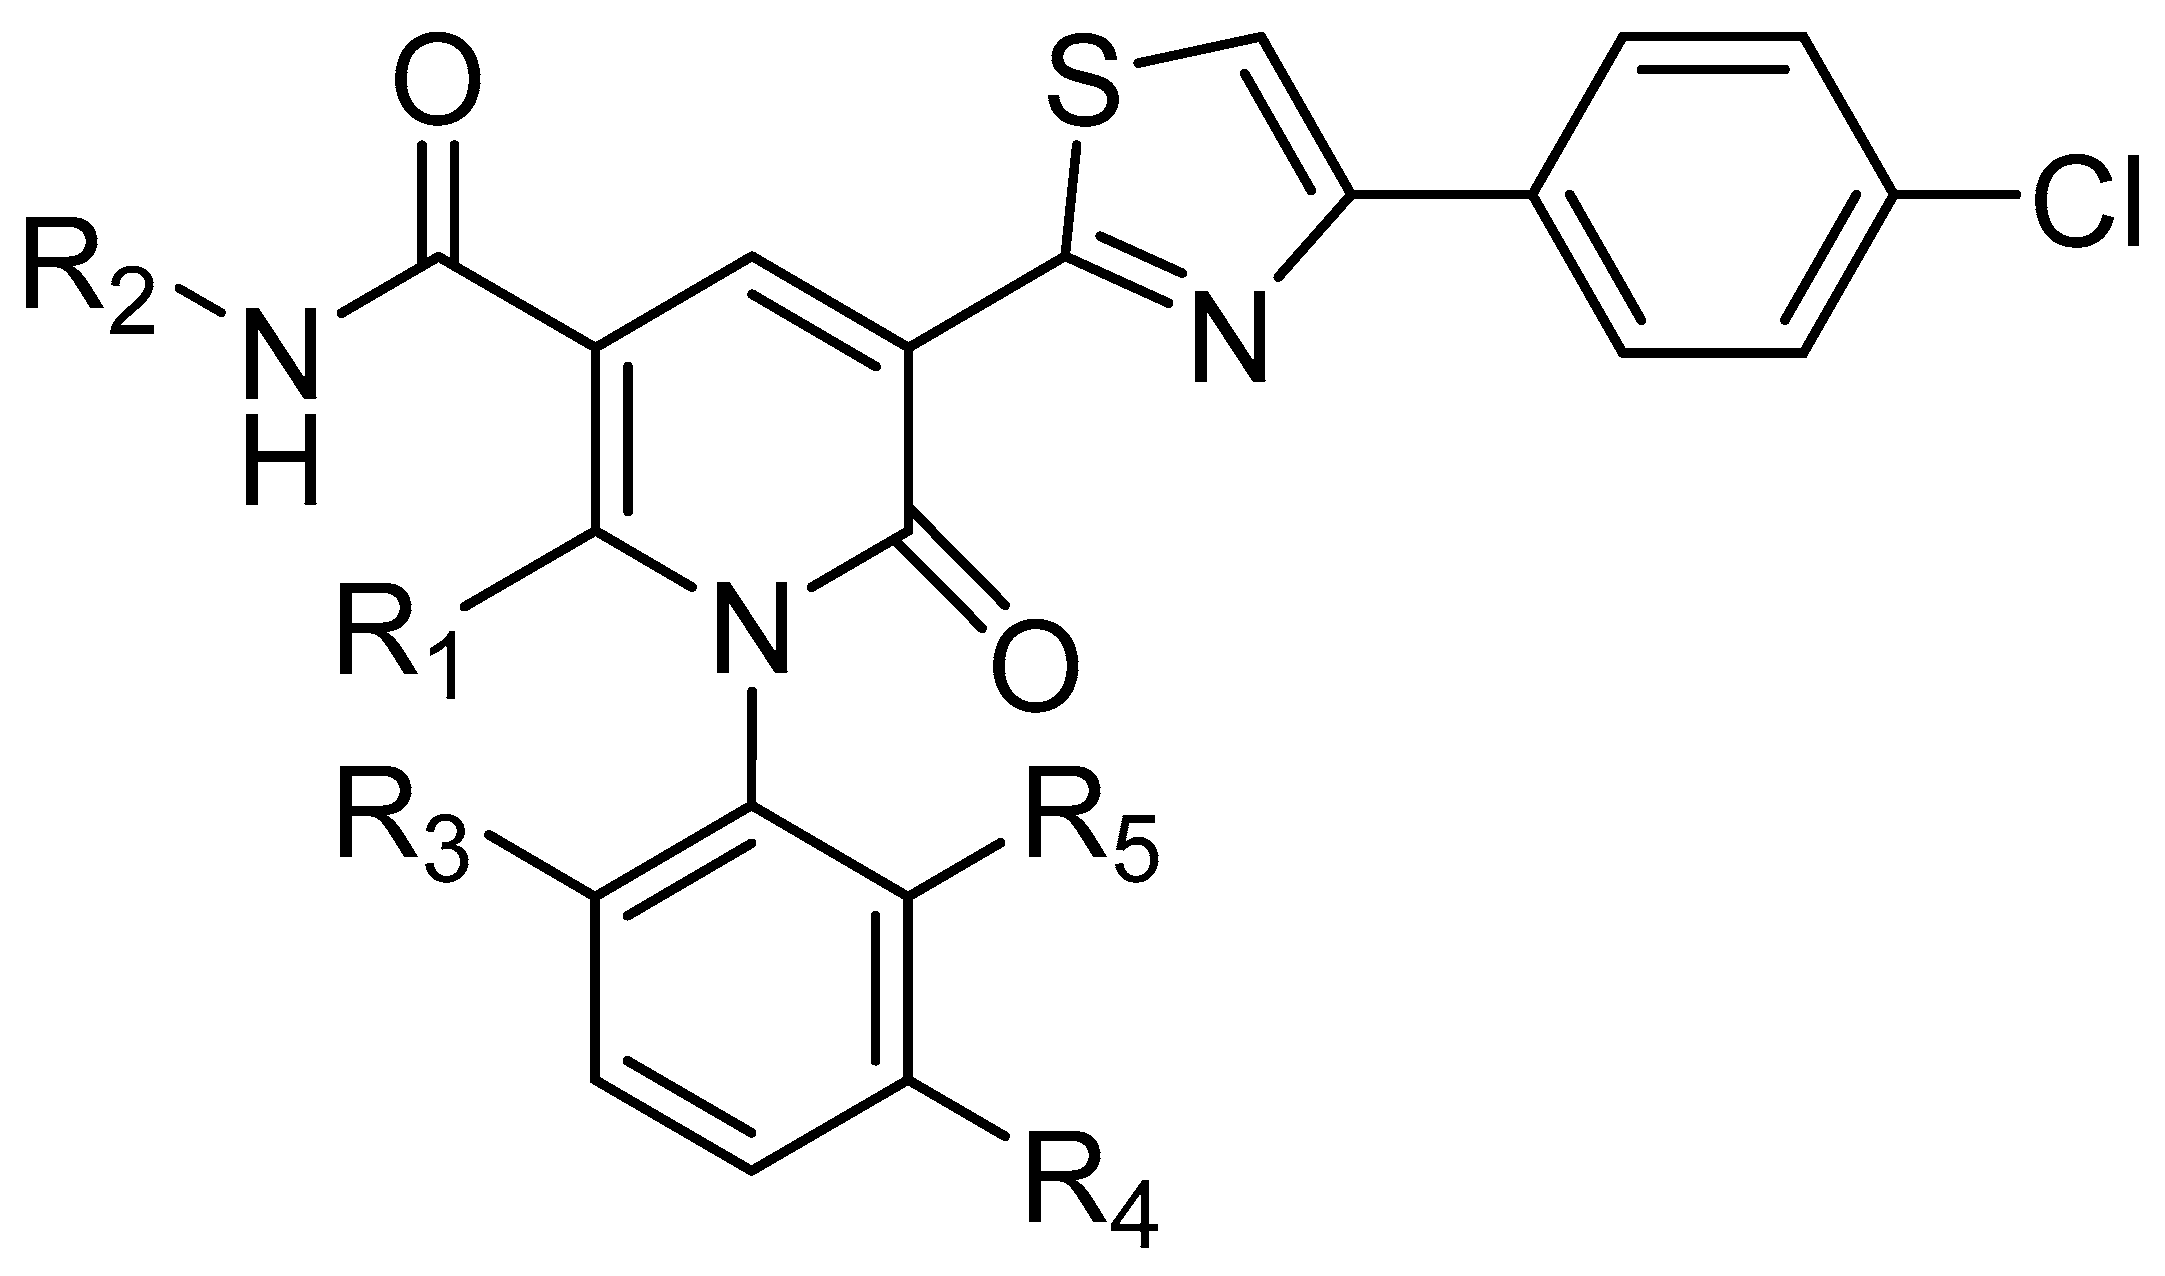
| No. | R1 | R2 | R3 | R4 | R5 | IC50(μM) | pIC50 |
|---|---|---|---|---|---|---|---|
| 1 | Me | CH3 | Et | H | Et | 1.500 | 5.824 |
| 2 a | Me | (CH3)2 | Et | H | Et | 1.200 | 5.920 |
| 3 | Me | iPr | Et | H | Et | 2.800 | 5.553 |
| 4 a | Me | CH2CH2OH | Et | H | Et | 0.420 | 6.380 |
| 5 | Me | CH2CH2OMe | Et | H | Et | 2.100 | 5.678 |
| 6 | Me | CH2CO2H | Et | H | Et | 1.200 | 5.921 |
| 7 | Me | CH2CH2NH2 | Et | H | Et | 0.380 | 6.420 |
| 8 | Me | CH2CH2NHMe | Et | H | Et | 0.870 | 6.060 |
| 9 | Me | CH2CONH2 | Et | H | Et | 1.600 | 5.796 |
| 10 | Me | CH2CH2CH2NHMe | Et | H | Et | 1.000 | 6.000 |
| 11 | Me |  | Et | H | Et | 4.200 | 5.377 |
| 12 a | Me |  | Et | H | Et | 0.210 | 6.680 |
| 13 a | Me |  | Et | H | Et | 2.900 | 5.540 |
| 14 | nPr |  | Et | H | Et | 0.075 | 7.125 |
| 15 | iPr |  | Et | H | Et | 0.420 | 6.377 |
| 16 | iBu |  | Et | H | Et | 0.110 | 6.959 |
| 17 a |  |  | Et | H | Et | 0.044 | 7.360 |
| 18 |  |  | Et | H | Et | 0.055 | 7.260 |
| 19 |  |  | Et | H | Et | 0.140 | 6.854 |
| 20 |  |  | Et | H | Et | 0.240 | 6.620 |
| 21 |  |  | Et | H | Et | 0.075 | 7.125 |
| 22 |  |  | Et | H | Et | 1.100 | 5.959 |
| 23 |  |  | Et | H | Et | 0.044 | 7.357 |
| 24 |  |  | Et | H | Et | 0.039 | 7.409 |
| 25 |  |  | Et | H | Et | 0.100 | 7.000 |
| 26 |  | 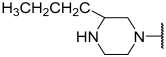 | Et | H | Et | 0.130 | 6.886 |
| 27 |  |  | Et | H | Et | 0.078 | 7.108 |
| 28 |  |  | Et | H | Et | 0.049 | 7.310 |
| 29 |  | 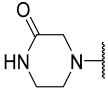 | Et | H | Et | 0.035 | 7.456 |
| 30 |  | 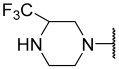 | Et | H | Et | 0.360 | 6.444 |
| 31 |  |  | Et | H | Et | 0.160 | 6.796 |
| 32 |  |  | Et | H | Et | 0.055 | 7.260 |
| 33 |  |  | Et | H | Et | 0.094 | 7.027 |
| 34 |  | 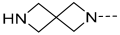 | Et | H | Et | 0.240 | 6.620 |
| 35 a |  |  | Et | H | Et | 0.094 | 7.030 |
| 36 a |  |  | Et | H | Et | 0.062 | 7.210 |
| 37 a |  |  | H | H | H | 0.330 | 6.480 |
| 38 |  |  | Et | H | H | 0.056 | 7.252 |
| 39 |  |  | Et | H | Me | 0.270 | 6.569 |
| 40 |  |  | Et | H | Cl | 0.044 | 7.357 |
| 41 |  |  | Et | Me | H | 0.044 | 7.357 |
| 42 a |  |  | Et | OMe | H | 0.114 | 6.940 |
| 42(+) |  |  | Et | OMe | H | 0.120 | 6.921 |
| 42(-) |  |  | Et | OMe | H | 0.420 | 6.377 |
| 43 |  |  | Et | Cl | H | 0.114 | 6.943 |
| 43(+) |  |  | Et | Cl | H | 0.081 | 7.092 |
| 43(-) |  |  | Et | Cl | H | 0.250 | 6.602 |
| 3D-OSAR Models | R2 | Q2 | F | SEE | N | Fraction | ||||
|---|---|---|---|---|---|---|---|---|---|---|
| Steric | Electrostatic | Hydrophobic | Donor | Acceptor | ||||||
| CoMSIA/SE | 0.968 | 0.691 | 158.496 | 0.115 | 6 | 0.372 | 0.628 | |||
| CoMSIA/SH | 0.926 | 0.794 | 102.908 | 0.171 | 4 | 0.406 | 0.594 | |||
| COMSIA/SA | 0.945 | 0.598 | 88.140 | 0.152 | 6 | 0.546 | 0.454 | |||
| CoMSIA/EH | 0.973 | 0.673 | 185.305 | 0.106 | 6 | 0.566 | 0.434 | |||
| CoMSIA/EHA | 0.986 | 0.626 | 296.797 | 0.078 | 7 | 0.404 | 0.308 | 0.287 | ||
| CoMSIA/SEA | 0.981 | 0.652 | 261.932 | 0.090 | 6 | 0.256 | 0.452 | 0.292 | ||
| CoMSIA/SEH | 0.997 | 0.770 | 800.063 | 0.040 | 10 | 0.225 | 0.444 | 0.331 | ||
| CoMSIA/SHDA | 0.954 | 0.596 | 172.339 | 0.134 | 4 | 0.103 | 0.142 | 0.500 | 0.255 | |
| CoMSIA/SEHD | 0.998 | 0.669 | 1286.243 | 0.033 | 9 | 0.116 | 0.249 | 0.149 | 0.485 | |
| CoMSIA/SEHA | 0.983 | 0.710 | 307.710 | 0.083 | 6 | 0.175 | 0.326 | 0.249 | 0.250 | |
| CoMSIA/SEHDA | 0.991 | 0.638 | 494.747 | 0.061 | 7 | 0.084 | 0.186 | 0.118 | 0.417 | 0.195 |
| PLS Statistics | CoMFA | CoMSIA |
|---|---|---|
| Q2 | 0.765 | 0.77 |
| N | 6 | 10 |
| R2 | 0.980 | 0.997 |
| R2pred | 0.943 | 0.980 |
| F | 253.629 | 800.063 |
| SEE | 0.091 | 0.04 |
| Steric | 0.582 | 0.225 |
| Electrostatic | 0.418 | 0.444 |
| Hydrophobic | - | 0.331 |
| No. | pIC50 | CoMFA | CoMSIA | ||
|---|---|---|---|---|---|
| Exp. | Pred. | Res. | Pred. | Res. | |
| 1 | 5.824 | 5.821 | 0.003 | 5.785 | 0.039 |
| 2 a | 5.920 | 6.056 | −0.136 | 6.025 | −0.105 |
| 3 | 5.553 | 5.631 | −0.078 | 5.549 | 0.004 |
| 4 a | 6.380 | 6.394 | −0.014 | 6.358 | 0.022 |
| 5 | 5.678 | 5.603 | 0.075 | 5.682 | −0.004 |
| 6 | 5.921 | 5.907 | 0.014 | 5.935 | −0.014 |
| 7 | 6.420 | 6.369 | 0.051 | 6.412 | 0.008 |
| 8 | 6.060 | 6.007 | 0.053 | 6.118 | −0.058 |
| 9 | 5.796 | 5.780 | 0.016 | 5.779 | 0.017 |
| 10 | 6.000 | 5.999 | 0.001 | 5.977 | 0.023 |
| 11 | 5.377 | 5.566 | −0.189 | 5.423 | −0.046 |
| 12 a | 6.680 | 6.677 | 0.003 | 6.608 | 0.072 |
| 13 a | 5.540 | 5.525 | 0.015 | 5.536 | 0.004 |
| 14 | 7.125 | 7.152 | −0.027 | 7.149 | −0.024 |
| 15 | 6.377 | 6.181 | 0.196 | 6.337 | 0.04 |
| 16 | 6.959 | 7.037 | −0.078 | 6.947 | 0.012 |
| 17 a | 7.360 | 6.567 | 0.793 | 7.055 | 0.305 |
| 18 | 7.260 | 7.145 | 0.115 | 7.222 | 0.038 |
| 19 | 6.854 | 6.883 | −0.029 | 6.909 | −0.055 |
| 20 | 6.620 | 6.603 | 0.017 | 6.578 | 0.042 |
| 21 | 7.125 | 7.156 | −0.031 | 7.113 | 0.012 |
| 22 | 5.959 | 6.001 | −0.042 | 5.982 | −0.023 |
| 23 | 7.357 | 7.322 | 0.035 | 7.34 | 0.017 |
| 24 | 7.409 | 7.535 | −0.126 | 7.415 | −0.006 |
| 25 | 7.000 | 7.017 | −0.017 | 7.011 | −0.011 |
| 26 | 6.886 | 6.906 | −0.02 | 6.911 | −0.025 |
| 27 | 7.108 | 7.161 | −0.053 | 7.17 | −0.062 |
| 28 | 7.310 | 7.392 | −0.082 | 7.295 | 0.015 |
| 29 | 7.456 | 7.510 | −0.054 | 7.492 | −0.036 |
| 30 | 6.444 | 6.573 | −0.129 | 6.411 | 0.033 |
| 31 | 6.796 | 6.824 | −0.028 | 6.786 | 0.010 |
| 32 | 7.260 | 7.124 | 0.136 | 7.262 | −0.002 |
| 33 | 7.027 | 7.030 | −0.003 | 7.050 | −0.023 |
| 34 | 6.620 | 6.659 | −0.039 | 6.638 | −0.018 |
| 35 a | 7.030 | 7.031 | −0.001 | 7.052 | −0.022 |
| 36 a | 7.210 | 7.252 | −0.042 | 7.372 | −0.162 |
| 37 a | 6.480 | 6.481 | −0.001 | 6.856 | −0.376 |
| 38 | 7.252 | 7.121 | 0.131 | 7.200 | 0.052 |
| 39 | 6.569 | 6.559 | 0.010 | 6.565 | 0.004 |
| 40 | 7.357 | 7.28 | 0.077 | 7.372 | −0.015 |
| 41 | 7.357 | 7.348 | 0.009 | 7.319 | 0.038 |
| 42 a | 6.940 | 6.959 | −0.019 | 6.957 | −0.017 |
| 42(+) | 6.921 | 6.991 | −0.070 | 6.922 | −0.001 |
| 42(-) | 6.377 | 6.430 | −0.053 | 6.365 | 0.012 |
| 43 | 6.943 | 7.008 | −0.065 | 7.020 | −0.077 |
| 43(+) | 7.092 | 6.920 | 0.172 | 7.008 | 0.084 |
| 43(-) | 6.602 | 6.500 | 0.102 | 6.601 | 0.001 |
| No. | Structure | Docking Score (Kcal/mol) | CoMFA | CoMSIA | SA Scores |
|---|---|---|---|---|---|
| C1 |  | −11.865 | 7.036 | 6.874 | 3.254 |
| C2 |  | −11.575 | 6.107 | 6.115 | 3.172 |
| C3 |  | −11.536 | 7.289 | 7.524 | 3.181 |
| C4 | 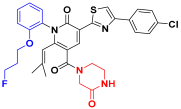 | −11.304 | 6.617 | 6.486 | 3.694 |
| C5 |  | −11.277 | 6.746 | 6.954 | 3.474 |
| C6 | 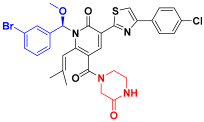 | −11.146 | 7.346 | 7.374 | 3.477 |
| C7 | 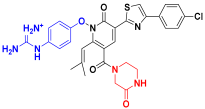 | −11.110 | 6.838 | 6.694 | 3.485 |
| C8 | 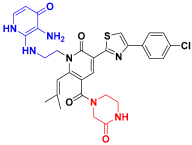 | −11.085 | 6.463 | 9.130 | 3.511 |
| C9 | 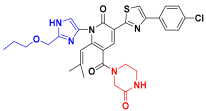 | −11.076 | 7.132 | 7.348 | 3.352 |
| Compound 29 | 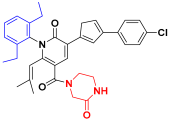 | −9.450 | 7.510 | 7.492 | 3.385 |
| No. | Structure | MM-GBSA ΔGbind (kcal/mol) |
|---|---|---|
| Compound 29 | 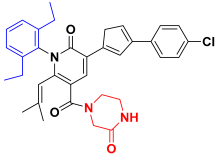 | −75.54 ± 5.69 |
| C1 | 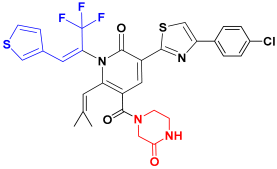 | −76.34 ± 4.67 |
| C2 | 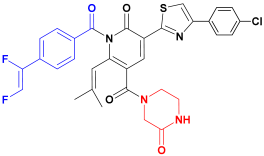 | −93.25 ± 5.20 |
| C3 | 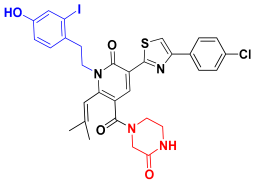 | −80.60 ± 4.29 |
Disclaimer/Publisher’s Note: The statements, opinions and data contained in all publications are solely those of the individual author(s) and contributor(s) and not of MDPI and/or the editor(s). MDPI and/or the editor(s) disclaim responsibility for any injury to people or property resulting from any ideas, methods, instructions or products referred to in the content. |
© 2024 by the authors. Licensee MDPI, Basel, Switzerland. This article is an open access article distributed under the terms and conditions of the Creative Commons Attribution (CC BY) license (https://creativecommons.org/licenses/by/4.0/).
Share and Cite
Wang, Y.; Jia, S.; Wang, F.; Jiang, R.; Yin, X.; Wang, S.; Jin, R.; Guo, H.; Tang, Y.; Wang, Y. 3D-QSAR, Scaffold Hopping, Virtual Screening, and Molecular Dynamics Simulations of Pyridin-2-one as mIDH1 Inhibitors. Int. J. Mol. Sci. 2024, 25, 7434. https://doi.org/10.3390/ijms25137434
Wang Y, Jia S, Wang F, Jiang R, Yin X, Wang S, Jin R, Guo H, Tang Y, Wang Y. 3D-QSAR, Scaffold Hopping, Virtual Screening, and Molecular Dynamics Simulations of Pyridin-2-one as mIDH1 Inhibitors. International Journal of Molecular Sciences. 2024; 25(13):7434. https://doi.org/10.3390/ijms25137434
Chicago/Turabian StyleWang, Yifan, Shunjiang Jia, Fan Wang, Ruizhe Jiang, Xiaodan Yin, Shuo Wang, Ruyi Jin, Hui Guo, Yuping Tang, and Yuwei Wang. 2024. "3D-QSAR, Scaffold Hopping, Virtual Screening, and Molecular Dynamics Simulations of Pyridin-2-one as mIDH1 Inhibitors" International Journal of Molecular Sciences 25, no. 13: 7434. https://doi.org/10.3390/ijms25137434