Abstract
Type 2 Diabetes Mellitus (T2DM) is linked to multiple complications, including cognitive impairment, and the prevalence of memory-related neurodegenerative diseases is higher in T2DM patients. One possible theory is the alteration of the microvascular and macrovascular environment of the blood–brain barrier (BBB). In this study, we employed different approaches, including RT-PCR, functional pharmacokinetic studies using sodium fluorescein (NaFL), and confocal microscopy, to characterize the functional and molecular integrity of the BBB in a T2DM animal model, leptin receptor-deficient mutant mice (Leprdb/db mice). As a result, VCAM-1, ICAM-1, MMP-9, and S100b (BBB-related markers) dysregulation was observed in the Leprdb/db animal model compared to littermate wild-type mice. The brain concentration of sodium fluorescein (NaFL) increased significantly in Leprdb/db untreated mice compared to insulin-treated mice. Therefore, the permeability of NaFL was higher in Leprdb/db control mice than in all remaining groups. Identifying the factors that increase the BBB in Leprdb/db mice will provide a better understanding of the BBB microvasculature and present previously undescribed findings of T2DM-related brain illnesses, filling knowledge gaps in this emerging field of research.
1. Introduction
Diabetes Mellitus (DM) is a heterogeneous metabolic disorder of carbohydrates, proteins, and fats. It is caused by reduced secretion of the insulin hormone produced by pancreatic beta cells [1,2,3,4]. It also refers to the deficiency of insulin or its resistance as a result of individual or environmental factors [5,6]. Factors that predispose individuals to DM include obesity, being overweight, physical inactivity, genes, and family history [3,7]. Over the years, the prevalence of DM worldwide has increased from 4.7% (108 million) in 1980 to 8.5% (422 million) in 2014 [8,9]. Notably, its prevalence has increased more in low- and middle-income countries than in high-income countries [10]. Mortality associated with the condition is also increasing. The mortality rate in 2016 was reported to be 5% higher than the rate in 2000 [9]. The International Diabetes Federation (IDF) originally estimated that the global incidence of DM will increase from 171 million in 2000 to 366 million by 2030 [11].
DM is a metabolic disease that is primarily characterized by hyperglycemia resulting from the insufficient release of insulin, a defect in insulin action, or both [3]. Physiologically, either β-cells are destroyed (i.e., Type 1 Diabetes Mellitus, T1DM) or insulin resistance occurs (i.e., Type 2 Diabetes Mellitus, T2DM) [12]. The chronic elevation of plasma sugar levels (hyperglycemia) has multiple consequences. The clinical manifestations can lead to the loss of function and the damage of tissues that will eventually cause the failure of organs, mainly in the eyes, kidneys, heart, and nerves [3,13].
The majority of diabetic patients fall into T2DM, which appears in almost 90–95% of diabetic patients [3]. The pathophysiology of T2DM starts from insulin resistance with relative insulin deficiency to an insulin secretion defect with insulin resistance [3]. The increase in the glucose level proportionally enhances the incidence of neuropathy disorders, stimulates reactive oxygen species (ROS) production, and increases inflammatory responses [13]. Additionally, it triggers the dysregulation of several pathways, such as polyol, hexosamine, protein kinase-C (PKC), and advanced glycation end products (AGE) pathways [14,15]. Hyperglycemia will lead to the disruption of endothelial cell integrity [16]. Chronic hyperglycemia is associated with macrovascular and microvascular illnesses such as retinopathy, nephropathy, and neuropathy.
On the level of microvascular injury, diabetes affects the capillary membrane by increasing the thickness, leading to various disorders such as hypertension and tissue hypoxia [13]. Additionally, a wealth of evidence has linked hyperglycemia to the pathogenesis of multiple neurological and psychiatric disorders such as ischemia, stroke, Alzheimer’s, schizophrenia, depression, and bipolar disorder. Most of them share a unifying feature: a disruption in the dynamics and structure of the BBB [17,18,19,20,21,22,23].
The blood–brain barrier (BBB) is a powerful selective barrier that controls the movement of molecules (such as oxygen, nutrients, and ions) between the blood and the brain. The BBB is a composite of endothelial cells, pericytes, and astrocytes at the cellular level [24]. In addition, tight junction proteins such as zonula occludin and claudins connect the junctions between endothelial cells. Together, the cellular structure and protein function of the BBB plays a crucial role in maintaining the integrity of the BBB and preventing the influx of any toxins or pathogens [25,26]. Neuroinflammation and oxidative stress are common causes of BBB disruption, resulting from their influence in decreasing the amount of tight junction proteins and increasing the permeability of the BBB [27]. All these changes resulting from neuroinflammation may cause different neurodegenerative diseases [28].
Multiple animal models have been utilized to study T2DM. One is leptin receptor mutant (Leprdb/db) mice [29]. Leptin is a hormone that passes to the central nervous system (CNS) and acts on the leptin receptor, stimulating functions related to hunger sensation, energy balance, and thermogenesis. It was linked to other physiological functions, including mood regulation, synaptic wiring, and neurogenesis [30]. Leprdb/db mice harbor mutations in the leptin receptor, leading to dysfunctional signaling and recapitulating phenotypic behavioral and molecular features associated with DM and obesity [29,31].
Limited studies have addressed diabetes mellitus’ impact on the microvasculature of the CNS, specifically on the architecture of the BBB. In addition, functional, structural, and/or dynamic studies of BBB components are limited. Fundamental questions need to be addressed, such as: (1) What is the effect of long-term hyperglycemia on BBB function? (2) How does hyperglycemia impact the gene expression of BBB components? (3) What are the BBB transporting system’s dynamic changes and functions? (4) Is disruption of the BBB the leading cause of brain disorders, or is it an emerging symptom? What are the molecular links between brain disorders and the BBB? (5) Does the BBB participate in etiology or play a synergistic role in the disease’s symptoms?
Until now, many of these fundamental questions remain unanswered. Understanding the BBB’s microvascular and macrovascular elements underlying T2DM might be crucial for revealing the causation of many T2DM-related brain disorders and helping us find new pharmacological interventions. Here, our study focuses on a new functional role of the BBB in T2DM that could be a possible mechanism underlying reduced synaptic plasticity in the neuronal population in the Leprdb/db mouse model and might answer some of these questions.
2. Results
2.1. The Molecular Expression of BBB Markers in the Brain Homogenate of Leprdb/db Mice
First, we examined the mRNA levels of the BBB-related markers ICAM-1, VCAM-1, MMP-9, and S100BS100b In the PFC homogenate, the level of ICAM-1 mRNA was significantly elevated in Leprdb/db mice, compared with the other groups (p < 0.05) (Figure 1A). Conversely, the mRNA level of VCAM-1 was significantly reduced in Leprdb/db mice (p < 0.01) and dramatically increased in Leprdb/db mice treated with insulin (p < 0.001) (Figure 1B). Our analyses indicated that MMP-9 was not altered among the groups (Figure 1C). Our investigation was then extended to examine S100b. We found that the mRNA level of S100b was significantly reduced in Leprdb/db insulin-treated mice (p < 0.001). In addition, the mRNA level of S100b was reduced in Leprdb/db mice treated with insulin (p < 0.01) compared to the control mice. Similarly, it was reduced in control mice treated with insulin (p < 0.05) compared to the control mice (Figure 1D). Our quantitative RT-PCR analysis revealed that the integrity of the BBB was altered in tested groups.
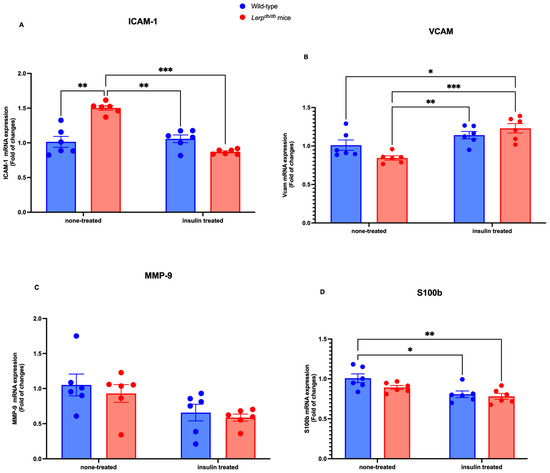
Figure 1.
Comparison of ICAM-1, VCAM-1, MMP-9, and S100b mRNA expression in WT control and Leprdb/d mice. Molecular examination of the effects of insulin on ICAM-1, VCAM-1, MMP-9, and S100b in the PFC homogenate. The mRNA expression level of ICAM-1 (A), VCAM-1 (B), MMP-9 (C), and S100b (D) was determined by quantitative RT-PCR with GAPDH as an internal control. Data were expressed as fold change and analyzed using a two-way ANOVA followed by a Tukey–Kramer post-test. Each value indicates the mean ± S.E.M. of three animals. The total number of biological and technical replicates is 6 per group. * p < 0.05; ** p < 0.01; *** p < 0.001. Groups are wild-type control = WT; wild-type treated with insulin = WT treated; Leprdb/db = DB-CONT; and Leprdb/db treated with insulin = DB + INS).
2.2. Immunohistochemistry of ZO-1 in the Prefrontal Area of Leprdb/db and Control Mice
Next, we explored the architecture of the BBB in the cortex of the tested groups. We examined the expression pattern of ZO-1, a protein that links transmembrane components to the actin cytoskeleton (Figure 2). As illustrated in Figure 2, we used the mask to track the intensity and pattern of ZO-1 immunofluorescence. Then, we examined ZO-1 expression in the wild-type mice, Leprdb/db mice, and Leprdb/db mice treated with insulin (Figure 2). Notably, the expression intensity and pattern of ZO-1 were comparable among all groups (Figure 2). This indicates that treatment with insulin may have a profound molecular impact on ZO-1 expression. We further examined occludin levels (Supplementary Figure S1), and we found a lack of statistical significance.
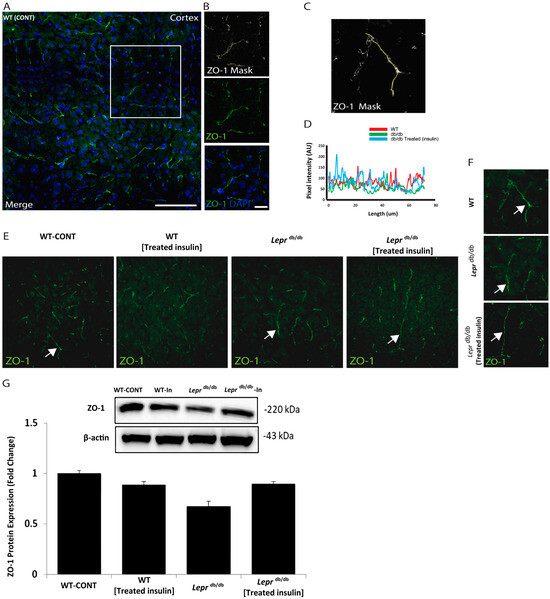
Figure 2.
The expression pattern of ZO-1 in the cortical area of Leprdb/db and control mice. Examination of the architecture of ZO-1 in the cortex slices of Leprdb/db and control mice. (A) ZO-1 immunoreactivity (green) and DAPI indicate nuclear staining (blue). (B) Representative higher-resolution views of the white box of the ZO-1-positive segment (green) and the ZO-1 ROI mask were generated by adjusting the threshold of ZO-1 using ImageJ software in the cortex (ImageJ, U. S. National Institutes of Health, Bethesda, MD, USA, (http://imagej.nih.gov/ij) added in methodology). (C) High-power (top) mask and (D) the total quantifications of ZO-1 expression. (E) Representative immunostaining images of ZO-1 (green), arrows indicate ZO-1 fluorescent signals. (F) ZO-1 immunoreactivity (green). Right panels represent high magnification of the white arrows in (E). (G) Immunoblot detection of ZO-1 in whole mouse cortex homogenates from Leprdb/db, wild-type, Leprdb/db, and wild-type treated mice. Statistical differences were assessed using a two-way ANOVA followed by a Tukey–Kramer post-hoc test. Each value indicates the mean ± S.E.M. of 3 animals per group. Groups are Wild-type control = WT (lean); Leprdb/db = Leprdb/db; and Leprdb/db treated with Insulin = Leprdb/db Insulin-Treated. Scale bars represent 100 μm in A and 20 μm in (B).
2.3. BBB Permeability Analysis Using Na+ Fluorescein
The outcomes of the BBB permeability experiment are depicted in Figure 3. All Sodium Fluorescein (NaFL) concentrations measured from plasma and brain samples fell within the standard curve. The plasma concentration–time curves (%ID/mL) of the four groups are presented in Figure 3A. This shows that the plasma concentration profile decreased from 0–30 min. As expected, the brain concentration of the BBB permeability marker (NaFL) was significantly higher in the Leprdb/db mice (diabetic untreated group) than in the remaining groups (Figure 3B). The brain concentration of NaFL ± SEM in µg.g−1 is listed in Table 1. The BBB permeability of NaFL, calculated by dividing the brain concentration by the AUC, is depicted in Figure 3C. The values presented in Table 2 illustrate the increase in BBB permeability in the diabetic mice compared with the control mice. However, these observations could be affected by the small sample size.
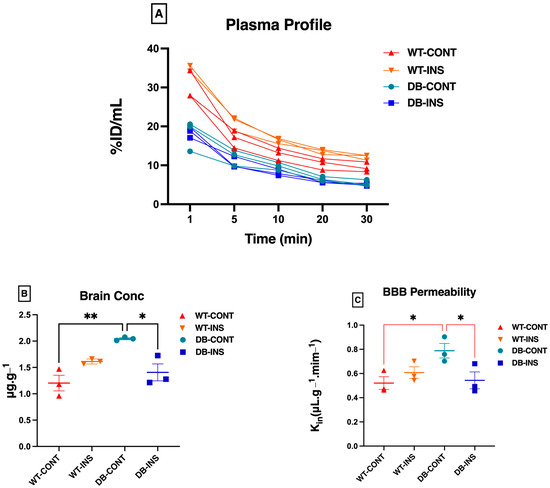
Figure 3.
Permeability characteristics of the BBB using NaFL in Leprdb/db and control mice. (A) The plasma concentration profile for sodium fluorescence (NaFL) from 0 to 30 min after intravenous bolus injection. (B) The brain concentration for sodium fluorescence (NaFL) at 30 min after intravenous bolus injection. (C) The clearance into the brain tissue for sodium fluorescence (NaFa) after intravenous bolus injection. * p < 0.05; ** p < 0.01. Data represent mean ± S.E.M.

Table 1.
The brain concentration of NaFL.
Table 2.
The BBB permeability of NaFL.
3. Discussion
In this study, we evaluated the molecular and functional characteristics of the BBB in a diabetic mouse model (Leprdb/db) upon insulin administration. Our results indicated that mRNA levels of VCAM-1, ICAM-1, and S100b proteins were altered in Leprdb/db mice and that some of these changes were affected by insulin treatment. Additionally, we analyzed the expression of proteins and tracked the BBB architecture using double and triple immunofluorescence labeling.
Our Western blot studies indicated that the protein expression of ZO-I was not altered, while functionality indicated a change in the BBB. This could be driven by changes in other BBB compartments. It might indicate that other markers, such as claudin-5, could be mechanistically involved in this dysregulation [32,33].
A review has highlighted the changes in the BBB in subarachnoid hemorrhage. It reported the molecular role of p53–NF-κB–MMP-9 signaling in the pathology of subarachnoid hemorrhage. Further, it indicated the involvement of tight junction proteins, including ICAM-1 and VCAM-1. These proteins were dysregulated due to increased pro-inflammatory cytokines [34]. In line with this, a previous study reported substantial BBB leakage in young Leprdb/db mice, referred to as the pre-hyperglycemic metabolic stage, which was correlated to stress-related endothelial changes [35].
Further, in both Leprdb/db and streptozotocin diabetic mice models, the gene level of BBB markers was altered. In this report, the regression analysis of BBB permeability examined by NaFL accumulation versus blood glucose levels in the streptozotocin-diabetic mouse model indicated a greater permeability and a strong correlation. Compared to heterozygous mice with normal blood glucose levels, Leprdb/db mice exhibited a more than two-fold accumulation of NaFL [36]. This evidence supports the role of lost BBB integrity in diabetic animal models.
qRT-PCR identified differences in the molecular expression of the VCAM-1, ICAM-1, and S100b genes. There were differences in the mRNA expression of the genes in WT mice, as well as a significant difference in the expression of VCAM-1 and ICAM-1 in Leprdb/db mice compared with wild-type mice. For example, ICAM-1 expression was highest in the DB-CONT mice and lowest in DB+INS. The level was significantly reduced in Leprdb/db mice upon treatment with insulin, indicating a mechanistic link between molecular abnormalities in the BBB and insulin signaling.
A recent study reported that insulin impacts the BBB endothelium and insulin resistance is linked to a dysfunctional BBB structure and components using RNA sequencing, functional annotation, and gene ontology [37]. In support of the role of insulin in the integrity of the BBB, our observations indicated that ICAM-1 mRNA expression was reduced toward a normalized level compared to the wild-type control following insulin administration in Leprdb/db mice. Further, VCAM-1 production within Leprdb/db mice was reduced, and insulin signifies its mRNA expression. In line with this, the mRNA expression of S100b was reduced in Leprdb/db mice treated with insulin. A previous study concluded that diabetes alters the tight junctions’ molecular anatomy by affecting the structural protein content [38].
VCAM-1 expression was highest in insulin-treated WT and Leprdb/db mice, with the DB-CONT exhibiting the least expression. Upon treatment with insulin, the mRNA level of VCAM-1 in Leprdb/db mice was reversed and significantly increased in Leprdb/db mice. The discrepancies in the ICAM-1 and VCAM-1 baseline levels suggest a compensatory mechanism in the neurovascular unit in Leprdb/db mice. Consistent with this finding, in a previous study utilizing a systemic lupus erythematosus mouse model, both markers exhibited a differential role in modulating leukocyte–endothelial interactions [39]. A postmortem study indicated that cerebrovascular expression of ICAM-1 was not altered with aging. This could be attributed to the differences in brain regions utilized. Another factor that could contribute to this observation is the existence of different medical conditions in the study subjects [40].
Our findings indicated that ICAM-1 and VCAM-1 expression levels presented opposite trends. In a previous study utilizing human umbilical vein endothelial cells, induction of p38 mitogen-activated protein (MAP) kinase signaling elevated the surface expression of VCAM-1 with no impact on ICAM-1 expression. This suggests that both adhesion molecules may have differential post-transcriptional activation [41].
Our RT-PCR analyses indicated differences in the mRNA level of BBB markers in both treated mice in the wild-type group and Leprdb/db mice. The differences in these changes could be attributed to variations in the glucose levels of the experimental and control mice.Glucose levels in mice influence the production of ROS, and these activate different pathways that influence the expression of adhesion molecules. VCAM-1, ICAM-1, and MMP-9 are soluble adhesion molecules. ICAM-1 and VCAM-1 influence inflammatory processes in the endothelium. Their activities play a significant role in the development of atherosclerosis as they overlap with the systems that transfer leukocytes into the vascular wall. In addition, MMP-9 plays a vital role in destroying the atherosclerotic plaques building up in the extracellular matrix as they have thrombogenic properties. Importantly, atherosclerosis is a macrovascular complication of DM, and these adhesion molecules have a role to play in its development [42].
Our studies indicated that the mRNA level of S100b was significantly reduced in Leprdb/db and control mice treated with insulin, suggesting a therapeutic modulation of S100b by insulin. S100b is a pro-inflammatory calcium-binding protein linked to inflammatory macrophages and adipocytes [43,44]. One explanation for our observation is through the Advanced glycation end-product (AGE). The AGE levels in hyperglycemia are affected, altering gene expression in cells and thereby impairing cell signaling in the extracellular environment [45]. Activation of the receptors for AGEs (RAGE) increases when glucose levels are high and under oxidative stress, elevating the production of pro-inflammatory cytokines [46]. RAGE is a multi-ligand receptor that binds to various molecules, including S100b. Therefore, there was a reduction in the production of pro-inflammatory cytokines and molecules, which, as expected, also reduced the levels of adhesion molecules [47]. This indicated the potential involvement of RAGE signaling and downstream pathways in a hyperglycemic state. Another possible explanation for this reduction in S100b is that insulin administration regulates adipocytes [48]. A substantial amount of S100b is contained within the adipocytes. Hormonal regulation of adipocytes via treatment with insulin has been found to modulate S100b [43]. Additionally, in streptozotocin-induced diabetes, the S100b protein was reported to be elevated by two, yet the mRNA was reduced [49]. On the other hand, exposure to elevated glucose levels was found to mediate a reduction in the protein level of S100b in neuronal cell culture. This could be driven by the disruption of cellular metabolism and energetic homeostasis [50].
In regard to the expression of ZO-1, a previous study reported that in aged mice, immunofluorescence expression of occludin-1 and ZO-1 is altered compared to young mice [51]. The endothelial cells in the BBB restrict permeability and the entry of substances into and out of the brain and CNS. The BBB has specialized characteristics, and the endothelial cells contain pericytes and proteins embedded in its capillary membrane, conferring its restrictive permeability.
In addition, functional and structural breakdowns within the BBB were observed in Leprdb/db mice. These observations led to a cognitive deficit and macrophage infiltration [52]. Another report examined the ultrastructure of the BBB using electron microscopy. Their findings indicated that Leprdb/db mice exhibited leakage and hyperpermeability in the BBB at younger ages [35].
Further, using two animal models of diabetes, one of them being Leprdb/db mice, BBB microvascular density was augmented while functional perfusion using fluorescein perfusing studies was not altered. This suggests that this augmentation within the structural density and increased remodeling in Leprdb/db mice could be a non-functional compensatory mechanism [53]. In addition, in another genetic model, Desert Hedgehog-deficient mice, an impairment in the BBB was reported. Further, in Leprdb/db mice, the reduced expression of Desert Hedgehog was linked to amplified endoneurial capillary permeability and the reduced protein expression of Claudin5 [54].
Another critical factor is that leptin receptors play a fundamental role in transferring leptin across the BBB [55]. Interestingly, the neuronal microvascular units, choroid plexus, and leptomeninges express short isoforms of leptin receptors [56]. Further, it was suggested that leptin receptors mediate leptin transcytosis via the choroid plexus [57]. This distribution supports the importance of leptin signaling in maintaining the functional integrity of the BBB.
In this study, we observed an increase in the brain concentration of NaFL in obese control mice (untreated mice) compared with all other groups and a non-significant increase in BBB permeability. The BBB specializes in reducing substances’ permeability into the brain and CNS. In a diseased state, the BBB breaks down, leading to the entry/leakage of harmful substances into the CNS, infiltration of cellular components, and aberrant transport and clearance of important molecules. The cerebral flow of blood is also affected, leading to neurological deficits. In DM, high glucose levels affect the BBB’s microvascular integrity due to oxidative stress caused by increased ROS levels and the impaired function of the antioxidant protective system. In line with our findings, a previous report indicated elevated BBB permeability in Leprdb/db mice compared to wild-type controls and heterozygous mice [36].
Study Limitations
This study exhibited some limitations. For example, our immunofluorescence studies demonstrated the expression of ZO-1. Yet, future studies are needed to comprehensively analyze the BBB’s subcellular features, including the intensity profiles within the endothelial cell membrane [58,59,60]. Further, our conclusion would be stronger if we characterized the ultrastructural integrity of the BBB using advanced techniques such as transmission electron microscopy (TEM). According to the human protein Atlas, ZO-1 is expressed in multiple types of neuronal cells and structures [61]. Therefore, we could examine other BBB markers. Claudin-5 has been utilized extensively in the context of BBB integrity and functionality [62,63,64,65]. Our data indicated that mRNA was altered, yet we have not confirmed that at the protein level. The notion that altered mRNA levels are linked to changes in the protein level is not strongly supported [66,67]. Thus, future studies should characterize VCAM-1, ICAM-1, and MMP-9 protein expression.
4. Materials and Methods
4.1. Animals
Adult male Leprdb/db mice (six–eight weeks old; Strain B6.BKS (D)-Leprdb/J, Stock No. 000697 B6 db) and age-matched non-diabetic lean control mice (littermate wild-type) were included in the study. This valid diabetic model has been utilized extensively in multiple studies using the same vendor, including by our research team [68,69,70,71].
The mice were housed at the Animal Care Centre, King Saud University, and had free access to food and water. All experiments were performed in compliance with the rules of the Research Ethics Committee (REC) at King Saud University with ethics reference number (SE-19-135); the date of issue is 13-2-2020.
Mice were bred in the animal care facility by mating heterozygous (Leprdb/+) males and females. Mice genotypes were confirmed by tail tissue and PCR analysis conducted by Transnetyx, Inc. (Cordova, TN, USA). The mice were maintained at a room temperature of 22 ± 2 °C with a 12:12 h light/dark cycle and 40 to 60% humidity.
4.2. Experimental Design
Four groups of mice were treated intraperitoneally (IP) with either normal saline (control) or insulin (0.1–0.4 U/kg in normal saline, a unified dose was given to the groups at the same time), as follows [72]:
Group I WT (wild-type mice): 6–8 mice were treated with normal saline for two weeks.
Group II Leprdb/db (Leprdb/db mice): 6–8 mice were treated with normal saline for two weeks.
Group III WT—insulin-treated (wild-type insulin-treated mice): 6–8 mice received insulin daily for two weeks.
Group IV Leprdb/db—insulin-treated (Leprdb/db insulin-treated mice): 6–8 mice were treated with insulin daily for two weeks.
The insulin source was HUMALOG® Mix50/50TM (Eli Lilly and Company, Indianapolis, IN, USA, HP8798). To confirm the presence of diabetes in the models, the mice fasted for 4–6 h. Their blood glucose levels were then measured using 1–2 drops of blood collected from their tails on a glucometer chip (Accu-Check Advantage Blood Glucose Monitor, Roche Diagnostics Corp., Indianapolis, IN, USA). All Leprdb/db mice had their blood sugar levels tested every two days. The control group had less than 200 mg/dL. The mice’s total body weight and blood glucose levels were measured regularly to assess their overall health status [73,74].
4.3. Tissue Collection
Mice were anesthetized with isoflurane (4% for induction, then 1–1.5% for maintenance) in 30% O2 using a facemask and SurgiVet vaporizer (Sigma-Aldrich, Saint Louis, MO, USA). A toe pinch was applied beforehand to ensure the animal was deeply anesthetized. The anesthesia dose increased if the animal responded to the toe pinch. The mice were then decapitated, and their brains were immersed immediately in liquid nitrogen and kept at −80 °C for further processing [73].
4.4. BBB Permeability Experiment
4.4.1. Pharmacokinetic Studies
The functional integrity of the BBB in Leprdb/db mice (one hemisphere of the brain) was examined using sodium fluorescein (NaFL) analysis, a low-molecular-weight hydrophilic compound [42,75]. The solution of 5 mg/mL Na fluorescein was prepared by dissolving 50 mg of Na fluorescein in 10 mL of sterile saline, following which the pH was checked and was found to be 7.4. Mice were anesthetized with isoflurane (4% for induction, then 1–1.5% for maintenance) in 30% O2 using a facemask and SurgiVet vaporizer. When the mice were completely anesthetized, both jugular veins were exposed. They were then injected with doses of 20 mg/kg per mouse in the left jugular vein. Blood samples were collected after 1, 5, 10, 20, and 30 min from the contralateral jugular vein. Following the collection of the last blood sample (30 min), the blood was washed out through the left ventricle (LV) of the heart with PBS + 10 units of heparin (this is known as the trans-cardiac buffer washout method). Plasma samples were separated from the blood by centrifuging for 10 min with 5000× g at 4 °C. Aliquots (10 µL) of total plasma samples (bounded fraction of NaFL) were diluted up to 1000 µL (1:100) with a solution of 4% bovine serum albumin in water [76].
4.4.2. Spectrofluorometer Analysis of Na+ Fluorescein Permeability in the BBB
The concentration of NaFL in plasma and brain samples was measured using a Fluostar Optima spectrofluorometer (BMG, LabTech). The standard curve (62.5, 125, 250, 500, 1000, 2500, and 5000) of NaFL was prepared from a serial dilution of NaFL in the plasma and brain matrix. Detection of the fluorescence was performed at excitation and emission wavelengths of 485 and 520 nm, respectively. A total of 20 µL of each plasma and brain sample was added to a 96-well plate for analysis [77,78].
4.4.3. Pharmacokinetic Analysis
The areas under the plasma concentration–time curve (AUC) of NaFL during the sampling time (0–30 min) were estimated using the linear trapezoidal rule. The apparent brain uptake clearance () for NaFL was calculated by dividing the brain concentration of NaFL (NaFL ) at 30 min by of NaFL in plasma (0–30 min) ( (Equation (1))) [79].
4.5. Quantification of mRNA Expression by Real-Time Polymerase Chain Reaction
The molecular expression of BBB markers was examined in the brain homogenate of Leprdb/db mice. Quantitative analysis of specific mRNA expression was performed using RT-PCR by subjecting the resulting cDNA to PCR amplification using 96-well optical reaction plates in the ABI Prism 7500 Fast real-time PCR System (Applied Biosystems, Waltham, MA, USA). The 25 µL reaction mixture contained 0.1 µL of a 10 µM forward primer and 0.1 µL of a 10 µM reverse primer (40 nM final concentration of each primer), 12.5 µL of SYBR Green Universal Master mix, 11.05 µL of nuclease-free water, and 1.25 µL of the cDNA sample. Mouse primers and probes for ICAM-1, VCAM-1, MMP9, S100b, and GAPDH were utilized (Table 3). The primers were purified using standard desalting and purchased from Integrated DNA Technologies (IDT, Coralville, IA, USA). The RT-PCR data were analyzed using the relative gene expression (i.e., ΔΔ CT) method, as described and explained previously [80]. The data are presented as the fold change in gene expression normalized to the endogenous reference gene GAPDH and relative to a calibrator. The fold change in the level of target genes between treated and untreated groups was corrected by the level of GAPDH. After treatment for the periods specified, total cellular RNA was isolated using TRI-zol reagent (Invitrogen®) following the manufacturer’s instructions.
Table 3.
Primer Sequences.
4.5.1. CDNA Synthesis
First-strand cDNA synthesis was performed using the High-capacity cDNA reverse transcription kit or iScript RT supermix (Thermo Fisher Scientific, Waltham, MA, USA, catalog# 4368814). Briefly, 1.5 µg of total RNA from each sample was added to a mixture of 2.0 µL of 10× reverse transcriptase buffer, 0.8 µL of 25× dNTP mix (100 mM), 2.0 µL of 10× reverse transcriptase random primers, 1.0 µL of MultiScribe reverse transcriptase, and 3.2 µL of nuclease-free water. The final reaction mixture was then kept at 25 °C for 10 min, heated to 37 °C for 120 min, heated further to 85 °C for 5 min, and then cooled to 4 °C.
4.5.2. Real-Time Polymerase Chain Reaction (RT-PCR)
RT-PCR was conducted on a liquid nitrogen snap-frozen prefrontal cortex (PFC), a brain region linked to cognitive capacity, and the PFC was microdissected on a cryostat (Leica CM3050 S cryostat—Leica Microsystems). Total RNA was isolated using a Trizol reagent following the manufacturer’s instructions (Invitrogen Co., Grand Island, NY, USA). The Nanodrop (NanoDrop™ 8000 spectrophotometer, Thermo Fisher Scientific, Waltham, MA, USA) was used to test the purity of the RNA samples. Our sample readout, measured in concentration of ng/μL, ranged between 1.8 to 2. iScript RT supermix (Bio-Rad Laboratories, catalog# 1708840) was then used to reverse the total mRNA transcribed to cDNA, which was then amplified with the selected primers: VCAM-1, ICAM-1, MMP-9, and S100b (genes involved in BBB structure and function). The levels of transcription of the primers were normalized with suitable housekeeping genes. The real-time PCR analyses were performed using the CFX96 Real-Time Detection System (Bio-Rad) [81].
4.6. Immunofluorescence
Immunofluorescence, confocal imaging, and image analysis were performed to track and analyze the architecture of BBB markers in the prefrontal area slices of Leprdb/db and control mice [73]. Frozen mouse brain tissue was sectioned (14–20 µm thickness) using a cryostat (Leica CM3050s). Brain sections were washed with 1% PBS, pre-incubated with 4% paraformaldehyde for 30 min, and incubated with a permeabilizing agent (1% Triton, 0.5% Tween in PBS, or −20 °C acetone). Slices were then washed extensively with 1% PBS and incubated with 10% normal goat serum NGS (Sigma-Aldrich) in 1% TBS containing 0.3% Triton X-100 for one hour. This was followed by overnight incubation at 4 °C with rabbit anti-ZO-1 (1:300, Novus cat no# NBP1-85047) and anti-occludin (1:500, Novus cat no# NBP1-77037ss) primary antibody in 3% bovine serum albumin (BSA; Sigma-Aldrich) and 1% PBS containing 0.1% Tween-20. The following day, sections were washed with 1% PBS and incubated with appropriate secondary antibodies (1:250, Invitrogen) for one hour in a 1% PBS solution containing 3% BSA and 0.1% Tween-20. After incubation, the tissue was washed five more times with 1% PBS or TBS buffer solution. Finally, glass slides were placed in an oven at 30–32 °C for 10–15 min to dry and then coverslipped using Fisherfinest® Premium Cover Glass (Fisher Scientific) with ProLong® Gold anti-fade or ProLong® Gold anti-fade mountant with Dapi reagents (Life Technologies, catalog number P36941) [73].
4.7. Confocal Microscopy
All confocal images were obtained on a Zeiss LSM-800 confocal microscope with a Fluar (5×/0.25) objective, a Plan-Apochromat (20×/0.75 na) objective, a C-Apochromat (40×/1.2 W Corr) objective, and a Plan-Apochromat (63×/1.46 Oil) objective. A comparison of WT and Leprdb/db mice tissue was performed on slices prepared in parallel, and images were obtained using identical exposure times. Multitrack acquisition was performed with excitation lines at 488 nm for Alexa 488, 543 nm for Alexa 568, and 633 nm for A647. Z-series stack confocal images were taken at fixed intervals: 0.6 µm for 40× and 0.4 µm for 63×, with the same pinhole setting for all three channels. The frame size was either 1024 × 1024 or 512 × 512 pixels. Images were processed using ImageJ 1.53u U. S. National Institutes of Health, Bethesda, MD, USA, (http://imagej.nih.gov/ij) (https://imagej.nih.gov/ij/) (accessed on 4 August 2019). The contrast and brightness of the displayed images were adjusted using ImageJ. Image stacks for double immunostained slides were converted into the same single average Z-axis projection and exported as TIFF files [73].
4.8. Western Blotting
We analyzed the protein expression of ZO-1 in the brain homogenate of the tested groups. First, 50 mg of PFC from the brain tissues (n = 3 mice per group) were homogenized in 0.32 M sucrose solution in the presence of protease and phosphatase inhibitors. The protein concentrations of samples from the brain tissue homogenates of the tested groups were measured using a NanoDrop™ 8000 Spectrophotometer (Thermo Fisher Scientific, Waltham, MA, USA), mixed with 2X lamellae buffer, denatured for 10 min at 95 °C, and separated on 7.5% SDS-PAGE gel. The protein was electrophoretically transferred from the gel into a nitrocellulose membrane. Membranes were blocked with 5% nonfat dry milk in TBS-T for 30 min and probed with the primary antibody, Rabbit anti-TJP-1(1:500, Novus), TJP-1 represents ZO-1, in a blocking solution. They were then treated with horseradish-peroxidase conjugated secondary antibodies and ECL Western blotting detection reagents. The signals were detected and measured with a luminescent image analyzer (ChemiDoc TMMP Bio-Rad). ImageJ was used to measure the intensity of ZO-1 [82].
4.9. Statistical Analysis
The data were reported as the mean ± standard error of the mean (SEM). For our studies, differences between the groups were determined using a two-way ANOVA (treatment × Genotype) followed by a Tukey–Kramer post-hoc test. GraphPad Prism software Version 10 (GraphPad Software, San Diego, CA, USA) was used to perform the calculations, and differences were considered significant at p < 0.05.
5. Conclusions
This study evaluated the functional alterations in diabetic mice models treated with insulin and controls that received saline treatments. The expression of significant proteins of the BBB, such as ZO-1 and occludin, was also evaluated; these results indicated that insulin injections reversed the effects of diabetes and hyperglycemia in the mice and exerted positive effects on the BBB. The expression of adhesion molecules was altered. Moreover, the brain concentration of NaFL, along with the molecular change in obese mice, provides evidence for the effect of hyperglycemia on the BBB. Permeability in the obese insulin-treated mice was lower than in the saline-treated mice, although this difference was not significant. This indicates the need for further studies investigating the effects of insulin treatment on the permeability of the BBB and how hyperglycemic conditions promote reduced integrity. Future work will focus on the architecture of other brain regions or proteins in the BBB. In addition, a behavioral study will be conducted to ensure the effect of insulin treatment on cognition from changes in the BBB, and more research will be needed to examine the most common treatments used in diabetic patients with high permeability and their toxicity on the patient due to molecular and functional changes in the BBB.
Supplementary Materials
The following supporting information can be downloaded at: https://www.mdpi.com/article/10.3390/ijms25147768/s1, Right panels represent high magnification of the white boxes in (A). Scale bars represent 35 μm.
Author Contributions
Conceptualization, M.A.A., F.A. (Faleh Alqahtani), T.K.A. and F.A. (Fawaz Alasmari); methodology, M.A.A., F.A. (Faleh Alqahtani) and S.D.A.; formal analysis, M.A.A., F.A. (Faleh Alqahtani), M.R.K., A.O.A. and T.K.A.; Investigation, M.A.A., F.A. (Faleh Alqahtani), F.A. (Fawaz Alasmari), M.R.K. and A.O.A.; resources, M.A.A., F.A. (Faleh Alqahtani), F.A. (Fawaz Alasmari), M.A.B. and T.K.A.; writing—original draft preparation, M.A.A., F.A. (Faleh Alqahtani), A.O.A. and M.R.K.; writing—review and editing, M.A.A., T.K.A., S.D.A. and M.A.B.; supervision, M.A.A., F.A. (Faleh Alqahtani) and F.A. (Fawaz Alasmari); project administration, M.A.A. and S.D.A.; funding acquisition, S.D.A. All authors have read and agreed to the published version of the manuscript.
Funding
This work was funded by the National Plan for Science, Technology, and Innovation (MAARIFAH), King Abdulaziz City for Science and Technology, Kingdom of Saudi Arabia, grant No 3-17-05-001-0051.
Institutional Review Board Statement
Ethical approval was granted by the Institutional Review Board at King Saud University in Riyadh, Saudi Arabia (SE-19-135). Approval date(13 February 2020).
Informed Consent Statement
Not applicable.
Data Availability Statement
Data are available upon reasonable request.
Conflicts of Interest
The authors declare no conflicts of interest.
Abbreviations
| BBB | Blood-Brain Barrier |
| DM | Diabetes Mellitus |
| T1DM | Type 1 Diabetes Mellitus |
| T1DM | Type 1 Diabetes Mellitus |
| ICAM | Intercellular Adhesion Molecule |
| MMP | Matrix Metalloproteinases |
| NaFL | Sodium Fluorescein |
| RT-PCR | Real-Time Polymerase Chain Reaction |
| VCAM | Vascular cell adhesion protein |
| S100b | S100 calcium-binding protein B |
| Leprdb/db | Leptin receptor mutant mice |
| TJP-1 | Tight junction protein 1 (Zonula occludens-1) |
| ZO-1 | Zonula occludens-1 |
References
- Porth, C. Essentials of Pathophysiology: Concepts of Altered Health States; Lippincott Williams & Wilkins: Philadelphia, PA, USA, 2011. [Google Scholar]
- Punthakee, Z.; Goldenberg, R.; Katz, P. Definition, classification and diagnosis of diabetes, prediabetes and metabolic syndrome. Can. J. Diabetes 2018, 42, S10–S15. [Google Scholar] [CrossRef]
- American Diabetes Association. Diagnosis and classification of diabetes mellitus. Diabetes Care 2010, 33, S62–S69. [Google Scholar] [CrossRef]
- Bastaki, A. Diabetes mellitus and its treatment. Int. J. Diabetes Metab. 2005, 13, 111–134. [Google Scholar] [CrossRef]
- Mayer, E.J.; Newman, B.; Austin, M.A.; Zhang, D.; Quesenberry, C.P., Jr.; Edwards, K.; Selby, J.V. Genetic and Environmental Influences on Insulin Levels and the Insulin Resistance Syndrome: An Analysis of Women Twins. Am. J. Epidemiol. 1996, 143, 323–332. [Google Scholar] [CrossRef] [PubMed]
- James, D.E.; Stöckli, J.; Birnbaum, M.J. The aetiology and molecular landscape of insulin resistance. Nat. Rev. Mol. Cell Biol. 2021, 22, 751–771. [Google Scholar] [CrossRef] [PubMed]
- Gasmi, A.; Noor, S.; Menzel, A.; Pivina, L.; Bjørklund, G. Obesity and insulin resistance: Associations with chronic inflammation, genetic and epigenetic factors. Curr. Med. Chem. 2021, 28, 800–826. [Google Scholar] [CrossRef]
- Abdulaziz Al Dawish, M.; Alwin Robert, A.; Braham, R.; Abdallah Al Hayek, A.; Al Saeed, A.; Ahmed Ahmed, R.; Sulaiman Al Sabaan, F. Diabetes mellitus in Saudi Arabia: A review of the recent literature. Curr. Diabetes Rev. 2016, 12, 359–368. [Google Scholar] [CrossRef]
- Cho, N.; Shaw, J.; Karuranga, S.; Huang, Y.; da Rocha Fernandes, J.; Ohlrogge, A.; Malanda, B. IDF Diabetes Atlas: Global estimates of diabetes prevalence for 2017 and projections for 2045. Diabetes Res. Clin. Pract. 2018, 138, 271–281. [Google Scholar] [CrossRef]
- Dagenais, G.R.; Gerstein, H.C.; Zhang, X.; McQueen, M.; Lear, S.; Lopez-Jaramillo, P.; Mohan, V.; Mony, P.; Gupta, R.; Kutty, V.R.; et al. Variations in Diabetes Prevalence in Low-, Middle-, and High-Income Countries: Results from the Prospective Urban and Rural Epidemiological Study. Diabetes Care 2016, 39, 780–787. [Google Scholar] [CrossRef]
- Alp, H.; Sahin, A.; Karabaglı, P.; Karaburgu, S.; Yılmaz Sanal, B.; Yuksel, E.B. Current Perspective on Diabetes Mellitus in Clinical Sciences; Nobel Tip Bookstores: İstanbul, Turkey, 2023. [Google Scholar]
- Alhowaish, A.K. Economic costs of diabetes in Saudi Arabia. J. Fam. Community Med. 2013, 20, 1–7. [Google Scholar] [CrossRef]
- Chawla, A.; Chawla, R.; Jaggi, S. Microvasular and macrovascular complications in diabetes mellitus: Distinct or continuum? Indian J. Endocrinol. Metab. 2016, 20, 546–551. [Google Scholar] [CrossRef] [PubMed]
- Lazo-de-la-Vega-Monroy, M.-L.; Fernndez-Mej, C. Oxidative stress in diabetes mellitus and the role of vitamins with antioxidant actions. In Oxidative Stress and Chronic Degenerative Diseases—A Role for Antioxidants; InTech: London, UK, 2013; Volume 209. [Google Scholar]
- Brownlee, M. The pathobiology of diabetic complications: A unifying mechanism. Diabetes 2005, 54, 1615–1625. [Google Scholar] [CrossRef] [PubMed]
- Sharma, G.; Ashhar, M.U.; Aeri, V.; Katare, D.P. Development and characterization of late-stage diabetes mellitus and-associated vascular complications. Life Sci. 2019, 216, 295–304. [Google Scholar] [CrossRef] [PubMed]
- Mamakou, V.; Thanopoulou, A.; Gonidakis, F.; Tentolouris, N.; Kontaxakis, V. Schizophrenia and type 2 diabetes mellitus. Psychiatriki 2018, 29, 64–73. [Google Scholar] [CrossRef] [PubMed]
- Balhara, Y.P.S. Diabetes and psychiatric disorders. Indian J. Endocrinol. Metab. 2011, 15, 274–283. [Google Scholar] [CrossRef] [PubMed]
- Prasad, S.; Sajja, R.K.; Naik, P.; Cucullo, L. Diabetes mellitus and blood-brain barrier dysfunction: An overview. J. Pharmacovigil. 2014, 2, 1000125. [Google Scholar]
- Moretti, R.; Pansiot, J.; Bettati, D.; Strazielle, N.; Ghersi-Egea, J.-F.; Damante, G.; Fleiss, B.; Titomanlio, L.; Gressens, P. Blood-brain barrier dysfunction in disorders of the developing brain. Front. Neurosci. 2015, 9, 40. [Google Scholar] [CrossRef] [PubMed]
- Kealy, J.; Greene, C.; Campbell, M. Blood-brain barrier regulation in psychiatric disorders. Neurosci. Lett. 2018, 726, 133664. [Google Scholar] [CrossRef] [PubMed]
- Gal, Z.; Huse, R.; Gonda, X.; Kumar, S.; Juhasz, G.; Bagdy, G.; Petschner, P. Anxiety and depression-the role of blood-brain barrier integrity. Neuropsychopharmacol. Hung. Magy. Pszichofarmakologiai Egyes. Lapja = Off. J. Hung. Assoc. Psychopharmacol. 2019, 21, 19–25. [Google Scholar]
- Cai, Z.; Qiao, P.-F.; Wan, C.-Q.; Cai, M.; Zhou, N.-K.; Li, Q. Role of blood-brain barrier in Alzheimer’s disease. J. Alzheimer’s Dis. 2018, 63, 1223–1234. [Google Scholar] [CrossRef]
- Daneman, R. The blood–brain barrier in health and disease. Ann. Neurol. 2012, 72, 648–672. [Google Scholar] [CrossRef] [PubMed]
- Keaney, J.; Campbell, M. The dynamic blood–brain barrier. FEBS J. 2015, 282, 4067–4079. [Google Scholar] [CrossRef] [PubMed]
- Haorah, J.; Ramirez, S.H.; Schall, K.; Smith, D.; Pandya, R.; Persidsky, Y. Oxidative stress activates protein tyrosine kinase and matrix metalloproteinases leading to blood–brain barrier dysfunction. J. Neurochem. 2007, 101, 566–576. [Google Scholar] [CrossRef] [PubMed]
- Song, K.; Li, Y.; Zhang, H.; An, N.; Wei, Y.; Wang, L.; Tian, C.; Yuan, M.; Sun, Y.; Xing, Y.; et al. Oxidative Stress-Mediated Blood-Brain Barrier (BBB) Disruption in Neurological Diseases. Oxidative Med. Cell. Longev. 2020, 2020, 4356386. [Google Scholar] [CrossRef]
- Erdő, F.; Denes, L.; de Lange, E. Age-associated physiological and pathological changes at the blood–brain barrier: A review. J. Cereb. Blood Flow Metab. 2017, 37, 4–24. [Google Scholar] [CrossRef]
- Wang, B.; Charukeshi Chandrasekera, P.; J Pippin, J. Leptin-and leptin receptor-deficient rodent models: Relevance for human type 2 diabetes. Curr. Diabetes Rev. 2014, 10, 131–145. [Google Scholar] [CrossRef] [PubMed]
- Park, H.K.; Ahima, R.S. Leptin signaling. F1000Prime Rep. 2014, 6, 73. [Google Scholar] [CrossRef] [PubMed]
- Cordeiro, R.C.; Chaves Filho, A.J.M.; Gomes, N.S.; Tomaz, V.S.; Medeiros, C.D.; Queiroz, A.I.G.; Maes, M.; Macedo, D.S.; Carvalho, A.F. Leptin Prevents Lipopolysaccharide-Induced Depressive-like Behaviors in Mice: Involvement of Dopamine Receptors. Front. Psychiatry 2019, 10, 125. [Google Scholar] [CrossRef]
- Kimura, I.; Dohgu, S.; Takata, F.; Matsumoto, J.; Kawahara, Y.; Nishihira, M.; Sakada, S.; Saisho, T.; Yamauchi, A.; Kataoka, Y. Activation of the α7 nicotinic acetylcholine receptor upregulates blood-brain barrier function through increased claudin-5 and occludin expression in rat brain endothelial cells. Neurosci. Lett. 2019, 694, 9–13. [Google Scholar] [CrossRef]
- Liu, J.; Jin, X.; Liu, K.J.; Liu, W. Matrix Metalloproteinase-2-Mediated Occludin Degradation and Caveolin-1-Mediated Claudin-5 Redistribution Contribute to Blood–Brain Barrier Damage in Early Ischemic Stroke Stage. J. Neurosci. 2012, 32, 3044–3057. [Google Scholar] [CrossRef]
- Solár, P.; Zamani, A.; Lakatosová, K.; Joukal, M. The blood–brain barrier and the neurovascular unit in subarachnoid hemorrhage: Molecular events and potential treatments. Fluids Barriers CNS 2022, 19, 29. [Google Scholar] [CrossRef]
- Corem, N.; Anzi, S.; Gelb, S.; Ben-Zvi, A. Leptin receptor deficiency induces early, transient and hyperglycaemia-independent blood-brain barrier dysfunction. Sci. Rep. 2019, 9, 2884. [Google Scholar] [CrossRef] [PubMed]
- Rom, S.; Zuluaga-Ramirez, V.; Gajghate, S.; Seliga, A.; Winfield, M.; Heldt, N.A.; Kolpakov, M.A.; Bashkirova, Y.V.; Sabri, A.K.; Persidsky, Y. Hyperglycemia-Driven Neuroinflammation Compromises BBB Leading to Memory Loss in Both Diabetes Mellitus (DM) Type 1 and Type 2 Mouse Models. Mol. Neurobiol. 2019, 56, 1883–1896. [Google Scholar] [CrossRef]
- Wang, Z.; Tang, X.; Swaminathan, S.K.; Kandimalla, K.K.; Kalari, K.R. Mapping the dynamics of insulin-responsive pathways in the blood–brain barrier endothelium using time-series transcriptomics data. NPJ Syst. Biol. Appl. 2022, 8, 29. [Google Scholar] [CrossRef]
- Yagihashi, S.; Mizukami, H.; Sugimoto, K. Mechanism of diabetic neuropathy: Where are we now and where to go? J. Diabetes Investig. 2011, 2, 18–32. [Google Scholar] [CrossRef] [PubMed]
- Norman, M.U.; James, W.G.; Hickey, M.J. Differential roles of ICAM-1 and VCAM-1 in leukocyte-endothelial cell interactions in skin and brain of MRL/faslpr mice. J. Leukoc. Biol. 2008, 84, 68–76. [Google Scholar] [CrossRef]
- Miguel-Hidalgo, J.J.; Nithuairisg, S.; Stockmeier, C.; Rajkowska, G. Distribution of ICAM-1 immunoreactivity during aging in the human orbitofrontal cortex. Brain Behav. Immun. 2007, 21, 100–111. [Google Scholar] [CrossRef] [PubMed]
- Pietersma, A.; Tilly, B.C.; Gaestel, M.; de Jong, N.; Lee, J.C.; Koster, J.F.; Sluiter, W. P38 Mitogen Activated Protein Kinase Regulates Endothelial VCAM-1 Expression at the Post-transcriptional Level. Biochem. Biophys. Res. Commun. 1997, 230, 44–48. [Google Scholar] [CrossRef]
- Saunders, N.R.; Dreifuss, J.-J.; Dziegielewska, K.M.; Johansson, P.A.; Habgood, M.D.; Møllgård, K.; Bauer, H.-C. The rights and wrongs of blood-brain barrier permeability studies: A walk through 100 years of history. Front. Neurosci. 2014, 8, 404. [Google Scholar] [CrossRef]
- Gonçalves, C.A.; Leite, M.C.; Guerra, M.C. Adipocytes as an Important Source of Serum S100B and Possible Roles of This Protein in Adipose Tissue. Cardiovasc. Psychiatry Neurol. 2010, 2010, 790431. [Google Scholar] [CrossRef][Green Version]
- Fujiya, A.; Nagasaki, H.; Seino, Y.; Okawa, T.; Kato, J.; Fukami, A.; Himeno, T.; Uenishi, E.; Tsunekawa, S.; Kamiya, H.; et al. The role of S100B in the interaction between adipocytes and macrophages. Obesity 2014, 22, 371–379. [Google Scholar] [CrossRef]
- Lotfy, M.; Adeghate, J.; Kalasz, H.; Singh, J.; Adeghate, E. Chronic complications of diabetes mellitus: A mini review. Curr. Diabetes Rev. 2017, 13, 3–10. [Google Scholar] [CrossRef]
- Wang, W.; Lo, A.C. Diabetic retinopathy: Pathophysiology and treatments. Int. J. Mol. Sci. 2018, 19, 1816. [Google Scholar] [CrossRef]
- Dronavalli, S.; Duka, I.; Bakris, L. The Pathogenesis of Diabetic Nephropathy. Nat. Clin. Pract. 2008, 4, 444–452. [Google Scholar] [CrossRef]
- Kraemer, F.B.; Takeda, D.; Natu, V.; Sztalryd, C. Insulin regulates lipoprotein lipase activity in rat adipose cells via wortmannin-and rapamycin-sensitive pathways. Metabolism 1998, 47, 555–559. [Google Scholar] [CrossRef] [PubMed]
- Zimmer, D.B.; Chessher, J.; Wilson, G.L.; Zimmer, W.E. S100A1 and S100B expression and target proteins in type I diabetes. Endocrinology 1997, 138, 5176–5183. [Google Scholar] [CrossRef] [PubMed]
- Kubis-Kubiak, A.; Wiatrak, B.; Piwowar, A. The Impact of High Glucose or Insulin Exposure on S100B Protein Levels, Oxidative and Nitrosative Stress and DNA Damage in Neuron-Like Cells. Int. J. Mol. Sci. 2021, 22, 5526. [Google Scholar] [CrossRef] [PubMed]
- Elahy, M.; Jackaman, C.; Mamo, J.C.L.; Lam, V.; Dhaliwal, S.S.; Giles, C.; Nelson, D.; Takechi, R. Blood–brain barrier dysfunction developed during normal aging is associated with inflammation and loss of tight junctions but not with leukocyte recruitment. Immun. Ageing 2015, 12, 2. [Google Scholar] [CrossRef]
- Stranahan, A.M.; Hao, S.; Dey, A.; Yu, X.; Baban, B. Blood–brain barrier breakdown promotes macrophage infiltration and cognitive impairment in leptin receptor-deficient mice. J. Cereb. Blood Flow Metab. 2016, 36, 2108–2121. [Google Scholar] [CrossRef]
- Prakash, R.; Johnson, M.; Fagan, S.C.; Ergul, A. Cerebral Neovascularization and Remodeling Patterns in Two Different Models of Type 2 Diabetes. PLoS ONE 2013, 8, e56264. [Google Scholar] [CrossRef]
- Chapouly, C.; Yao, Q.; Vandierdonck, S.; Larrieu-Lahargue, F.; Mariani, J.N.; Gadeau, A.-P.; Renault, M.-A. Impaired Hedgehog signalling-induced endothelial dysfunction is sufficient to induce neuropathy: Implication in diabetes. Cardiovasc. Res. 2015, 109, 217–227. [Google Scholar] [CrossRef] [PubMed]
- Kastin, A.J.; Pan, W. Dynamic regulation of leptin entry into brain by the blood–brain barrier. Regul. Pept. 2000, 92, 37–43. [Google Scholar] [CrossRef] [PubMed]
- Bjørbæk, C.; Elmquist, J.K.; Michl, P.; Ahima, R.S.; van Bueren, A.; McCall, A.L.; Flier, J.S. Expression of Leptin Receptor Isoforms in Rat Brain Microvessels. Endocrinology 1998, 139, 3485–3491. [Google Scholar] [CrossRef] [PubMed]
- Merino, B.; Díez-Fernández, C.; Ruiz-Gayo, M.; Somoza, B. Choroid plexus epithelial cells co-express the long and short form of the leptin receptor. Neurosci. Lett. 2006, 393, 269–272. [Google Scholar] [CrossRef] [PubMed]
- Zehendner, C.M.; Librizzi, L.; de Curtis, M.; Kuhlmann, C.R.W.; Luhmann, H.J. Caspase-3 Contributes to ZO-1 and Cl-5 Tight-Junction Disruption in Rapid Anoxic Neurovascular Unit Damage. PLoS ONE 2011, 6, e16760. [Google Scholar] [CrossRef] [PubMed]
- Gray, K.M.; Katz, D.B.; Brown, E.G.; Stroka, K.M. Quantitative Phenotyping of Cell–Cell Junctions to Evaluate ZO-1 Presentation in Brain Endothelial Cells. Ann. Biomed. Eng. 2019, 47, 1675–1687. [Google Scholar] [CrossRef] [PubMed]
- Li, J.; Cong, X.; Zhang, Y.; Xiang, R.L.; Mei, M.; Yang, N.Y.; Su, Y.C.; Choi, S.; Park, K.; Zhang, L.W.; et al. ZO-1 and -2 Are Required for TRPV1-Modulated Paracellular Permeability. J. Dent. Res. 2015, 94, 1748–1756. [Google Scholar] [CrossRef] [PubMed]
- Sjöstedt, E.; Zhong, W.; Fagerberg, L.; Karlsson, M.; Mitsios, N.; Adori, C.; Oksvold, P.; Edfors, F.; Limiszewska, A.; Hikmet, F.; et al. An atlas of the protein-coding genes in the human, pig, and mouse brain. Science 2020, 367, eaay5947. [Google Scholar] [CrossRef]
- Jiao, H.; Wang, Z.; Liu, Y.; Wang, P.; Xue, Y. Specific Role of Tight Junction Proteins Claudin-5, Occludin, and ZO-1 of the Blood–Brain Barrier in a Focal Cerebral Ischemic Insult. J. Mol. Neurosci. 2011, 44, 130–139. [Google Scholar] [CrossRef]
- Lv, J.; Hu, W.; Yang, Z.; Li, T.; Jiang, S.; Ma, Z.; Chen, F.; Yang, Y. Focusing on claudin-5: A promising candidate in the regulation of BBB to treat ischemic stroke. Prog. Neurobiol. 2018, 161, 79–96. [Google Scholar] [CrossRef]
- Jia, W.; Lu, R.; Martin, T.A.; Jiang, W.G. The role of claudin-5 in blood-brain barrier (BBB) and brain metastases (Review). Mol. Med. Rep. 2014, 9, 779–785. [Google Scholar] [CrossRef] [PubMed]
- Greene, C.; Hanley, N.; Campbell, M. Claudin-5: Gatekeeper of neurological function. Fluids Barriers CNS 2019, 16, 3. [Google Scholar] [CrossRef] [PubMed]
- Koussounadis, A.; Langdon, S.P.; Um, I.H.; Harrison, D.J.; Smith, V.A. Relationship between differentially expressed mRNA and mRNA-protein correlations in a xenograft model system. Sci. Rep. 2015, 5, 10775. [Google Scholar] [CrossRef] [PubMed]
- Taylor, R.C.; Webb Robertson, B.-J.M.; Markillie, L.M.; Serres, M.H.; Linggi, B.E.; Aldrich, J.T.; Hill, E.A.; Romine, M.F.; Lipton, M.S.; Wiley, H.S. Changes in translational efficiency is a dominant regulatory mechanism in the environmental response of bacteria. Integr. Biol. 2013, 5, 1393–1406. [Google Scholar] [CrossRef] [PubMed]
- Chua, S.C.; Chung, W.K.; Wu-Peng, X.S.; Zhang, Y.; Liu, S.-M.; Tartaglia, L.; Leibel, R.L. Phenotypes of Mouse diabetes and Rat fatty Due to Mutations in the OB (Leptin) Receptor. Science 1996, 271, 994–996. [Google Scholar] [CrossRef] [PubMed]
- Alshammari, M.A.; Khan, M.R.; Majid Mahmood, H.; Alshehri, A.O.; Alasmari, F.F.; Alqahtani, F.M.; Alasmari, A.F.; Alsharari, S.D.; Alhossan, A.; Ahmad, S.F.; et al. Systemic TNF-α blockade attenuates anxiety and depressive-like behaviors in db/db mice through downregulation of inflammatory signaling in peripheral immune cells. Saudi Pharm. J. 2020, 28, 621–629. [Google Scholar] [CrossRef] [PubMed]
- Platt, T.L.; Beckett, T.L.; Kohler, K.; Niedowicz, D.M.; Murphy, M.P. Obesity, diabetes, and leptin resistance promote tau pathology in a mouse model of disease. Neuroscience 2016, 315, 162–174. [Google Scholar] [CrossRef] [PubMed]
- Pollock, K.E.; Stevens, D.; Pennington, K.A.; Thaisrivongs, R.; Kaiser, J.; Ellersieck, M.R.; Miller, D.K.; Schulz, L.C. Hyperleptinemia During Pregnancy Decreases Adult Weight of Offspring and Is Associated With Increased Offspring Locomotor Activity in Mice. Endocrinology 2015, 156, 3777–3790. [Google Scholar] [CrossRef] [PubMed]
- Pacini, G.; Omar, B.; Ahrén, B. Methods and models for metabolic assessment in mice. J. Diabetes Res. 2013, 2013, 986906. [Google Scholar] [CrossRef]
- Alshammari, M.A.; Alshammari, T.K.; Nenov, M.N.; Scala, F.; Laezza, F. Fibroblast growth factor 14 modulates the neurogenesis of granule neurons in the adult dentate gyrus. Mol. Neurobiol. 2016, 53, 7254–7270. [Google Scholar] [CrossRef]
- Burke, L.M.; Ross, M.L.; Garvican-Lewis, L.A.; Welvaert, M.; Heikura, I.A.; Forbes, S.G.; Mirtschin, J.G.; Cato, L.E.; Strobel, N.; Sharma, A.P.; et al. Low carbohydrate, high fat diet impairs exercise economy and negates the performance benefit from intensified training in elite race walkers. J. Physiol. 2017, 595, 2785–2807. [Google Scholar] [CrossRef] [PubMed]
- Kozler, P.; Pokorny, J. Altered blood-brain barrier permeability and its effect on the distribution of Evans blue and sodium fluorescein in the rat brain applied by intracarotid injection. Physiol. Res. 2003, 52, 607–614. [Google Scholar] [CrossRef] [PubMed]
- Ohno, K.; Pettigrew, K.; Rapoport, S. Lower limits of cerebrovascular permeability to nonelectrolytes in the conscious rat. Am. J. Physiol.-Heart Circ. Physiol. 1978, 235, H299–H307. [Google Scholar] [CrossRef] [PubMed]
- Baba, M.; Oishi, R.; Saeki, K. Enhancement of blood-brain barrier permeability to sodium fluorescein by stimulation of µ opioid receptors in mice. Naunyn-Schmiedeberg’s Arch. Pharmacol. 1988, 337, 423–428. [Google Scholar] [CrossRef] [PubMed]
- Chen, S.; Nakamura, H.; Tamura, Z. Studies on the metabolites of fluorescein in rabbit and human urine. Chem. Pharm. Bull. 1980, 28, 1403–1407. [Google Scholar] [CrossRef] [PubMed]
- Bickel, U. How to measure drug transport across the blood-brain barrier. NeuroRX 2005, 2, 15–26. [Google Scholar] [CrossRef] [PubMed]
- Livak, K.J.; Schmittgen, T.D. Analysis of relative gene expression data using real-time quantitative PCR and the 2−ΔΔCT method. Methods 2001, 25, 402–408. [Google Scholar] [CrossRef] [PubMed]
- Plows, J.F.; Stanley, J.L.; Baker, P.N.; Reynolds, C.M.; Vickers, M.H. The pathophysiology of gestational diabetes mellitus. Int. J. Mol. Sci. 2018, 19, 3342. [Google Scholar] [CrossRef]
- Alshammari, M.A.; Khan, M.R.; Alasmari, F.; Alshehri, A.O.; Ali, R.; Boudjelal, M.; Alhosaini, K.A.; Niazy, A.A.; Alshammari, T.K. Changes in the Fluorescence Tracking of NaV1.6 Protein Expression in a BTBR T+Itpr3tf/J Autistic Mouse Model. Neural Plast. 2019, 2019, 4893103. [Google Scholar] [CrossRef]


Disclaimer/Publisher’s Note: The statements, opinions and data contained in all publications are solely those of the individual author(s) and contributor(s) and not of MDPI and/or the editor(s). MDPI and/or the editor(s) disclaim responsibility for any injury to people or property resulting from any ideas, methods, instructions or products referred to in the content. |
© 2024 by the authors. Licensee MDPI, Basel, Switzerland. This article is an open access article distributed under the terms and conditions of the Creative Commons Attribution (CC BY) license (https://creativecommons.org/licenses/by/4.0/).