

The Role of Changes in the Expression of Inflammation-Associated Genes in the Variants of Cerebral Small Vessel Disease

 , , , , ,
Abstract
:1. Introduction
2. Results
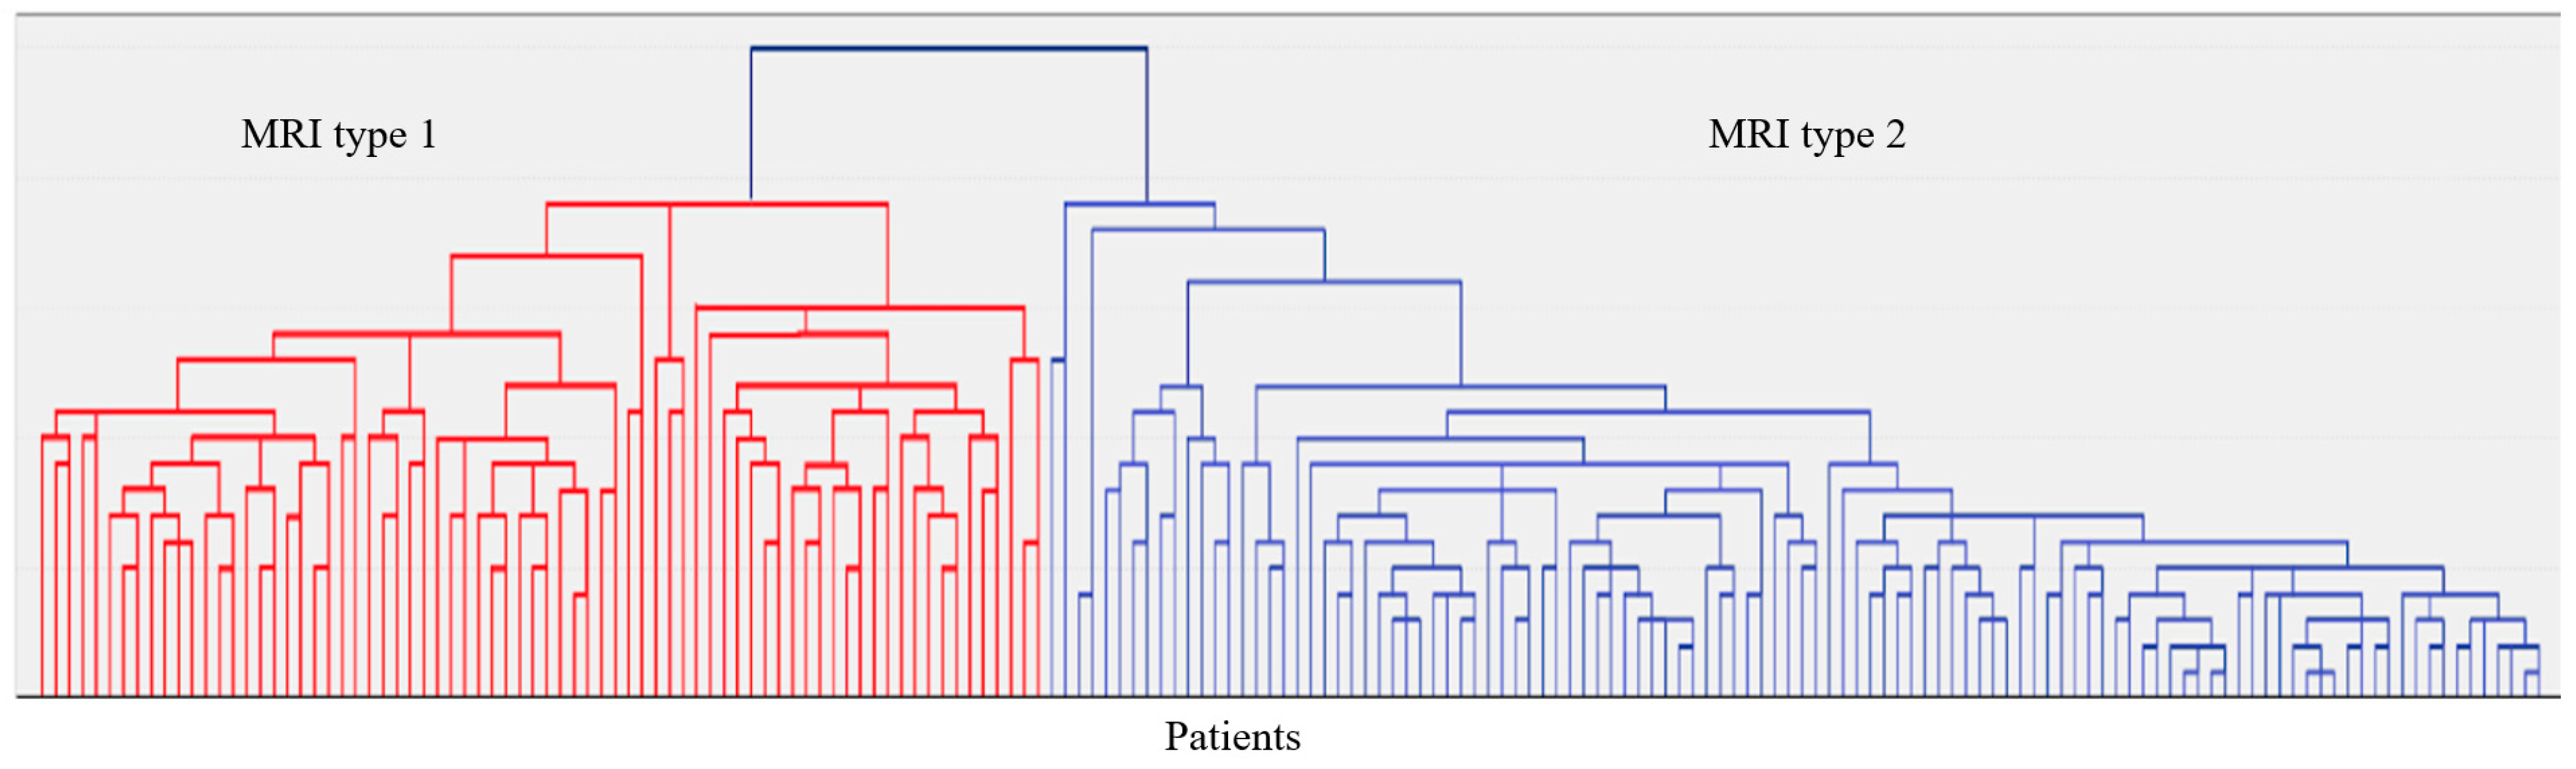
2.1. Clinical and Neuroimaging Characteristics of Two MRI Types of CSVD
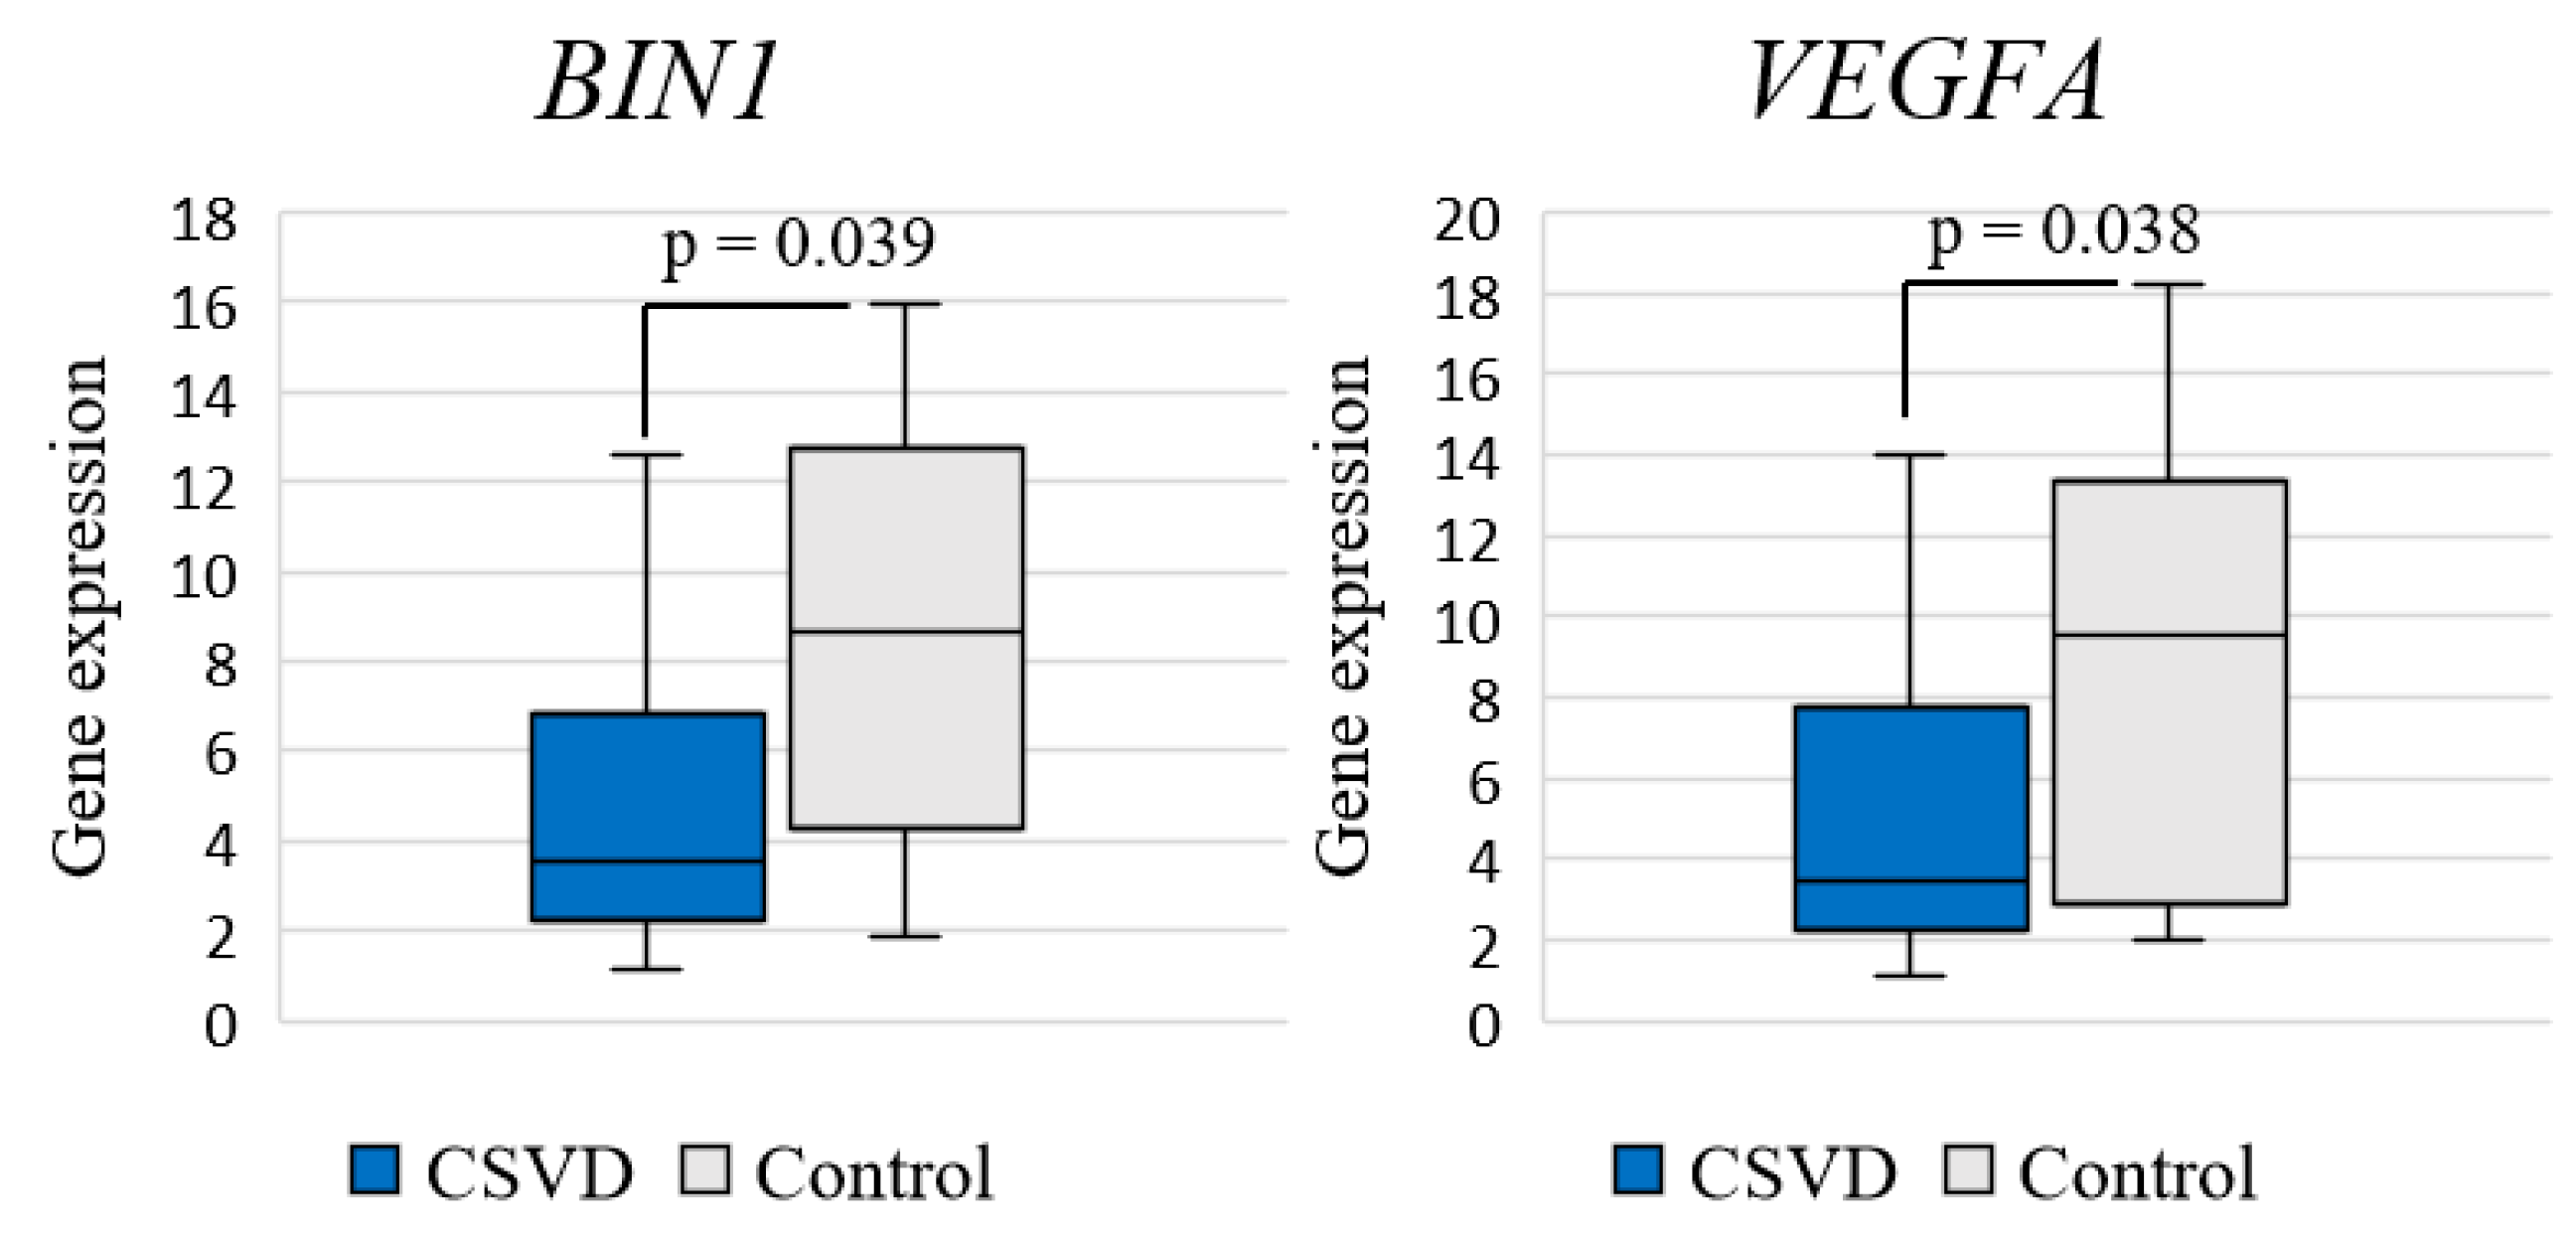
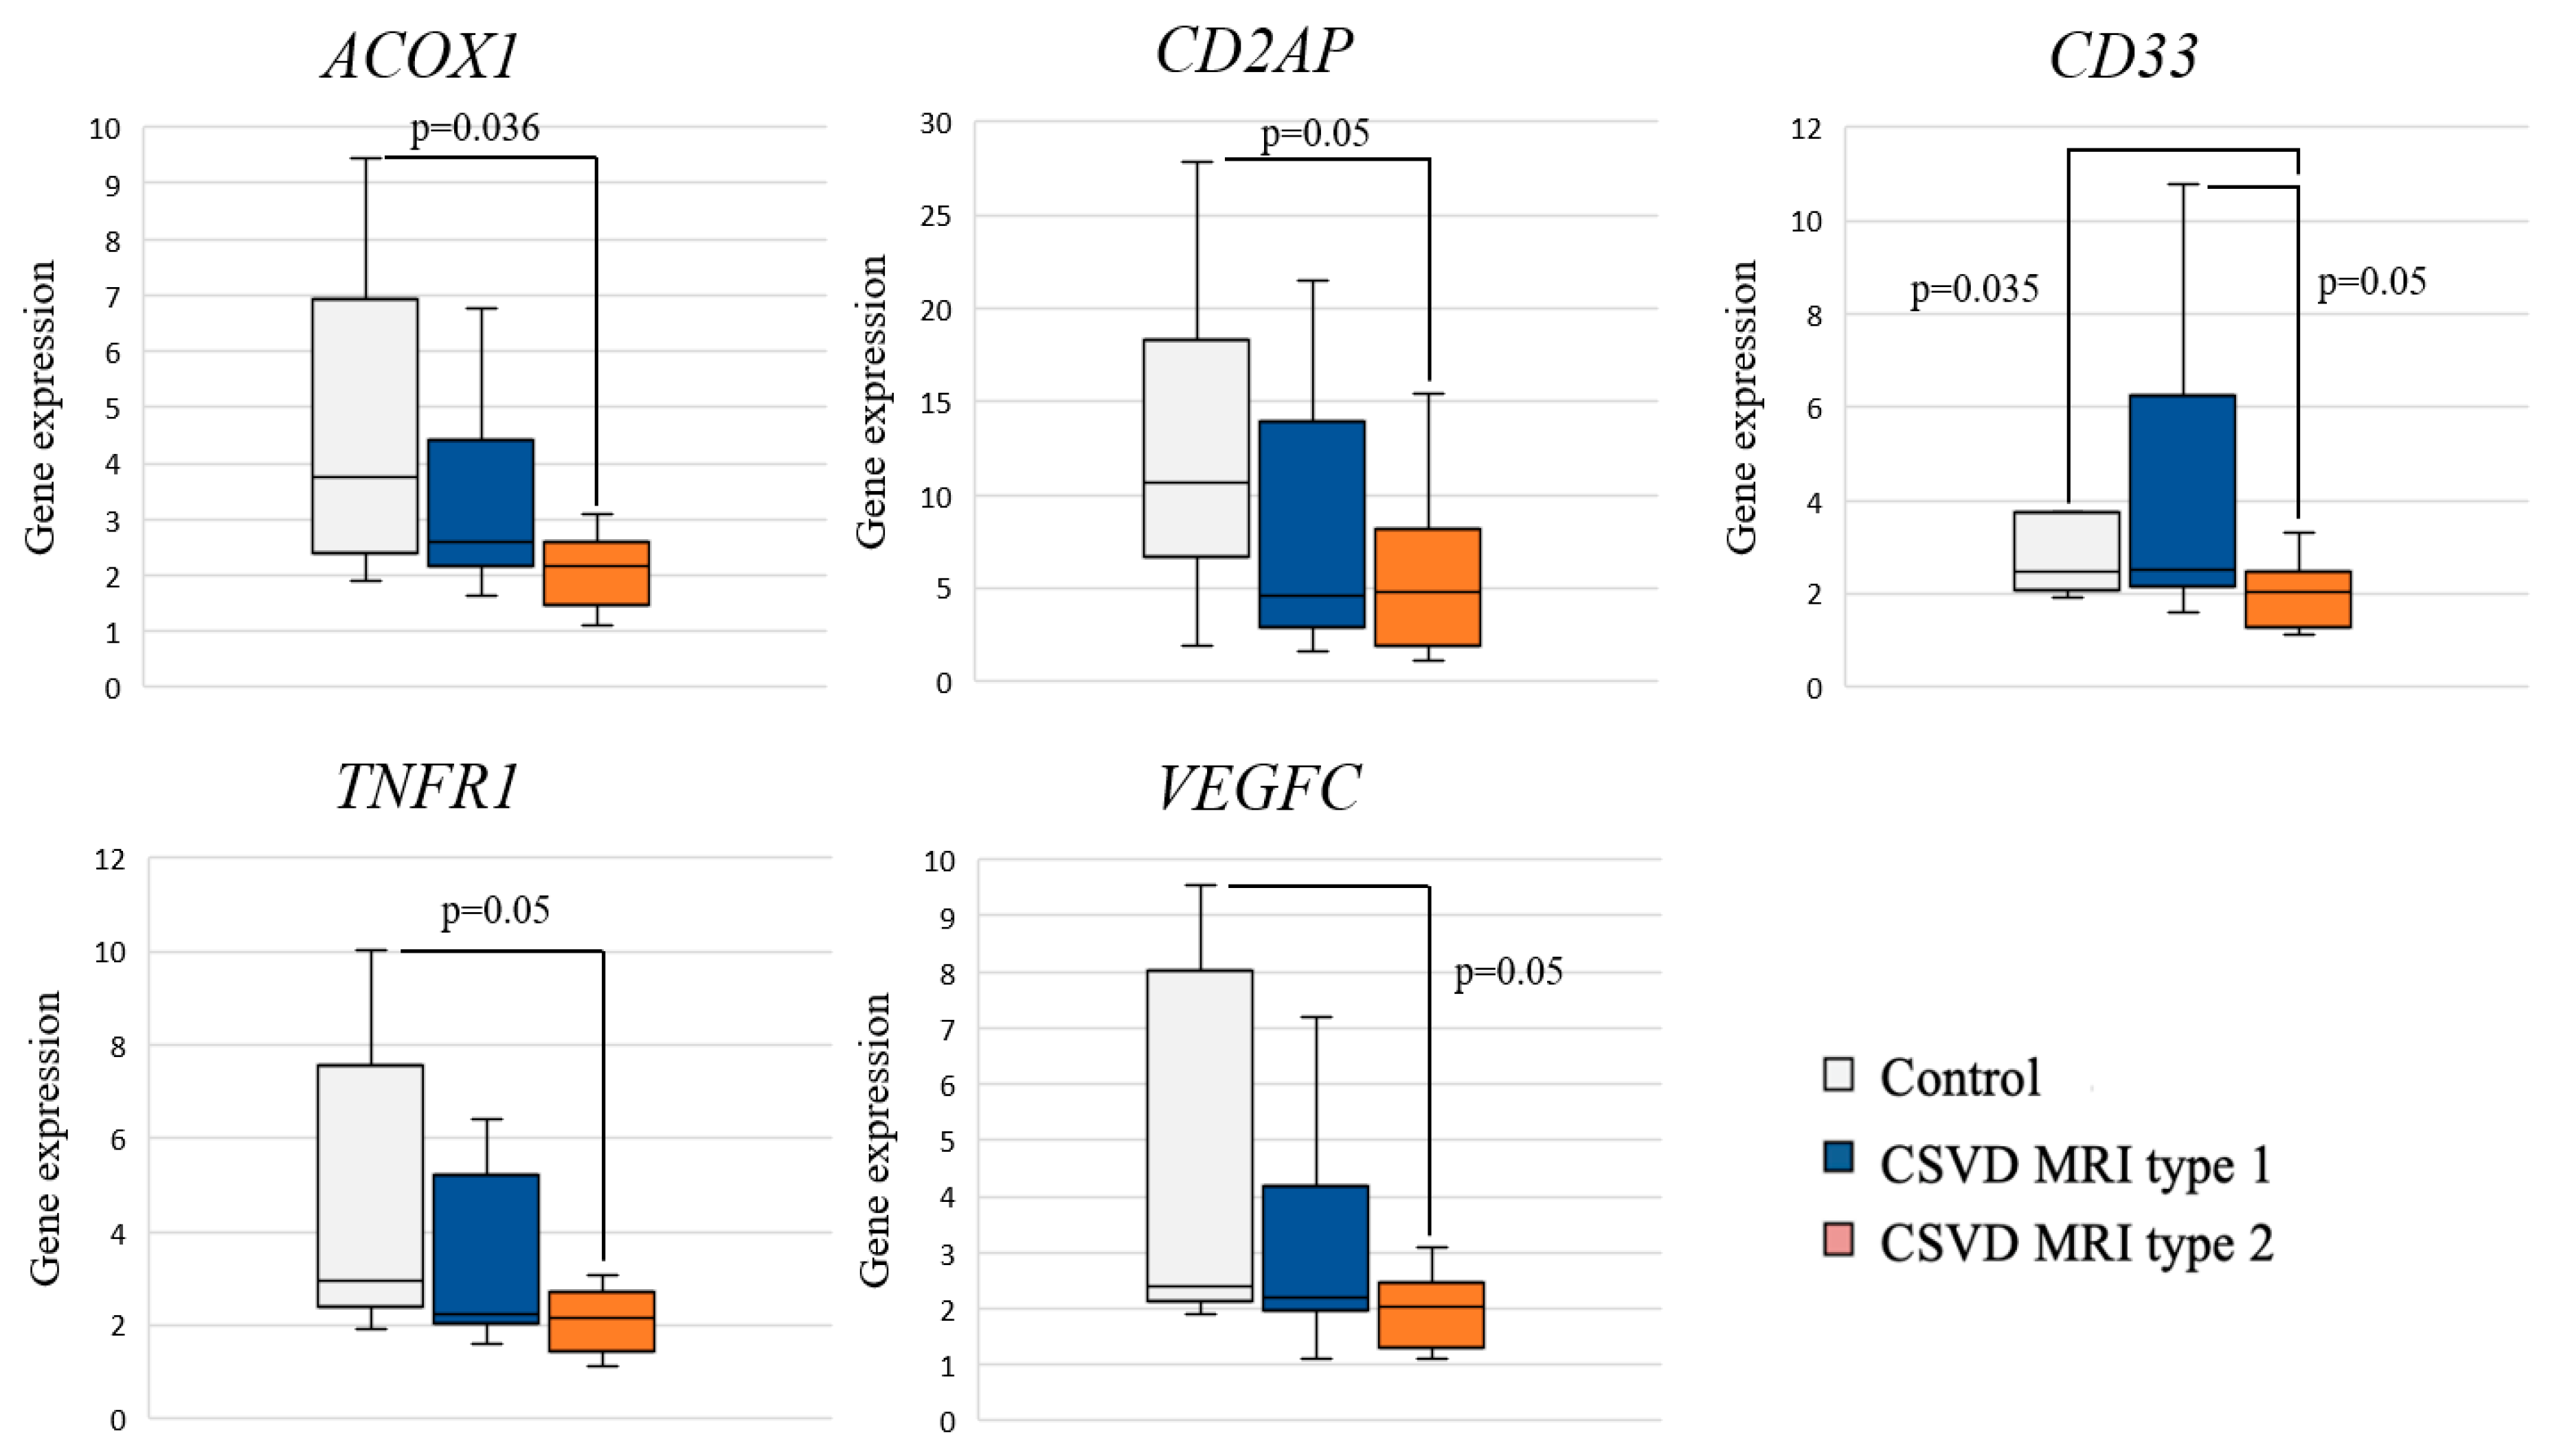
2.2. Expression of Inflammation-Associated Genes: CSVD Group vs. Control and MRI Types 1 and 2 CSVD vs. Control
2.3. Comparative Analysis of Gene Expression with Cognitive Impairment
3. Materials and Methods
3.1. Selection of Study Participants
3.2. Clinical and Neuroimaging Examination
3.3. Molecular Genetic Testing
3.4. Statistical Processing
4. Discussion
5. Conclusions
Author Contributions
Funding
Institutional Review Board Statement
Informed Consent Statement
Data Availability Statement
Conflicts of Interest
Appendix A

| F3 MRI Type 1 | F3 MRI Type 2 |
|---|---|
| Neuroimaging characteristics | |
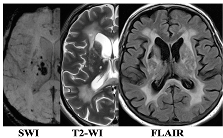 | 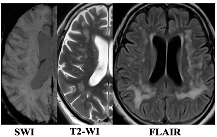 |
| WMH: more pronounced in the periventricular and deep regions of the cerebral hemispheres, subcortical structures, external capsule, brainstem, and cerebellum | WMH: periventricular—in the posterior cerebral hemispheres, deep—in the frontal and parietal lobes |
| Lacunes: multiple in subcortical structures and cerebral white matter | Lacunes: single in the white matter of the cerebral hemispheres |
| CMB: juxtacortical CMHs in all regions of the cerebral hemispheres, in subcortical structures | CMB: single juxtacortical CMHs in the white matter of the temporal and parietal lobes |
| Cerebral atrophy: more pronounced | Cerebral atrophy: less pronounced |
| Enlarged PVS: pronounced in subcortical structures | Enlarged PVS: extended |
| Clinical characteristics | |
| Cognitive impairment: more pronounced (MCI and dementia) | Cognitive impairment: less pronounced (SubCI and MCI) |
| Gait disorders: more pronounced | Gait disorders: less pronounced |
| Laboratory testing | |
| Reduced VEGF-A | Increased TNF-α |
Appendix B
| No. | Gene | Protein |
|---|---|---|
| GWAS in CSVD | ||
| 1 | ACOX1 | acyl-CoA oxidase 1 |
| 2 | FBN2 | fibrillin 2 |
| 3 | APOE | apolipoprotein E |
| 4 | LINC00539 | long intergenic non-protein coding RNA 539 |
| 5 | COL4A2 | collagen type IV alpha 2 chain |
| 6 | FBF1 | Fas binding factor 1 |
| 7 | MRPL38 | mitochondrial ribosomal protein L38 |
| 8 | NOS3 | nitric oxide synthase 3 |
| 9 | PMF1 | polyamine modulated factor 1 |
| 10 | SLC25A44 | solute carrier family 25 member 44 |
| 11 | TRIM65 | tripartite motif containing 65 |
| 12 | TRIM47 | tripartite motif containing 47 |
| 13 | WBP2 | WW domain binding protein 2 |
| 14 | PLEKHG1 | pleckstrin homology and RhoGEF domain containing G1 |
| 15 | CST3 | cystatin C |
| 16 | FRMD1 | FERM domain containing 1 |
| GWAS in AD | ||
| 17 | BIN1 | bridging integrator 1 |
| 18 | CD33 | CD33 molecule |
| 19 | CD2AP | CD2-associated protein |
| 20 | ABCA7 | ATP binding cassette subfamily A member 7 |
| 21 | CH25H | cholesterol 25-hydroxylase |
| 22 | CLU | clusterin |
| 23 | CR1 | complement receptor 1 |
| 24 | EPHA1 | EPH receptor A1 |
| 25 | PICALM | phosphatidylinositol binding clathrin assembly protein |
| 26 | MS4A6A | membrane spanning 4-domains A6A |
| 27 | SORL1 | Sortilin-related receptor 1 |
| 28 | TREM2 | triggering receptor expressed on myeloid cells 2 |
| Hypertension risk genes | ||
| 29 | AGT | angiotensinogen |
| 30 | ACE | angiotensin converting enzyme |
| 31 | CYP11B2 | cytochrome P450 family 11 subfamily B member 2 |
| 32 | AGTR1 | angiotensin II receptor type 1 |
| 33 | NPPB | natriuretic peptide B |
| Circulating blood markers in CSVD: Functioning of the BBB | ||
| 34 | AQP1 | aquaporin 1 |
| 35 | CA4 | carbonic anhydrase 4 |
| 36 | CLDN5 | claudin 5 |
| 37 | MMP2 | matrix metallopeptidase 2 |
| 38 | MMP3 | matrix metallopeptidase 3 |
| 39 | MMP9 | matrix metallopeptidase 9 |
| Circulating blood markers in CSVD: Systemic inflammation | ||
| 40 | CRP | C-reactive protein |
| 41 | FGB | fibrinogen beta chain |
| 42 | FGA | fibrinogen alpha chain |
| 43 | FGG | fibrinogen gamma chain |
| 44 | IL1 | interleukin-1 |
| 45 | IL1B | interleukin-1B |
| 46 | IL6 | interleukin-6 |
| 47 | TNF | tumor necrosis factor |
| 48 | TNFR1 | TNF receptor superfamily member 1A |
| 49 | TNFR2 | TNF receptor superfamily member 1B |
| Circulating blood markers in CSVD: Local inflammation/endothelial dysfunction | ||
| 50 | VCAM1 | vascular cell adhesion molecule 1 |
| 51 | ICAM1 | intercellular adhesion molecule 1 |
| 52 | MTHFR | methylenetetrahydrofolate reductase |
| 53 | PSEL | selectin P |
| 54 | PLAT | tissue-type plasminogen activator |
| Circulating blood markers in CSVD: Trophic factors | ||
| 55 | BDNF | Brain-derived neurotrophic factor |
| 56 | TGFB1 | transforming growth factor beta 1 |
| 57 | VEGFA | vascular endothelial growth factor A |
| 58 | VEGFC | vascular endothelial growth factor C |
| Reference genes | ||
| 59 | AARS | alanyl-tRNA synthetase |
| 60 | ASB7 | ankyrin repeat and SOCS box containing 7 |
| 61 | CCDC127 | coiled-coil domain containing 127 |
| 62 | CNOT10 | CCR4-NOT transcription complex subunit 10 |
Appendix C
| Oligonucleotide | Oligonucleotide Sequence | Label, 5′ | Label, 3′ |
|---|---|---|---|
| 5′ → 3′ | |||
| AARS1 | F: GATTACTTTAAGGAATTGGCATGTAA | ||
| R: CAATGGGAATGCCAAACTCT | |||
| P: GGCTCTGGAACTCCTCACCC | FAM | BHQ1 | |
| ASB7 | F: GCATCGTCTGTAAAGGTTAAGAAG | ||
| R: GGGAGGGGCTTCAAAGTA | |||
| P: TTTTTGCTCTGTAGCCTGGACG | FAM | BHQ1 | |
| ACOX1 | F: CTGGTGGGCTTGGAAAGA | ||
| R: TTTCCCCTTAGTGATGAGCTG | |||
| P: TTCAAATCATGCAATAGTTCTTGCC | FAM | BHQ1 | |
| BIN1 | F: TCCGTCAAAGCCATGCAC | ||
| R: CCAATCGGGCTCATACACCT | |||
| P: GAGGCTTCCAAGAAGCTGAATGA | FAM | BHQ1 | |
| CD2AP | F: AGGACGATTCAGAAACTGTTTTG | ||
| R: CCAGATGCAGTTTCACTCACA | |||
| P: GCTGGGCCTACTTCACCTATACC | FAM | BHQ1 | |
| TNFR1 | F: CCTGAAAAAGAGGGGGAGCT | ||
| R: GTGAAGCCTGGAGTGGGACT | |||
| P: CTACTAAGCCCCTGGCCCCA | FAM | BHQ1 | |
| VEGFA | F: GAATCATCACGAAGTGGTGAAG | ||
| R: AAGATGTCCACCAGGGTCTC | |||
| P: TCAGCGCAGCTACTGCCATC | FAM | BHQ1 |
References
- Pantoni, L. Cerebral small vessel disease: From pathogenesis and clinical characteristics to therapeutic challenges. Lancet Neurol. 2010, 9, 689–701. [Google Scholar] [CrossRef] [PubMed]
- Gorelick, P.B.; Scuteri, A.; Black, S.E.; DeCarli, C.; Greenberg, S.M.; Iadecola, C.; Launer, L.J.; Laurent, S.; Lopez, O.L.; Nyenhuis, D.; et al. Vascular contributions to cognitive impairment and dementia: A statement for healthcare professionals from the american heart association/american stroke association. Stroke 2011, 42, 2672–2713. [Google Scholar] [CrossRef] [PubMed]
- Bos, D.; Wolters, F.J.; Darweesh, S.K.; Vernooij, M.W.; de Wolf, F.; Ikram, M.A.; Hofman, A. Cerebral small vessel disease and the risk of dementia: A systematic review and meta-analysis of population-based evidence. Alzheimers Dement. 2018, 14, 1482–1492. [Google Scholar] [CrossRef] [PubMed]
- Hachinski, V.; Einhäupl, K.; Ganten, D.; Alladi, S.; Brayne, C.; Stephan, B.C.; Sweeney, M.D.; Zlokovic, B.; Iturria-Medina, Y.; Iadecola, C.; et al. Preventing dementia by preventing stroke: The Berlin Manifesto. Alzheimers Dement. 2019, 15, 961–984. [Google Scholar] [CrossRef] [PubMed]
- Wardlaw, J.M.; Smith, C.; Dichgans, M. Small vessel disease: Mechanisms and clinical implications. Lancet Neurol. 2019, 18, 684–696. [Google Scholar] [CrossRef] [PubMed]
- Santisteban, M.M.; Iadecola, C. Hypertension, dietary salt and cognitive impairment. J. Cereb. Blood Flow Metab. 2018, 38, 2112–2128. [Google Scholar] [CrossRef] [PubMed]
- Pasi, M.; Cordonnier, C. Clinical Relevance of Cerebral Small Vessel Diseases. Stroke 2020, 51, 47–53. [Google Scholar] [CrossRef] [PubMed]
- Moretti, R.; Caruso, P. Small Vessel Disease: Ancient Description, Novel Biomarkers. Int. J. Mol. Sci. 2022, 23, 3508. [Google Scholar] [CrossRef]
- Dey, A.K.; Stamenova, V.; Bacopulos, A.; Jeyakumar, N.; Turner, G.R.; Black, S.E.; Levine, B. Cognitive heterogeneity among community-dwelling older adults with cerebral small vessel disease. Neurobiol. Aging 2019, 77, 183–193. [Google Scholar] [CrossRef]
- Sachdev, P.; Wen, W.; Chen, X.; Brodaty, H. Progression of white matter hyperintensities in elderly individuals over 3 years. Neurology 2007, 68, 214–222. [Google Scholar] [CrossRef]
- Weber, R.; Weimar, C.; Blatchford, J.; Hermansson, K.; Wanke, I.; Möller-Hartmann, C.; Gizewski, E.R.; Forsting, M.; Demchuk, A.M.; Sacco, R.L.; et al. Telmisartan on top of antihypertensive treatment does not prevent progression of cerebral white matter lesions in the prevention regimen for effectively avoiding second strokes (PRoFESS) MRI substudy. Stroke 2012, 43, 2336–2342. [Google Scholar] [CrossRef] [PubMed]
- The SPRINT MIND Investigators for the SPRINT Research Group; Williamson, J.D.; Pajewski, N.M.; Auchus, A.P.; Bryan, R.N.; Chelune, G.; Cheung, A.K.; Cleveland, M.L.; Coker, L.H.; Crowe, M.G.; et al. Effect of Intensive vs Standard Blood Pressure Control on Probable Dementia: A Randomized Clinical Trial. JAMA 2019, 321, 553–561. [Google Scholar] [CrossRef] [PubMed]
- SPS3 Study Group; Benavente, O.R.; Coffey, C.S.; Conwit, R.; Hart, R.G.; McClure, L.A.; Pearce, L.A.; Pergola, P.E.; Szychowski, J.M.; Reverté-Villarroya, S. Blood-pressure targets in patients with recent lacunar stroke: The SPS3 randomised trial. Lancet 2013, 382, 507–515, Erratum in: Lancet 2013, 382, 506. [Google Scholar] [CrossRef] [PubMed]
- ter Telgte, A.; van Leijsen, E.M.C.; Wiegertjes, K.; Klijn, C.J.M.; Tuladhar, A.M.; de Leeuw, F.-E. Cerebral small vessel disease: From a focal to a global perspective. Nat. Rev. Neurol. 2018, 14, 387–398. [Google Scholar] [CrossRef] [PubMed]
- Lu, W.; Yu, C.; Wang, L.; Wang, F.; Qiu, J. Perfusion heterogeneity of cerebral small vessel disease revealed via arterial spin labeling MRI and machine learning. Neuroimage Clin. 2022, 36, 103165. [Google Scholar] [CrossRef] [PubMed]
- Lammie, G.A.; Brannan, F.; Wardlaw, J.M. Incomplete lacunar infarction (Type Ib lacunes). Acta Neuropathol. 1998, 96, 163–171. [Google Scholar] [CrossRef] [PubMed]
- Wang, T.; Jin, A.; Fu, Y.; Zhang, Z.; Li, S.; Wang, D.; Wang, Y. Heterogeneity of White Matter Hyperintensities in Cognitively Impaired Patients with Cerebral Small Vessel Disease. Front. Immunol. 2021, 12, 803504. [Google Scholar] [CrossRef]
- Wardlaw, J.M.; Makin, S.J.; Hernández, M.C.V.; Armitage, P.A.; Heye, A.K.; Chappell, F.M.; Thrippleton, M.J. Blood-brain barrier failure as a core mechanism in cerebral small vessel disease and dementia: Evidencefrom a cohort study. Alzheimers Dement. 2017, 6, 634–643. [Google Scholar] [CrossRef]
- Dobrynina, L.A.; Zabitova, M.R.; Shabalina, A.A.; Kremneva, E.I.; Akhmetzyanov, B.M.; Gadzhieva, Z.S.; Berdalin, A.B.; Kalashnikova, L.A.; Gnedovskaya, E.V.; Krotenkova, M.V. MRI Types of Cerebral Small Vessel Disease and Circulating Markers of Vascular Wall Damage. Diagnostics 2020, 10, 354. [Google Scholar] [CrossRef]
- Toledo, J.B.; Arnold, S.E.; Raible, K.; Brettschneider, J.; Xie, S.X.; Grossman, M.; Monsell, S.E.; Kukull, W.A.; Trojanowski, J.Q. Contribution of cerebrovascular disease in autopsy confirmed neurodegenerative disease cases in the National Alzheimer’s Coordinating Centre. Brain 2013, 136 Pt 9, 2697–2706. [Google Scholar] [CrossRef]
- Kapasi, A.; DeCarli, C.; Schneider, J.A. Impact of multiple pathologies on the threshold for clinically overt dementia. Acta Neuropathol. 2017, 134, 171–186. [Google Scholar] [CrossRef] [PubMed]
- Wardlaw, J.M.; Smith, E.E.; Biessels, G.J.; Cordonnier, C.; Fazekas, F.; Frayne, R.; Lindley, R.I.; O’Brien, J.T.; Barkhof, F.; Benavente, O.R.; et al. Neuroimaging standards for research into small vessel disease and its contribution to ageing and neurodegeneration. Lancet Neurol. 2013, 12, 822–838. [Google Scholar] [CrossRef] [PubMed]
- Kim, K.W.; MacFall, J.R.; Payne, M.E. Classification of white matter lesions on magnetic resonance imaging in elderly persons. Biol. Psychiatry 2008, 64, 273–280. [Google Scholar] [CrossRef] [PubMed]
- Kremneva, E.I.; Zabitova, M.R.; Shamtieva, K.V.; Krotenkova, M.V.; Dobrynina, L.A. Analysis of Distribution and Grouping of MRI Characteristics of Age-Related Cerebral Microangiopathy. Hum. Physiol. 2021, 47, 901–910. [Google Scholar] [CrossRef]
- Nasreddine, Z.S.; Phillips, N.A.; Bédirian, V.; Charbonneau, S.; Whitehead, V.; Collin, I.; Cummings, J.L.; Chertkow, H. The Montreal Cognitive Assessment, MoCA: A brief screening tool for mild cognitive impairment. J. Am. Geriatr. Soc. 2005, 53, 695–699, Erratum in: J. Am. Geriatr. Soc. 2019, 67, 1991. [Google Scholar] [CrossRef]
- Mahoney, F.I.; Barthel, D.W. Functional evaluation: The Barthel Index: A simple index of independence useful in scoring improvement in the rehabilitation of the chronically ill. Md. State Med. J. 1965, 14, 61–65. [Google Scholar] [PubMed]
- American Psychiatric Association. Diagnostic and Statistical Manual of Mental Disorders, 5th ed.; DSM-5; American Psychiatric Publishing: Arlington, VA, USA, 2013; p. 991. [Google Scholar]
- Dobrynina, L.A.; Gadzhieva ZSh Kalashnikova, L.A.; Gnedovskaya, E.V.; Piradov, M.A. Neuropsychological profile and vascular risk factors in patients with cerebral microangiopathy. Ann. Clin. Exp. Neurol. 2018, 12, 5–15. (In Russia) [Google Scholar] [CrossRef]
- Dobrynina, L.A.; Gadzhieva, Z.S.; Kremneva, E.I.; Shamtieva, K.V.; Tsypushtanova, M.M.; Makarova, A.G.; Trubitsyna, V.V.; Bitsieva, E.T.; Filatov, A.S.; Byrochkina, A.A.; et al. Survival, cognitive functions, and brain MRI in patients with cSVD: 5-year observation. Ann. Clin. Exp. Neurol. 2022, 16, 18–28. [Google Scholar] [CrossRef]
- Poggesi, A. Circulating biologic markers of endothelial dysfunction in cerebral small vessel disease: A review. J. Cereb. Blood Flow. Metabolism. 2016, 36, 72–94. [Google Scholar] [CrossRef]
- Dobrynina, L.A.; Gnedovskaya, E.V.; Shabalina, A.A.; Sergeeva, A.N.; Kravchenko, M.A.; Nikolaeva, N.S. Biomarkers and mechanisms of early vascular damage. S.S. Korsakov J. Neurol. Psychiatry 2018, 118, 23–32. [Google Scholar] [CrossRef]
- Low, A.; Mak, E.; Rowe, J.B.; Markus, H.S.; O’Brien, J.T. Inflammation and cerebral small vessel disease: A systematic review. Ageing Res. Rev. 2019, 53, 100916. [Google Scholar] [CrossRef] [PubMed]
- Evans, L.E.; Taylor, J.L.; Smith, C.J.; Pritchard, H.A.T.; Greenstein, A.S.; Allan, S.M. Cardiovascular comorbidities, inflammation, and cerebral small vessel disease. Cardiovasc. Res. 2021, 117, 2575–2588. [Google Scholar] [CrossRef] [PubMed]
- Schneider, J.A.; Arvanitakis, Z.; Bang, W.; Bennett, D.A. Mixed brain pathologies account for most dementia cases in community-dwelling older persons. Neurology 2007, 69, 2197–2204. [Google Scholar] [CrossRef] [PubMed]
- Sonnen, J.A.; Santa Cruz, K.; Hemmy, L.S.; Woltjer, R.; Leverenz, J.B.; Montine, K.S.; Jack, C.R.; Kaye, J.; Lim, K.; Larson, E.B.; et al. Ecology of the aging human brain. Arch. Neurol. 2011, 68, 1049–1056. [Google Scholar] [CrossRef]
- Calsolaro, V.; Edison, P. Neuroinflammation in Alzheimer’s disease: Current evidence and future directions. Alzheimers Dement. 2016, 12, 719–732. [Google Scholar] [CrossRef]
- Liu, Y.; Braidy, N.; Poljak, A.; Chan, D.K.Y.; Sachdev, P. Cerebral small vessel disease and the risk of Alzheimer’s disease: A systematic review. Ageing Res. Rev. 2018, 47, 41–48. [Google Scholar] [CrossRef] [PubMed]
- Zou, C.; Huang, X.; Zhang, Y.; Pan, M.; Xie, J.; Chen, L.; Meng, Y.; Zou, D.; Luo, J. Potential biomarkers of Alzheimer’s disease and cerebral small vessel disease. Front. Mol. Neurosci. 2022, 15, 996107. [Google Scholar] [CrossRef]
- Ferdinandusse, S.; Denis, S.; Hogenhout, E.M.; Koster, J.; van Roermund, C.W.; Ijlst, L.; Moser, A.B.; Wanders, R.J.; Waterham, H.R. Clinical, biochemical, and mutational spectrum of peroxisomal acyl-coenzyme A oxidase deficiency. Hum. Mutat. 2007, 28, 904–912. [Google Scholar] [CrossRef]
- Baarine, M.; Andréoletti, P.; Athias, A.; Nury, T.; Zarrouk, A.; Ragot, K.; Vejux, A.; Riedinger, J.M.; Kattan, Z.; Bessede, G.; et al. Evidence of oxidative stress in very long chain fatty acid--treated oligodendrocytes and potentialization of ROS production using RNA interference-directed knockdown of ABCD1 and ACOX1 peroxisomal proteins. Neuroscience 2012, 213, 1–18. [Google Scholar] [CrossRef]
- El Hajj, H.I.; Vluggens, A.; Andreoletti, P.; Ragot, K.; Mandard, S.; Kersten, S.; Waterham, H.R.; Lizard, G.; Wanders, R.J.; Reddy, J.K.; et al. The inflammatory response in acyl-CoA oxidase 1 deficiency (pseudoneonatal adrenoleukodystrophy). Endocrinology 2012, 153, 2568–2575. [Google Scholar] [CrossRef]
- Raas, Q.; Saih, F.E.; Gondcaille, C.; Trompier, D.; Hamon, Y.; Leoni, V.; Caccia, C.; Nasser, B.; Jadot, M.; Ménétrier, F.; et al. A microglial cell model for acyl-CoA oxidase 1 deficiency. Biochim. Biophys. Acta Mol. Cell Biol. Lipids 2019, 1864, 567–576. [Google Scholar] [CrossRef] [PubMed]
- Shimotake, J.; Derugin, N.; Wendland, M.; Vexler, Z.S.; Ferriero, D.M. Vascular endothelial growth factor receptor-2 inhibition promotes cell death and limits endothelial cell proliferation in a neonatal rodent model of stroke. Stroke 2010, 41, 343–349. [Google Scholar] [CrossRef]
- Dzietko, M.; Derugin, N.; Wendland, M.F.; Vexler, Z.S.; Ferriero, D.M. Delayed VEGF treatment enhances angiogenesis and recovery after neonatal focal rodent stroke. Transl. Stroke Res. 2013, 4, 189–200. [Google Scholar] [CrossRef]
- Park, J.M.; Kim, Y.J.; Song, M.K.; Lee, J.M.; Kim, Y.J. Genome-wide DNA methylation profiling in a rat model with vascular dementia. Mol. Med. Rep. 2018, 18, 123–130. [Google Scholar] [CrossRef]
- Patel, N.S.; Mathura, V.S.; Bachmeier, C.; Beaulieu-Abdelahad, D.; Laporte, V.; Weeks, O.; Mullan, M.; Paris, D. Alzheimer’s beta-amyloid peptide blocks vascular endothelial growth factor mediated signaling via direct interaction with VEGFR-2. J Neurochem. 2010, 112, 66–76. [Google Scholar] [CrossRef]
- Martin, L.; Bouvet, P.; Chounlamountri, N.; Watrin, C.; Besançon, R.; Pinatel, D.; Meyronet, D.; Honnorat, J.; Buisson, A.; Salin, P.A.; et al. VEGF counteracts amyloid-β-induced synaptic dysfunction. Cell Rep. 2021, 35, 109121. [Google Scholar] [CrossRef] [PubMed]
- Kapoor, A.; Gaubert, A.; Marshall, A.; Meier, I.B.; Yew, B.; Ho, J.K.; Blanken, A.E.; Dutt, S.; Sible, I.J.; Li, Y.; et al. Increased Levels of Circulating Angiogenic Cells and Signaling Proteins in Older Adults with Cerebral Small Vessel Disease. Front. Aging Neurosci. 2021, 13, 711784. [Google Scholar] [CrossRef] [PubMed]
- Shibly, A.Z.; Sheikh, A.M.; Michikawa, M.; Tabassum, S.; Azad, A.K.; Zhou, X.; Zhang, Y.; Yano, S.; Nagai, A. Analysis of Cerebral Small Vessel Changes in AD Model Mice. Biomedicines 2022, 11, 50. [Google Scholar] [CrossRef]
- Louveau, A.; Herz, J.; Alme, M.N.; Salvador, A.F.; Dong, M.Q.; Viar, K.E.; Herod, S.G.; Knopp, J.; Setliff, J.C.; Lupi, A.L.; et al. CNS lymphatic drainage and neuroinflammation are regulated by meningeal lymphatic vasculature. Nat. Neurosci. 2018, 21, 1380–1391. [Google Scholar] [CrossRef] [PubMed]
- Hsu, S.J.; Zhang, C.; Jeong, J.; Lee, S.I.; McConnell, M.; Utsumi, T.; Iwakiri, Y. Enhanced Meningeal Lymphatic Drainage Ameliorates Neuroinflammation and Hepatic Encephalopathy in Cirrhotic Rats. Gastroenterology 2021, 160, 1315–1329.e13. [Google Scholar] [CrossRef]
- Xue, Y.; Liu, N.; Zhang, M.; Ren, X.; Tang, J.; Fu, J. Concomitant enlargement of perivascular spaces and decrease in glymphatic transport in an animal model of cerebral small vessel disease. Brain Res. Bull. 2020, 161, 78–83. [Google Scholar] [CrossRef] [PubMed]
- Chan, G.; White, C.C.; Winn, P.A.; Cimpean, M.; Replogle, J.M.; Glick, L.R.; Cuerdon, N.E.; Ryan, K.J.; Johnson, K.A.; Schneider, J.A.; et al. CD33 modulates TREM2: Convergence of Alzheimer loci. Nat. Neurosci. 2015, 18, 1556–1558. [Google Scholar] [CrossRef] [PubMed]
- Dos Santos, L.R.; Pimassoni, L.H.S.; Sena, G.G.S.; Camporez, D.; Belcavello, L.; Trancozo, M.; Morelato, R.L.; Errera, F.I.V.; Bueno, M.R.P.; de Paula, F. Validating GWAS Variants from Microglial Genes Implicated in Alzheimer’s Disease. J. Mol. Neurosci. 2017, 62, 215–221. [Google Scholar] [CrossRef] [PubMed]
- Lajaunias, F.; Dayer, J.M.; Chizzolini, C. Constitutive repressor activity of CD33 on human monocytes requires sialic acid recognition and phosphoinositide 3-kinase-mediated intracellular signaling. Eur. J. Immunol. 2005, 35, 243–251. [Google Scholar] [CrossRef]
- Gonzalez, Y.; Herrera, M.T.; Soldevila, G.; Garcia-Garcia, L.; Fabián, G.; Pérez-Armendariz, E.M.; Bobadilla, K.; Guzmán-Beltrán, S.; Sada, E.; Torres, M. High glucose concentrations induce TNF-α production through the down-regulation of CD33 in primary human monocytes. BMC Immunol. 2012, 13, 19. [Google Scholar] [CrossRef] [PubMed]
- Li, C.; Ruotsalainen, V.; Tryggvason, K.; Shaw, A.S.; Miner, J.H. CD2AP is expressed with nephrin in developing podocytes and is found widely in mature kidney and elsewhere. Am. J. Physiol. Ren. Physiol. 2000, 279, F785–F792. [Google Scholar] [CrossRef]
- Lehtonen, S.; Tienari, J.; Londesborough, A.; Pirvola, U.; Ora, A.; Reima, I.; Lehtonen, E. CD2-associated protein is widely expressed and differentially regulated during embryonic development. Differentiation 2008, 76, 506–517. [Google Scholar] [CrossRef] [PubMed]
- Cochran, J.N.; Rush, T.; Buckingham, S.C.; Roberson, E.D. The Alzheimer’s disease risk factor CD2AP maintains blood-brain barrier integrity. Hum. Mol. Genet. 2015, 24, 6667–6674. [Google Scholar] [CrossRef] [PubMed]
- Karch, C.M.; Goate, A.M. Alzheimer’s disease risk genes and mechanisms of disease pathogenesis. Biol. Psychiatry 2015, 77, 43–51. [Google Scholar] [CrossRef]
- Andrews, S.J.; Fulton-Howard, B.; Goate, A. Interpretation of risk loci from genome-wide association studies of Alzheimer’s disease. Lancet Neurol. 2020, 19, 326–335. [Google Scholar] [CrossRef]
- Chapuis, J.; Hansmannel, F.; Gistelinck, M.; Mounier, A.; Van Cauwenberghe, C.; Kolen, K.V.; Geller, F.; Sottejeau, Y.; Harold, D.; Dourlen, P.; et al. GERAD consortium. Increased expression of BIN1 mediates Alzheimer genetic risk by modulating tau pathology. Mol. Psychiatry 2013, 18, 1225–1234. [Google Scholar] [CrossRef] [PubMed]
- Miyagawa, T.; Ebinuma, I.; Morohashi, Y.; Hori, Y.; Young Chang, M.; Hattori, H.; Maehara, T.; Yokoshima, S.; Fukuyama, T.; Tsuji, S.; et al. BIN1 regulates BACE1 intracellular trafficking and amyloid-β production. Hum. Mol. Genet. 2016, 25, 2948–2958. [Google Scholar] [CrossRef]
- Tan, M.S.; Yu, J.T.; Tan, L. Bridging integrator 1 (BIN1): Form, function, and Alzheimer’s disease. Trends Mol. Med. 2013, 19, 594–603. [Google Scholar] [CrossRef] [PubMed]
- Esmailzadeh, S.; Huang, Y.; Su, M.W.; Zhou, Y.; Jiang, X. BIN1 tumor suppressor regulates Fas/Fas ligand-mediated apoptosis through c-FLIP in cutaneous T-cell lymphoma. Leukemia 2015, 29, 1402–1413. [Google Scholar] [CrossRef] [PubMed]
- Dobrynina, L.A.; Gnedovskaya, E.V.; Sergeeva, A.N.; Krotenkova, M.V.; Piradov, M.A. Changes in the MRI brain picture associated with newly diagnosed asymptomatic arterial hypertension. Ann. Clin. Exp. Neurol. 2016, 10, 25–32. [Google Scholar]
- Zhang, C.E.; Wong, S.M.; Uiterwijk, R.; Backes, W.H.; Jansen, J.F.A.; Jeukens, C.R.L.P.N.; van Oostenbrugge, R.J.; Staals, J. Blood-brain barrier leakage in relation to white matter hyperintensity volume and cognition in small vessel disease and normal aging. Brain Imaging Behav. 2019, 13, 389–395. [Google Scholar] [CrossRef] [PubMed]
- De Rossi, P.; Buggia-Prévot, V.; Clayton, B.L.; Vasquez, J.B.; van Sanford, C.; Andrew, R.J.; Lesnick, R.; Botté, A.; Deyts, C.; Salem, S.; et al. Predominant expression of Alzheimer’s disease-associated BIN1 in mature oligodendrocytes and localization to white matter tracts. Mol. Neurodegener. 2016, 11, 59, Erratum in: Mol. Neurodegener. 2023, 18, 72. [Google Scholar] [CrossRef] [PubMed]
- Gough, P.; Myles, I.A. Tumor Necrosis Factor Receptors: Pleiotropic Signaling Complexes and Their Differential Effects. Front. Immunol. 2020, 11, 585880. [Google Scholar] [CrossRef] [PubMed]
- Buchhave, P.; Zetterberg, H.; Blennow, K.; Minthon, L.; Janciauskiene, S.; Hansson, O. Soluble TNF receptors are associated with Aβ metabolism and conversion to dementia in subjects with mild cognitive impairment. Neurobiol. Aging 2010, 31, 1877–1884. [Google Scholar] [CrossRef]
- Zhang, J.; Jia, J.; Qin, W.; Wang, S. Combination of plasma tumor necrosis factor receptors signaling proteins, beta-amyloid and apolipoprotein E for the detection of Alzheimer’s disease. Neurosci. Lett. 2013, 541, 99–104. [Google Scholar] [CrossRef]
- Zhang, J.; Peng, M.; Jia, J. Plasma amyloid-β oligomers and soluble tumor necrosis factor receptors as potential biomarkers of AD. Curr. Alzheimer Res. 2014, 11, 325–331. [Google Scholar] [CrossRef] [PubMed]
- Salai, K.H.T.; Wu, L.Y.; Chong, J.R.; Chai, Y.L.; Gyanwali, B.; Robert, C.; Hilal, S.; Venketasubramanian, N.; Dawe, G.S.; Chen, C.P.; et al. Elevated Soluble TNF-Receptor 1 in the Serum of Predementia Subjects with Cerebral Small Vessel Disease. Biomolecules 2023, 13, 525. [Google Scholar] [CrossRef] [PubMed]
- Dri, P.; Gasparini, C.; Menegazzi, R.; Cramer, R.; Albéri, L.; Presani, G.; Garbisa, S.; Patriarca, P. TNF-Induced shedding of TNF receptors in human polymorphonuclear leukocytes: Role of the 55-kDa TNF receptor and involvement of a membrane-bound and non-matrix metalloproteinase. J. Immunol. 2000, 165, 2165–2172. [Google Scholar] [CrossRef]
- Cheng, X.; Yang, L.; He, P.; Li, R.; Shen, Y. Differential activation of tumor necrosis factor receptors distinguishes between brains from Alzheimer’s disease and non-demented patients. J. Alzheimers Dis. 2010, 19, 621–630. [Google Scholar] [CrossRef] [PubMed]
- Barone, F.C.; Arvin, B.; White, R.F.; Miller, A.; Webb, C.L.; Willette, R.N.; Lysko, P.G.; Feuerstein, G.Z. Tumor necrosis factor-alpha. A mediator of focal ischemic brain injury. Stroke 1997, 28, 1233–1244. [Google Scholar] [CrossRef] [PubMed]
- Works, M.G.; Koenig, J.B.; Sapolsky, R.M. Soluble TNF receptor 1-secreting ex vivo-derived dendritic cells reduce injury after stroke. J. Cereb. Blood Flow. Metab. 2013, 33, 1376–1385. [Google Scholar] [CrossRef]


| Test | MRI Type 1 F3 (1) (n = 17) | MRI Type 2 F3 (2) (n = 17) | Control (0) | p |
|---|---|---|---|---|
| (n = 11) | ||||
| Age (mean ± SD) | 56.4 ± 8.1 | 67.1 ± 6.3 | 57.3 ± 9.7 | p = 0.001 |
| p1–2 = 0.002 | ||||
| p0–2 = 0.027 | ||||
| Gender (n, %) | ||||
| Female | 10 (58.8%) | 2 (11.8%) | 7 (63.6%) | p = 0.018 |
| Male | 7 (41.2%) | 15 (88.2%) | 4 (36.4%) | |
| Education | 15 [12; 16.5] | 14 [13; 18] | 16.5 [15; 17] | p > 0.05 |
| AG (n, %) | 17 (100%) | 17 (100%) | 4 (36.4%) | p < 0.001 |
| Hypertension degree: | ||||
| Degree 1 | 0 (0%) | 1 (5.9%) | 2 (18.2%) | |
| Degree 2 | 5 (29.4%) | 6 (35.3%) | 2 (18.2%) | |
| Degree 3 | 12 (70.6%) | 10 (58.8%) | 0 (0%) | |
| Type 2 diabetes (n, %) | 3 (17.7%) | 5 (29.4%) | - | p > 0.05 |
| Smoking (n, %) | 10 (58.8%) | 7 (41.2%) | 3 (27.3%) | p > 0.05 |
| Obesity (n, %) | 5 (29.4%) | 10 (58.8%) | 3 (27.3%) | p > 0.05 |
| Cholesterol level, mmol/L (Me [Q25%; Q75%]) | 5.7 [4.2; 6.8] | 5.6 [4.7; 5.9] | 5.2 [4.8; 5.8] | p > 0.05 |
| MoCA (Me [Q25%; Q75%]) | 21 [17; 23] | 24 [21; 26] | 28 [27; 29] | p < 0.001 |
| p0–1 < 0.001 | ||||
| p0–2 = 0.006 | ||||
| Cognitive functions | ||||
| (Me [Q25%; Q75%]): | ||||
| Inhibition—Stroop test (s) | 226 [211; 301] | 150 [135; 206] | 118 [102; 179] | p = 0.009 |
| p0–1 = 0.001 | ||||
| p1–2 = 0.033 | ||||
| Switching—TMT | ||||
| (Trail making test) test B-A (s) | 91 [45; 223] | 115 [70; 171] | 32 [19; 90] | p = 0.011 |
| p0–1 = 0.026 | ||||
| p0–2 = 0.019 | ||||
| Productivity—Verbal fluency test (animals) | 7 [4; 9] | 11 [8; 13] | 15 [14; 19] | p < 0.000 |
| p0–1 < 0.000 | ||||
| p0–2 = 0.017 | ||||
| Memory—Delayed playback of 10 words (words) | 3 [2; 6] | 6 [5; 8] | 9 [8;9] | p = 0.001 |
| p0–1 = 0.001 | ||||
| CI (n, %) | 17 (100%) | 17 (100%) | - | p > 0.05 |
| Dementia | 6 (35.3%) | 5 (29.4%) | ||
| MCI | 10 (58.8%) | 6 (35.3%) | ||
| subCI | 1 (5.9%) | 6 (35.3%) | ||
| MRI signs: | ||||
| Lacunes (n, %) | 17 (100%) | 9 (52.9%) | - | p = 0.018 |
| Microbleeds (n, %) | 17 (100%) | 8 (47.1%) | - | p = 0.001 |
| Atrophy (n, %) | 16 (94.1%) | 13 (76.5%) | - | p > 0.05 |
| Enlarged PVS (n, %) | 17 (100%) | 17 (100%) | - |
Disclaimer/Publisher’s Note: The statements, opinions and data contained in all publications are solely those of the individual author(s) and contributor(s) and not of MDPI and/or the editor(s). MDPI and/or the editor(s) disclaim responsibility for any injury to people or property resulting from any ideas, methods, instructions or products referred to in the content. |
© 2024 by the authors. Licensee MDPI, Basel, Switzerland. This article is an open access article distributed under the terms and conditions of the Creative Commons Attribution (CC BY) license (https://creativecommons.org/licenses/by/4.0/).
Share and Cite
Dobrynina, L.A.; Makarova, A.G.; Shabalina, A.A.; Burmak, A.G.; Shlapakova, P.S.; Shamtieva, K.V.; Tsypushtanova, M.M.; Kremneva, E.I.; Zabitova, M.R.; Filatov, A.S.; et al. The Role of Changes in the Expression of Inflammation-Associated Genes in the Variants of Cerebral Small Vessel Disease. Int. J. Mol. Sci. 2024, 25, 8113. https://doi.org/10.3390/ijms25158113
Dobrynina LA, Makarova AG, Shabalina AA, Burmak AG, Shlapakova PS, Shamtieva KV, Tsypushtanova MM, Kremneva EI, Zabitova MR, Filatov AS, et al. The Role of Changes in the Expression of Inflammation-Associated Genes in the Variants of Cerebral Small Vessel Disease. International Journal of Molecular Sciences. 2024; 25(15):8113. https://doi.org/10.3390/ijms25158113
Chicago/Turabian StyleDobrynina, Larisa A., Angelina G. Makarova, Alla A. Shabalina, Anastasiia G. Burmak, Polina S. Shlapakova, Kamila V. Shamtieva, Maria M. Tsypushtanova, Elena I. Kremneva, Maryam R. Zabitova, Alexey S. Filatov, and et al. 2024. "The Role of Changes in the Expression of Inflammation-Associated Genes in the Variants of Cerebral Small Vessel Disease" International Journal of Molecular Sciences 25, no. 15: 8113. https://doi.org/10.3390/ijms25158113