Abstract
Xylan, one of the most important structures and polysaccharides, plays critical roles in plant development, growth, and defense responses to pathogens. Glucuronic acid substitution of xylan (GUX) functions in xylan sidechain decoration, which is involved in a wide range of physiological processes in plants. However, the specifics of GUXs in trees remain unclear. In this study, the characterization and evolution of the GUX family genes in E. grandis, a fast-growing forest tree belonging to the Myrtaceae family, were performed. A total of 23 EgGUXs were identified from the E. grandis genome, of which all members contained motif 2, 3, 5, and 7. All GUX genes were phylogeneticly clustered into five distinct groups. Among them, EgGUX01~EgGUX05 genes were clustered into group III and IV, which were more closely related to the AtGUX1, AtGUX2, and AtGUX4 members of Arabidopsis thaliana known to possess glucuronyltransferase activity, while most other members were clustered into group I. The light-responsive elements, hormone-responsive elements, growth and development-responsive elements, and stress-responsive elements were found in the promoter cis-acting elements, suggesting the expression of GUX might also be regulated by abiotic factors. RNA-Seq data confirmed that EgGUX02, EgGUX03, and EgGUX10 are highly expressed in xylem, and EgGUX09, EgGUX10, and EgGUX14 were obviously responses to abiotic stresses. The results of this paper will provide a comprehensive determination of the functions of the EgGUX family members, which will further contribute to understanding E. grandis xylan formation.
1. Introduction
Plant evolution has been characterized by the development of complex organs and highly specialized cellular structures, including complex plant cell walls [1]. These secondary cell walls primarily consist of cellulose, hemicellulose, and lignin—three major components that are among the most abundant and renewable resources on Earth [2,3]. These resources can be utilized for the production of biofuels, such as bioethanol and butanol, as well as other high-value biochemicals that are directly or indirectly employed in the fields of food, materials, pharmaceuticals, and chemicals [4]. Xylan is one of the most important hemicelluloses. Based on the secondary cell wall function, xylan biosynthesis-related genes are typically categorized into three groups involved in the synthesis of the main chain, the reducing end, and the side chain (including glucuronide residues, arabinofuranosyl, etc.).
In A. thaliana, there are five glucuronic acid substitutions of xylan (GUX, GT8 family)-related genes: AtGUX1, AtGUX2, AtGUX3, AtGUX4, and AtGUX5. These genes catalyze the attachment of glucuronic acid to the xylan backbone [5,6,7], and the two modifications mediated by AtGUX1 and AtGUX2 coexist in the same xylan molecule, which may affect the cross-linking with cellulose or lignin [8]. Previous research conducted by Rennie and colleagues measured glucuronosyltransferase activity in tobacco microcysts by transiently expressing AtGUX proteins [9]. Their findings revealed that only AtGUX1, AtGUX2, and AtGUX4 exhibited glucuronosyltransferase activity. However, it remains uncertain whether AtGUX3 and AtGUX5 are also involved in xylan synthesis. This uncertainty highlights the need for further investigation to fully understand the roles of these genes in plant cell-wall biosynthesis. Golgi proteome analysis in cultured cells of A. thaliana has revealed the presence of the AtGUX3 protein. Since the primary wall of undifferentiated cultured cells constitutes a significant component, it is plausible that AtGUX3 may also play a role in the synthesis of certain components of the primary wall [10]. Lee et al. conducted an analysis of the expression patterns of the five GUX genes [11]. Their findings indicate that AtGUX1 and AtGUX2 are primarily expressed in stems; AtGUX3 is expressed in roots, stems, leaves, and flowers, and specifically in the xylem of stems; AtGUX4 is mainly expressed in roots; and AtGUX5 is primarily expressed in leaves and flowers. Bromley et al. proposed that AtGUX1 modifies glucuronic acid (GlcA) attachment to xylan with uniformly spaced intervals of 6, 8, 10, or more xylose residues in an even pattern [7]. This modification appears to be the primary mode. In contrast, AtGUX2 modifies GlcA attachment to xylan with smaller intervals, exercising its modification at intervals of seven or fewer xylose residues. This modification accounts for a smaller proportion and is considered as the secondary mode.
These findings suggest that the GUX family of genes exhibits specialized expression patterns and functional roles in plant cell-wall biosynthesis. AtGUX3, despite initial uncertainty regarding its involvement in xylan synthesis, may play a crucial role in the synthesis of the primary wall components in A. thaliana. Future studies are needed to further elucidate the precise functions and interactions of these genes in plant cell-wall biosynthesis. The interaction between xylan and cellulose is crucial for determining the mechanical properties of secondary cell walls [12]. Therefore, if the activities of xylosyltransferases, particularly AtGUX1 and AtGUX2, which are pivotal in xylan synthesis, are appropriately downregulated, it could lead to not only normal plant growth and unchanged biomass but also a relative increase in the cellulose content of the plant and a relative decrease in the xylan and lignin content [5,13,14,15]. Modulating the relative xylan decoration process could emerge as an effective strategy for wood modification. To fully harness the efficient utilization of xylan in E. grandis, bioengineering techniques can be employed to regulate the structure and proportion of xylan. This approach has the potential to enhance the economic value and sustainability of wood products derived from this species.
E. grandis, native to Australia and prevalent in tropical and subtropical regions, is a cornerstone of numerous forestry projects worldwide. China, Brazil, and India, among other countries, boast extensive E. grandis-based timber industries that contribute significantly to their economies. This fast-growing tree species offers timber that is easy to process, odor-free, and highly versatile, making it a valuable lignocellulosic raw material. Over the years, E. grandis has been extensively studied in various fields, including morphological development and plant resistance. Given its significant economic benefits, researchers have long been interested in understanding and manipulating the biosynthesis and regulation of E. grandis timber properties. The ultimate goal is to optimize the growth of E. grandis to better meet the diverse economic demands.
In this paper, a comprehensive bioinformatics analysis of the GUX family genes was conducted. This analysis provides a solid foundation for further exploration of the biological functions and regulatory networks of the GUX genes. It lays the groundwork for future research aimed at elucidating the biosynthesis and regulation of timber properties in fast-growing species like E. grandis. Additionally, this study opens the door to potential genetic modifications of plant cell walls, offering a promising approach to meeting the diverse demands of the market. By understanding and manipulating the GUX genes, we may be able to optimize the properties of E. grandis timber, thus contributing to the sustainable development of the forestry industry.
2. Results
2.1. Identification of EgGUXs and Analysis of Physicochemical Properties
Through the BLASTp comparison, 23 GUX proteins were identified, named as EgGUX01~EgGUX23 (Table 1). Analysis of the physicochemical properties of EgGUXs revealed that the amino acid number of each protein ranged from 320 to 645. The EgGUX04 gene had the highest count (645 amino acids), while the EgGUX23 gene had the lowest (320 amino acids). Isoelectric point analysis indicated that EgGUX01 to EgGUX04 had isoelectrics above 7, while all other members had isoelectric points below 7, suggesting that the EgGUX gene family predominantly contained acidic amino acids. The aliphatic amino acid indexes range from 72.16 (EgGUX23) to 89.45 (EgGUX04), indicating minor differences in thermal stability among the proteins of this family. All EgGUXs showed negative values in hydrophilicity analysis, confirming their hydrophilic nature. The most hydrophilic was EgGUX05, with a grand average of hydrophilicity (GRAVY) of −0.473, while the least hydrophilic was EgGUX13, with a GRAVY of −0.152 (Table 1).

Table 1.
Physicochemical of proteins encoded by the GUX gene family in E. grandis.
2.2. Phylogenetic Tree of GUX Gene Family in E. grandis
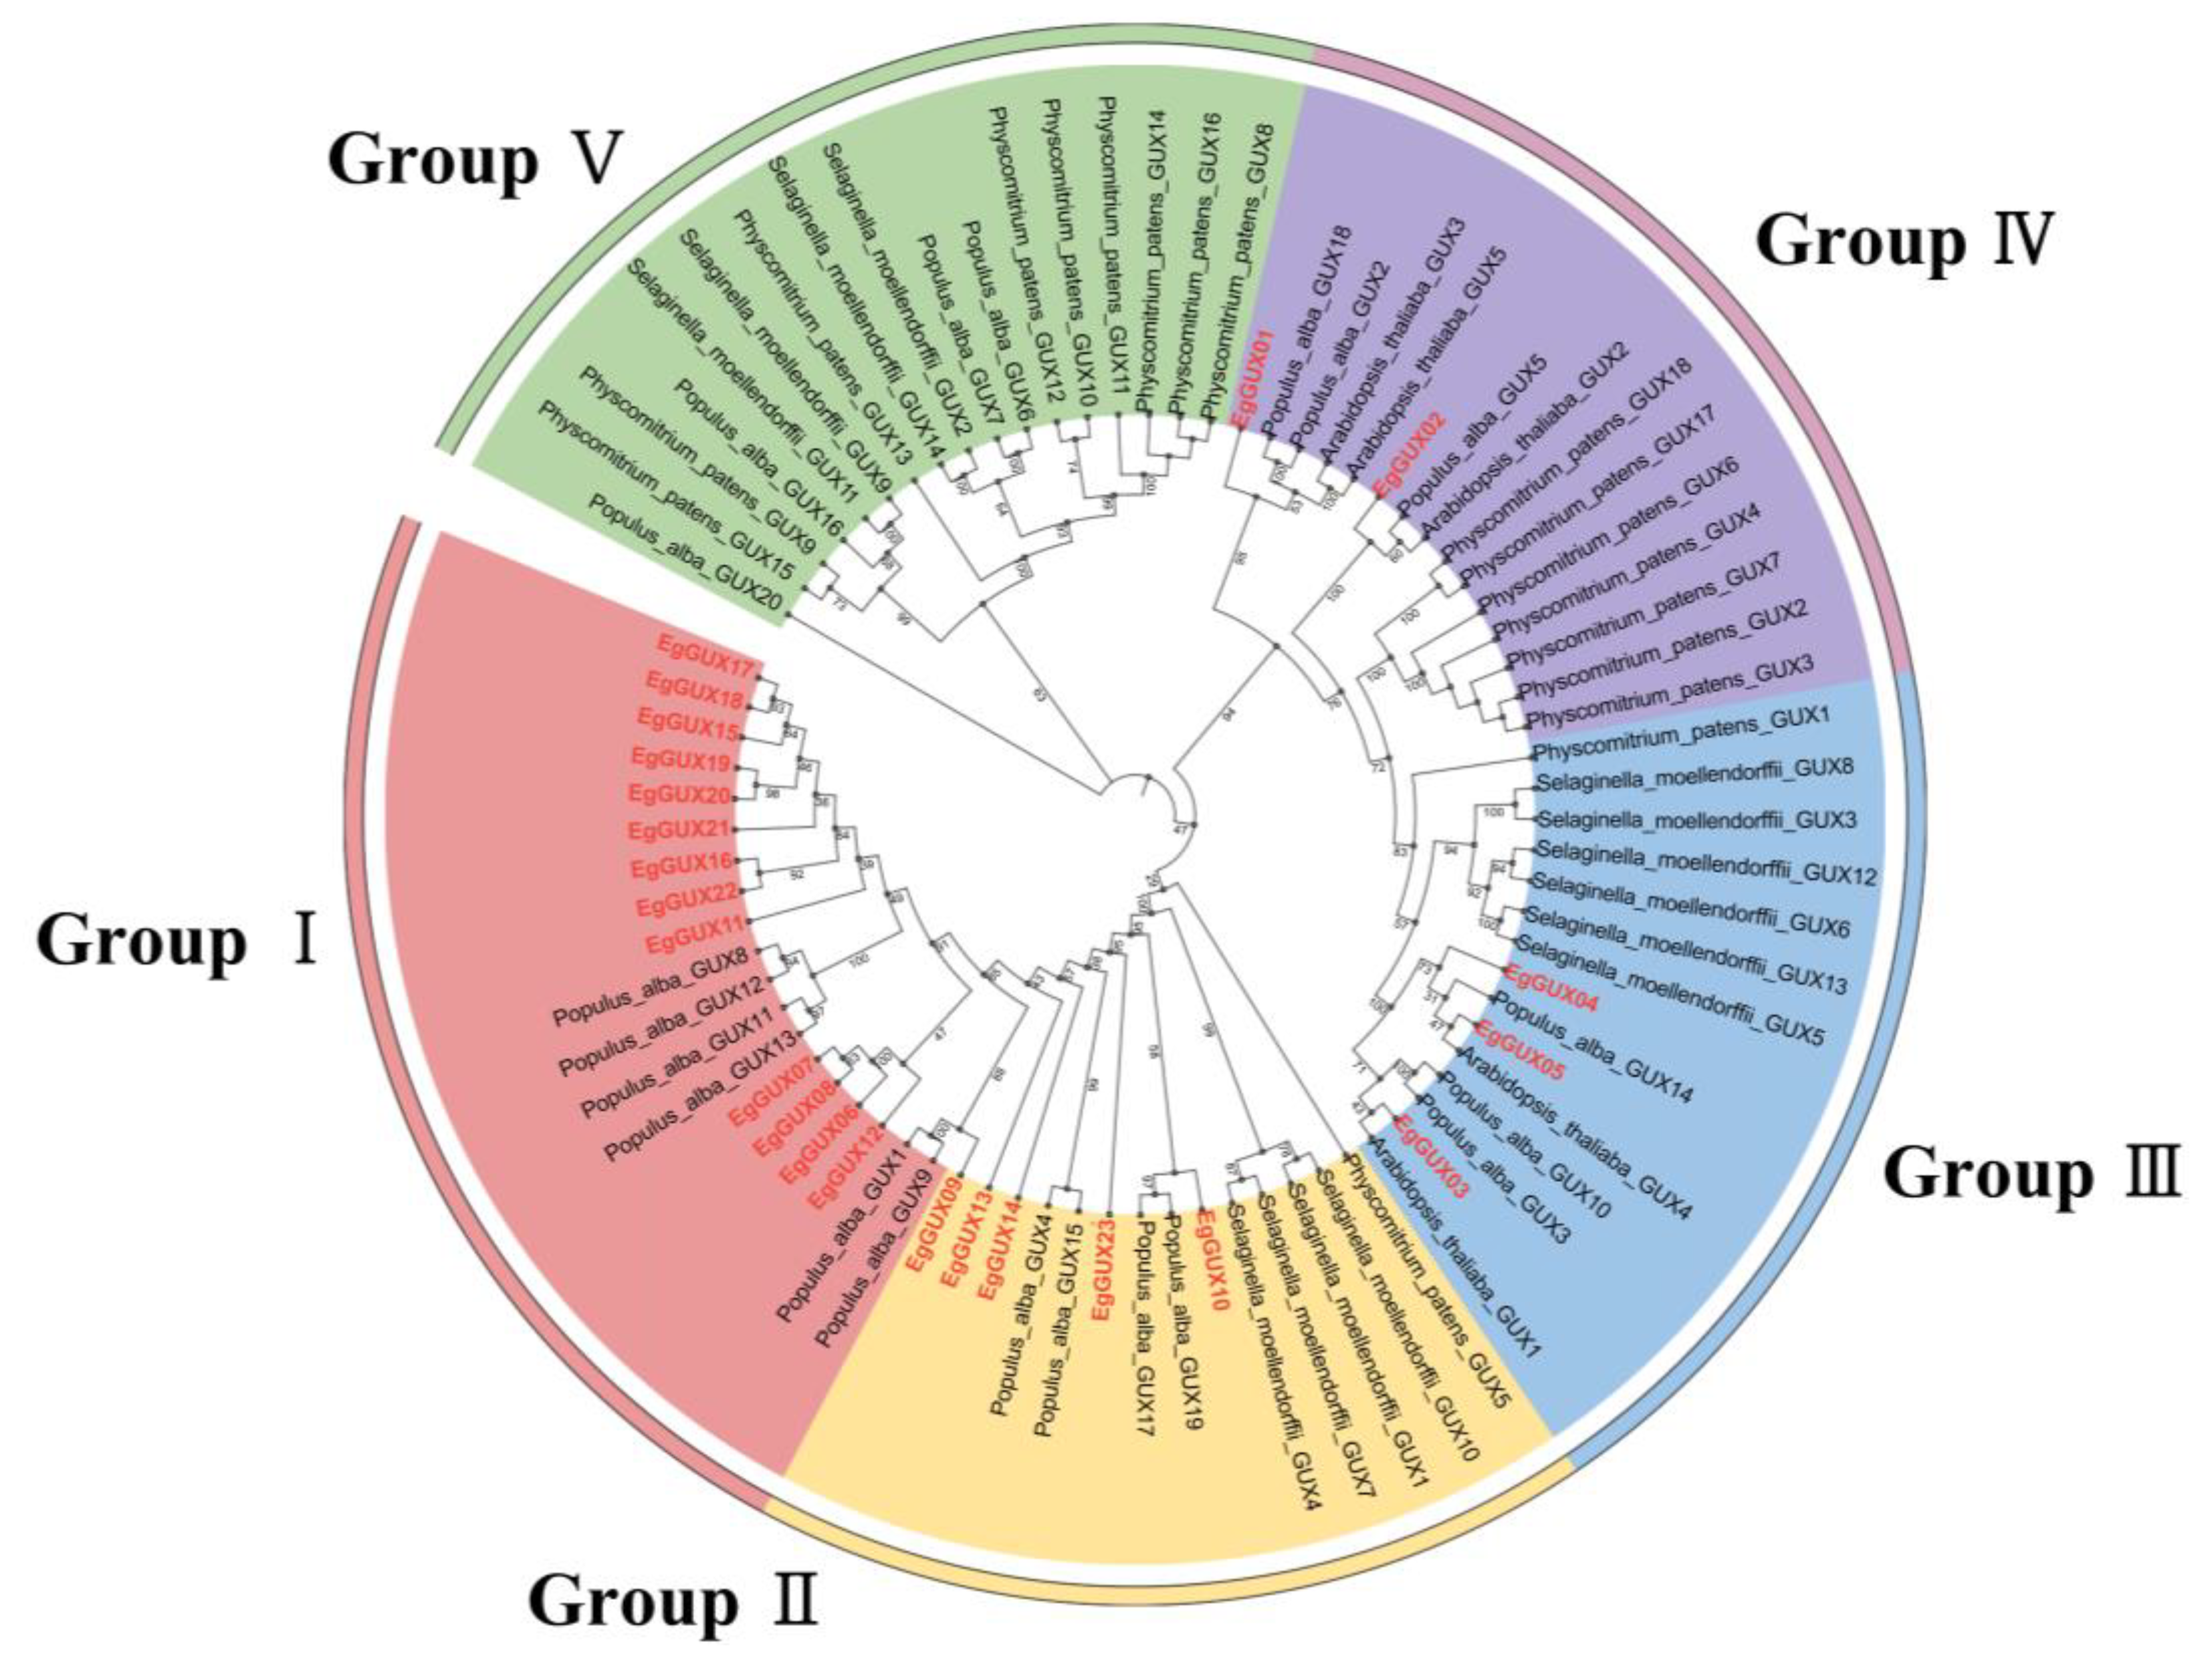
To study the evolutionary indications of GUX, the GUX genes in A. thaliana, S. moellendorffii, P. patens, and P. alba were named according to the nomenclature and classification of the GUX family genes across different plants by Gallinari et al. [16] (Table S1). A rooted phylogenetic tree was constructed using TBtools, based on a total of 80 protein sequences from E. grandis (23), A. thaliana (5), S. moellendorffii (14), P. patens (18), and P. alba (20). Phylogenetic analysis categorized the GUX proteins into five subfamilies, Groups I–V. The EgGUX family contained 13, 5, 3, and 2 members from Group I to Group IV, respectively, with no EgGUXs members in Group V. Given the demonstrated glucuronosyltransferase activity in AtGUX1, AtGUX2, and AtGUX4, it is inferred that EgGUX family members are closely related to A. thaliana AtGUX1, AtGUX2, and AtGUX4 corresponding to EgGUX01~EgGUX05 in Group III and Group IV. Furthermore, the phylogenetic tree suggests that EgGUX genes have closer affinities with P. alba and A. thaliana, and more distant affinities with P. patens and S. moellendorffii (Figure 1).
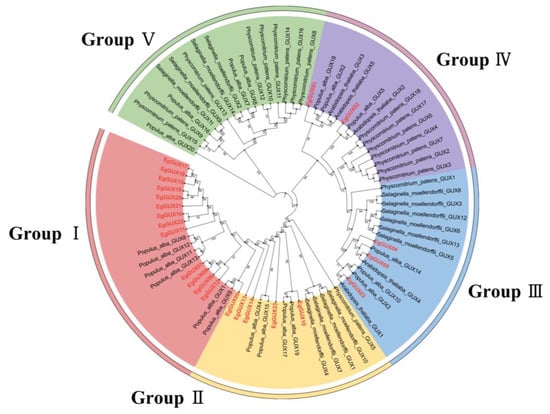
Figure 1.
Phylogenetic analysis of GUX genes. the GUXs in E. grandis (23), A. thaliana (5), S. moellendorffii (14), P. patens (18), and P. alba (20) were picked up. A maximum-likelihood phylogenetic tree was generated by MEGA11 with full-length GUX sequences (5000 bootstrap replicates). The five groups are highlighted with red, yellow, green, blue, and purple, respectively.
2.3. Analysis of EgGUX Structures and Conserved Domains
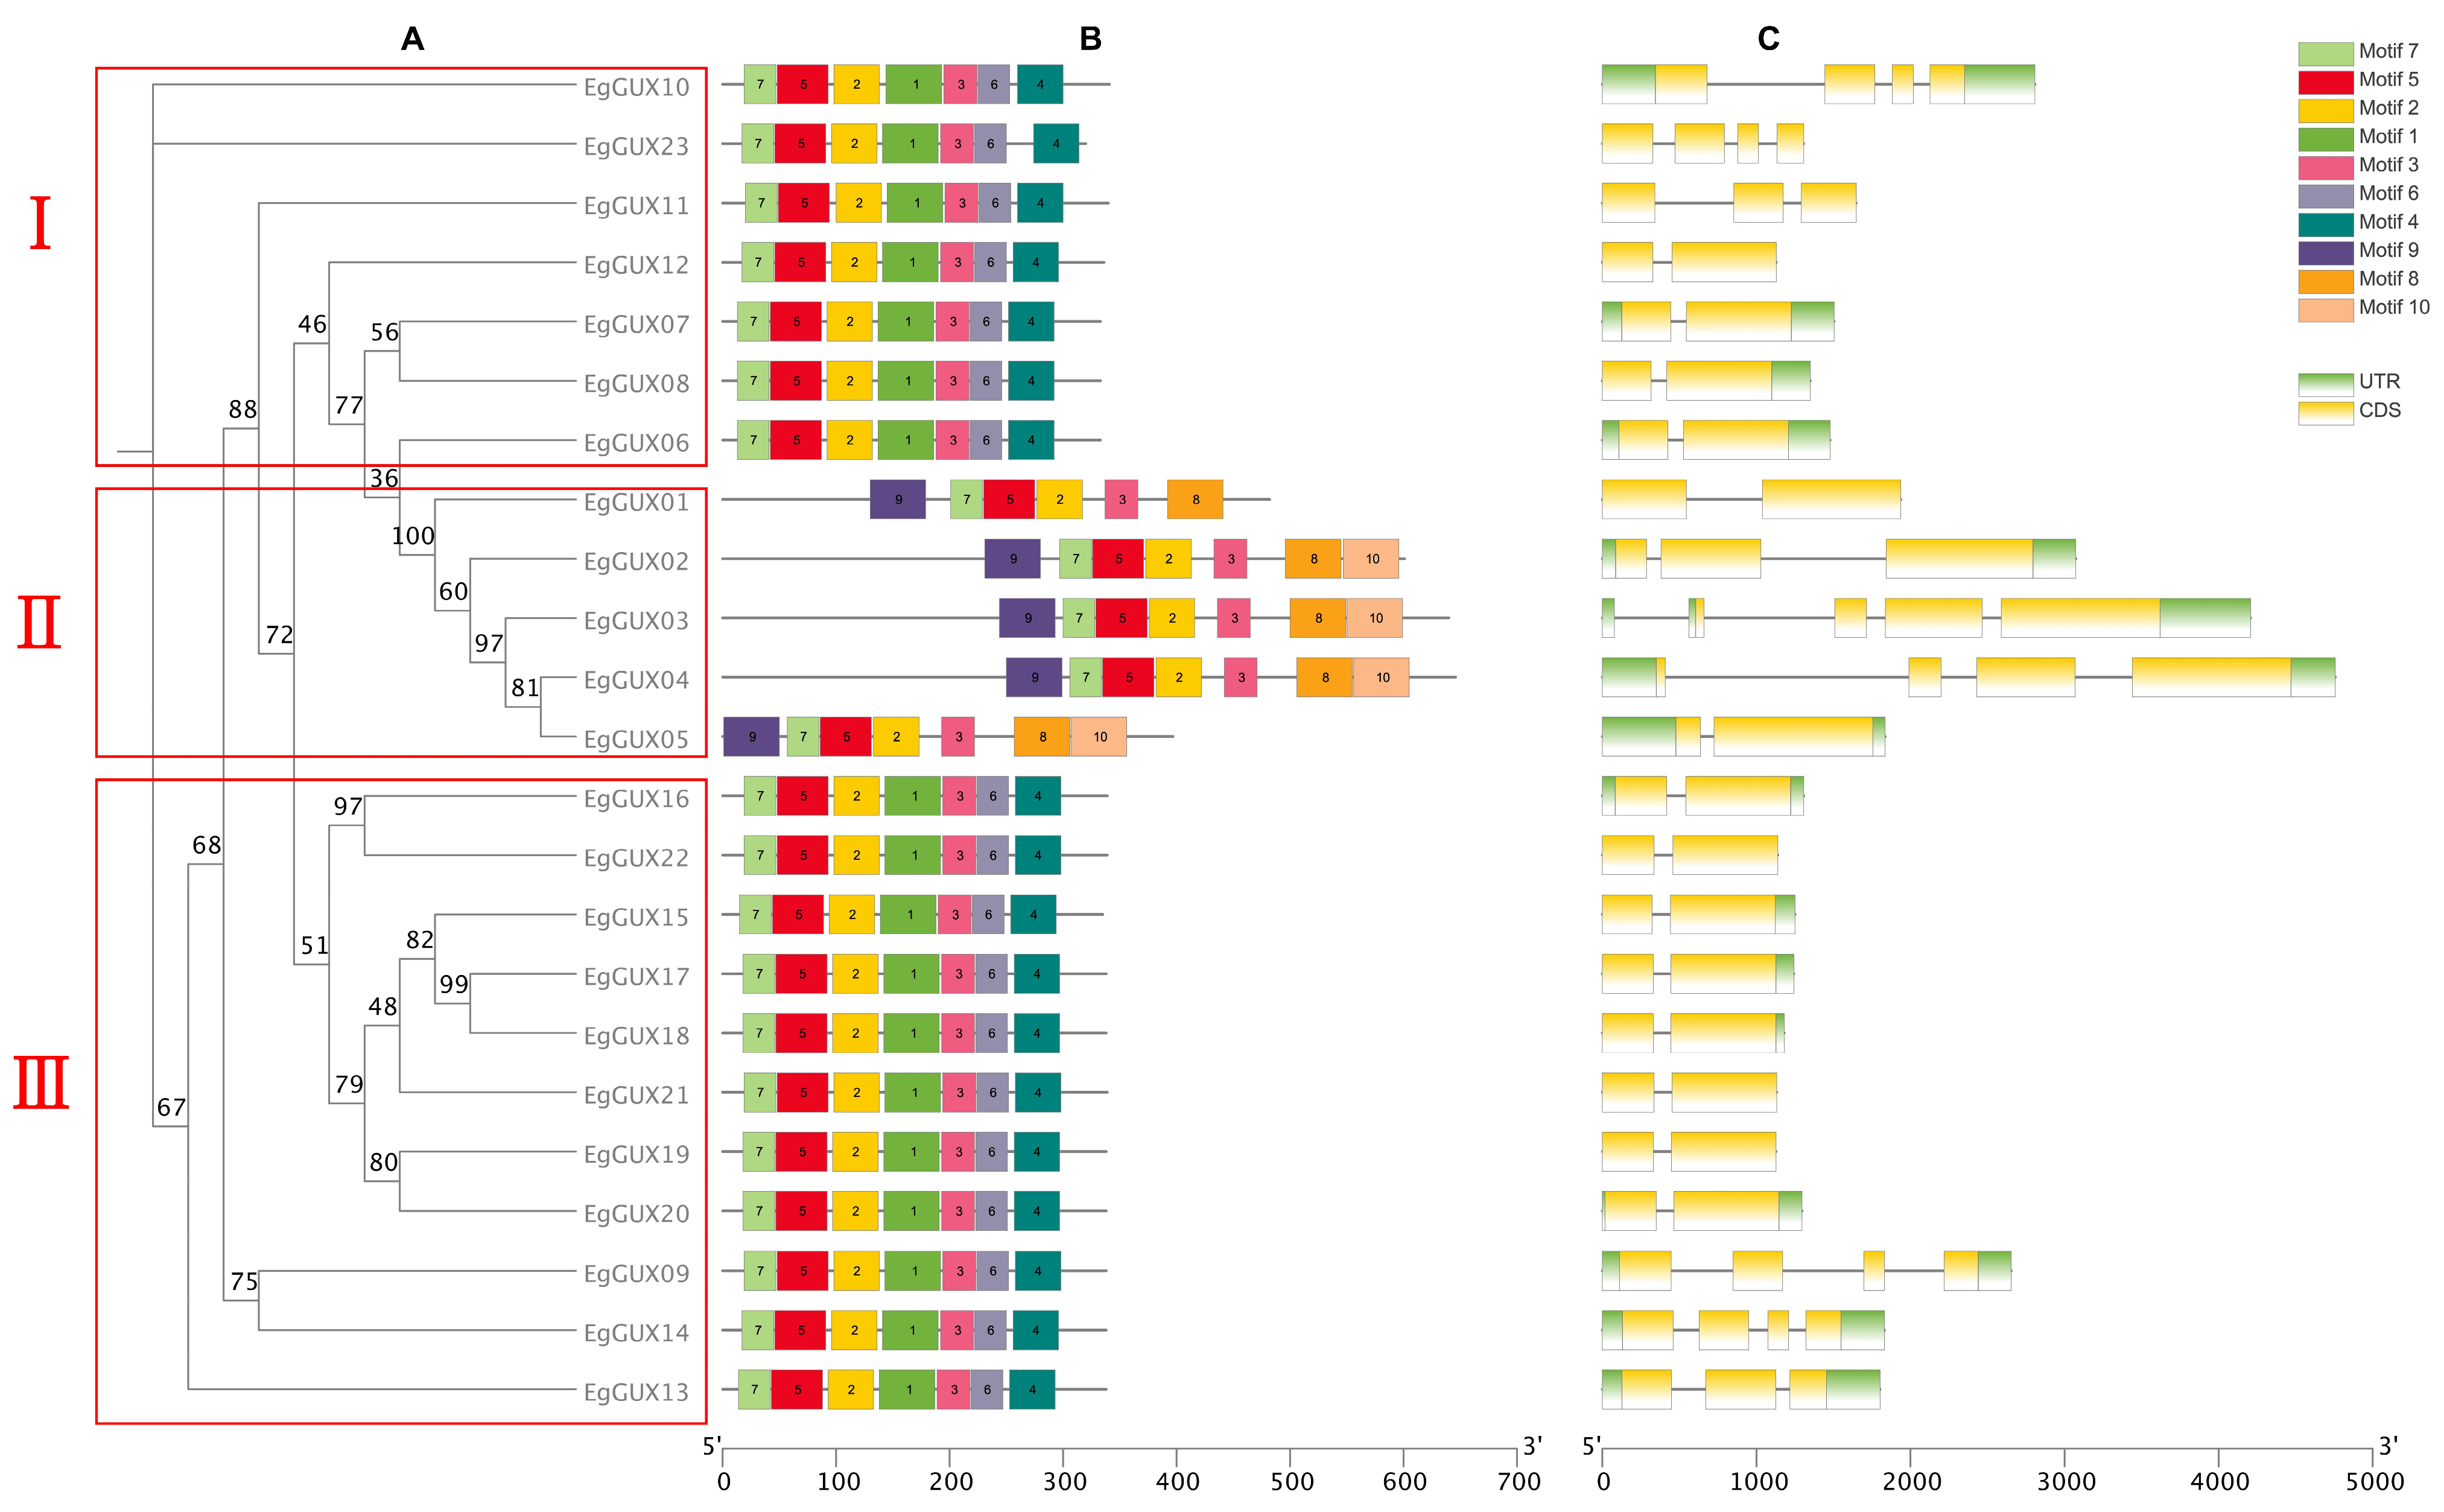
According to protein-conserved motifs, the phylogenetic tree of the 23 EgGUXs was clustered into three classes (Figure 2A). The conserved motifs of the 23 EgGUXs were then presented using the MEME online program (Figure 2B). It is evident that the amino terminus of the 23 GUX proteins generally contains relatively conserved structural domains. Both classes I and III consist of motifs 1 to 7 with identical ordering, while motifs 8 to 10 are found in class II; the members of the EgGUX family in class II also exhibit identical ordering. The structural organization of the genes, based on coding sequences (CDSs) and untranslated regions (UTRs), was analyzed using TBtools (Figure 2C). The results show that the distribution of introns varies among individual genes within the EgGUX members.
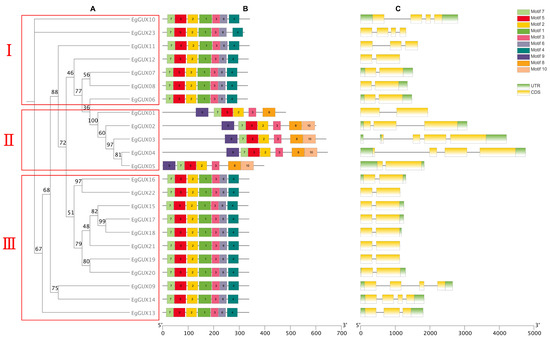
Figure 2.
Predicted EgGUX protein phylogeny, conserved amino acid motifs, and gene structure. (A) Rooted maximum-likelihood phylogeny of EgGUX proteins, showing subfamily classification. (B) Motif compositions of GUX in E. grandis are presented in different colors ranging from motif 1 to 10. (C) Position of exons and introns in the EgGUX gene models. At the bottom of the figure, the relative position is proportionally displayed based on the kilobase scale.
2.4. Chromosomal Localization of GUX Gene Family Members
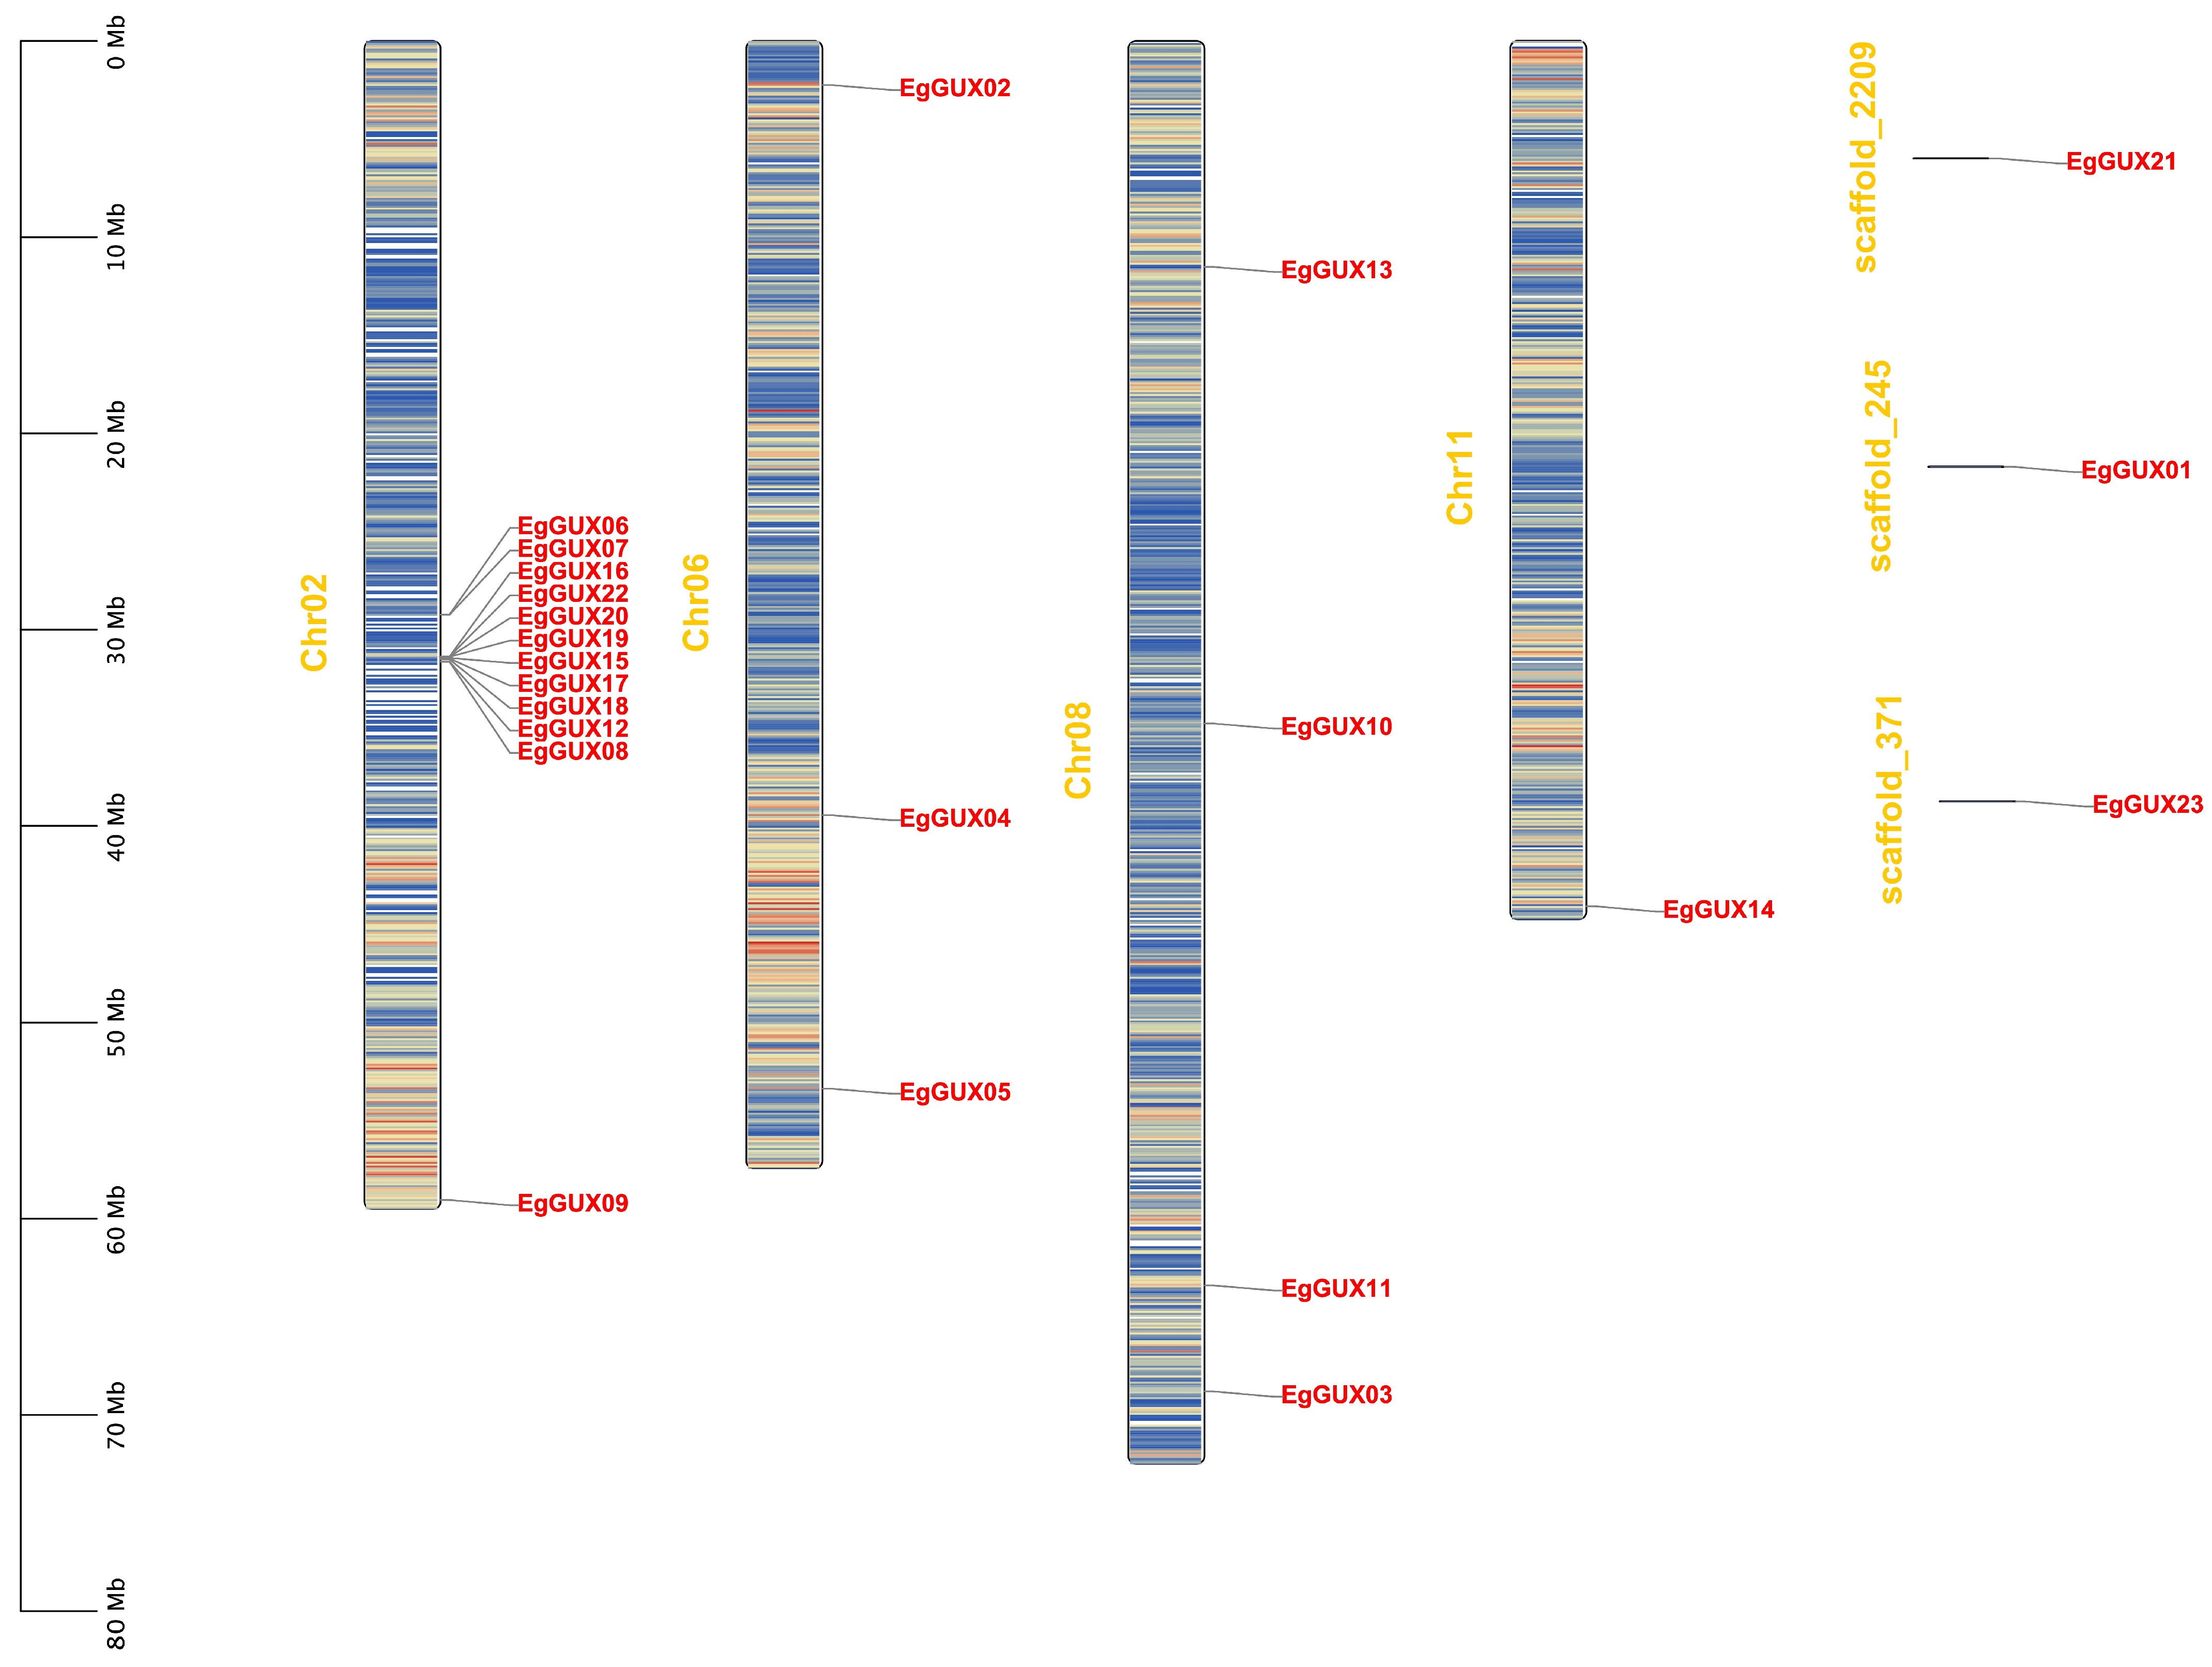
A large proportion (34%) of genes in the E. grandis genome were expanded by tandem duplications [17]. Twenty genes were located on four chromosomes according to the annotation file, and three genes were not presented on the chromosomes but on three different scaffolds (Figure 3). These 20 genes are distributed in various patterns, including both clustered and independent distribution. Notably, 11 EgGUXs formed a high-density gene island clustered on Chr02.
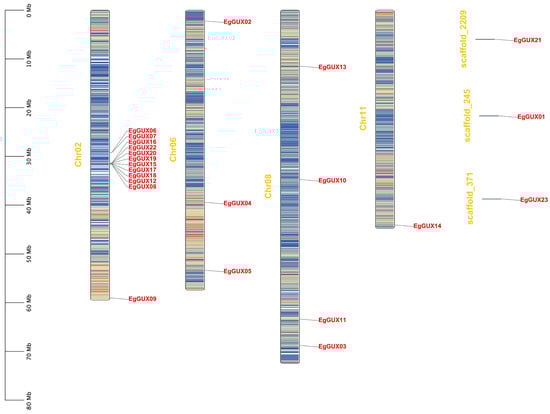
Figure 3.
Chromosomal locations of EgGUX genes. The chromosome number is shown on the middle of each chromosome. The scale bars represent the length in mega-bases (Mb). Red areas of each chromosome indicate high gene density. Blue areas indicate low gene density.
2.5. Analysis of Intraspecific and Interspecific Collinearity in the EgGUX Family Genes
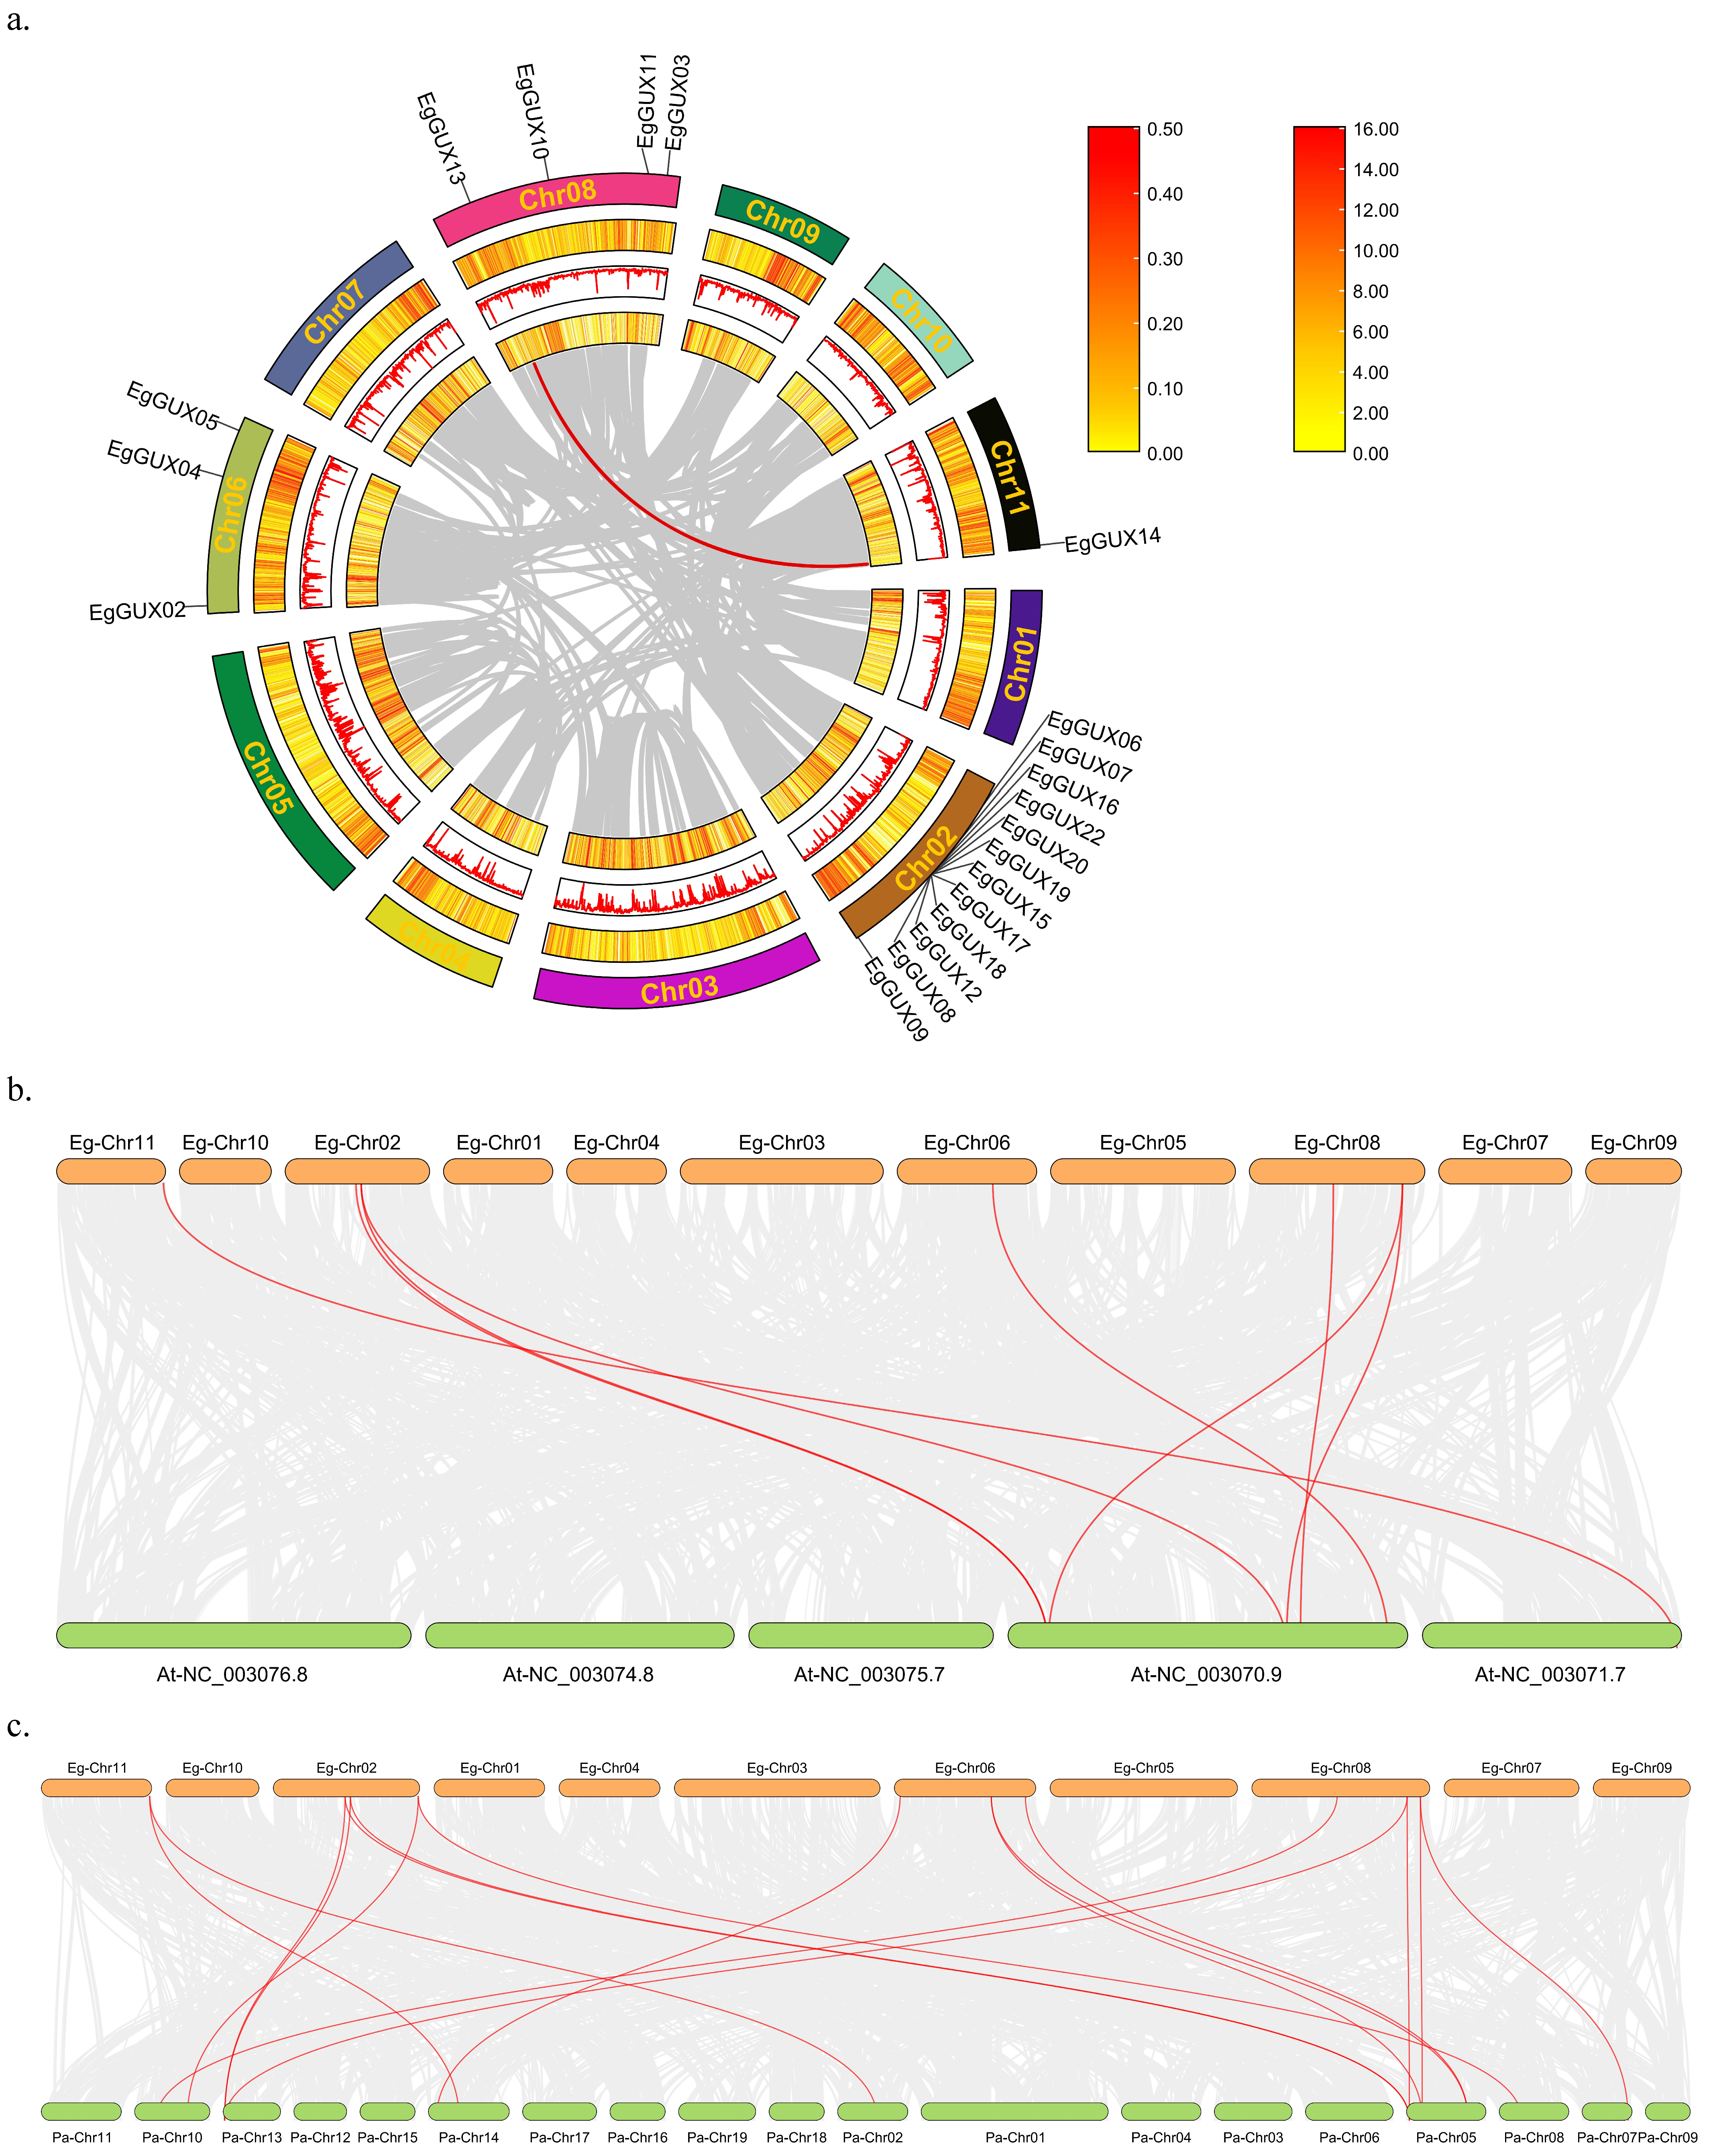
Events through genome-wide, segmented, dispersed, or tandem gene duplication are considered major drivers of evolution [18]. To analyze the genome-wide duplication of the EgGUXs, members of the E. grandis GUX gene family were subjected to collinearity analysis (Figure 4a). The results revealed that this gene family undergoes self-replication at a very low frequency in E. grandis, with only one pair of tandem and segmental duplications, EgGUX13 and EgGUX14.
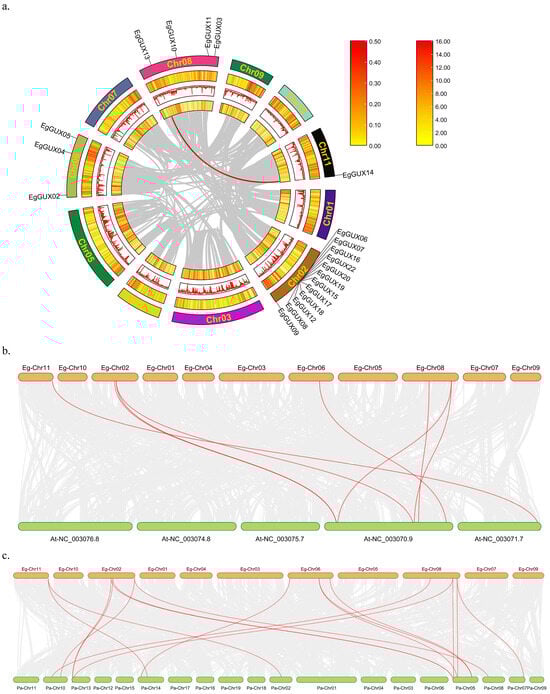
Figure 4.
Collinearity relationship of GUX family members of E. grandis, A. thaliana, and P. alba. Intraspecific collinearity relationship of GUX family members of E. grandis (a) The gray line indicates all collinearity blocks in the E. grandis genome, and the red line indicates the segmental repeats of the EgGUX genes. Interspecies collinearity relationship among E. grandis and A. thaliana (b) and E. grandis and P. alba. (c) The gray line indicates all collinearity blocks in the genomes, and the red line indicates the collinearity of GUX genes.
Further analysis of interspecific co-linkage relationships using the A. thaliana and P. alba genomes showed (Figure 4b) that 8 co-linkage pairs were formed between the A. thaliana and E. grandis genomes, and 17 co-linkage pairs were formed between the P. alba and E. grandis genomes. This suggests that P. alba and E. grandis may have closer phylogenetic relationships.
2.6. Analysis of Cis-Acting Elements of the Promoter on the EgGUX Gene Family
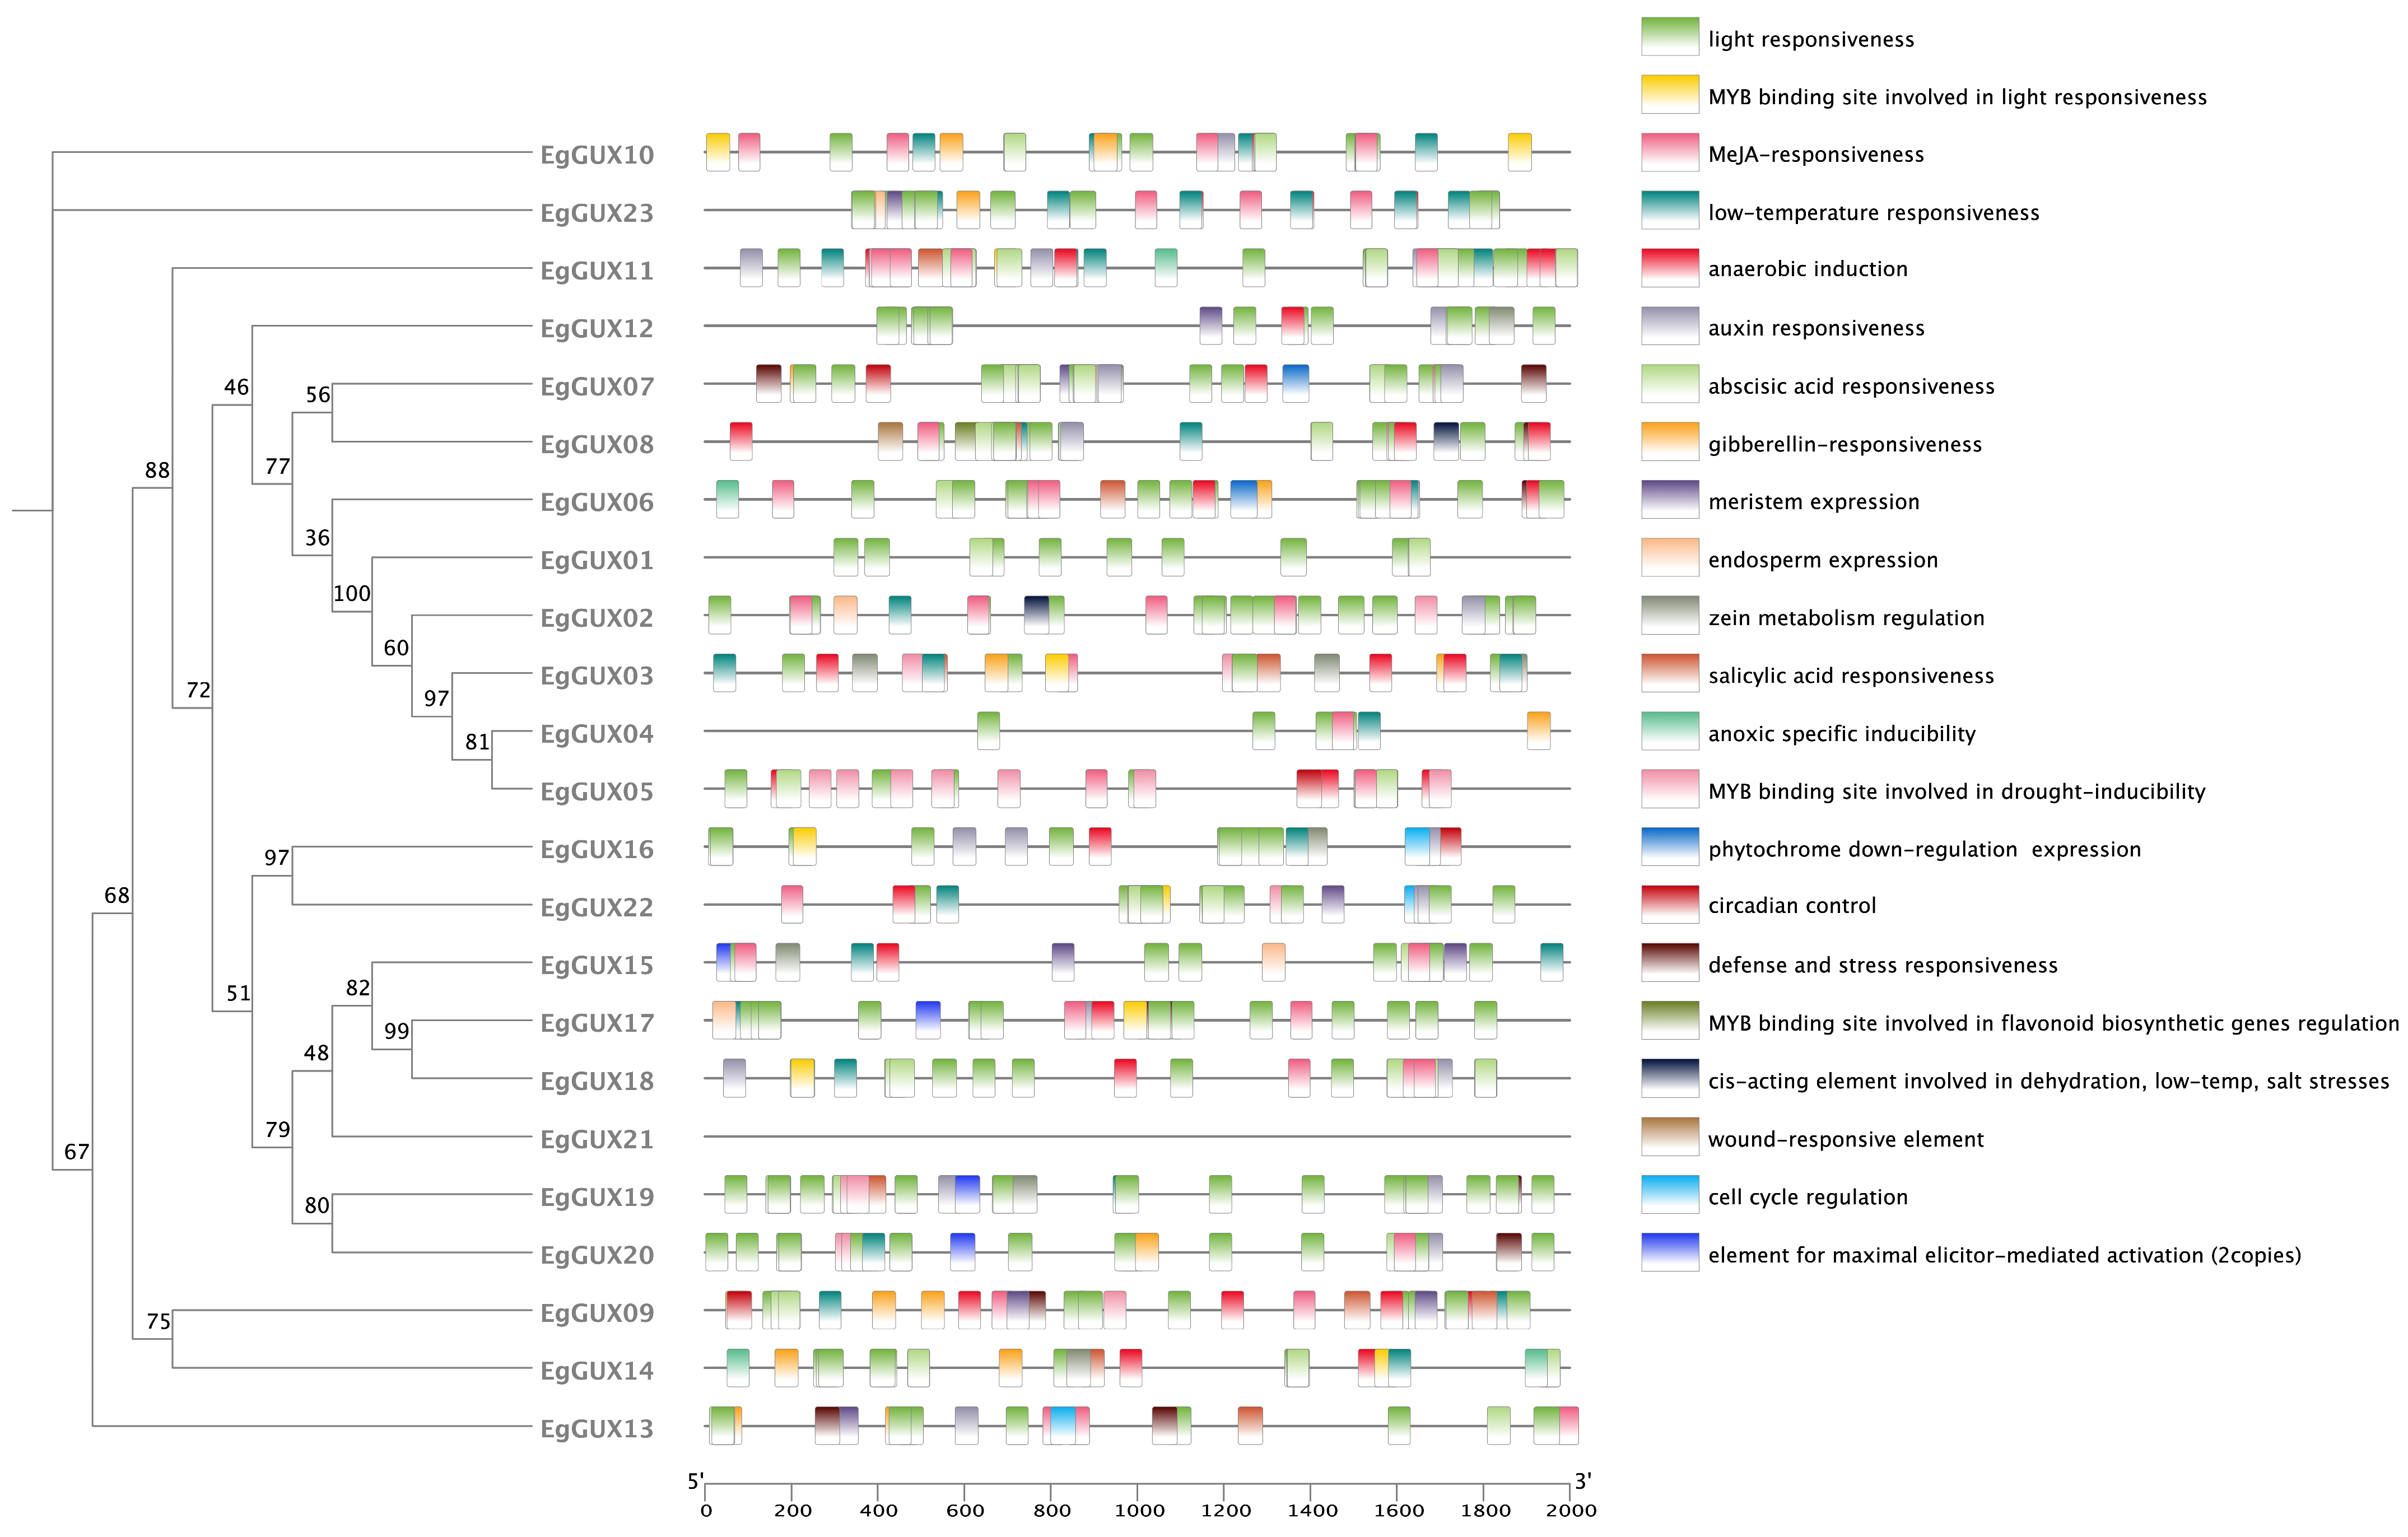
Gene expression can be regulated by the binding of transcription factors (TFs) to cis-elements within their promoter regions [19]. The cis-acting elements in the 2000 bp promoter region upstream of the EgGUXs were analyzed together with phylogenetic tree (Figure 5). Out of the 22 EgGUXs, 22 response elements were selected and predicted, except for EgGUX21, which lacks promoter regions (Table S2). These were divided into four categories: light-responsive elements, hormone-responsive elements, growth and development-responsive elements, and stress-responsive elements. Light response elements were the most numerous, and almost EgGUXs include hormone-responsive elements, including those responsive to auxin, abscisic acids, gibberellin, MeJA, and SA. Additionally, there were seven types of growth and development response elements and six types of stress response elements.
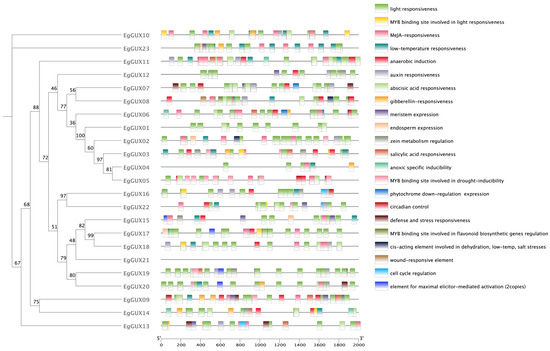
Figure 5.
Analysis of cis-acting elements in promoters of GUX gene family in E. grandis. The 22 squares on the right represent the various cis-acting elements of the promoter.
2.7. Expression of EgGUXs in Different Tissues of E. grandis
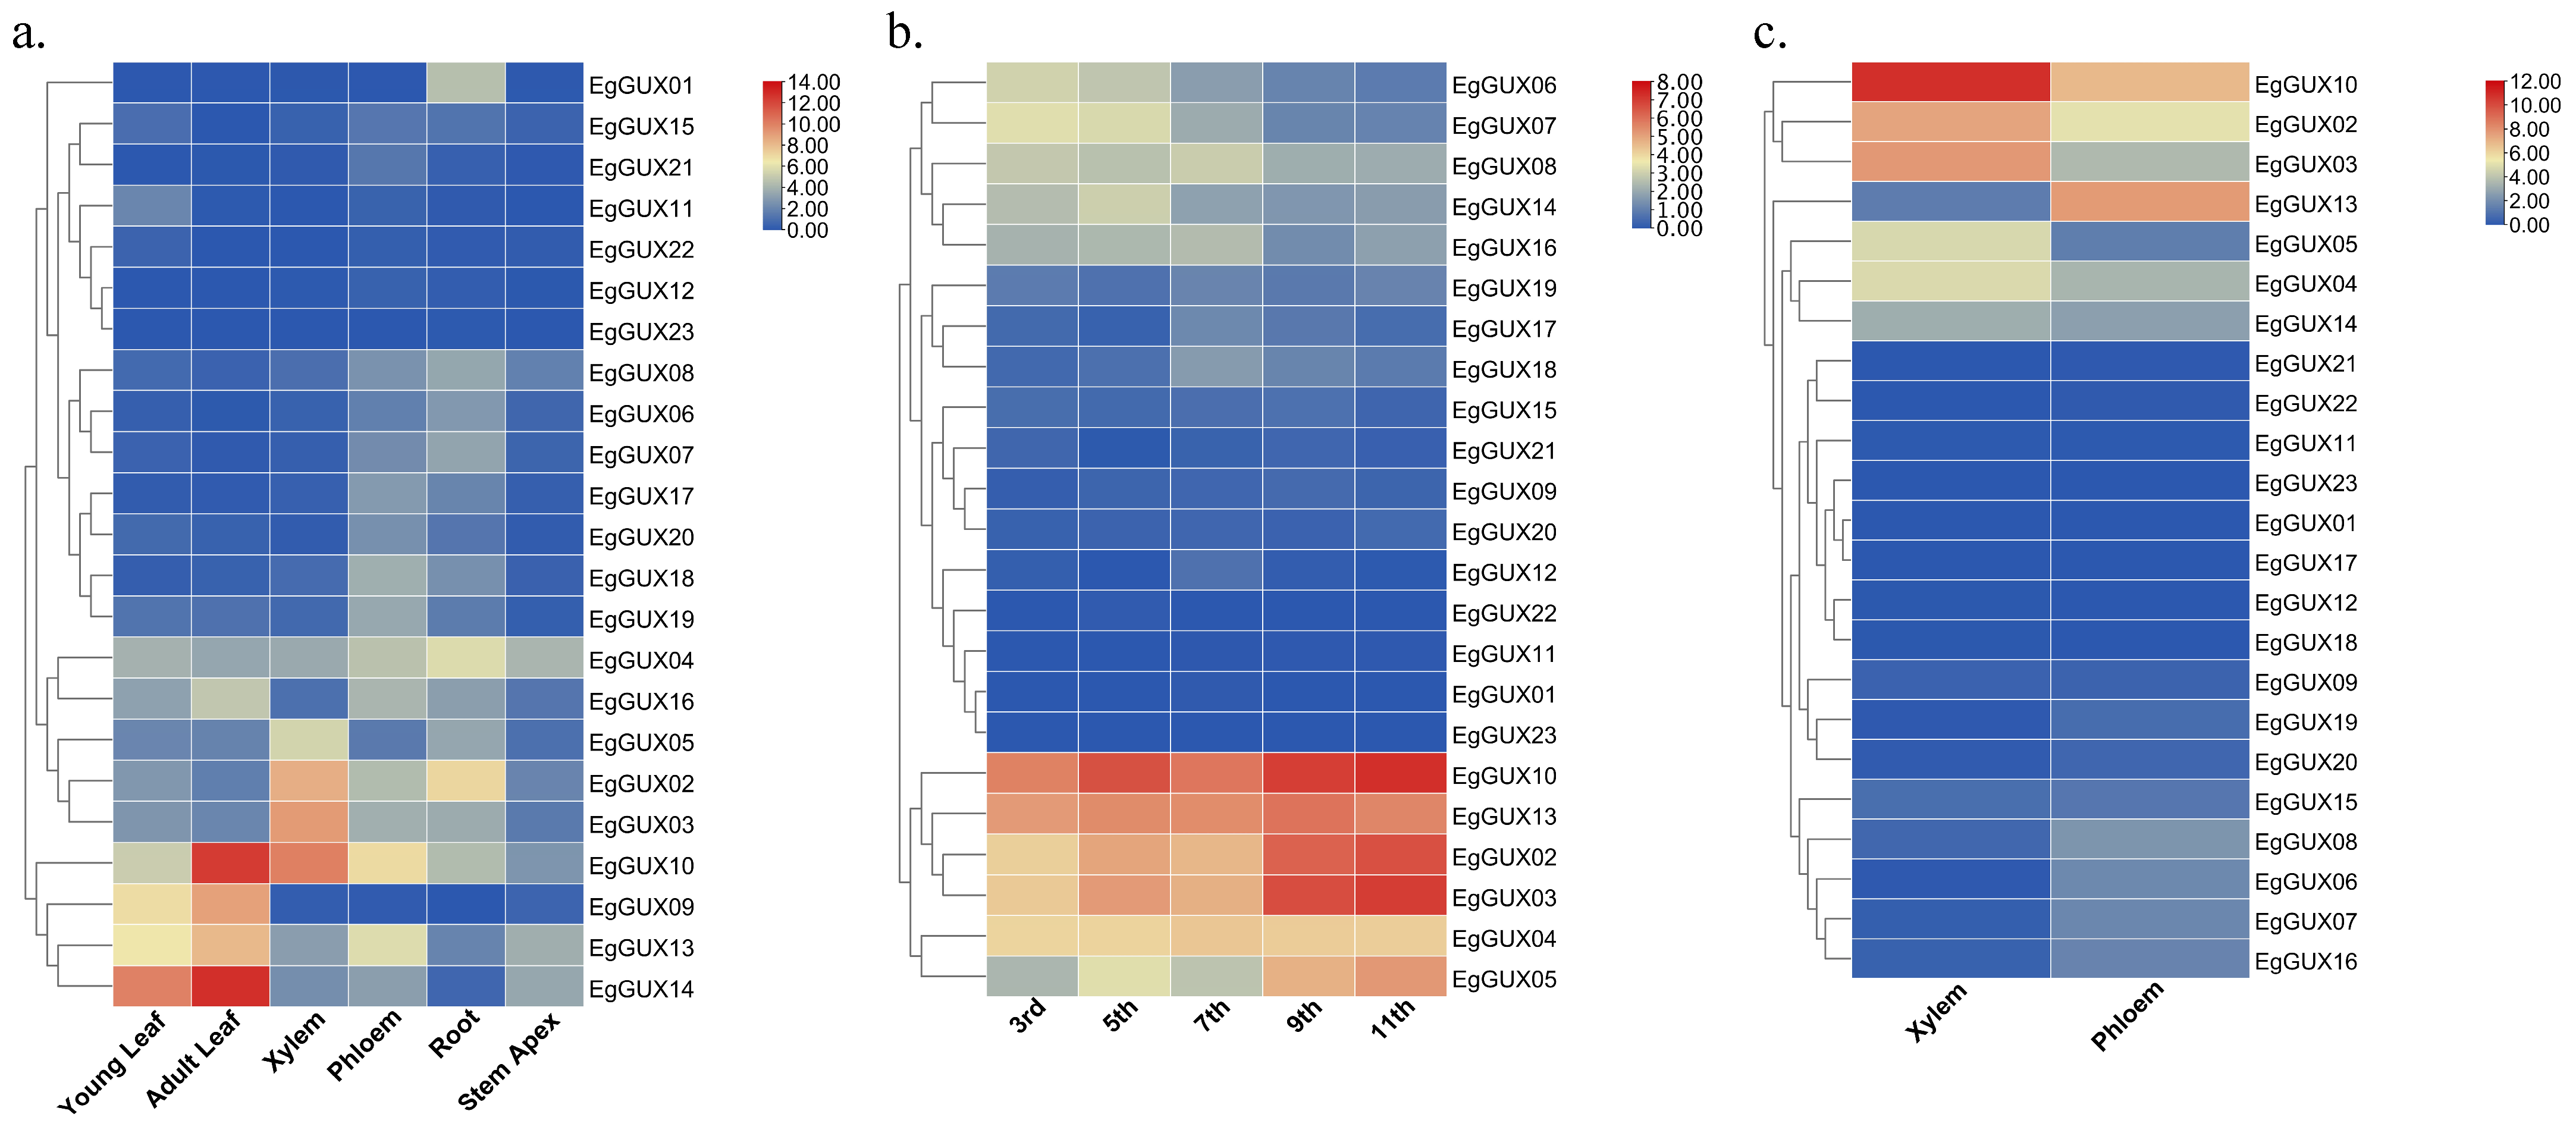
To gain a deeper understanding of the expression patterns of EgGUXs in different tissues of E. grandis, expression profiles were conducted. These tissues included 6−month−old young leaves, adult leaves, xylem, phloem, roots, and the stem apex. The results revealed varying degrees of expression across all tissues. In adult leaves, the expression of EgGUX09, EgGUX10, EgGUX13, and EgGUX14 was higher (Figure 6a). In contrast, in stems, the expression of EgGUX02, EgGUX03, EgGUX04, EgGUX05, EgGUX10, and EgGUX13 was significantly higher in the third, fifth, seventh, ninth, and eleventh internodes (Figure 6b). In 6−year−old trees, only EgGUX02, EgGUX03, and EgGUX10 showed higher expression in xylem, while the expression of other EgGUXs in other tissues was relatively low (Figure 6c).
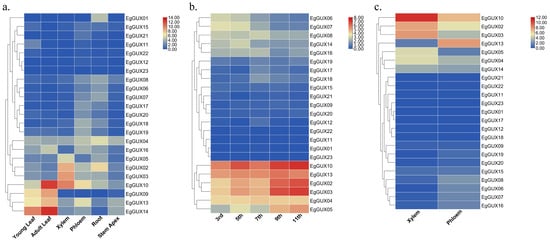
Figure 6.
Heatmap of EgGUX gene expression in different tissues. (a) Heatmap of expression in 6−month−old young leaves, adult leaves, phloem, xylem, roots, and stem apex. (b) Expression heatmap in 6−mont−old tree of 3rd, 5th, 7th, 9th, and 11th internodes. (c) Expression heatmap in 6−year-old xylem and phloem of E. grandis. Expression values based on RNA-seq are shown from blue to red, indicating low to high expression.
2.8. Expression of EgGUX Genes under Abiotic Stress and Phytohormone Treatments
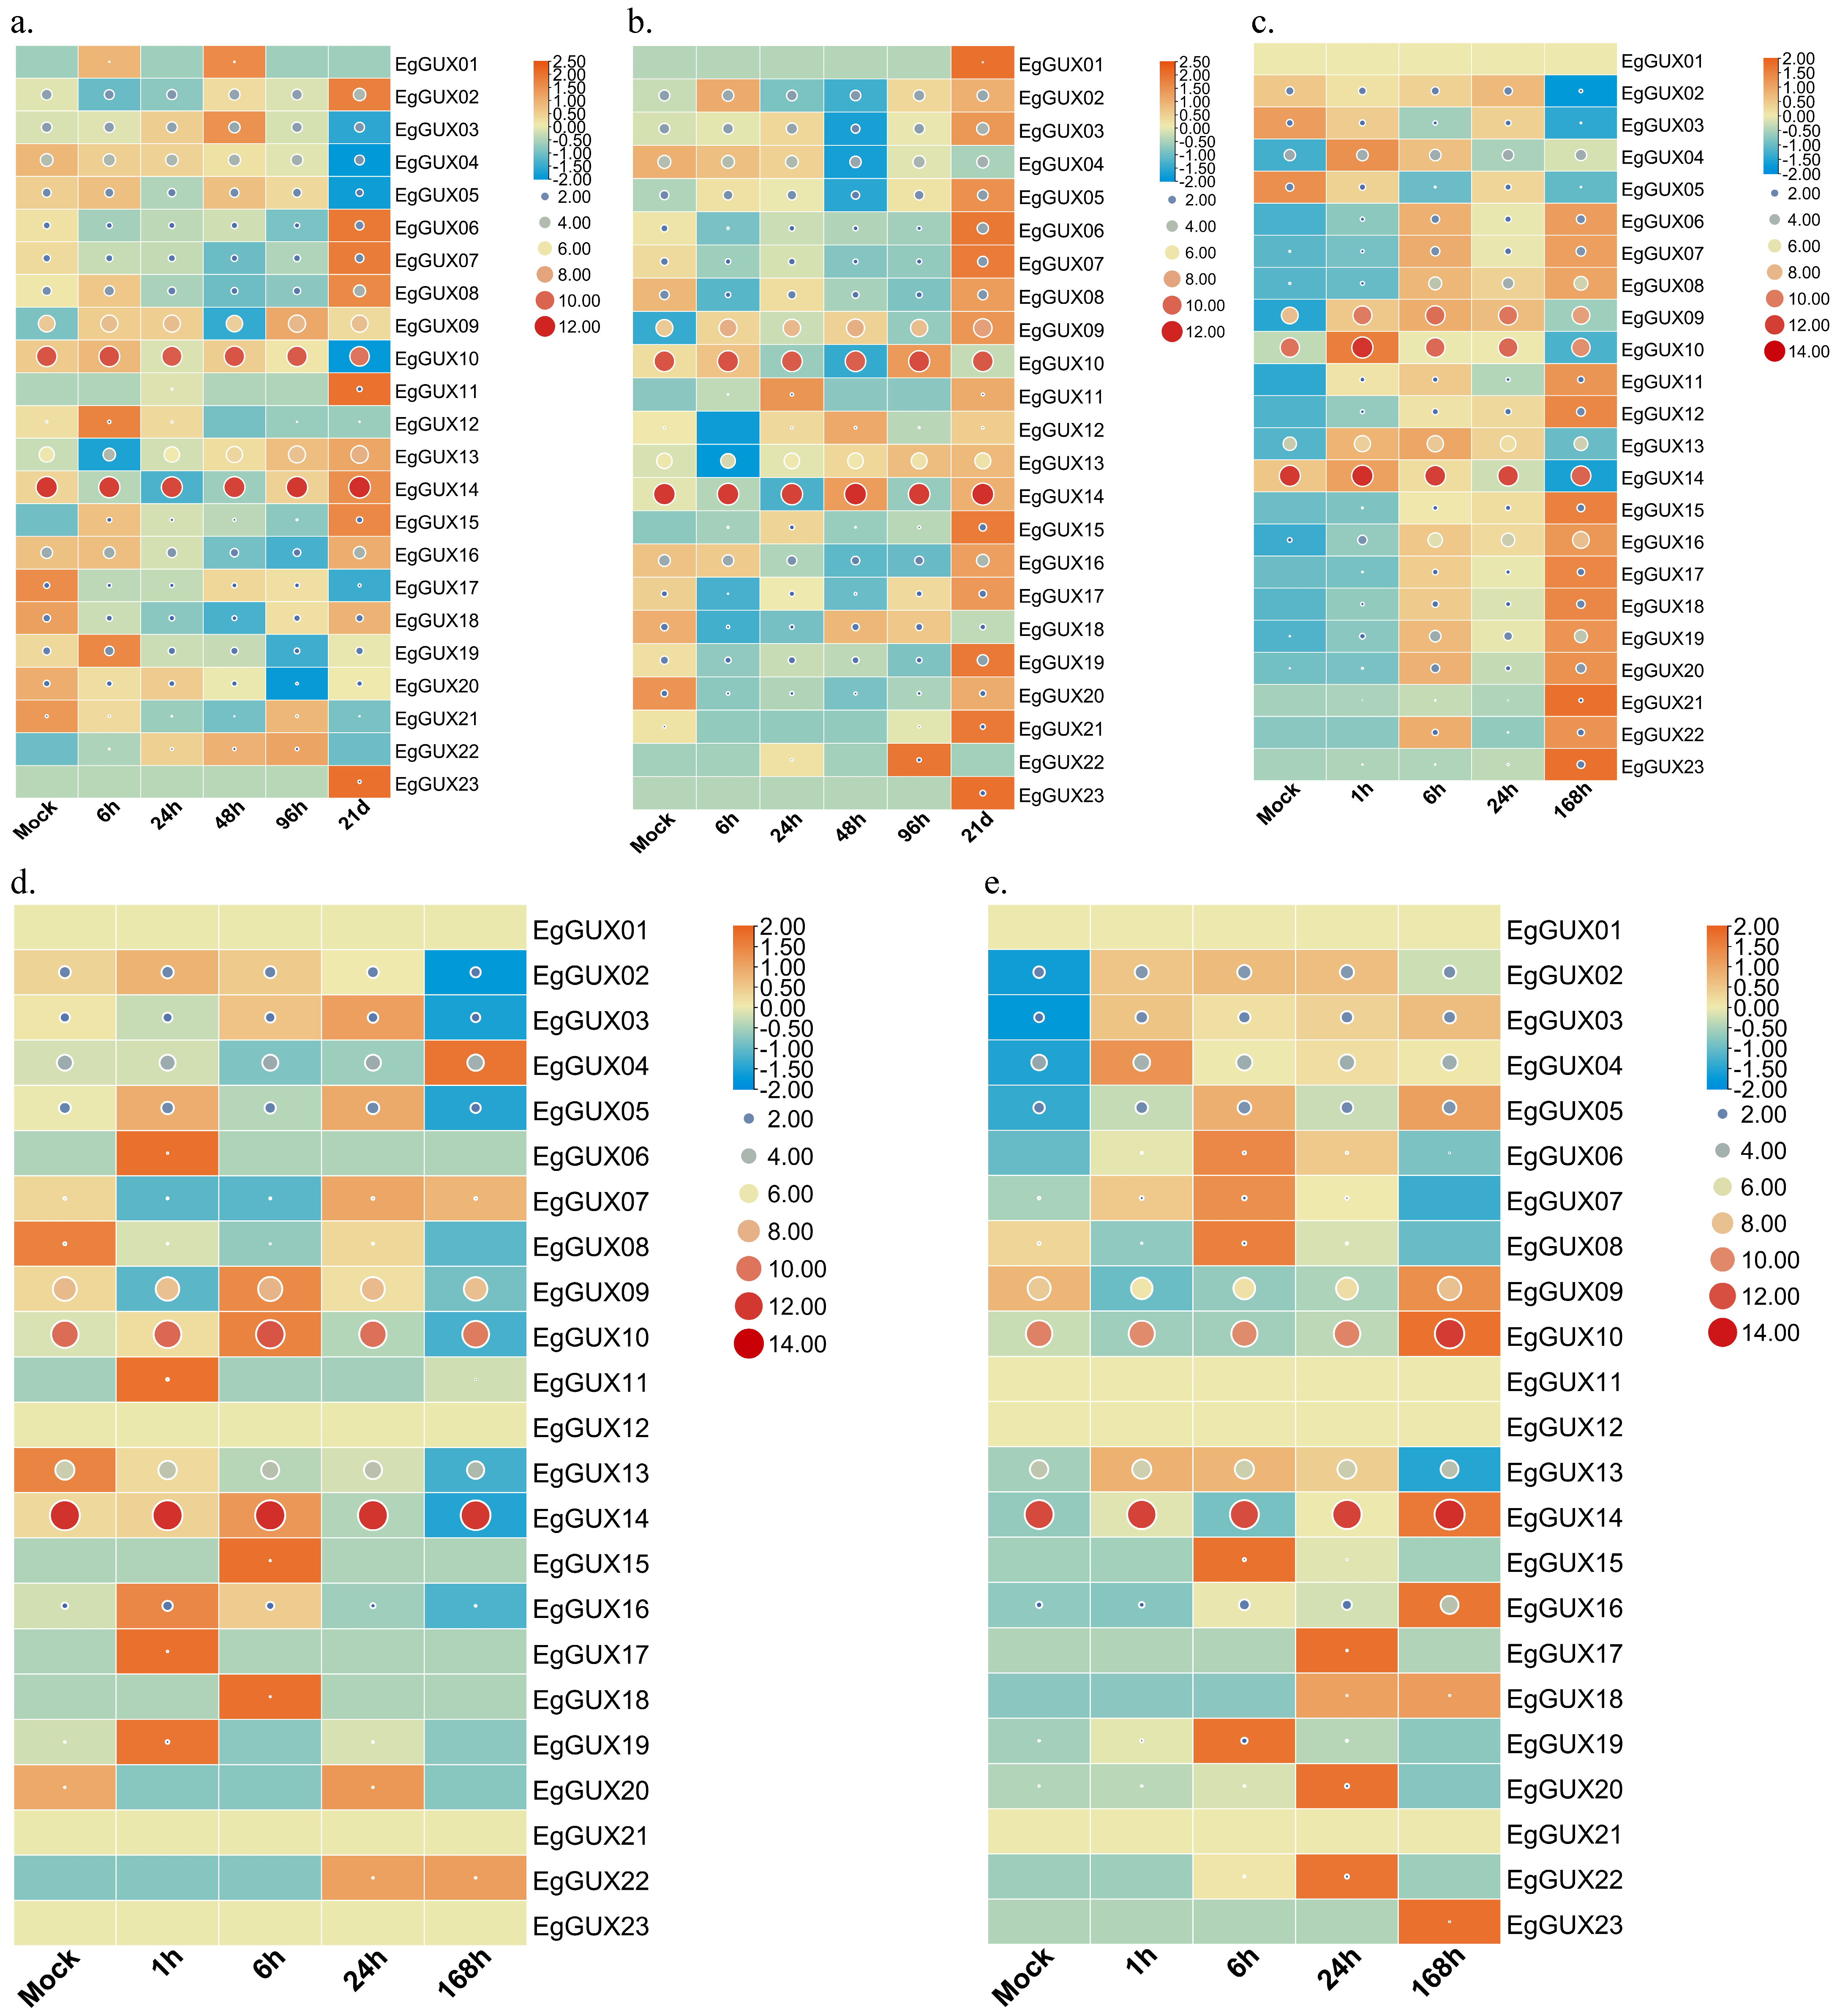
To explore the differential expression of EgGUX genes in response to abiotic stress and phytohormone treatments, shoots of 2−month−old E. grandis were exposed to boric acid deficiency, phosphorus deficiency, and salt stress, while the leaves were sprayed with SA and MeJA. The raw expression data represented by the circular graphs revealed that EgGUX09, EgGUX10, and EgGUX14 exhibited higher expression levels under conditions of boric acid deficiency, phosphorus deficiency, salt stress, SA treatment, and MeJA treatment. Row normalization using the rectangle graphs technique revealed that the expression of EgGUX09, EgGUX10, and EgGUX14 showed significant differences with increased treatment. Additionally, the differential expression of EgGUX02, EgGUX03, EgGUX04, and EgGUX05 was also more pronounced (Figure 7).
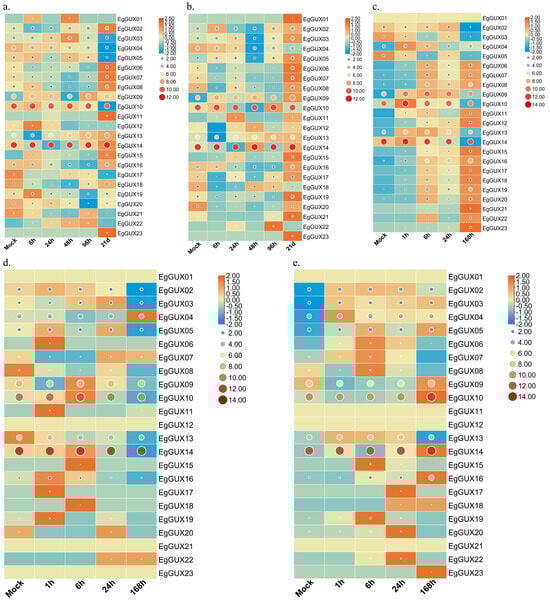
Figure 7.
Heatmap of EgGUX gene expression under abiotic stress and phytohormone treatment. (a) Heatmap of expression in 2−month−old shoots at 0, 6, 24, 48, 96 h, 21 d of boron deficiency treatment. (b) Heatmap of expression in 2−month−old shoots at 0, 6, 24, 48, 96 h and 21 d of phosphorus deficiency treatment. (c) Heatmap of expression in 2−month−old young leaves under salt stress treatment for 0, 1, 6, 24, 168 h. (d) Heatmap of expression in 2−month−old young leaves under SA treatment for 0, 1, 6, 24, 168 h. (e) Heatmap of expression in 2−month−old young leaves under MeJA treatment for 0, 1, 6, 24, 168 h. Scaled log2 expression values based on RNA-Seq data are shown from blue to red, indicating low to high expression. The size and color of the circles represent the original numerical size of the EgGUXs protein expression. The larger the circle and the redder the color, the higher the expression; the smaller the circle and the bluer the color, the lower the expression. The rectangle graphs were row normalized, with bluer colors indicating lower expression at that treatment length, and more orange colors indicating higher expression at that treatment length.
2.9. 3D Structure Analysis of E. grandis GUX Gene Family Members
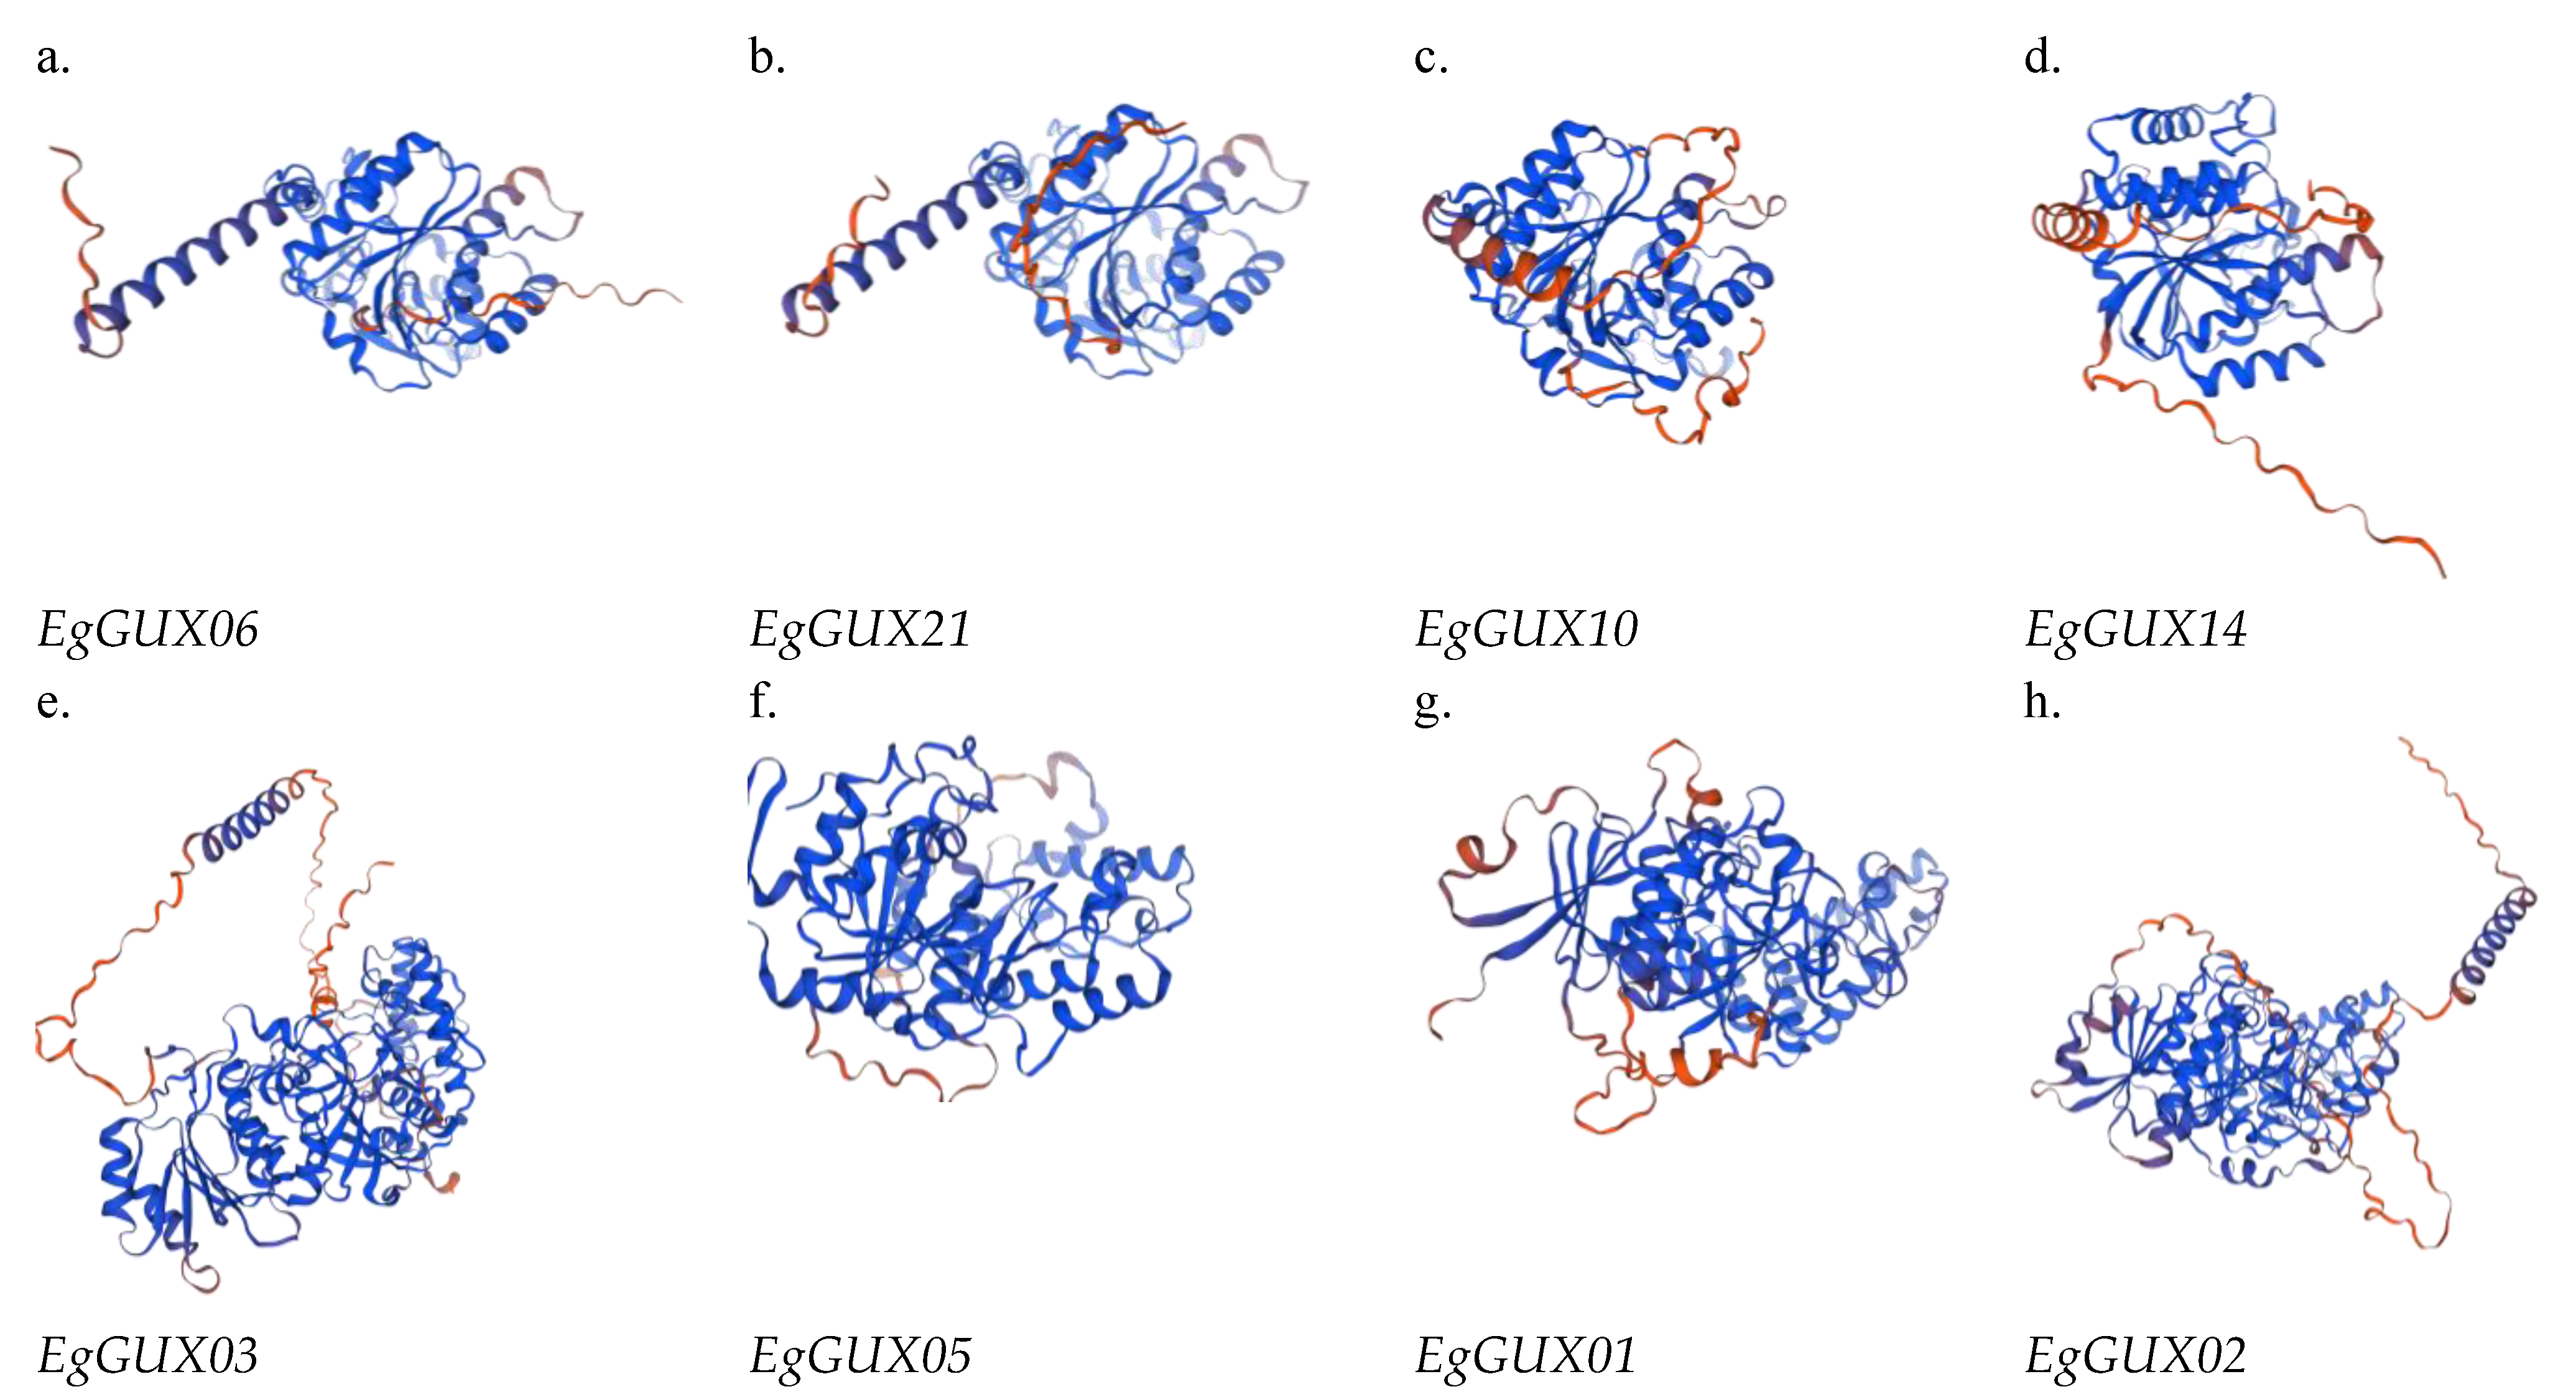
After utilizing SWISS-MODEL for homology modeling and SAVES for evaluation, the 3D structures of several representative EgGUX proteins were successfully obtained (Figure 8). The 3D structures within the same subfamily exhibit considerable similarity, with minimal differences (Figure 8). However, when comparing structures from different subfamilies, more pronounced differences are observed. These structural variations primarily arise from the diverse lengths of α-helices, β-turns, and irregular convolutions present in each protein. These differences in structural elements lead to variations in the spatial folding angles, which in turn may underlie the distinct functional roles performed by these proteins.
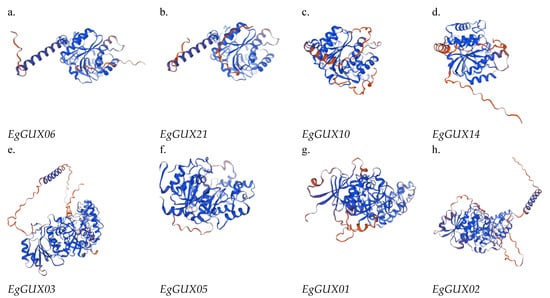
Figure 8.
3D structure analysis of EgGUX gene family members. (a) Three-dimensional structure of subfamily I EgGUX06 proteins. (b) Three-dimensional structure of subfamily I EgGUX08 proteins. (c) Three-dimensional structure of subfamily II EgGUX10 proteins. (d) Three-dimensional structure of subfamily II EgGUX14 proteins. (e) Three-dimensional structure of subfamily III EgGUX03 proteins. (f) Three-dimensional structure of subfamily III EgGUX05 proteins. (g) Three-dimensional structure of subfamily IV EgGUX01 proteins. (h) Three-dimensional structure of subfamily IV EgGUX02 proteins.
3. Discussion
With the development of molecular biology techniques, the GT8 gene family has been identified in detail in an increasing number of plants, such as cotton and sugarcane. These studies have played an important role in cell-wall hemicellulose modification. The GT8 family has been associated with the biosynthesis and modification of plant cell walls [20], and there exists a functional divergence. Specifically, the glucuronosyltransferase (GUX) family catalyzes the binding of glucuronide (GlcA or MeGlcA) to xylan side chains [5,7]. In model plants, the GUX genes are involved in decorating cell wall hemicellulose by adding glucuronic acid substitutions to the xylan skeleton. Additionally, the irregular xylem (IRX) genes IRX8 and galacturonosyltransferase-like 1 (PARVUS) also belong to the GT8 family, which functions on the tetresacharride reducing end of xylan [6,8,11].
Mutations in the GUX genes increase the enzyme’s affinity for cell wall polysaccharides, thereby reducing biomass recalcitrance in A. thaliana, which is of economic importance to the biotechnology industry. Mutations in GUX genes were reported to reduce the presence of such residues, hindering the access of cellulases to biomass and increasing saccharification yield [5,11,21].
Since glucuronic acid is negatively charged, an increase in glucuronic acid can help hemicellulose to better separate from cellulose, resulting in producing more cellulose nanofibrils (CNFs) [22]. CNFs have great potential in papermaking, packaging, optoelectronics, and other fields because of their good biocompatibility, reproducibility, high mechanical properties, good hydrophilicity, and high light transmittance. By analyzing the role of the GUX gene family in Eucalyptus, using CRISPR-Cas9, overexpression, and other technologies for molecular breeding, and regulating the synthesis efficiency of the glucuronic acid side chain and improving the chemical components of lignocellulosic raw materials, we can utilize CNFs to realize efficient industrial application and provide a new idea for genetic improvement in Eucalyptus.
In this study, we determined that the number of GUX proteins in E. grandis (23) is approximately five times the number of GUX proteins in A. thaliana (5) [9]. This suggests that the GUX gene family has significantly expanded throughout evolution in E. grandis, which is consistent with the number of 31 GUX proteins in cottons [23]. Furthermore, our analysis of the physicochemical properties of these 23 proteins revealed that more than half of them exhibited structural instability. Based on the numbers of these gene families, we speculated that the GUX genes might be increase in more lignocellulose plants.
The phylogenetic tree analysis of E. grandis, A. thaliana, S. moellendorffii, P. patens, and P. alba indicates that the EgGUX proteins of EgGUX01~EgGUX05 are closely related to AtGUX1, AtGUX2, and AtGUX4, which have been definitively shown to possess glucuronosyltransferase activity. All of these belong to Group III. It is presumed that these three EgGUX proteins have a higher likelihood of glucuronosyltransferase activity. These results indicated that these EgGUX proteins might function on add GlcA into xylan side-chain. Meanwhile, the expression heatmap derived from RNA-Seq data revealed that the EgGUX10 and EgGUX14 were most prominently expressed in 6−month−old E. grandis young leaves, adult leaves, xylem, phloem, and stem apexes. EgGUX10, EgGUX02, EgGUX03, EgGUX13, EgGUX04, and EgGUX05 were highly expressed in the 3rd, 5th, 7th, 9th, and 11th stem nodes of 6−month−old grown E. grandis, as well as in the xylem and phloem of 6−year−old E. grandis. This could be due to the greater demand for xylans and more complicated synthesis mechanisms in woody plants, so other GUX genes can also express highly.
Cis-elements play a crucial role in the regulatory network controlling plant growth and development. The promoter regions of almost all EgGUX genes contain cis-elements that may be responsive to hormones such as auxin, ABA, gibberellin, SA, and MeJA. These cis-elements are essential for plant growth and development and stress response, suggesting that the EgGUX gene family may be involved in growth, development, and resistance in E. grandis.
Based on RNA-Seq data, the heatmap analysis revealed that several members of the EgGUX family were significantly expressed in the phloem and xylem, while others were prominently expressed in leaves. Overall, EgGUX members demonstrated stronger expression in stems, xylem, and adult leaves. This could be attributed to the higher presence of secondary cell walls in stems of Eucalyptus, requiring increased glucuronide xylan for growth and development. When exposed to abiotic stress and phytohormone treatments, EgGUX09, EgGUX10, and EgGUX14 exhibited higher expression levels and more significant differential expression patterns. Meanwhile, the expressions of EgGUX01~EgGUX05, which are more closely related to the AtGUXs, did not change regularly with treatment time. This suggests that the GUXs have undergone evolutionary and functional divergences.
4. Material and Methods
4.1. Plant Materials
In this study, the plant material utilized was the E. grandis clone GL1. The clone was cultivated from a single plant that showed cold-resistance characteristics during a cooling disaster in Jiangxi Province, China, in 2005. The researchers propagated the tissue culture seedlings of the single plant in April 2006, and named the clone GL1 [24]. The rooted shoots of the in vitro plants were cultivated in a controlled environment at the Research Institution of Tropical Forestry (located at E 113.385°, N 23.191°), which is part of the Chinese Academy of Forestry in Guangzhou, China. Tissue samples, including root, mature and young leaves, xylem, and phloem, were harvested from 6−month−old shoots grown in the greenhouse of the same institution. Additionally, various stem internodes—specifically the 1st (shoot apex), 3rd, 5th, 7th, 9th, and 11th—were collected from these 6−month−old shoots. Organs and tissues such as xylem, phloem, and cambium were also gathered from 6−year−old trees grown at the Zhenshan nursery (located at E 112.673°, N 23.330°) in Sihui, Zhaoqing, Guangdong, China.
For the nutrient deficiency treatment, 2−month−old plants were subjected to boron deficiency and phosphorus deficiency conditions using half-strength Hoagland’s solution. The pH of the solution was adjusted to 5.8 using NaOH. Following the exposure period, the roots were carefully blotted, immediately frozen in liquid nitrogen, and stored at −80 °C.
For hormonal and stress challenge experiments, shoots were propagated through tissue culture in pots within the greenhouse for a duration of 2 months. Fully expanded young leaves located beneath the apex, ranging from four to eight in number, were selected for hormone and stress treatments. During this period, the shoots attained a length of 25−35 cm. Hormone treatments involved spraying the leaves with 100 μM salicylic acid (SA) and methyl jasmonate (MeJA). Subsequently, the treated leaves were sampled at 0, 1, 6, 24, and 168 h post-treatment. A salinity stress treatment was administered by irrigating the plants with 200 mM NaCl, followed by leaf sampling at the same time intervals. To ensure representation, at least three individual plants were pooled to represent one biological replicate, and triple repeats were performed for different organs and treatments.
4.2. Identification of EgGUX Gene Family Members and Analysis of Physicochemical Properties
The AtGUX gene sequence was initially obtained by downloading it from the TAIR database (http://www.arabidopsis.org, accessed on 7 January 2024). The A. thaliana GUX gene sequence was used as a probe, with the threshold set at e−10 [25], and the homologous sequences were retrieved by BLASTp searching in the E. grandis genome database, thus obtaining the E. grandis GUX gene sequence. Physicochemical properties such as amino acid count, isoelectric point, and molecular weight of the E. grandis GUX family members were analyzed using ProtParam tool provided by the ExPASy website (https://web.expasy.org/cgi-bin/protparam/protparam, accessed on 16 January 2024) [26]. ProtScale tools also can be used to analyze the hydrophilic protein found in ExPASy website (https://web.expasy.org/protscale/, accessed on 16 January 2024).
4.3. Phylogenetic Tree Construction of the GUX Family Genes in E. grandis
In order to study the phylogeny of the GUX gene family, four species, A. thaliana, Selaginella moellendorffii, Physcomitrium patens, and Populus alba were selected for sequence comparisons and sequence similarity analyses with the EgGUXs. Multiple sequence comparisons were performed, and sequence similarities were determined, with the dicotyledonous A. thaliana genome annotated from The Arabidopsis thaliana Information Resource. The genome annotation information for S. moellendorffii and P. patens was obtained from NCBI (https://www.ncbi.nlm.nih.gov/, accessed on 18 January 2024), and the genome annotation information for P. alba was obtained from ‘Science China Life Sciences’ [27]. Homologous proteins from these five species were screened using TBtools software (v2.110) to construct a phylogenetic tree using ML (maximum-likelihood method) with parameters set to UltraFast BootStrap, Bootstrap Number:5000 (Model:Auto, Number of Treads:Auto;). Other parameters were set to default values [28], and the resulting evolutionary tree was classified and annotated using the iTOL (https://itol.embl.de/, accessed on 25 January 2024) website [29].
4.4. Analysis of E. grandis GUX Gene Structure and Conserved Structural Domains
Multiple protein sequence comparisons of EgGUXs were performed using Clustal W in MEGA11 software (v11.0.13) [30], with the parameters set to default values. The results of these comparisons were used to construct a phylogenetic tree using the maximum-likelihood method (ML), with parameters set to UltraFast BootStrap, Bootstrap Number: 5000, Model:Auto, Number of Treads:Auto; other parameters were set to default values. All E. grandis GUX protein family members were classified according to the results of the phylogenetic tree. Conserved motifs of GUX proteins were analyzed using the MEME website (http://meme-suite.org/index.html, accessed on 5 January 2024) [31], with a p-value of <1e−5 for each motif. Gene structures were analyzed using the TBtools software (v2.110), and both the phylogenetic tree and conserved motifs of the GUX proteins were visualized.
4.5. Chromosomal Localization of E. grandis GUX Gene Family Members
The gff3 file in the E. grandis genome was used in Tbtools software to obtain the staining and positioning information of the EgGUX family members and draw the distribution map of the genes on the chromosome. TBtools was used to analyze the distribution of the EgGUX genes on chromosomes and the gene density of each chromosome and to create a map. In the ‘One Density Profile’ feature, the parameter “Bin Size” was selected as 1,000,000, with default values used for the remaining parameters.
4.6. Intraspecific and Interspecific Collinearity Analysis of the E. grandis GUX Family Genes
All genes in the E. grandis genome were compared with each other using TBtools software with default parameters. After importing GC base content, gene density, and the number of undetermined nucleotides, the comparison results were visualized by Advanced Circos. To further analyze the evolutionary relationships of the GUX family genes, collinearity analysis was conducted using the GUX family genes from P. alba and A. thaliana. The results were analyzed and plotted using the Dual Systeny Plot feature in TBtools software.
4.7. Analysis of Cis-Acting Elements in the Promoter of the EgGUXs Family
The 2 kb upstream sequence of EgGUXs was extracted using the ‘GXF Sequence Extraction’ tool in TBtools software [32]. It was then analyzed and compared with the online PlantCare database (https://bioinformatics.psb.ugent.be/webtools/plantcare/html/, accessed on 20 January 2024) to identify and retrieve cis-acting elements of the gene family. These elements were then combined with the phylogenetic tree of E. grandis and visualized using the ‘Basic BIOsequence View’ tool in TBtools.
4.8. The Expression Patterns of GUX Gene Family in E. grandis
To better understand the role of GUX genes in E. grandis, gene expression patterns were analyzed using our previous gene expression data [33]. The plant materials included roots, adult and young leaves, xylem, and phloem from 6−month−old plants, as well as the 1st (shoot apex), 3rd, 5th, 7th, 9th, and 11th internodes from 6−month−old branches. Additionally, xylem and phloem were sampled from 6−year−old E. grandis. The expression of GUX genes was examined in these different tissues to explore their expression patterns across various tissues and growth stages. Using the TBtools Heatmap function, transcriptome data from the 6−month−old branches were log-normalized using the formula ‘logbase (value + LogWith)’ (where base is 2.0 and LogWith is 1.0) to minimize data dispersion. Subsequently, ‘Cluster Rows’ was selected to perform hierarchical clustering. A heatmap depicting the expression patterns was generated following the hierarchical clustering.
Differential expression analysis was then conducted on young leaves treated with SA, MeJA, and salt stress for 0, 1, 6, 24, and 168 h. Employing the TBtools Heatmap function, the transcriptome data were log-normalized by selecting ‘Log Scale’. The ‘Tile Shape’ was set to ‘Circle’ and ‘Scale Size By Area’ was selected to create a raw expression heatmap. Additionally, after log-normalization, ‘Row Scale’ was chosen to normalize the rows, resulting in a heatmap that more clearly highlights differential expression. The two heatmaps were then combined to present a comprehensive picture of GUX gene family expression in response to abiotic stress and phytohormone treatment.
4.9. Protein Structure Prediction of EgGUXs
The 3D structures of EgGUX family proteins were constructed by homology modelling using the SWISS-MODEL (https://swissmodel.expasy.org/, accessed on 27 January 2024) online tool [34].
Supplementary Materials
The following supporting information can be downloaded at: https://www.mdpi.com/article/10.3390/ijms25158199/s1.
Author Contributions
The authors confirm contribution to the paper as follows: study conception and design: A.W. and L.L.; data collection: C.F., L.L., and H.L.; analysis and interpretation of results: L.L. and J.T.; draft manuscript preparation: L.L. All authors have read and agreed to the published version of the manuscript.
Funding
The author(s) declare financial support was received for the research, authorship, and/or publication of this article. This study was supported by Guangdong Key Laboratory for Innovative Development and Utilization of Forest Plant Germplasm; College of Forestry and Landscape Architectures; South China Agricultural University, Guangzhou 510642; China and State Key Laboratory of Tree Genetics and Breeding; Key Laboratory of State Forestry and Grassland Administration on Tropical Forestry; Research Institute of Tropical Forestry; Chinese Academy of Forestry, Guangzhou 510520, China; and the Innovation and Entrepreneurship training program for college students. This paper was supported by Guangzhou Science and Technology Project (202201011282), China Postdoctoral Science Foundation Project (2022M721198), Guangdong Natural Science Foundation Project (2023A1515010379), and National Innovation and Entrepreneurship Competition for College Students.
Institutional Review Board Statement
Not applicable.
Informed Consent Statement
Not applicable.
Data Availability Statement
All data generated or analyzed during this study are included in this article and its Supplementary Materials Tables S1 and S2. The gene sequence, CDS sequence, and GFF annotation information of all EgGUX gene families are included in the Supplementary Materials.
Conflicts of Interest
The authors declare that they have no conflicts of interest.
Abbreviations
GlcA: glucuronic acid; ML: Maximum likelihood method; IRX: irregular xylem; CNFs: Cellulose nanofibril; GT: Glycosyltransferase.
References
- Sørensen, I.; Domozych, D.; Willats, W.G.T. How Have Plant Cell Walls Evolved? Plant Physiol. 2010, 153, 366–372. [Google Scholar] [CrossRef]
- Pauly, M.; Keegstra, K. Plant Cell Wall Polymers as Precursors for Biofuels. Curr. Opin. Plant Biol. 2010, 13, 304–311. [Google Scholar] [CrossRef]
- Zhang, W.; Qin, W.; Li, H.; Wu, A. Biosynthesis and Transport of Nucleotide Sugars for Plant Hemicellulose. Front. Plant Sci. 2021, 12, 723128. [Google Scholar] [CrossRef]
- Qaseem, M.F.; Shaheen, H.; Wu, A.-M. Cell Wall Hemicellulose for Sustainable Industrial Utilization. Renew. Sustain. Energy Rev. 2021, 144, 110996. [Google Scholar] [CrossRef]
- Mortimer, J.C.; Miles, G.P.; Brown, D.M.; Zhang, Z.; Segura, M.P.; Weimar, T.; Yu, X.; Seffen, K.A.; Stephens, E.; Turner, S.R.; et al. Absence of Branches from Xylan in Arabidopsis Gux Mutants Reveals Potential for Simplification of Lignocellulosic Biomass. Proc. Natl. Acad. Sci. USA 2010, 107, 17409–17414. [Google Scholar] [CrossRef]
- Lee, C.; Teng, Q.; Zhong, R.; Ye, Z.-H. Arabidopsis GUX Proteins Are Glucuronyltransferases Responsible for the Addition of Glucuronic Acid Side Chains onto Xylan. Plant Cell Physiol. 2012, 53, 1204–1216. [Google Scholar] [CrossRef]
- Bromley, J.R.; Busse-Wicher, M.; Tryfona, T.; Mortimer, J.C.; Zhang, Z.; Brown, D.M.; Dupree, P. GUX1 and GUX2 Glucuronyltransferases Decorate Distinct Domains of Glucuronoxylan with Different Substitution Patterns. Plant J. 2013, 74, 423–434. [Google Scholar] [CrossRef]
- Brown, D.M.; Goubet, F.; Wong, V.W.; Goodacre, R.; Stephens, E.; Dupree, P.; Turner, S.R. Comparison of Five Xylan Synthesis Mutants Reveals New Insight into the Mechanisms of Xylan Synthesis. Plant J. 2007, 52, 1154–1168. [Google Scholar] [CrossRef]
- Rennie, E.A.; Hansen, S.F.; Baidoo, E.E.K.; Hadi, M.Z.; Keasling, J.D.; Scheller, H.V. Three Members of the Arabidopsis Glycosyltransferase Family 8 Are Xylan Glucuronosyltransferases. Plant Physiol. 2012, 159, 1408–1417. [Google Scholar] [CrossRef]
- Dunkley, T.P.J.; Hester, S.; Shadforth, I.P.; Runions, J.; Weimar, T.; Hanton, S.L.; Griffin, J.L.; Bessant, C.; Brandizzi, F.; Hawes, C.; et al. Mapping the Arabidopsis Organelle Proteome. Proc. Natl. Acad. Sci. USA 2006, 103, 6518–6523. [Google Scholar] [CrossRef]
- Lee, C.; Zhong, R.; Ye, Z.-H. Biochemical Characterization of Xylan Xylosyltransferases Involved in Wood Formation in Poplar. Plant Signal. Behav. 2012, 7, 332–337. [Google Scholar] [CrossRef]
- Grantham, N.J.; Wurman-Rodrich, J.; Terrett, O.M.; Lyczakowski, J.J.; Stott, K.; Iuga, D.; Simmons, T.J.; Durand-Tardif, M.; Brown, S.P.; Dupree, R.; et al. An Even Pattern of Xylan Substitution Is Critical for Interaction with Cellulose in Plant Cell Walls. Nat. Plants 2017, 3, 859–865. [Google Scholar] [CrossRef]
- Wu, A.-M.; Hörnblad, E.; Voxeur, A.; Gerber, L.; Rihouey, C.; Lerouge, P.; Marchant, A. Analysis of the Arabidopsis IRX9/IRX9—L and IRX14/IRX14—L Pairs of Glycosyltransferase Genes Reveals Critical Contributions to Biosynthesis of the Hemicellulose Glucuronoxylan. Plant Physiol. 2010, 153, 542–554. [Google Scholar] [CrossRef]
- Yang, F.; Mitra, P.; Zhang, L.; Prak, L.; Verhertbruggen, Y.; Kim, J.; Sun, L.; Zheng, K.; Tang, K.; Auer, M.; et al. Engineering Secondary Cell Wall Deposition in Plants. Plant Biotechnol. J. 2013, 11, 325–335. [Google Scholar] [CrossRef] [PubMed]
- Eudes, A.; Liang, Y.; Mitra, P.; Loqué, D. Lignin Bioengineering. Curr. Opin. Biotechnol. 2014, 26, 189–198. [Google Scholar] [CrossRef] [PubMed]
- Gallinari, R.H.; Coletta, R.D.; Araújo, P.; Menossi, M.; Nery, M.F. Bringing to Light the Molecular Evolution of GUX Genes in Plants. Genet. Mol. Biol. 2020, 43, e20180208. [Google Scholar] [CrossRef]
- Myburg, A.A.; Grattapaglia, D.; Tuskan, G.A.; Hellsten, U.; Hayes, R.D.; Grimwood, J.; Jenkins, J.; Lindquist, E.; Tice, H.; Bauer, D.; et al. The Genome of Eucalyptus Grandis. Nature 2014, 510, 356–362. [Google Scholar] [CrossRef] [PubMed]
- Panchy, N.; Lehti-Shiu, M.; Shiu, S.-H. Evolution of Gene Duplication in Plants. Plant Physiol. 2016, 171, 2294–2316. [Google Scholar] [CrossRef]
- Wang, W.; Wu, Y.; Messing, J. RNA-Seq Transcriptome Analysis of Spirodela Dormancy without Reproduction. BMC Genom. 2014, 15, 60. [Google Scholar] [CrossRef]
- Cedroni, M.L.; Cronn, R.C.; Adams, K.L.; Wilkins, T.A.; Wendel, J.F. Evolution and Expression of MYB Genes in Diploid and Polyploid Cotton. Plant Mol. Biol. 2003, 51, 313–325. [Google Scholar] [CrossRef]
- Lyczakowski, J.J.; Yu, L.; Terrett, O.M.; Fleischmann, C.; Temple, H.; Thorlby, G.; Sorieul, M.; Dupree, P. Two Conifer GUX Clades Are Responsible for Distinct Glucuronic Acid Patterns on Xylan. New Phytol. 2021, 231, 1720–1733. [Google Scholar] [CrossRef] [PubMed]
- Evolution of Glucuronoxylan Side Chain Variability in Vascular Plants and the Compensatory Adaptations of Cell Wall–Degrading Hydrolases (Topic)—1—All Databases. Available online: https://webofscience.clarivate.cn/wos/alldb/summary/d32fd051-79d4-4efc-ae85-82afefa1696d-fd625981/relevance/1 (accessed on 22 July 2024).
- Zhang, L.; Yu, Y.; Zhang, M.; Rong, K.; Wu, Y.; Zhang, M.; Hu, H. Genome-Wide Identification of Xylan Glucuronosyltransferase Family in Cotton and Function Characterization of GhGUX5 in Regulating Verticillium Wilt Resistance. Int. J. Biol. Macromol. 2023, 245, 124795. [Google Scholar] [CrossRef] [PubMed]
- Zeng, B.S.; Qiu, Z.F.; Liu, Y.; Li, X.Y.; Fan, C.J.; Zhou, G.H.; Ge, M.L.; Lai, W.P. Breeding of cold-tolerant clone Jinggang 1 of Eucalyptus grandis. Res. For. Sci. 2014, 27, 667–671. [Google Scholar] [CrossRef]
- Bailey, T.L.; Boden, M.; Buske, F.A.; Frith, M.; Grant, C.E.; Clementi, L.; Ren, J.; Li, W.W.; Noble, W.S. MEME SUITE: Tools for Motif Discovery and Searching. Nucleic Acids Res. 2009, 37, W202–W208. [Google Scholar] [CrossRef] [PubMed]
- Artimo, P.; Jonnalagedda, M.; Arnold, K.; Baratin, D.; Csardi, G.; De Castro, E.; Duvaud, S.; Flegel, V.; Fortier, A.; Gasteiger, E.; et al. ExPASy: SIB Bioinformatics Resource Portal. Nucleic Acids Res. 2012, 40, W597–W603. [Google Scholar] [CrossRef] [PubMed]
- Liu, Y.-J.; Wang, X.-R.; Zeng, Q.-Y. De Novo Assembly of White Poplar Genome and Genetic Diversity of White Poplar Population in Irtysh River Basin in China. Sci. China-Life Sci. 2019, 62, 609–618. [Google Scholar] [CrossRef] [PubMed]
- Chen, C.; Wu, Y.; Li, J.; Wang, X.; Zeng, Z.; Xu, J.; Liu, Y.; Feng, J.; Chen, H.; He, Y.; et al. TBtools-II: A “One for All, All for One” Bioinformatics Platform for Biological Big-Data Mining. Mol. Plant 2023, 16, 1733–1742. [Google Scholar] [CrossRef] [PubMed]
- Letunic, I.; Bork, P. Interactive Tree Of Life (iTOL) v5: An Online Tool for Phylogenetic Tree Display and Annotation. Nucleic Acids Res. 2021, 49, W293–W296. [Google Scholar] [CrossRef] [PubMed]
- Tamura, K.; Stecher, G.; Kumar, S. MEGA11: Molecular Evolutionary Genetics Analysis Version 11. Mol. Biol. Evol. 2021, 38, 3022–3027. [Google Scholar] [CrossRef]
- Bailey, T.L.; Johnson, J.; Grant, C.E.; Noble, W.S. The MEME Suite. Nucleic Acids Res 2015, 43, W39–W49. [Google Scholar] [CrossRef]
- Chen, C.; Chen, H.; Zhang, Y.; Thomas, H.R.; Frank, M.H.; He, Y.; Xia, R. TBtools: An Integrative Toolkit Developed for Interactive Analyses of Big Biological Data. Mol. Plant 2020, 13, 1194–1202. [Google Scholar] [CrossRef] [PubMed]
- Fan, C.; Lyu, M.; Zeng, B.; He, Q.; Wang, X.; Lu, M.; Liu, B.; Liu, J.; Esteban, E.; Pasha, A.; et al. Profiling of the Gene Expression and Alternative Splicing Landscapes of Eucalyptus Grandis. Plant Cell Environ. 2024, 47, 1363–1378. [Google Scholar] [CrossRef] [PubMed]
- Kiefer, F.; Arnold, K.; Kunzli, M.; Bordoli, L.; Schwede, T. The SWISS-MODEL Repository and Associated Resources. Nucleic Acids Res. 2009, 37, D387–D392. [Google Scholar] [CrossRef] [PubMed]
Disclaimer/Publisher’s Note: The statements, opinions and data contained in all publications are solely those of the individual author(s) and contributor(s) and not of MDPI and/or the editor(s). MDPI and/or the editor(s) disclaim responsibility for any injury to people or property resulting from any ideas, methods, instructions or products referred to in the content. |
© 2024 by the authors. Licensee MDPI, Basel, Switzerland. This article is an open access article distributed under the terms and conditions of the Creative Commons Attribution (CC BY) license (https://creativecommons.org/licenses/by/4.0/).