
VDR Gene Polymorphisms (BsmI, FokI, TaqI, ApaI) in Total Hip Arthroplasty Outcome Patients
 , , and
Abstract
:1. Introduction
2. Results
2.1. ORs and Allele/Genotype Frequencies
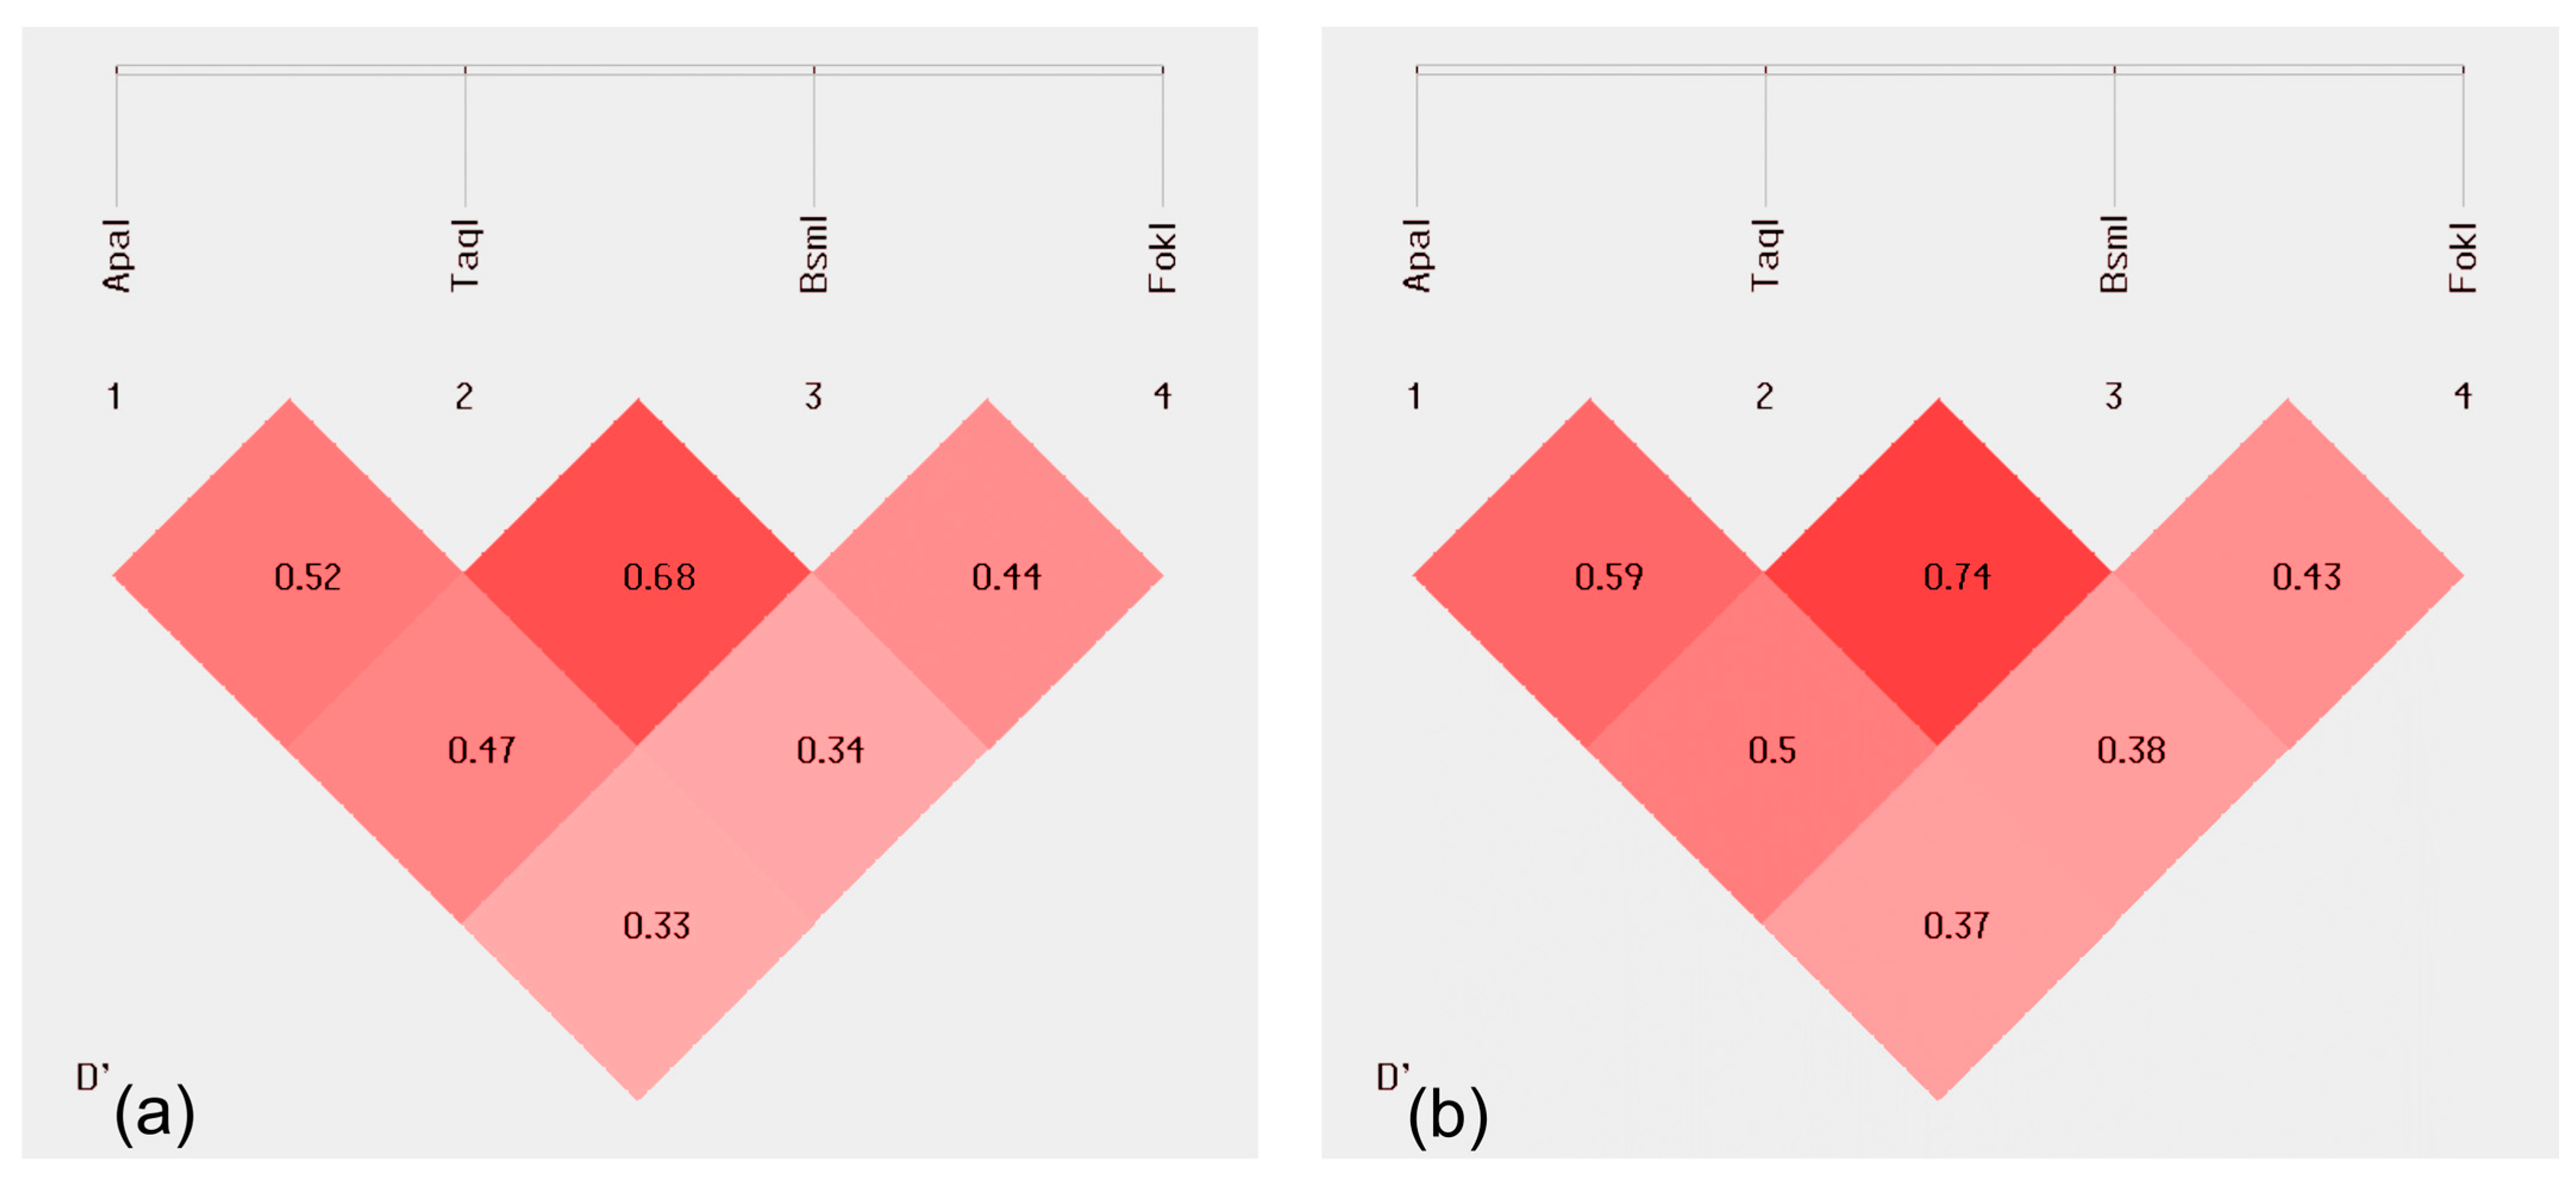
2.2. Linkage Disequilibrium (LD)
2.3. Haplotype Analysis of Loci
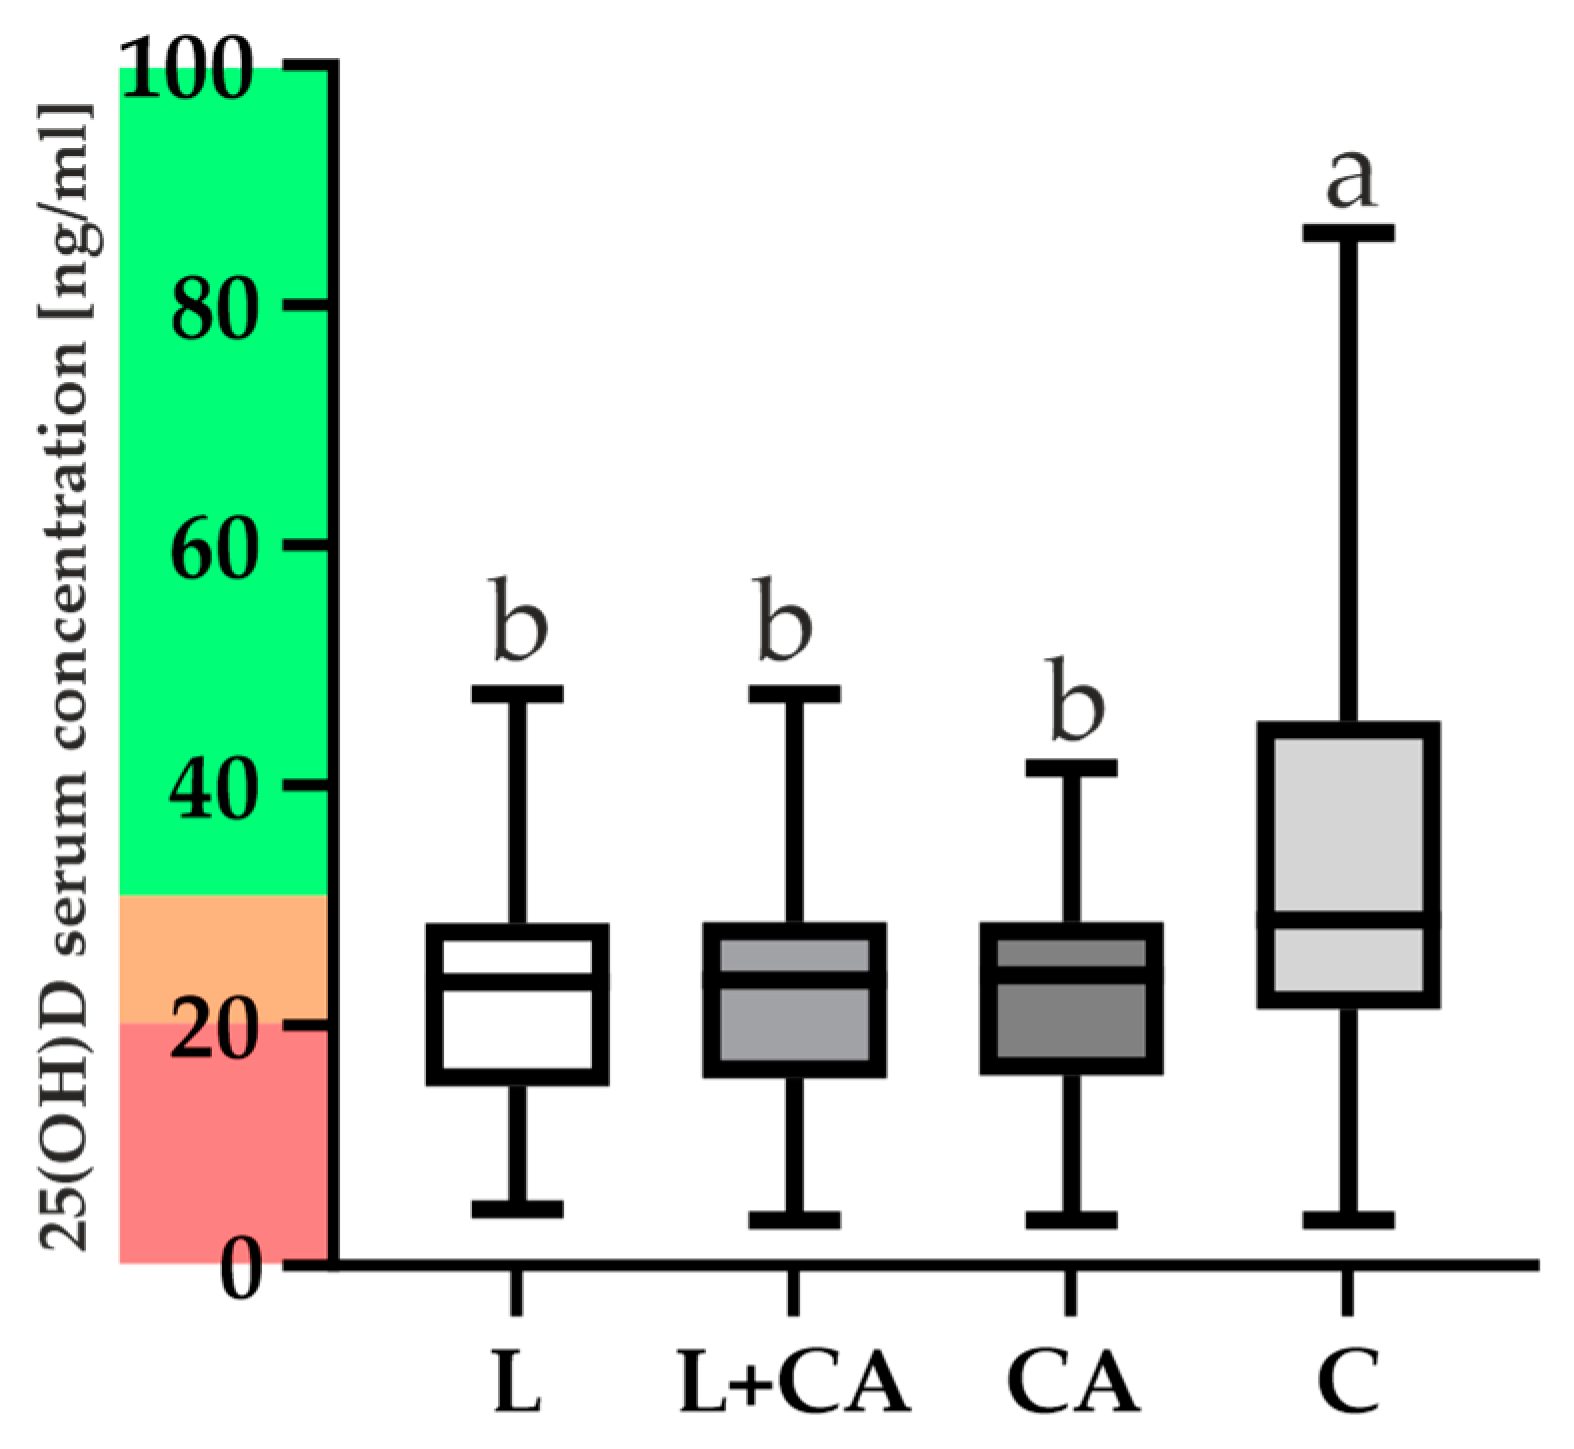
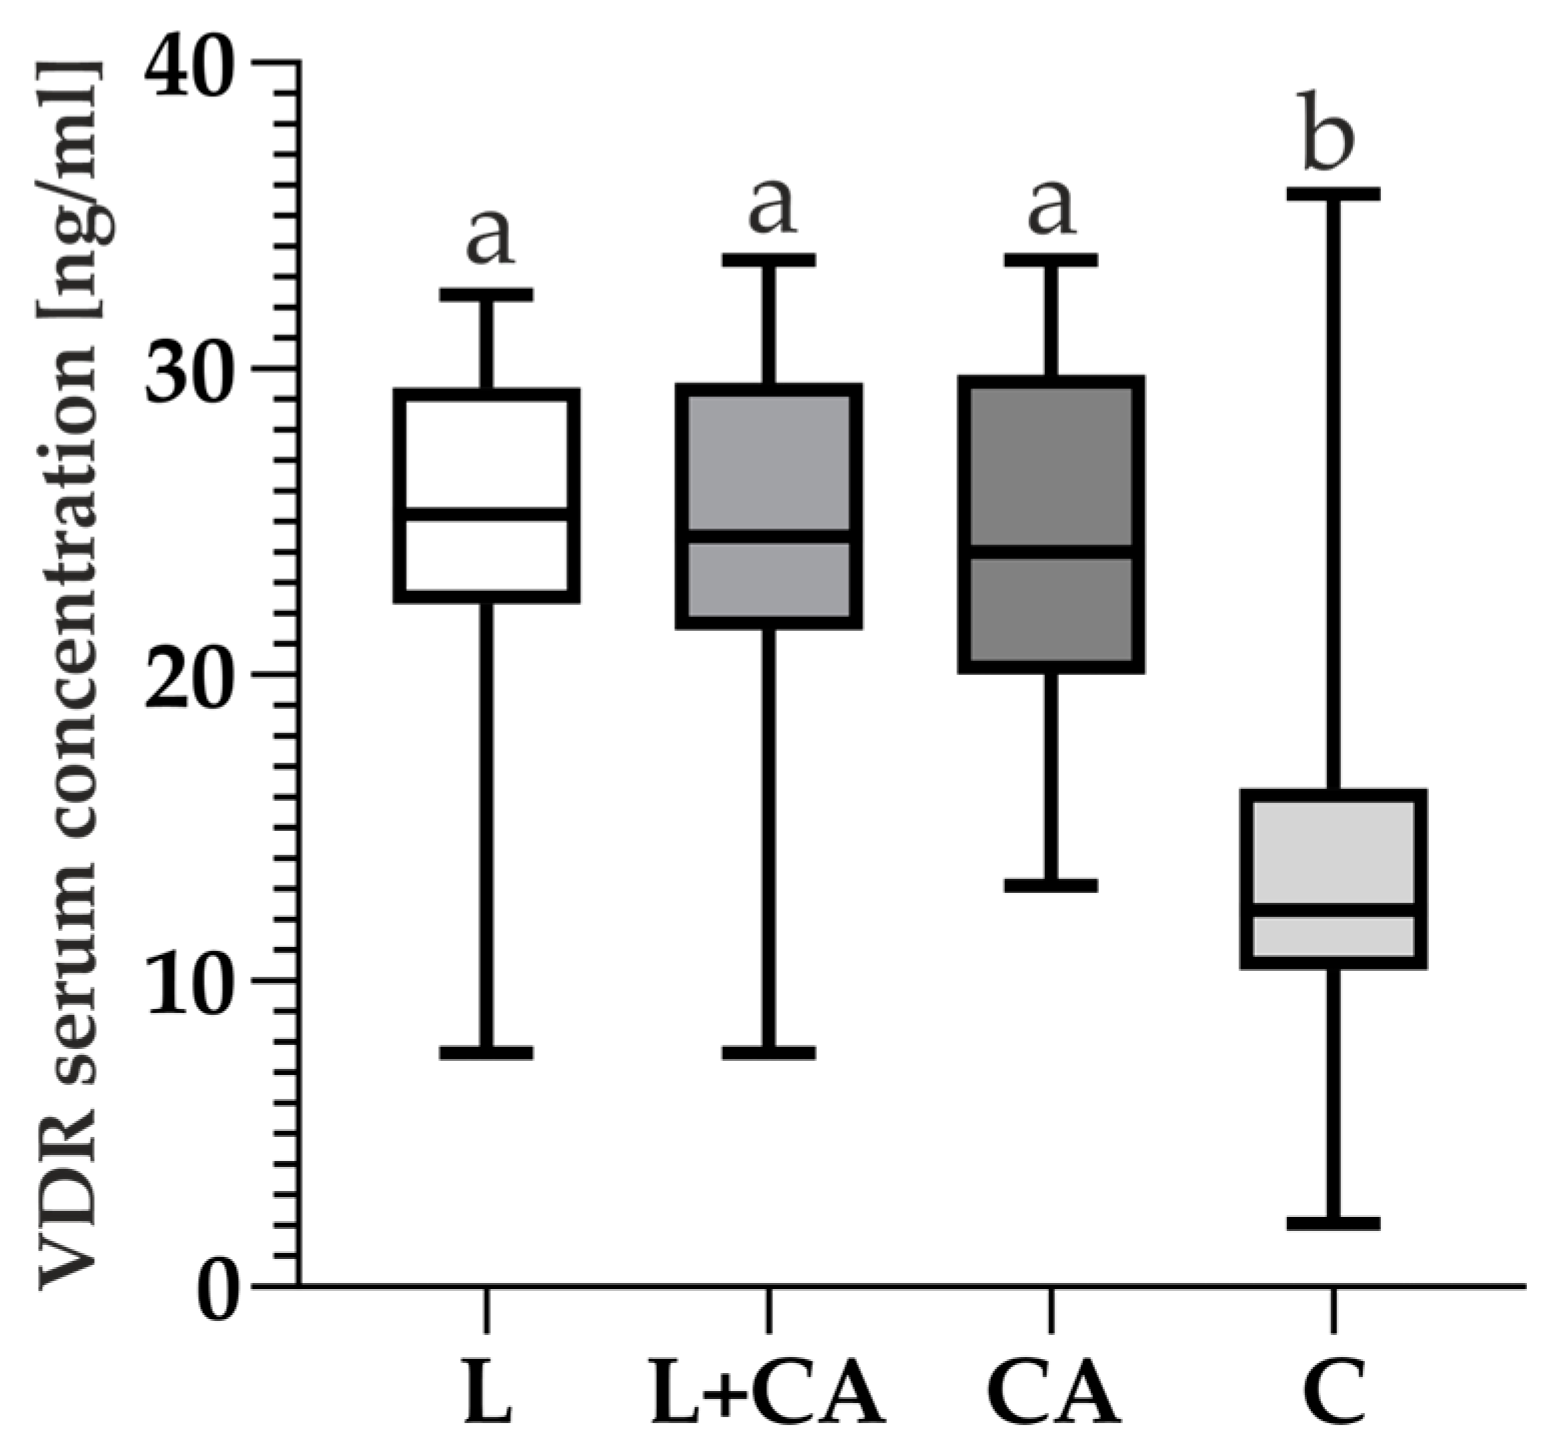
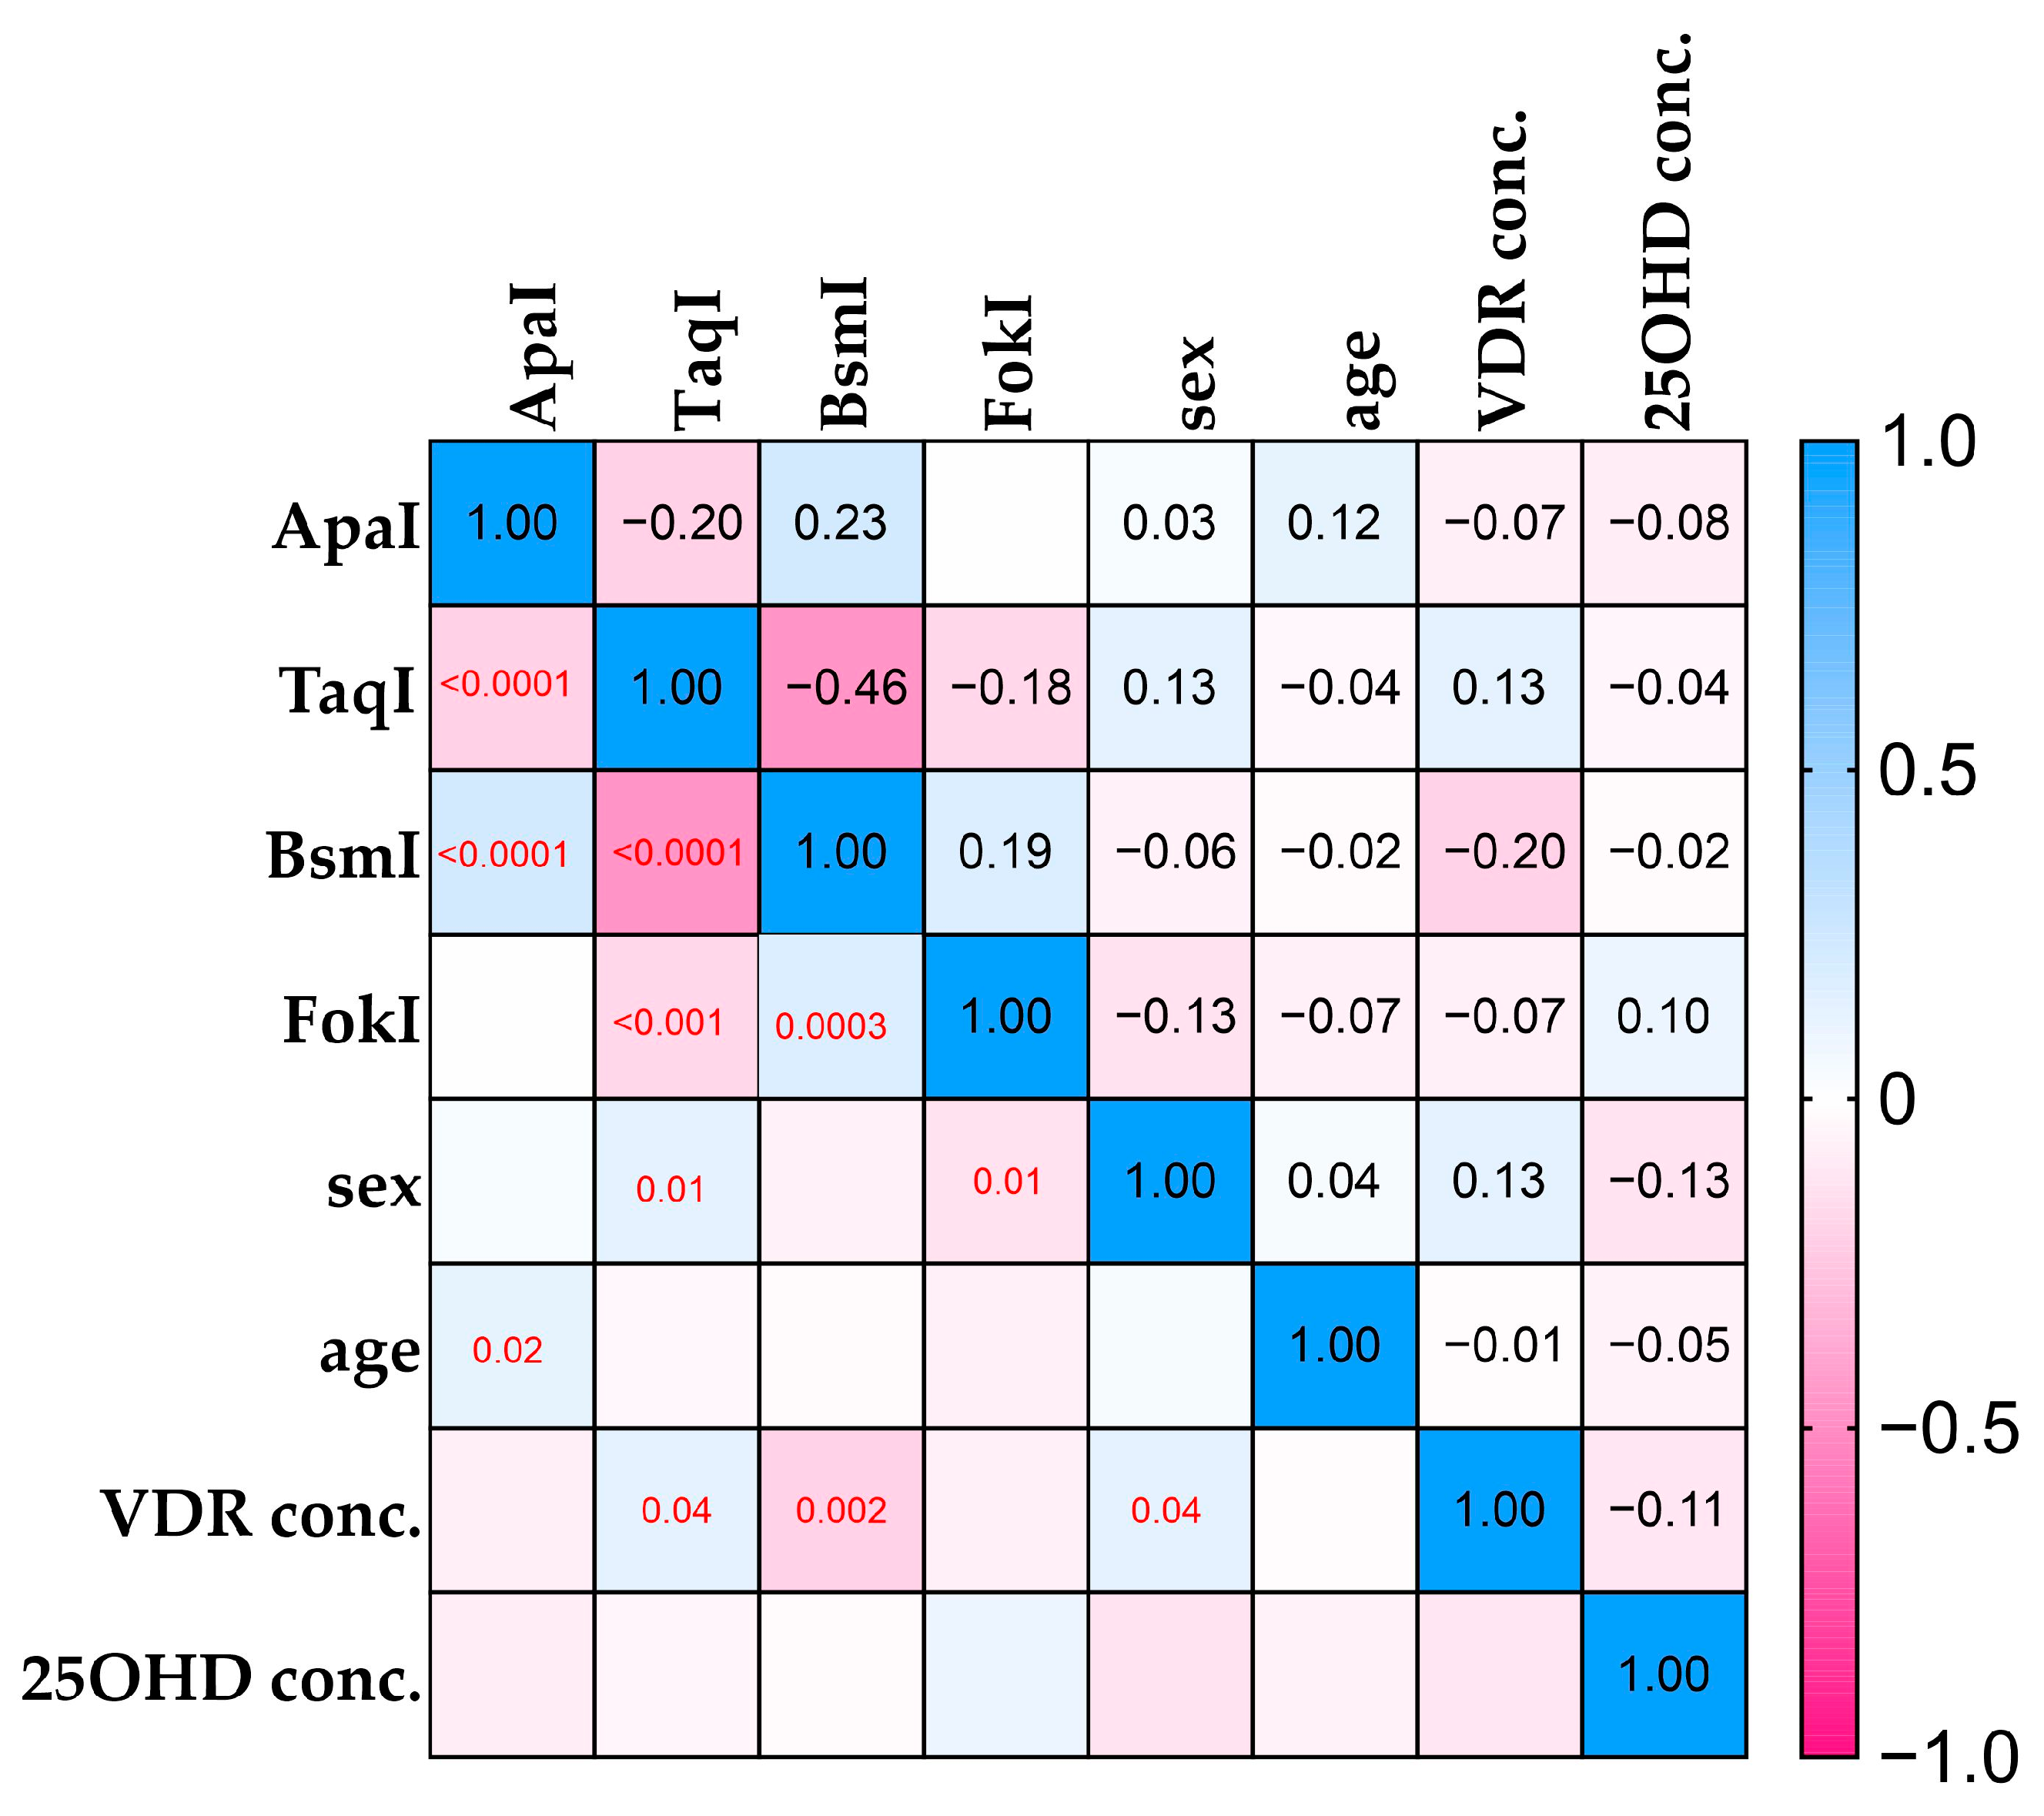
2.4. VDR and 25(OH)D Levels and Correlations
3. Discussion
4. Materials and Methods
4.1. Characteristics of Control and Patients Groups
4.2. Biological Material Collection
4.3. VDR Polymorphisms Genotyping
4.4. VDR Serum Levels
4.5. 25(OH)D Serum Levels
4.6. Statistical Analysis
5. Conclusions
Author Contributions
Funding
Institutional Review Board Statement
Informed Consent Statement
Data Availability Statement
Acknowledgments
Conflicts of Interest
References
- Knight, S.R.; Aujla, R.; Biswas, S.P. Total Hip Arthroplasty—Over 100 Years of Operative History. Orthop. Rev. 2011, 3, e16. [Google Scholar] [CrossRef]
- Migliorini, F.; Maffulli, N.; Trivellas, M.; Eschweiler, J.; Hildebrand, F.; Betsch, M. Total Hip Arthroplasty Compared to Bipolar and Unipolar Hemiarthroplasty for Displaced Hip Fractures in the Elderly: A Bayesian Network Meta-Analysis. Eur. J. Trauma Emerg. Surg. 2022, 48, 2655–2666. [Google Scholar] [CrossRef] [PubMed]
- Bhandari, M.; Einhorn, T.A.; Guyatt, G.; Schemitsch, E.H.; Zura, R.D.; Sprague, S.; Frihagen, F.; Guerra-Farfán, E.; Kleinlugtenbelt, Y.V.; et al.; HEALTH Investigators Total Hip Arthroplasty or Hemiarthroplasty for Hip Fracture. N. Engl. J. Med. 2019, 381, 2199–2208. [Google Scholar] [CrossRef] [PubMed]
- Healy, W.L.; Iorio, R.; Clair, A.J.; Pellegrini, V.D.; Della Valle, C.J.; Berend, K.R. Complications of Total Hip Arthroplasty: Standardized List, Definitions, and Stratification Developed by The Hip Society. Clin. Orthop. Relat. Res. 2016, 474, 357–364. [Google Scholar] [CrossRef] [PubMed]
- Sieczka, Ł.; Bohatyrewicz, A.; Pituch, S. Endoprotezy stawów biodrowych wczoraj i dziś. Rheumatol. Forum 2017, 3, 216–221. [Google Scholar]
- Yang, Q.; Wang, J.; Xu, Y.; Chen, Y.; Lian, Q.; Zhang, Y. Incidence and Risk Factors of In-Hospital Prosthesis-Related Complications Following Total Hip Arthroplasty: A Retrospective Nationwide Inpatient Sample Database Study. Int. Orthop. 2020, 44, 2243–2252. [Google Scholar] [CrossRef] [PubMed]
- Patel, I.; Nham, F.; Zalikha, A.K.; El-Othmani, M.M. Epidemiology of Total Hip Arthroplasty: Demographics, Comorbidities and Outcomes. Arthroplasty 2023, 5, 2. [Google Scholar] [CrossRef] [PubMed]
- Page, R.S.; Pai, V.; Eng, K.; Bain, G.; Graves, S.; Lorimer, M. Cementless versus Cemented Glenoid Components in Conventional Total Shoulder Joint Arthroplasty: Analysis from the Australian Orthopaedic Association National Joint Replacement Registry. J. Shoulder Elb. Surg. 2018, 27, 1859–1865. [Google Scholar] [CrossRef]
- Waris, V.; Waris, E.; Sillat, T.; Konttinen, Y.T. BMPs in Periprosthetic Tissues around Aseptically Loosened Total Hip Implants. Acta Orthop. 2010, 81, 420–426. [Google Scholar] [CrossRef]
- Emara, A.K.; Nageeb, E.; George, J.; Buttaro, M.A.; Higuera, C.; Piuzzi, N.S. Hypovitaminosis D in Lower Extremity Joint Arthroplasty: A Systematic Review and Meta-Analysis. J. Orthop. 2020, 21, 109–116. [Google Scholar] [CrossRef]
- Kenanidis, E.; Kakoulidis, P.; Karponis, D.; Tsiridis, E. The Effect of Perioperative Vitamin D Levels on the Functional, Patient-Related Outcome Measures and the Risk of Infection Following Hip and Knee Arthroplasty: A Systematic Review. Patient Relat. Outcome Meas. 2020, 11, 161–171. [Google Scholar] [CrossRef] [PubMed]
- Shirazi, S.; Ravindran, S.; Cooper, L.F. Topography-Mediated Immunomodulation in Osseointegration; Ally or Enemy. Biomaterials 2022, 291, 121903. [Google Scholar] [CrossRef] [PubMed]
- Aghaloo, T.; Pi-Anfruns, J.; Moshaverinia, A.; Sim, D.; Grogan, T.; Hadaya, D. The Effects of Systemic Diseases and Medications on Implant Osseointegration: A Systematic Review. Int. J. Oral Maxillofac. Implant. 2019, 34, s35–s49. [Google Scholar] [CrossRef] [PubMed]
- Holick, M.F. Resurrection of Vitamin D Deficiency and Rickets. J. Clin. Investig. 2006, 116, 2062–2072. [Google Scholar] [CrossRef] [PubMed]
- Fleet, J.C. The Role of Vitamin D in the Endocrinology Controlling Calcium Homeostasis. Mol. Cell. Endocrinol. 2017, 453, 36–45. [Google Scholar] [CrossRef] [PubMed]
- Plominski, J.; Grzybowski, R.; Fiedorowicz, E.; Sienkiewicz-Szlapka, E.; Rozmus, D.; Krol-Grzymala, A.; Jarmolowska, B.; Kordulewska, N.; Cieslinska, A. Vitamin D Metabolic Pathway Components in Orthopedic Patientes—Systematic Review. Int. J. Mol. Sci. 2022, 23, 15556. [Google Scholar] [CrossRef] [PubMed]
- Zmijewski, M.A.; Carlberg, C. Vitamin D Receptor(s): In the Nucleus but Also at Membranes? Exp. Dermatol. 2020, 29, 876–884. [Google Scholar] [CrossRef]
- Feldman, D.; Krishnan, A.V.; Swami, S.; Giovannucci, E.; Feldman, B.J. The Role of Vitamin D in Reducing Cancer Risk and Progression. Nat. Rev. Cancer 2014, 14, 342–357. [Google Scholar] [CrossRef] [PubMed]
- Slominski, A.T.; Tuckey, R.C.; Jenkinson, C.; Li, W.; Jetten, A.M. Chapter 6—Alternative Pathways for Vitamin D Metabolism. In Feldman and Pike’s Vitamin D, 5th ed.; Hewison, M., Bouillon, R., Giovannucci, E., Goltzman, D., Meyer, M., Welsh, J., Eds.; Academic Press: Cambridge, MA, USA, 2024; pp. 85–109. ISBN 978-0-323-91386-7. [Google Scholar]
- Holick, M.F.; Slominski, A.T. Chapter 3—Photobiology of Vitamin D. In Feldman and Pike’s Vitamin D, 5th ed.; Hewison, M., Bouillon, R., Giovannucci, E., Goltzman, D., Meyer, M., Welsh, J., Eds.; Academic Press: Cambridge, MA, USA, 2024; pp. 27–45. ISBN 978-0-323-91386-7. [Google Scholar]
- Slominski, R.M.; Raman, C.; Elmets, C.; Jetten, A.M.; Slominski, A.T.; Tuckey, R.C. The Significance of CYP11A1 Expression in Skin Physiology and Pathology. Mol. Cell. Endocrinol. 2021, 530, 111238. [Google Scholar] [CrossRef]
- Patton, C.M.; Powell, A.P.; Patel, A.A. Vitamin D in Orthopaedics. JAAOS J. Am. Acad. Orthop. Surg. 2012, 20, 123–129. [Google Scholar] [CrossRef]
- Lappe, J.M.; Travers-Gustafson, D.; Davies, K.M.; Recker, R.R.; Heaney, R.P. Vitamin D and Calcium Supplementation Reduces Cancer Risk: Results of a Randomized Trial. Am. J. Clin. Nutr. 2007, 85, 1586–1591. [Google Scholar] [CrossRef] [PubMed]
- Garland, C.F.; Garland, F.C.; Gorham, E.D.; Lipkin, M.; Newmark, H.; Mohr, S.B.; Holick, M.F. The Role of Vitamin D in Cancer Prevention. Am. J. Public Health 2006, 96, 252–261. [Google Scholar] [CrossRef] [PubMed]
- Liu, P.T.; Stenger, S.; Li, H.; Wenzel, L.; Tan, B.H.; Krutzik, S.R.; Ochoa, M.T.; Schauber, J.; Wu, K.; Meinken, C.; et al. Toll-like Receptor Triggering of a Vitamin D-Mediated Human Antimicrobial Response. Science 2006, 311, 1770–1773. [Google Scholar] [CrossRef]
- Holick, M.F. The Vitamin D Epidemic and Its Health Consequences. J. Nutr. 2005, 135, 2739S–2748S. [Google Scholar] [CrossRef] [PubMed]
- Kato, S. The Function of Vitamin D Receptor in Vitamin D Action. J. Biochem. 2000, 127, 717–722. [Google Scholar] [CrossRef] [PubMed]
- Wang, Y.; Zhu, J.; DeLuca, H.F. Where Is the Vitamin D Receptor? Arch. Biochem. Biophys. 2012, 523, 123–133. [Google Scholar] [CrossRef]
- Dong, J.; Zhou, Q.; Wang, J.; Lu, Y.; Li, J.; Wang, L.; Wang, L.; Meng, P.; Li, F.; Zhou, H.; et al. Association between Variants in Vitamin D-Binding Protein Gene and Vitamin D Deficiency among Pregnant Women in China. J. Clin. Lab. Anal. 2020, 34, e23376. [Google Scholar] [CrossRef] [PubMed]
- Slominski, A.T.; Kim, T.-K.; Janjetovic, Z.; Slominski, R.M.; Li, W.; Jetten, A.M.; Indra, A.K.; Mason, R.S.; Tuckey, R.C. Biological Effects of CYP11A1-Derived Vitamin D and Lumisterol Metabolites in the Skin. J. Investig. Dermatol. 2024. [Google Scholar] [CrossRef] [PubMed]
- Slominski, A.T.; Kim, T.-K.; Slominski, R.M.; Song, Y.; Janjetovic, Z.; Podgorska, E.; Reddy, S.B.; Song, Y.; Raman, C.; Tang, E.K.Y.; et al. Metabolic Activation of Tachysterol3 to Biologically Active Hydroxyderivatives That Act on VDR, AhR, LXRs, and PPARγ Receptors. FASEB J. 2022, 36, e22451. [Google Scholar] [CrossRef]
- VDR Vitamin D Receptor [Homo sapiens (Human)]—Gene—NCBI. Available online: https://www.ncbi.nlm.nih.gov/gene?Db=gene&Cmd=DetailsSearch&Term=7421 (accessed on 8 November 2020).
- Latacz, M.; Rozmus, D.; Fiedorowicz, E.; Snarska, J.; Jarmołowska, B.; Kordulewska, N.; Savelkoul, H.; Cieślińska, A. Vitamin D Receptor (VDR) Gene Polymorphism in Patients Diagnosed with Colorectal Cancer. Nutrients 2021, 13, 200. [Google Scholar] [CrossRef]
- Uitterlinden, A.G.; Fang, Y.; Bergink, A.P.; van Meurs, J.B.J.; van Leeuwen, H.P.T.M.; Pols, H.A.P. The Role of Vitamin D Receptor Gene Polymorphisms in Bone Biology. Mol. Cell. Endocrinol. 2002, 197, 15–21. [Google Scholar] [CrossRef]
- Li, S.-S.; Gao, L.-H.; Zhang, X.-Y.; He, J.-W.; Fu, W.-Z.; Liu, Y.-J.; Hu, Y.-Q.; Zhang, Z.-L. Genetically Low Vitamin D Levels, Bone Mineral Density, and Bone Metabolism Markers: A Mendelian Randomisation Study. Sci. Rep. 2016, 6, 33202. [Google Scholar] [CrossRef] [PubMed]
- Jiang, L.L.; Zhang, C.; Zhang, Y.; Ma, F.; Guan, Y. Associations between Polymorphisms in VDR Gene and the Risk of Osteoporosis: A Meta-Analysis. Arch. Physiol. Biochem. 2022, 128, 1637–1644. [Google Scholar] [CrossRef] [PubMed]
- Zendehdel, A.; Arefi, M. Molecular Evidence of Role of Vitamin D Deficiency in Various Extraskeletal Diseases. J. Cell. Biochem. 2019, 120, 8829–8840. [Google Scholar] [CrossRef]
- Krasniqi, E.; Boshnjaku, A.; Wagner, K.-H.; Wessner, B. Association between Polymorphisms in Vitamin D Pathway-Related Genes, Vitamin D Status, Muscle Mass and Function: A Systematic Review. Nutrients 2021, 13, 3109. [Google Scholar] [CrossRef] [PubMed]
- Waples, R.S. Practical Application of the Linkage Disequilibrium Method for Estimating Contemporary Effective Population Size: A Review. Mol. Ecol. Resour. 2024, 24, e13879. [Google Scholar] [CrossRef] [PubMed]
- Ahmed, R.R.; Mostafa, A.O.; Saleh, E.M.; Nasr, H.; Effat, L. Study of Vitamin D Receptor Gene Polymorphisms in Egyptian Patients with Primary Osteoporosis. Egypt. J. Pure Appl. Sci. 2015, 53, 1–11. [Google Scholar] [CrossRef]
- Bottai, V.; Dell’Osso, G.; Celli, F.; Bugelli, G.; Cazzella, N.; Cei, E.; Guido, G.; Giannotti, S. Total Hip Replacement in Osteoarthritis: The Role of Bone Metabolism and Its Complications. Clin. Cases Miner. Bone Metab. 2015, 12, 247–250. [Google Scholar] [CrossRef] [PubMed]
- Russell, L.A. Osteoporosis and Orthopedic Surgery: Effect of Bone Health on Total Joint Arthroplasty Outcome. Curr. Rheumatol. Rep. 2013, 15, 371. [Google Scholar] [CrossRef]
- Nawabi, D.H.; Chin, K.F.; Keen, R.W.; Haddad, F.S. Vitamin D Deficiency in Patients with Osteoarthritis Undergoing Total Hip Replacement: A CAUSE FOR CONCERN? J. Bone Jt. Surg. Br. Vol. 2010, 92, 496–499. [Google Scholar] [CrossRef]
- Berg, J.P.; Falch, J.A.; Haug, E. Fracture Rate, Pre- and Postmenopausal Bone Mass and Early and Late Postmenopausal Bone Loss Are Not Associated with Vitamin D Receptor Genotype in a High-Endemic Area of Osteoporosis. Eur. J. Endocrinol. 1996, 135, 96–100. [Google Scholar] [CrossRef] [PubMed]
- Yadav, U.; Kumar, P.; Rai, V. Vitamin D Receptor (VDR) Gene FokI, BsmI, ApaI, and TaqI Polymorphisms and Osteoporosis Risk: A Meta-Analysis. Egypt. J. Med. Hum. Genet. 2020, 21, 15. [Google Scholar] [CrossRef]
- Nguyen, T.V.; Esteban, L.M.; White, C.P.; Grant, S.F.; Center, J.R.; Gardiner, E.M.; Eisman, J.A. Contribution of the Collagen I α1 and Vitamin D Receptor Genes to the Risk of Hip Fracture in Elderly Women. J. Clin. Endocrinol. Metab. 2005, 90, 6575–6579. [Google Scholar] [CrossRef] [PubMed]
- Horst-Sikorska, W.; Wawrzyniak, A.; Celczyńska-Bajew, L.; Marcinkowska, M.; Dabrowski, S.; Kalak, R.; Słomski, R. Polymorphism of VDR Gene--the Most Effective Molecular Marker of Osteoporotic Bone Fractures Risk within Postmenopausal Women from Wielkopolska Region of Poland. Endokrynol. Pol. 2005, 56, 233–239. [Google Scholar] [PubMed]
- Uysal, A.R.; Sahin, M.; Gürsoy, A.; Güllü, S. Vitamin D Receptor Gene Polymorphism and Osteoporosis in the Turkish Population. Genet. Test. 2008, 12, 591–594. [Google Scholar] [CrossRef] [PubMed]
- Wu, J.; Shang, D.-P.; Yang, S.; Fu, D.-P.; Ling, H.-Y.; Hou, S.-S.; Lu, J.-M. Association between the Vitamin D Receptor Gene Polymorphism and Osteoporosis. Biomed. Rep. 2016, 5, 233–236. [Google Scholar] [CrossRef] [PubMed]
- Bell, N.H.; Morrison, N.A.; Nguyen, T.V.; Eisman, J.; Hollis, B.W. Apa I Polymorphisms of the Vitamin D Receptor Predict Bone Density of the Lumbar Spine and Not Racial Difference in Bone Density in Young Men. J. Lab. Clin. Med. 2001, 137, 133–140. [Google Scholar] [CrossRef] [PubMed]
- Dundar, U.; Solak, M.; Kavuncu, V.; Ozdemir, M.; Cakir, T.; Yildiz, H.; Evcik, D. Evidence of Association of Vitamin D Receptor Apa I Gene Polymorphism with Bone Mineral Density in Postmenopausal Women with Osteoporosis. Clin. Rheumatol. 2009, 28, 1187–1191. [Google Scholar] [CrossRef] [PubMed]
- Zambrano-Morales, M.; Borjas, L.; Fernández, E.; Zabala, W.; de Romero, P.; Pineda, L.; Morales-Machín, A. Association of the vitamin D receptor gene BBAAtt haplotype with osteoporosis in post-menopausic women. Investig. Clin. 2008, 49, 29–38. [Google Scholar]
- Quevedo, L.I.; Martínez, B.M.; Castillo, N.M.; Rivera, F.N. Vitamin D receptor gene polymorphisms and risk of hip fracture in Chilean elderly women. Rev. Med. Chil. 2008, 136, 475–481. [Google Scholar]
- Riggs, L.B.; Nguyen, T.V.; Melton, J.L., III; Morrison, N.A.; O’Fallon, W.M.; Kelly, P.J.; Egan, K.S.; Sambrook, P.N.; Muhs, J.M.; Eisman, J.A. The Contribution of Vitamin D Receptor Gene Alleles to the Determination of Bone Mineral Density in Normal and Osteoporotic Women. J. Bone Miner. Res. 1995, 10, 991–996. [Google Scholar] [CrossRef] [PubMed]
- Houston, L.A.; Grant, S.F.A.; Reid, D.M.; Ralston, S.H. Vitamin D Receptor Polymorphism, Bone Mineral Density, and Osteoporotic Vertebral Fracture: Studies in a UK Population. Bone 1996, 18, 249–252. [Google Scholar] [CrossRef] [PubMed]
- Vandevyver, C.; Wylin, T.; Cassiman, J.; Raus, J.; Geusens, P. Influence of the Vitamin D Receptor Gene Alleles on Bone Mineral Density in Postmenopausal and Osteoporotic Women. J. Bone Miner. Res. 1997, 12, 241–247. [Google Scholar] [CrossRef] [PubMed]
- Langdahl, B.L.; Gravholt, C.H.; Brixen, K.; Eriksen, E.F. Polymorphisms in the Vitamin D Receptor Gene and Bone Mass, Bone Turnover and Osteoporotic Fractures. Eur. J. Clin. Investig. 2000, 30, 608–617. [Google Scholar] [CrossRef] [PubMed]
- Zajíčková, K.; Žofková, I.; Bahbouh, R.; Křepelová, A. Vitamin D Receptor Gene Polymorphisms, Bone Mineral Density and Bone Turnover: FokI Genotype Is Related to Postmenopausal Bone Mass. Physiol. Res. 2002, 51, 501–509. [Google Scholar] [CrossRef] [PubMed]
- González-Mercado, A.; Sánchez-López, J.Y.; Regla-Nava, J.A.; Gámez-Nava, J.I.; González-López, L.; Duran-Gonzalez, J.; Celis, A.; Perea-Díaz, F.J.; Salazar-Páramo, M.; Ibarra, B. Association Analysis of Vitamin D Receptor Gene Polymorphisms and Bone Mineral Density in Postmenopausal Mexican-Mestizo Women. Genet. Mol. Res. 2013, 12, 2755–2763. [Google Scholar] [CrossRef] [PubMed]
- Shah, I.; Akhtar, M.K.; Hisaindee, S.; Rauf, M.A.; Sadig, M.; Ashraf, S.S. Clinical Diagnostic Tools for Vitamin D Assessment. J. Steroid Biochem. Mol. Biol. 2018, 180, 105–117. [Google Scholar] [CrossRef] [PubMed]
- Tsuprykov, O.; Chen, X.; Hocher, C.-F.; Skoblo, R.; Yin, L.H.; Hocher, B. Why Should We Measure Free 25(OH) Vitamin D? J. Steroid Biochem. Mol. Biol. 2018, 180, 87–104. [Google Scholar] [CrossRef] [PubMed]
- Mirhosseini, N.; Rainsbury, J.; Kimball, S.M. Vitamin D Supplementation, Serum 25(OH)D Concentrations and Cardiovascular Disease Risk Factors: A Systematic Review and Meta-Analysis. Front. Cardiovasc. Med. 2018, 5, 87. [Google Scholar] [CrossRef]
- Autier, P.; Boniol, M.; Pizot, C.; Mullie, P. Vitamin D Status and Ill Health: A Systematic Review. Lancet Diabetes Endocrinol. 2014, 2, 76–89. [Google Scholar] [CrossRef]
- Basit, S. Vitamin D in Health and Disease: A Literature Review. Br. J. Biomed. Sci. 2013, 70, 161–172. [Google Scholar] [CrossRef] [PubMed]
- Ogunkolade, B.-W.; Boucher, B.J.; Prahl, J.M.; Bustin, S.A.; Burrin, J.M.; Noonan, K.; North, B.V.; Mannan, N.; McDermott, M.F.; DeLuca, H.F.; et al. Vitamin D Receptor (VDR) mRNA and VDR Protein Levels in Relation to Vitamin D Status, Insulin Secretory Capacity, and VDR Genotype in Bangladeshi Asians. Diabetes 2002, 51, 2294–2300. [Google Scholar] [CrossRef] [PubMed]
- Agliardi, C.; Guerini, F.R.; Saresella, M.; Caputo, D.; Leone, M.A.; Zanzottera, M.; Bolognesi, E.; Marventano, I.; Barizzone, N.; Fasano, M.E.; et al. Vitamin D Receptor (VDR) Gene SNPs Influence VDR Expression and Modulate Protection from Multiple Sclerosis in HLA-DRB1*15-Positive Individuals. Brain Behav. Immun. 2011, 25, 1460–1467. [Google Scholar] [CrossRef] [PubMed]
- Nakamichi, Y.; Udagawa, N.; Suda, T.; Takahashi, N. Mechanisms Involved in Bone Resorption Regulated by Vitamin D. J. Steroid Biochem. Mol. Biol. 2018, 177, 70–76. [Google Scholar] [CrossRef] [PubMed]
- Verlinden, L.; Janssens, I.; Doms, S.; Vanhevel, J.; Carmeliet, G.; Verstuyf, A. Vdr Expression in Osteoclast Precursors Is Not Critical in Bone Homeostasis. J. Steroid Biochem. Mol. Biol. 2019, 195, 105478. [Google Scholar] [CrossRef]
- Cieślińska, A.; Kostyra, E.; Fiedorowicz, E.; Snarska, J.; Kordulewska, N.; Kiper, K.; Savelkoul, H.F.J. Single Nucleotide Polymorphisms in the Vitamin D Receptor Gene (VDR) May Have an Impact on Acute Pancreatitis (AP) Development: A Prospective Study in Populations of AP Patients and Alcohol-Abuse Controls. Int. J. Mol. Sci. 2018, 19, 1919. [Google Scholar] [CrossRef]


| rs Number | SNP Name | Alleles |
|---|---|---|
| rs7975232 | ApaI (Apa 1) | A (T), a (C) |
| rs1544410 | BsmI (Bsm 1) | B (A), b (G) |
| rs2228570 | FokI (Fok 1) | F (C), f (T) |
| rs731236 | TaqI (Taq 1) | T (T), t (C) |
| Genotypes | Control [n (%)] C | Control Arthroplasty [n (%)] CA | Loosening [n (%)] L |
|---|---|---|---|
| AA | 53 (21.72) | 19 (25.00) | 12 (22.22) |
| Aa | 128 (54.46) | 44 (57.90) | 30 (55.56) |
| aa | 63 (25.82) | 13 (17.10) | 12 (22.22) |
| Genotype χ2 (4, 374) =2.54; p = 0.6375 | |||
| Frequency (F) of the alleles | |||
| FA | 0.48 (48) | 0.54 (54) | 0.50 (50) |
| Fa | 0.52 (52) | 0.46 (46) | 0.50 (50) |
| OR (95% CI; p-value) | |||
| C vs. CA + L | C vs. L | CA vs. L | |
| dominant | 0.68 (0.41–1.17; <0.0001) | 0.82 (0.41–1.66; 0.0006) | 1.39 (0.58–3.32; 0.0594) |
| recessive | 0.88 (0.54–1.47; 0.0001) | 0.97 (0.48–1.98; 0.0751) | 1.17 (0.51–2.66; p = 0.71) |
| AA | - | - | - |
| vs. Aa | 0.99 (0.58–1.68; 0.97) | 1.04 (0.59–2.56; 0.03) | 1.08 (0.46–2.55; 0.86) |
| vs aa | 0.67 (0.36–1.29; 0.24) | 0.84 (0.24–2.99; 0.0001) | 1.46 (0.50–4.35; 0.49) |
| Genotypes | Control [n (%)] C | Control Arthroplasty [n (%)] CA | Loosening [n (%)] L |
|---|---|---|---|
| TT | 111 (45.49) | 23 (30.26) | 6 (11.11) |
| Tt | 104 (42.62) | 37 (48.69) | 36 (66.67) |
| tt | 29 (11.89) | 16 (21.05) | 12 (22.22) |
| Genotype χ2 (4, 374) = 25.924; p = 0.000033 | |||
| Frequency (F) of the alleles | |||
| FT | 0.67 (67) | 0.55 (55) | 0.56 (56) |
| Ft | 0.33 (33) | 0.45 (45) | 0.44 (44) |
| OR (95% CI; p-value) | |||
| C vs. CA + L | C vs. L | CA vs. L | |
| dominant | 2.04 (1.15–3.60; 0.0146) | 1.13 (0.52–2.42; 0.75) | 1.07 (1.46–2.49; 0.97) |
| recessive | 2.91 (1.79–4.72; <0.0001) | 6.68 (2.76–16.18; p < 0.0001) | 3.47 (1.30–9.25; 0.01) |
| TT | - | - | - |
| vs. Tt | 2.67 (1.62–4.46; 0.0001) | 6.40 (2.59–15.83; 0.0001) | 1.72 (0.97–3.08; 0.07) |
| vs. tt | 3.70 (1.91–7.17; 0.0001) | 7.66 (2.65–22.14; 0.0002) | 2.88 (0.89–9.36; 0.08) |
| Genotypes | Control [n (%)] C | Control Arthroplasty [n (%)] CA | Loosening [n (%)] L |
|---|---|---|---|
| BB | 33 (13.52) | 15 (19.74) | 13 (24.07) |
| Bb | 145 (59.43) | 48 (63.15) | 35 (64.82) |
| bb | 66 (27.05) | 13 (17.11) | 6 (11.11) |
| Genotype χ2 (4, 374) = 10.258; p = 0.0363 | |||
| Frequency (F) of the alleles | |||
| FB | 0.56 (56) | 0.51 (51) | 0.56 (56) |
| Fb | 0.44 (44) | 0.49 (49) | 0.44 (44) |
| OR (95% CI; p-value) | |||
| C vs. CA + L | C vs. L | CA vs. L | |
| dominant | 0.46 (0.26–0.81; 0.0071) | 0.34 (0.14–0.82; 0.02) | 0.61 (0.32–1.71; 0.34) |
| recessive | 0.57 (0.33–0.99; 0.0475) | 0.49 (0.24–1.01; 0.06) | 0.78 (0.33–1.80; 0.55) |
| BB | - | - | - |
| vs. Bb | 0.67 (0.38–1.20; 0.18) | 0.62 (0.29–1.29; 0.20) | 0.84 (0.36–1.99; 0.69) |
| vs. bb | 0.34 (0.17–0.70; 0.0031) | 0.23 (0.08–0.66; 0.0064) | 0.53 (0.16–1.80; 0.31) |
| Genotypes | Control [n (%)] C | Control Arthroplasty [n (%)] CA | Loosening [n (%)] L |
|---|---|---|---|
| FF | 17 (6.97) | 16 (21.05) | 12 (22.22) |
| Ff | 108 (44.26) | 40 (52.63) | 30 (55.56) |
| ff | 119 (48.77) | 20 (26.32) | 12 (22.22) |
| Genotype χ2 (4, 374) = 29.084; p < 0.00001 | |||
| Frequency (F) of the alleles | |||
| FF | 0.29 (29) | 0.47 (48) | 0.50 (50) |
| Ff | 0.71 (71) | 0.53 (52) | 0.50 (50) |
| OR (95% CI; p-value) | |||
| C vs. CA + L | C vs. L | CA vs. L | |
| dominant | 0.34 (0.21–0.55; <0.0001) | 0.30 (0.15–0.60; 0.0006) | 0.80 (0.35–1.81; 1.0) |
| recessive | 0.27 (0.15–0.52; 0.0001) | 0.26 (0.21–1.08; 0.08) | 0.93 (0.40–2.18; 1.0) |
| FF | - | - | - |
| vs. Ff | 0.39 (0.20–0.77; 0.0066) | 0.39 (0.17–0.91; 0.03) | 1.00 (0.41–2.42; 1.0) |
| vs. ff | 0.16 (0.08–0.33; <0.0001) | 0.14 (0.06–0.37; 0.0001) | 0.80 (0.28–2.25; 0.67) |
| Haplotype | Case (Freq) | Control (Freq) | χ2 | Fisher’s p | Pearson’s p | OR [95% CI] |
|---|---|---|---|---|---|---|
| ACAT | 11 (0.101) | 80 (0.125) | 0.463 | 0.632 | 0.496 | 0.79 [0.41–1.55] |
| ACAC | 28 (0.259) | 83 (0.129) | 12.276 | 0.001 | 0.0004 | 2.35 [1.44–3.83] |
| CTGT | 23 (0.212) | 178 (0.278) | 1.996 | 0.196 | 0.157 | 0.70 [0.43–1.15] |
| ATGT | 6 (0.055) | 79 (0.123) | 4.227 | 0.047 | 0.039 | 0.42 [0.18–0.98] |
| CTAT | 7 (0.064) | 26 (0.040) | 1.282 | 0.305 | 0.257 | 1.64 [0.69–2.87] |
| ATAT | 1 (0.009) | 30 (0.046) | 3.291 | 0.07 | 0.069 | 0.19 [0.03–1.41] |
| ATAC | 2 (0.018) | 23 (0.035) | 0.867 | 0.561 | 0.351 | 0.51 [0.12–2.18] |
| CCAC | 5 (0.046) | 18 (0.028) | 1.023 | 0.359 | 0.311 | 1.68 [0.61–4.62] |
| CTGC | 5 (0.046) | 50 (0.078) | 1.374 | 0.319 | 0.241 | 0.57 [0.22–1.47] |
| Haplotype | Case (Freq) | Control (Freq) | χ2 | Fisher’s p | Pearson’s p | OR [95% CI] |
|---|---|---|---|---|---|---|
| ACAT | 11 (0.101) | 64 (0.131) | 0.689 | 0.521 | 0.406 | 0.75 [0.38–1.48] |
| ACAC | 28 (0.259) | 60 (0.122) | 13.055 | 0.0008 | 0.0003 | 2.50 [1.50–4.15] |
| CTGT | 21 (0.194) | 151 (0.309) | 5.694 | 0.018 | 0.017 | 0.54 [0.32–0.9] |
| ATGT | 6 (0.055) | 65 (0.133) | 5.079 | 0.021 | 0.024 | 0.38 [0.16–0.91] |
| CTAT | 7 (0.064) | 21 (0.043) | 0.937 | 0.319 | 0.333 | 1.54 [0.64–3.72] |
| CTGC | 7 (0.064) | 41 (0.084) | 0.440 | 0.695 | 0.506 | 0.76 [0.33–1.73] |
| ATAT | 1 (0.009) | 24 (0.049) | 3.506 | 0.064 | 0.061 | 0.18 [0.02–1.35] |
| Results | Study Cohort | Case | References |
|---|---|---|---|
| FokI—Ff genotype strongly associated with femoral hip BMD compared to the control group, which had the lowest hip BMD; TaqI—TT genotype associated with the lowest hip BMD compared to the control; tt genotype—highest hip BMD ApaI—Aa correlated with the lowest mean of BMD; aa genotype correlated with highest hip BMD; BsmI—bb genotype correlated with the lowest hip BMD, while the BB genotype had the highest hip BMD. | N = 65 of osteoporosis patients; N = 30 controls | BMD | [40] |
| ApaI—No significant difference was found between the different genotypes with regard to the occurrence of osteoporosis with osteoporotic fractures. | Total of 378 patients N = 235 BMD cases; N = 65 decreasing BMD patients | BMD | [50] |
| The genotypes of BsmI, TaqI, and FokI were not significantly associated with BMD; ApaI—AA genotype had a higher lumbar spine BMD than the individuals with the aa VDR genotype. | N = 83 | BMD | [51] |
| ApaI—BMD was lower in patients with genotype aa compared to genotype AA. | N = 136 woman (75—osteoporosis, 37—osteopenia and 24—normal BMD) | BMD | [46] |
| Bsm/Apa/Taq BB/AA/tt (AATTCC) haplotype was a risk factor for OP (OR: 5.66), while BbaaTT (AGCCTT) had a protective effect (OR = 0.10). | N = 147 postmenopausic women; (71 OP and 76 controls) | BMD | [52] |
| VDR polymorphisms are not associated with the risk of hip fractures. | N = 126 (67 with fractures, 59 healthy) | BMD | [53] |
| FokI is associated with osteoporosis (ORff+Ff vs. FF = 1.19); TaqI is associated with osteoporosis (ORTT+Tt vs. tt = 1.35). | N = 6880 cases and n = 8049 controls (meta-analysis) | BMD | [45] |
| TaqI—CC (tt) genotype associated with increased risk of hip fracture (OR = 2.6; 95%CI = 1.2–5.3) and BMD. | N = 677 postmenopausal women, n = 69 hip fracture status | BMD | [47] |
| TaqI—low BMD has been associated with the tt (or AA or BB) genotype. | N = 43 osteoporotic postmenopausal women N = 139 healthy women | BMD | [54] |
| No association between the VDR genotype and osteoporosis. | N = 118 premenopausal women | BMD | [44] |
| BsmI—(GG) bb genotype had a femoral neck bone density of 0.79 standard deviations lower than individuals with BB genotype. | N = 44 osteoporosis; N = 44 controls | BMD | [55] |
| ApaI, BsmI, TaqI—no correlation between the VDR genotypes and BMD. | N = 84 osteoporosis woman N = 807 controls | BMD | [56] |
| ApaI and FokI—no association between genotypes and BMD BsmI—BB + Bb genotypes more frequent in patients with osteoporotic fractures; TaqI—TT-genotyped patients had a higher BMD compared to Tt or tt. | N = 192 osteoporosis patients, = 207 controls | BMD | [57] |
| FokI—(TT) ff genotype had a significantly lower BMD at the hip than those with the Ff genotype; the difference between the two homozygous genotypes (FF vs. ff) was not significant at any point; ApaI, BsmI and TaqI polymorphisms were not associated with BMD. | N = 114 postmenopausal women including n = 33 healthy controls and n= 65 osteoporotic | BMD | [58] |
| TaqI with T allele was significantly associated with BMD, while the Apa aa variant, the Bsm bb variant and the TT Taq variant occurred most frequently in groups with higher fracture risk. | N = 187 osteoporotic patients, n = 19 controls | BMD | [48] |
| Bsm/Apa/Taq: bbAATT and bbTtAa were more frequent in the osteoporosis group compared to the healthy control group. | n = 200 with osteoporosis, n = 146 healthy controls | BMD | [49] |
| FokI—(F) C allele nearly associated with the development of osteoporosis compared to control (OR = 1.783, 95%CI = 0.98–3.25, p = 0.058). | N—120 postmernopausal women (n = 88 non osteoporotic, 144—osteopenic, n = 88 osteoporotic) | BMD | [59] |
| Characteristics | L (n = 54) | CA (n = 76) | C (n = 244) | p-Value (L vs. CA/L vs. C/CA vs. C) |
|---|---|---|---|---|
| Age: years mean (SD) | 52.7 (9.0) | 54.0 (10.8) | 51 (9.5) | 0.74/0.46/0.05 * |
| Gender: n (%) | ||||
| Female | 22 (41) | 19 (25) | 120 (49) | |
| Male | 32 (59) | 57 (75) | 124 (51) | |
| χ2 (2, 374) = 13.9573 | 0.0009 | |||
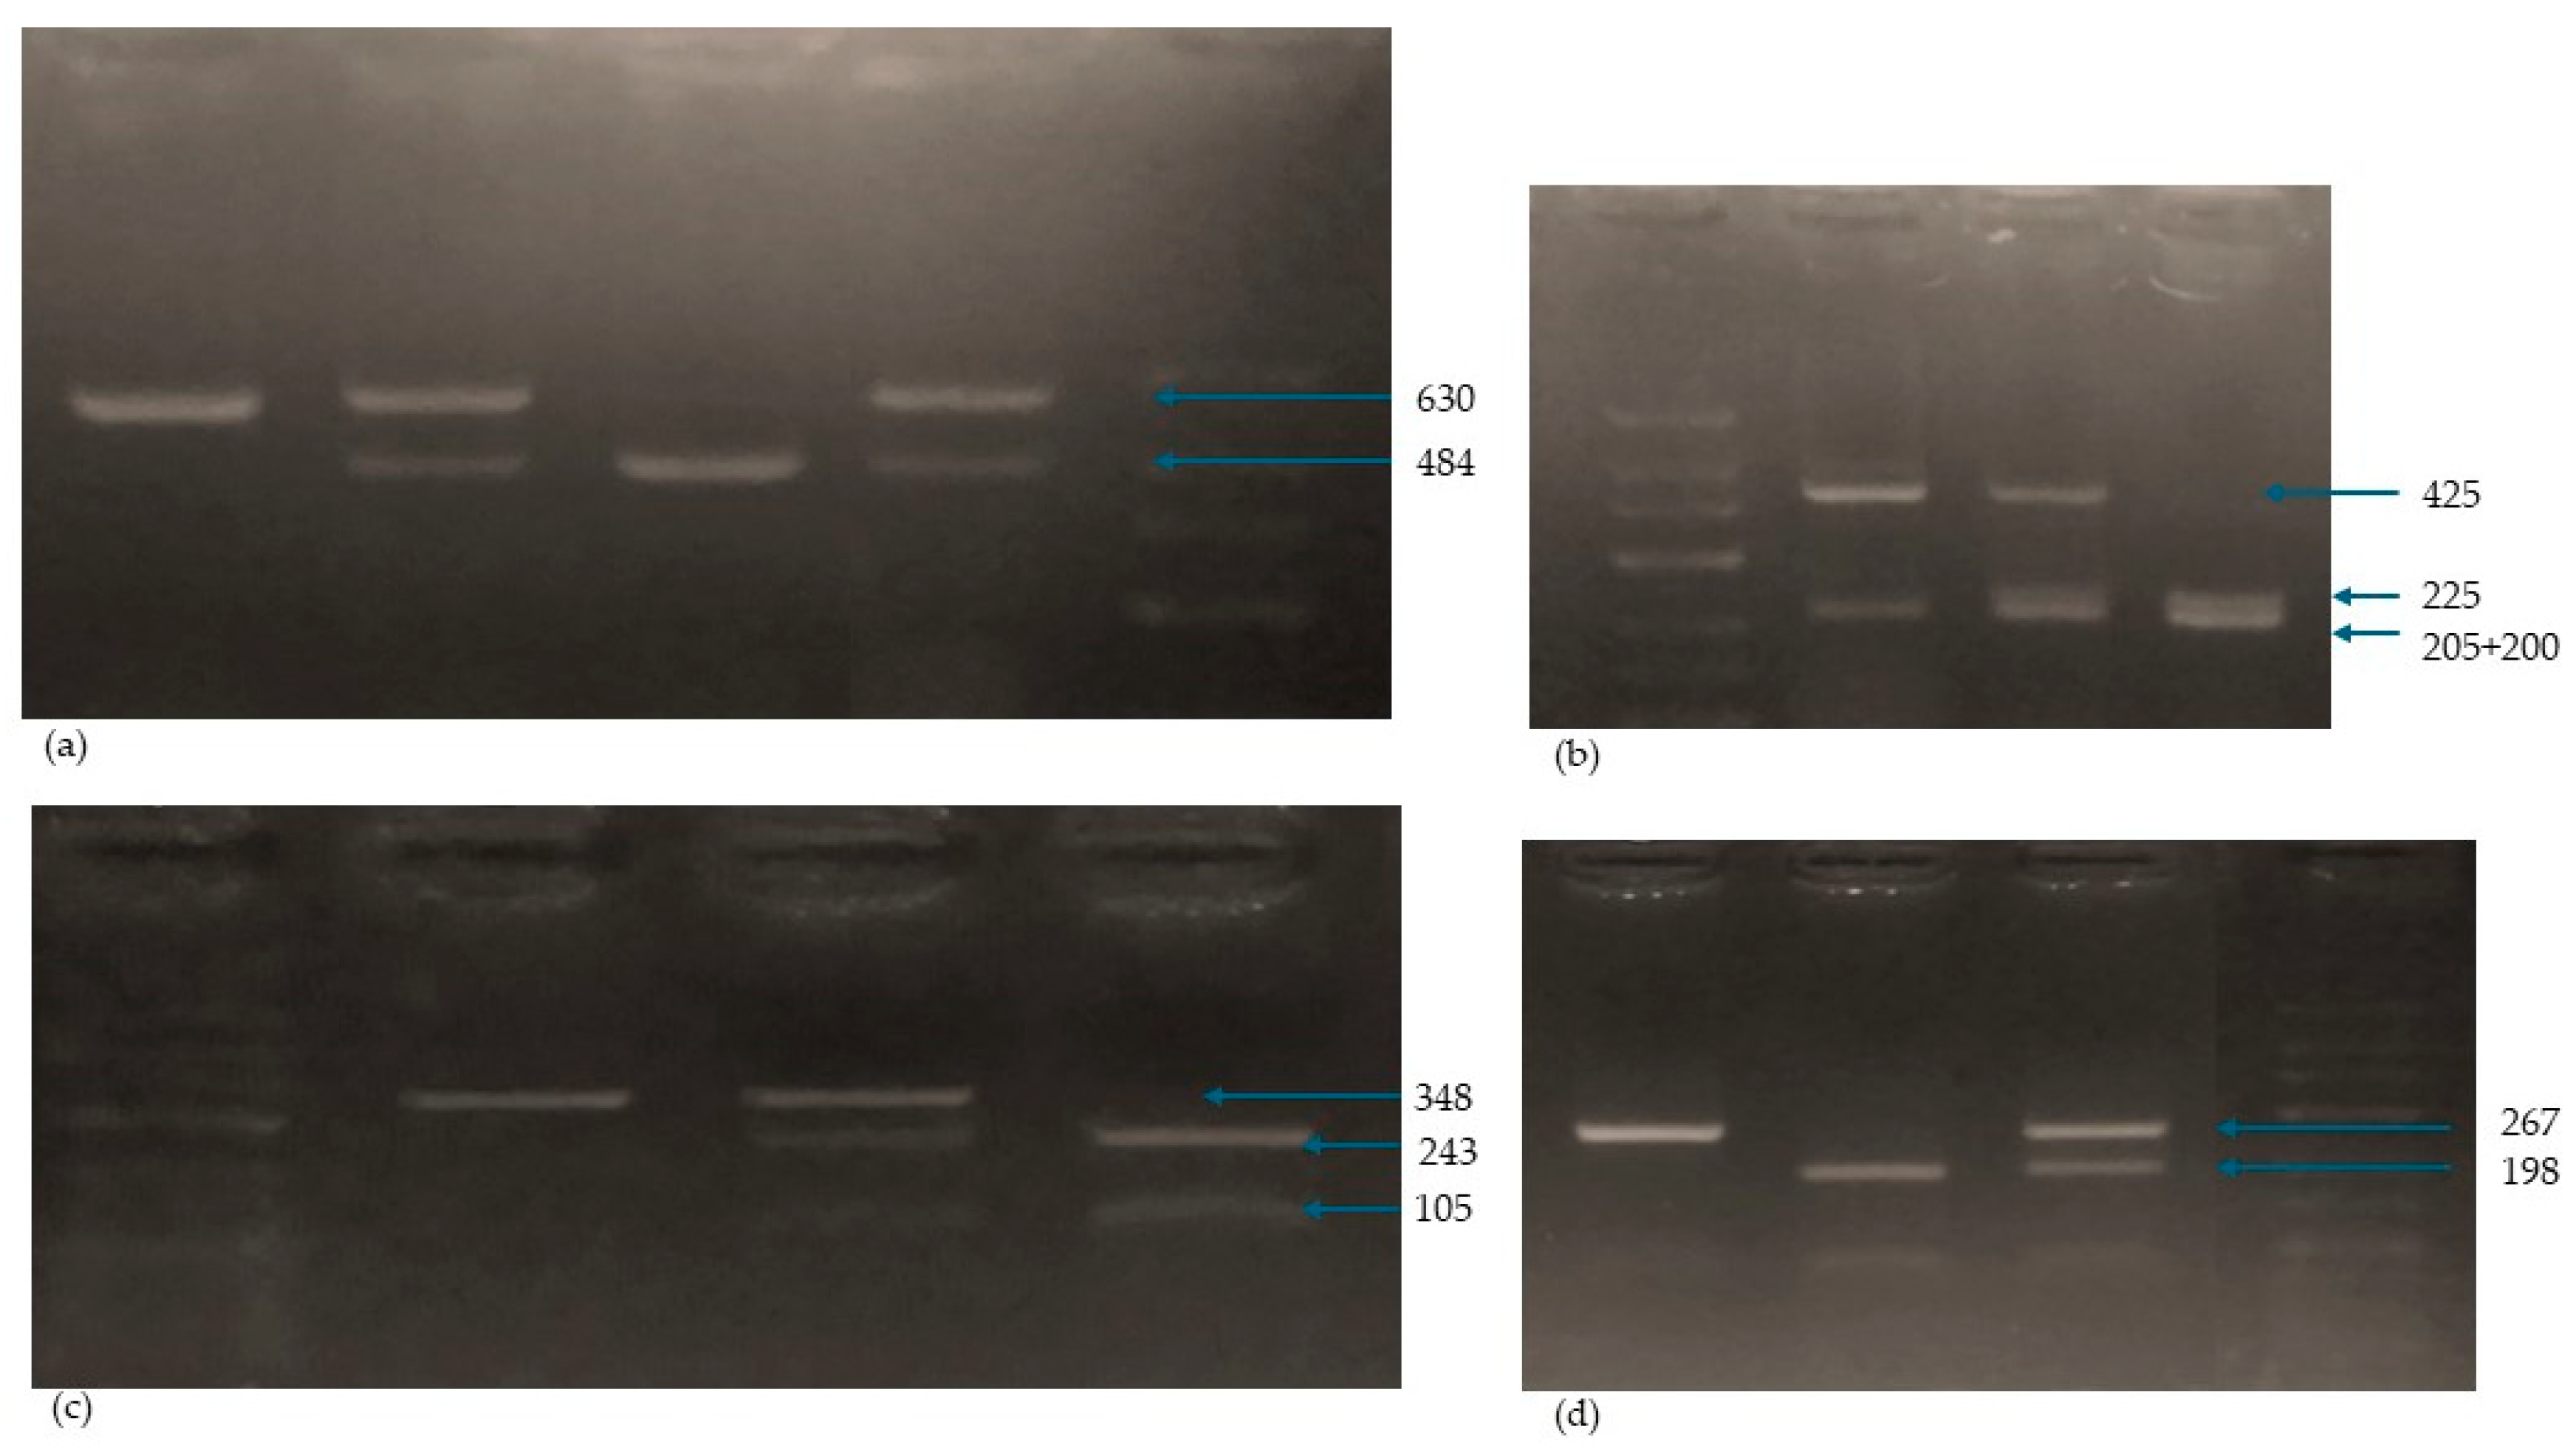
| SNP | Primer Sequence for PCR | Enzyme | PCR Conditions | PCR-RFLP Amplicon |
|---|---|---|---|---|
| Fok-I rs2228570 | Fok1R: 5-ATGGAAACACCTTGCTTCTTCTCCCTC-3 | FokI | Initial denaturation: 94 °C/3 min denaturation: 94 °C/30 s. annealing: 61 °C/30 s. synthesis: 72 °C/30 s. number of cycles: 35 | ff: 198, 69 FF: 267 Ff: 267, 198, 69 PCR product: 267 |
| Fok11F: 5-AGCTGGCCCTGGCACTGACTCtGGCTCT-3 | ||||
| Bsm-I rs1544410 | Bsm1F: 5-CGGGGAGTATGAAGGACAAA-3 | BsmI | Initial denaturation: 94 °C/3 min denaturation: 94 °C/30 s. annealing: 64 °C/30 s. synthesis: 72 °C/30 s. number of cycles: 35 | bb: 243, 105 BB: 348 Bb: 348, 243, 105 PCR product: 348 |
| Bsm1R: 5-CCATCTCTCAGGCTCCAAAG-3 | ||||
| Taq-I rs731236 | Taq1F: 5-GGATCCTAAATGCACGGAGA-3 Taq1R: 5-AGGAAAGGGGTTAGGTTGGA-3 | TaqI | Initial denaturation: 94 °C/3 min denaturation: 94 °C/30 s. annealing: 62 °C/30 s. synthesis: 72 °C/30 s. number of cycles: 35 | tt: 225, 200, 205 TT: 425, 205 Tt: 425, 225, 200, 205 PCR product: 630 |
| Apa-I rs7975232 | ApaI | aa: 484, 146 AA: 630 Aa: 630, 484, 146 PCR product: 630 |
Disclaimer/Publisher’s Note: The statements, opinions and data contained in all publications are solely those of the individual author(s) and contributor(s) and not of MDPI and/or the editor(s). MDPI and/or the editor(s) disclaim responsibility for any injury to people or property resulting from any ideas, methods, instructions or products referred to in the content. |
© 2024 by the authors. Licensee MDPI, Basel, Switzerland. This article is an open access article distributed under the terms and conditions of the Creative Commons Attribution (CC BY) license (https://creativecommons.org/licenses/by/4.0/).
Share and Cite
Rozmus, D.; Fiedorowicz, E.; Grzybowski, R.; Płomiński, J.; Cieślińska, A. VDR Gene Polymorphisms (BsmI, FokI, TaqI, ApaI) in Total Hip Arthroplasty Outcome Patients. Int. J. Mol. Sci. 2024, 25, 8225. https://doi.org/10.3390/ijms25158225
Rozmus D, Fiedorowicz E, Grzybowski R, Płomiński J, Cieślińska A. VDR Gene Polymorphisms (BsmI, FokI, TaqI, ApaI) in Total Hip Arthroplasty Outcome Patients. International Journal of Molecular Sciences. 2024; 25(15):8225. https://doi.org/10.3390/ijms25158225
Chicago/Turabian StyleRozmus, Dominika, Ewa Fiedorowicz, Roman Grzybowski, Janusz Płomiński, and Anna Cieślińska. 2024. "VDR Gene Polymorphisms (BsmI, FokI, TaqI, ApaI) in Total Hip Arthroplasty Outcome Patients" International Journal of Molecular Sciences 25, no. 15: 8225. https://doi.org/10.3390/ijms25158225