
Computational Methods for the Discovery and Optimization of TAAR1 and TAAR5 Ligands


Abstract
1. Introduction
2. Molecular Modeling Studies in the Discovery and Optimization of TAAR1/5 Ligands
2.1. Computational Methods Exploring mTAAR1 Ligands
2.2. Computational Methods Exploring hTAAR1 Ligands
3. Structural Information of TAAR1 as Druggable Target
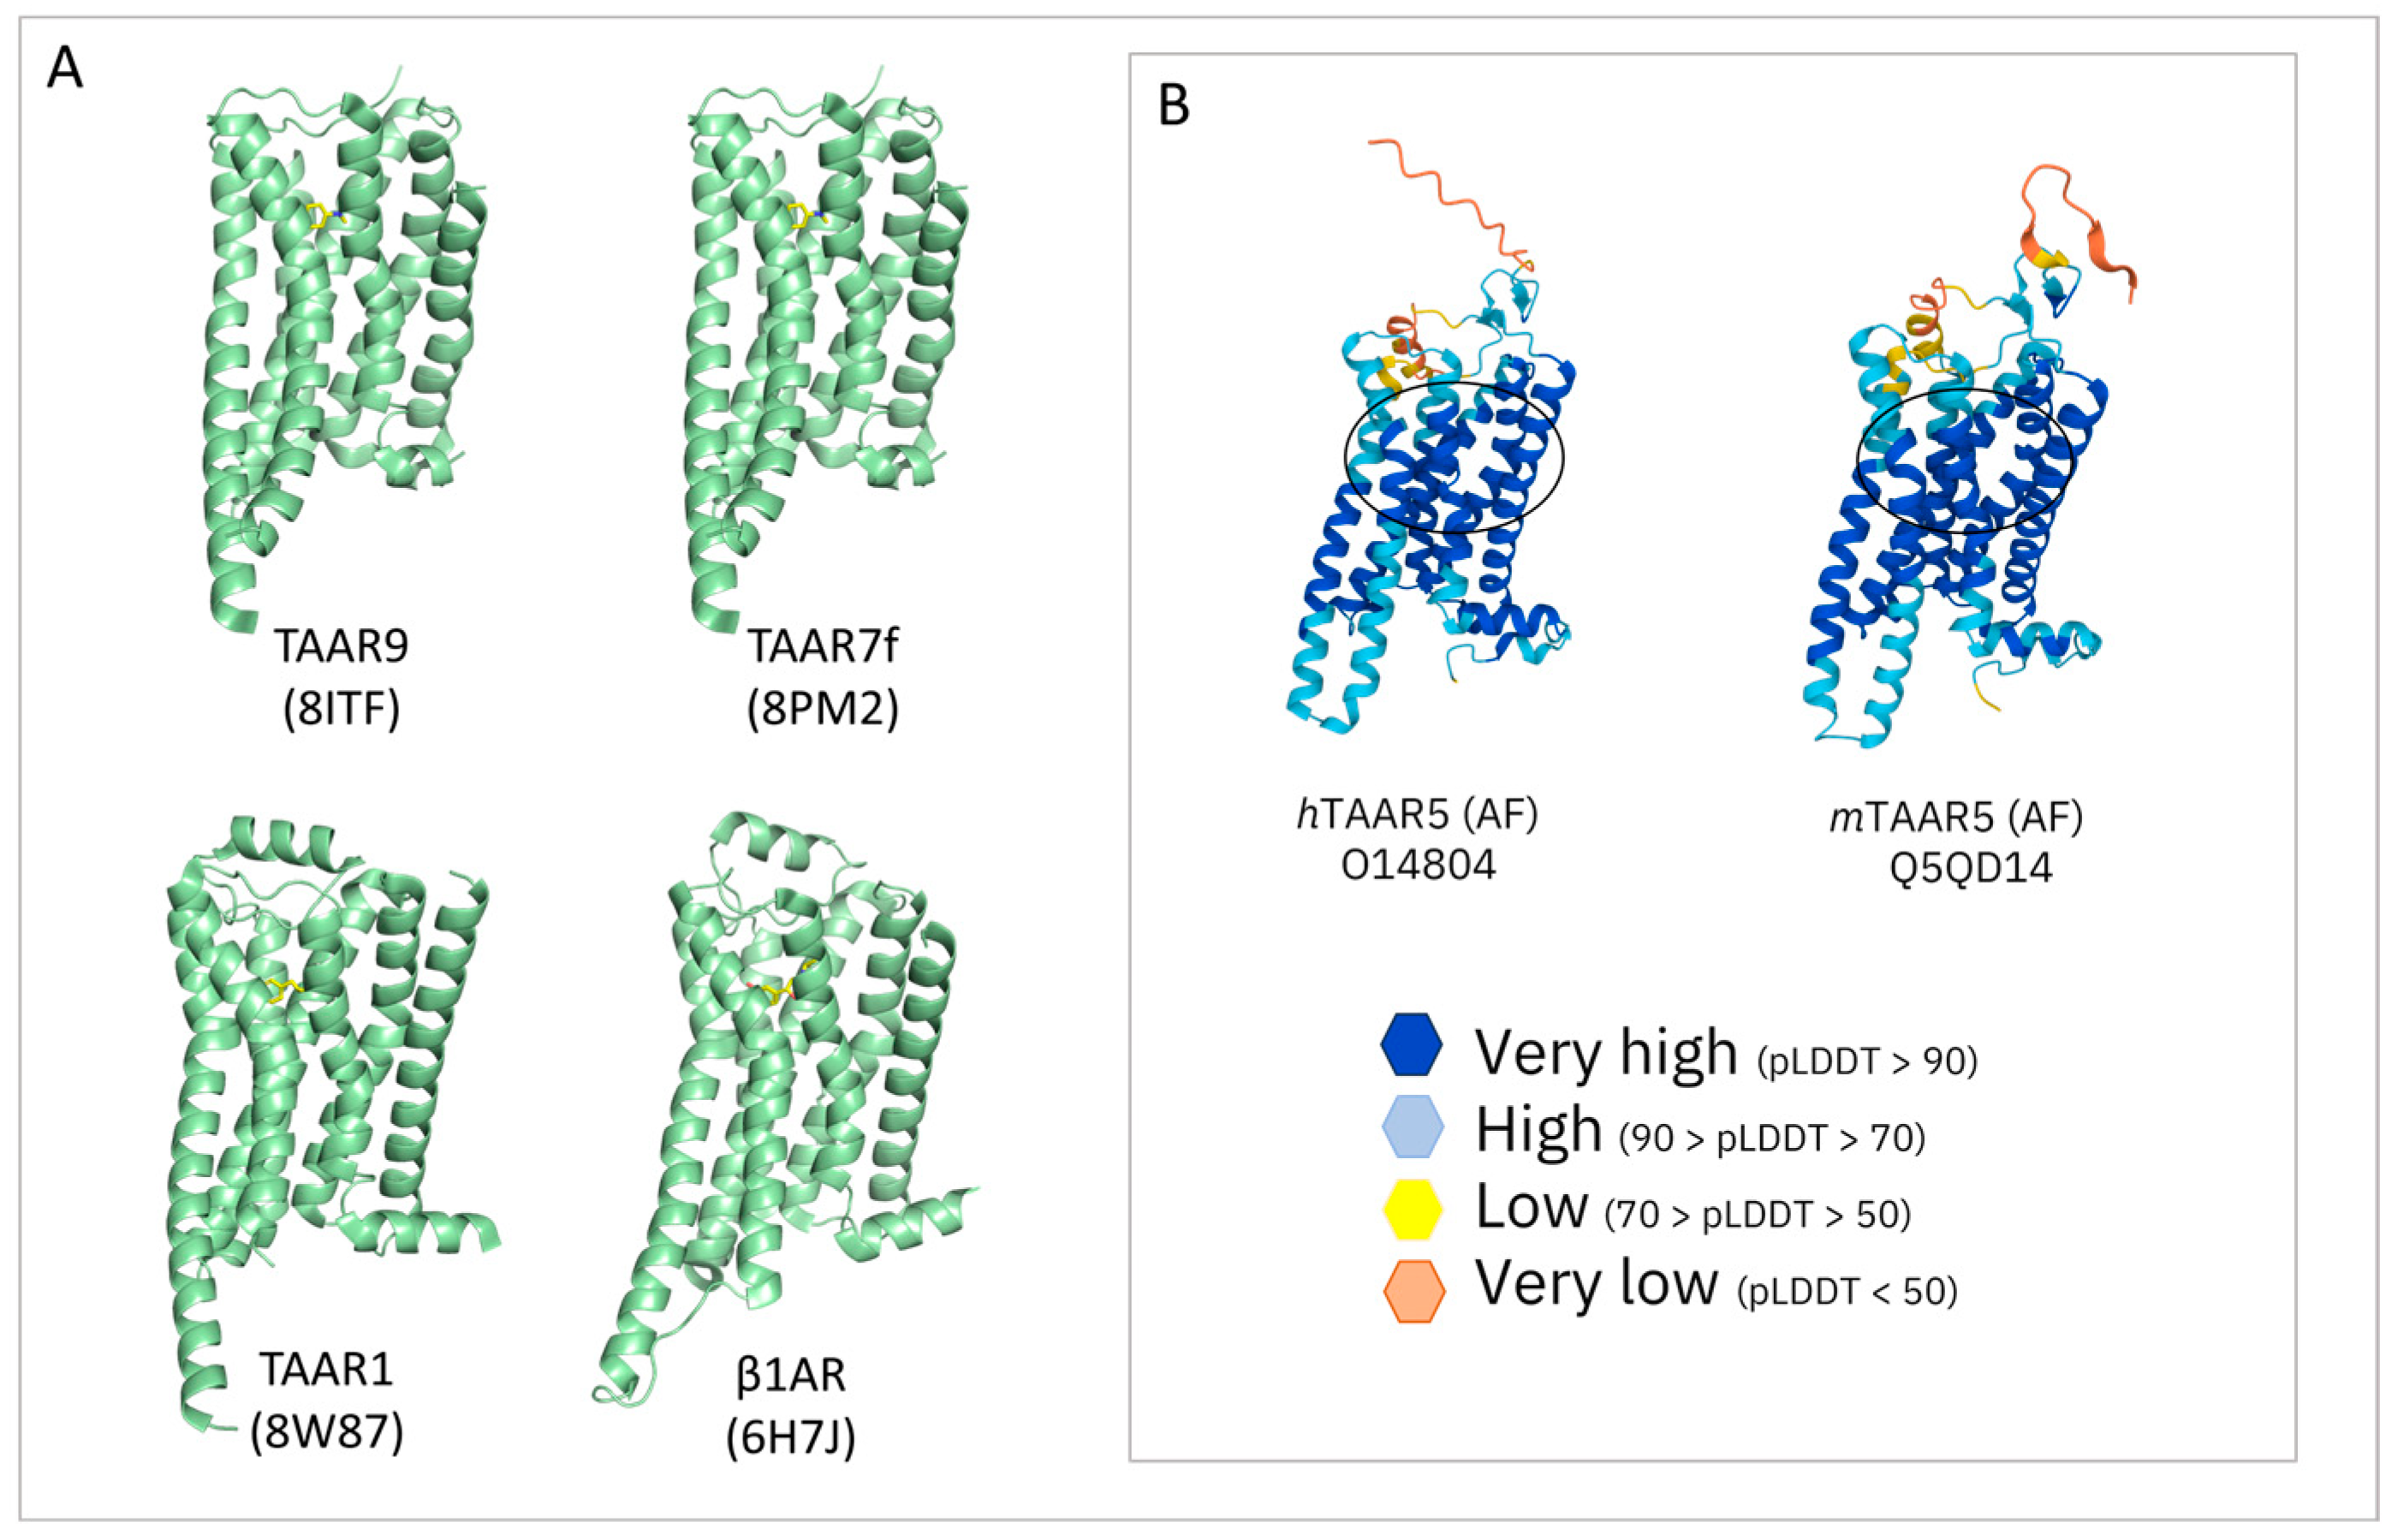
3.1. Theoretical Models of TAAR1: An Overview
3.2. TAAR1 Experimental Data and Mutagenesis Information
3.3. Comparison of the Binding Pockets of hTAAR1 and mTAAR1
4. Computational Methods Guiding the Discovery of TAAR5 Ligands
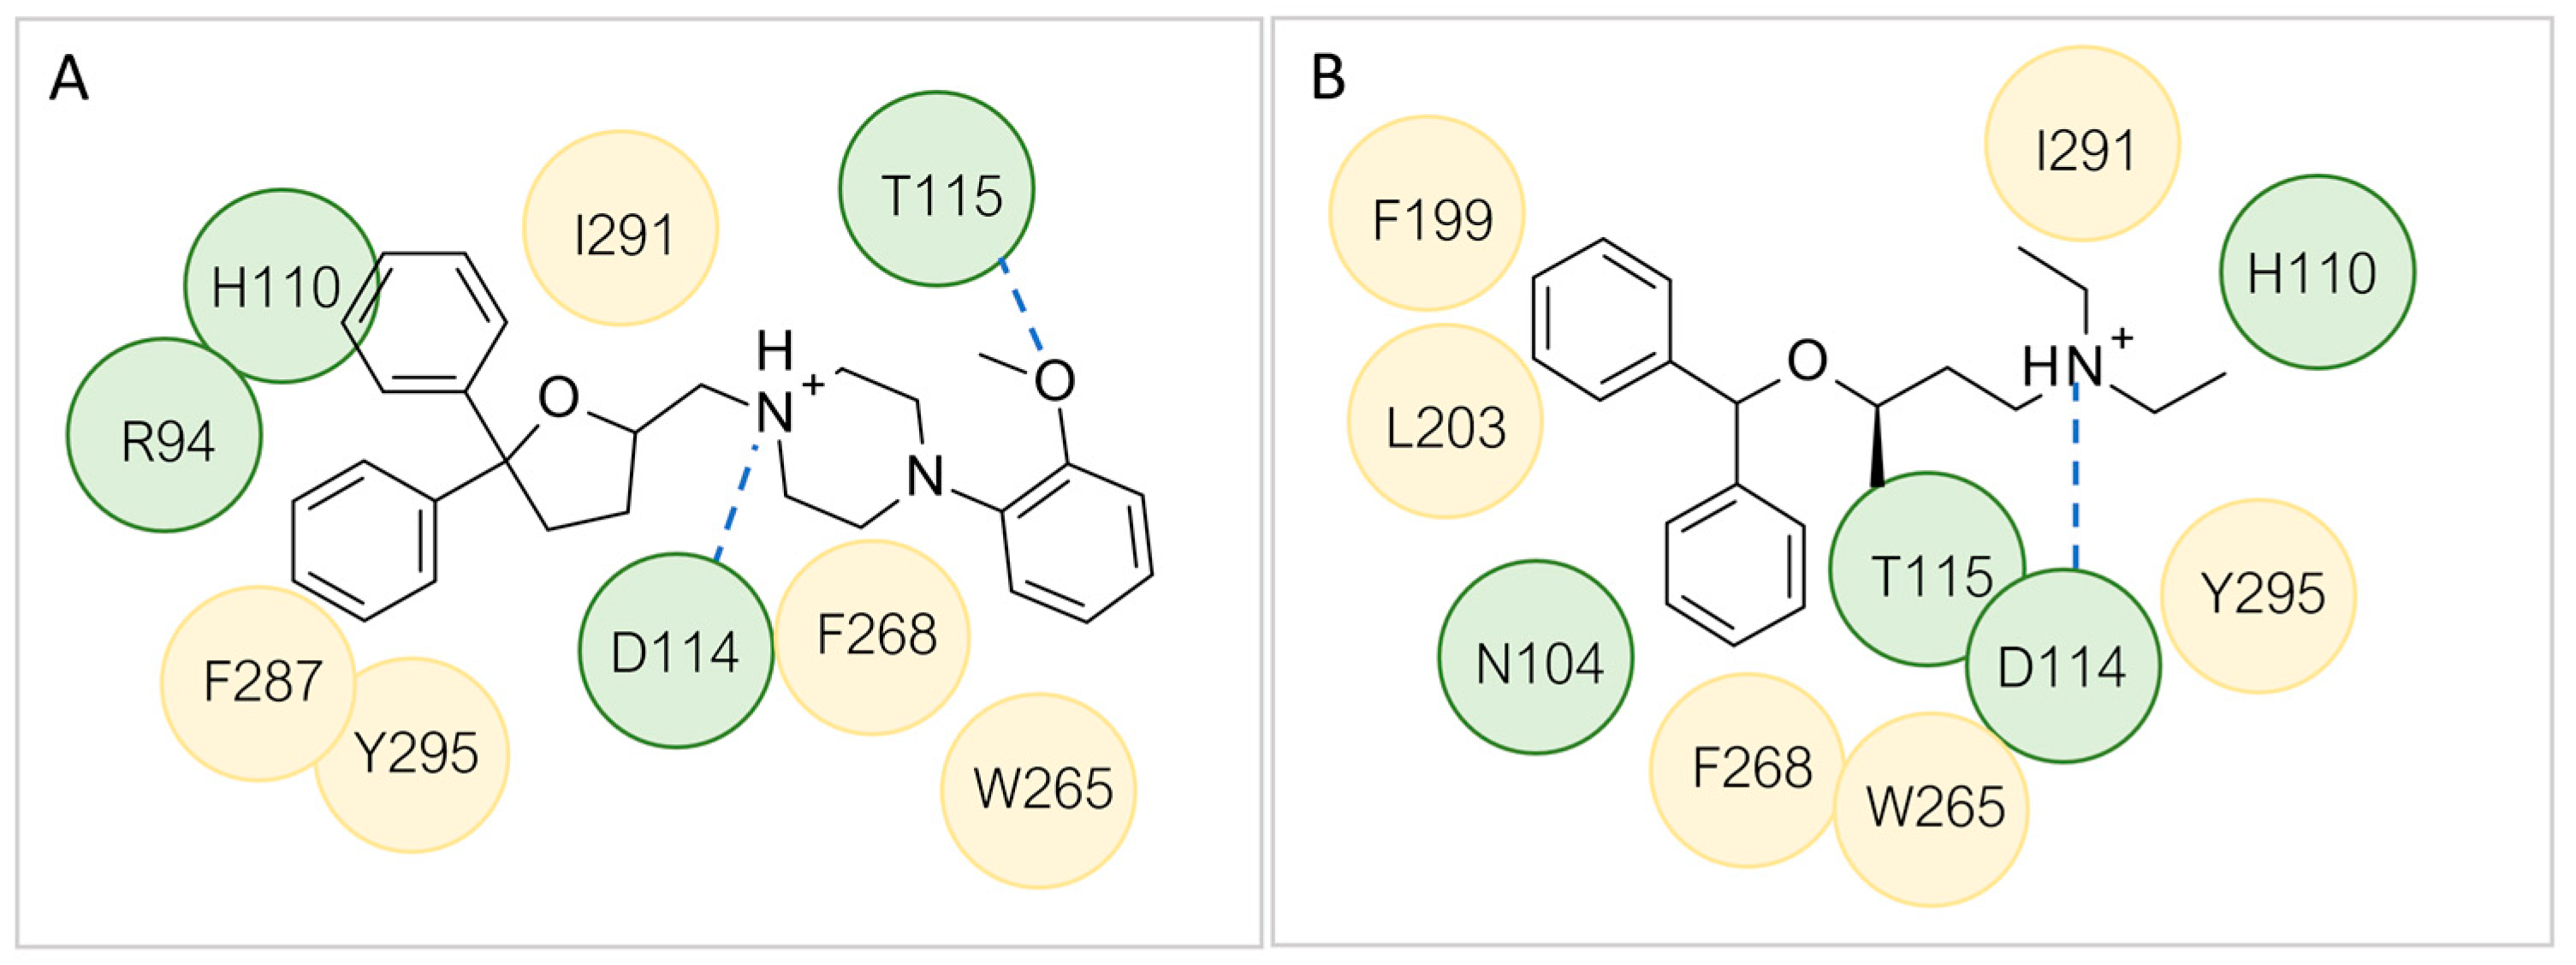
4.1. In Silico Screening of Novel TAAR5 Ligands
4.2. TAAR5: Better Templates for New HMs
5. TAAR1/5 and Other GPCRs: A Repositioning Perspective
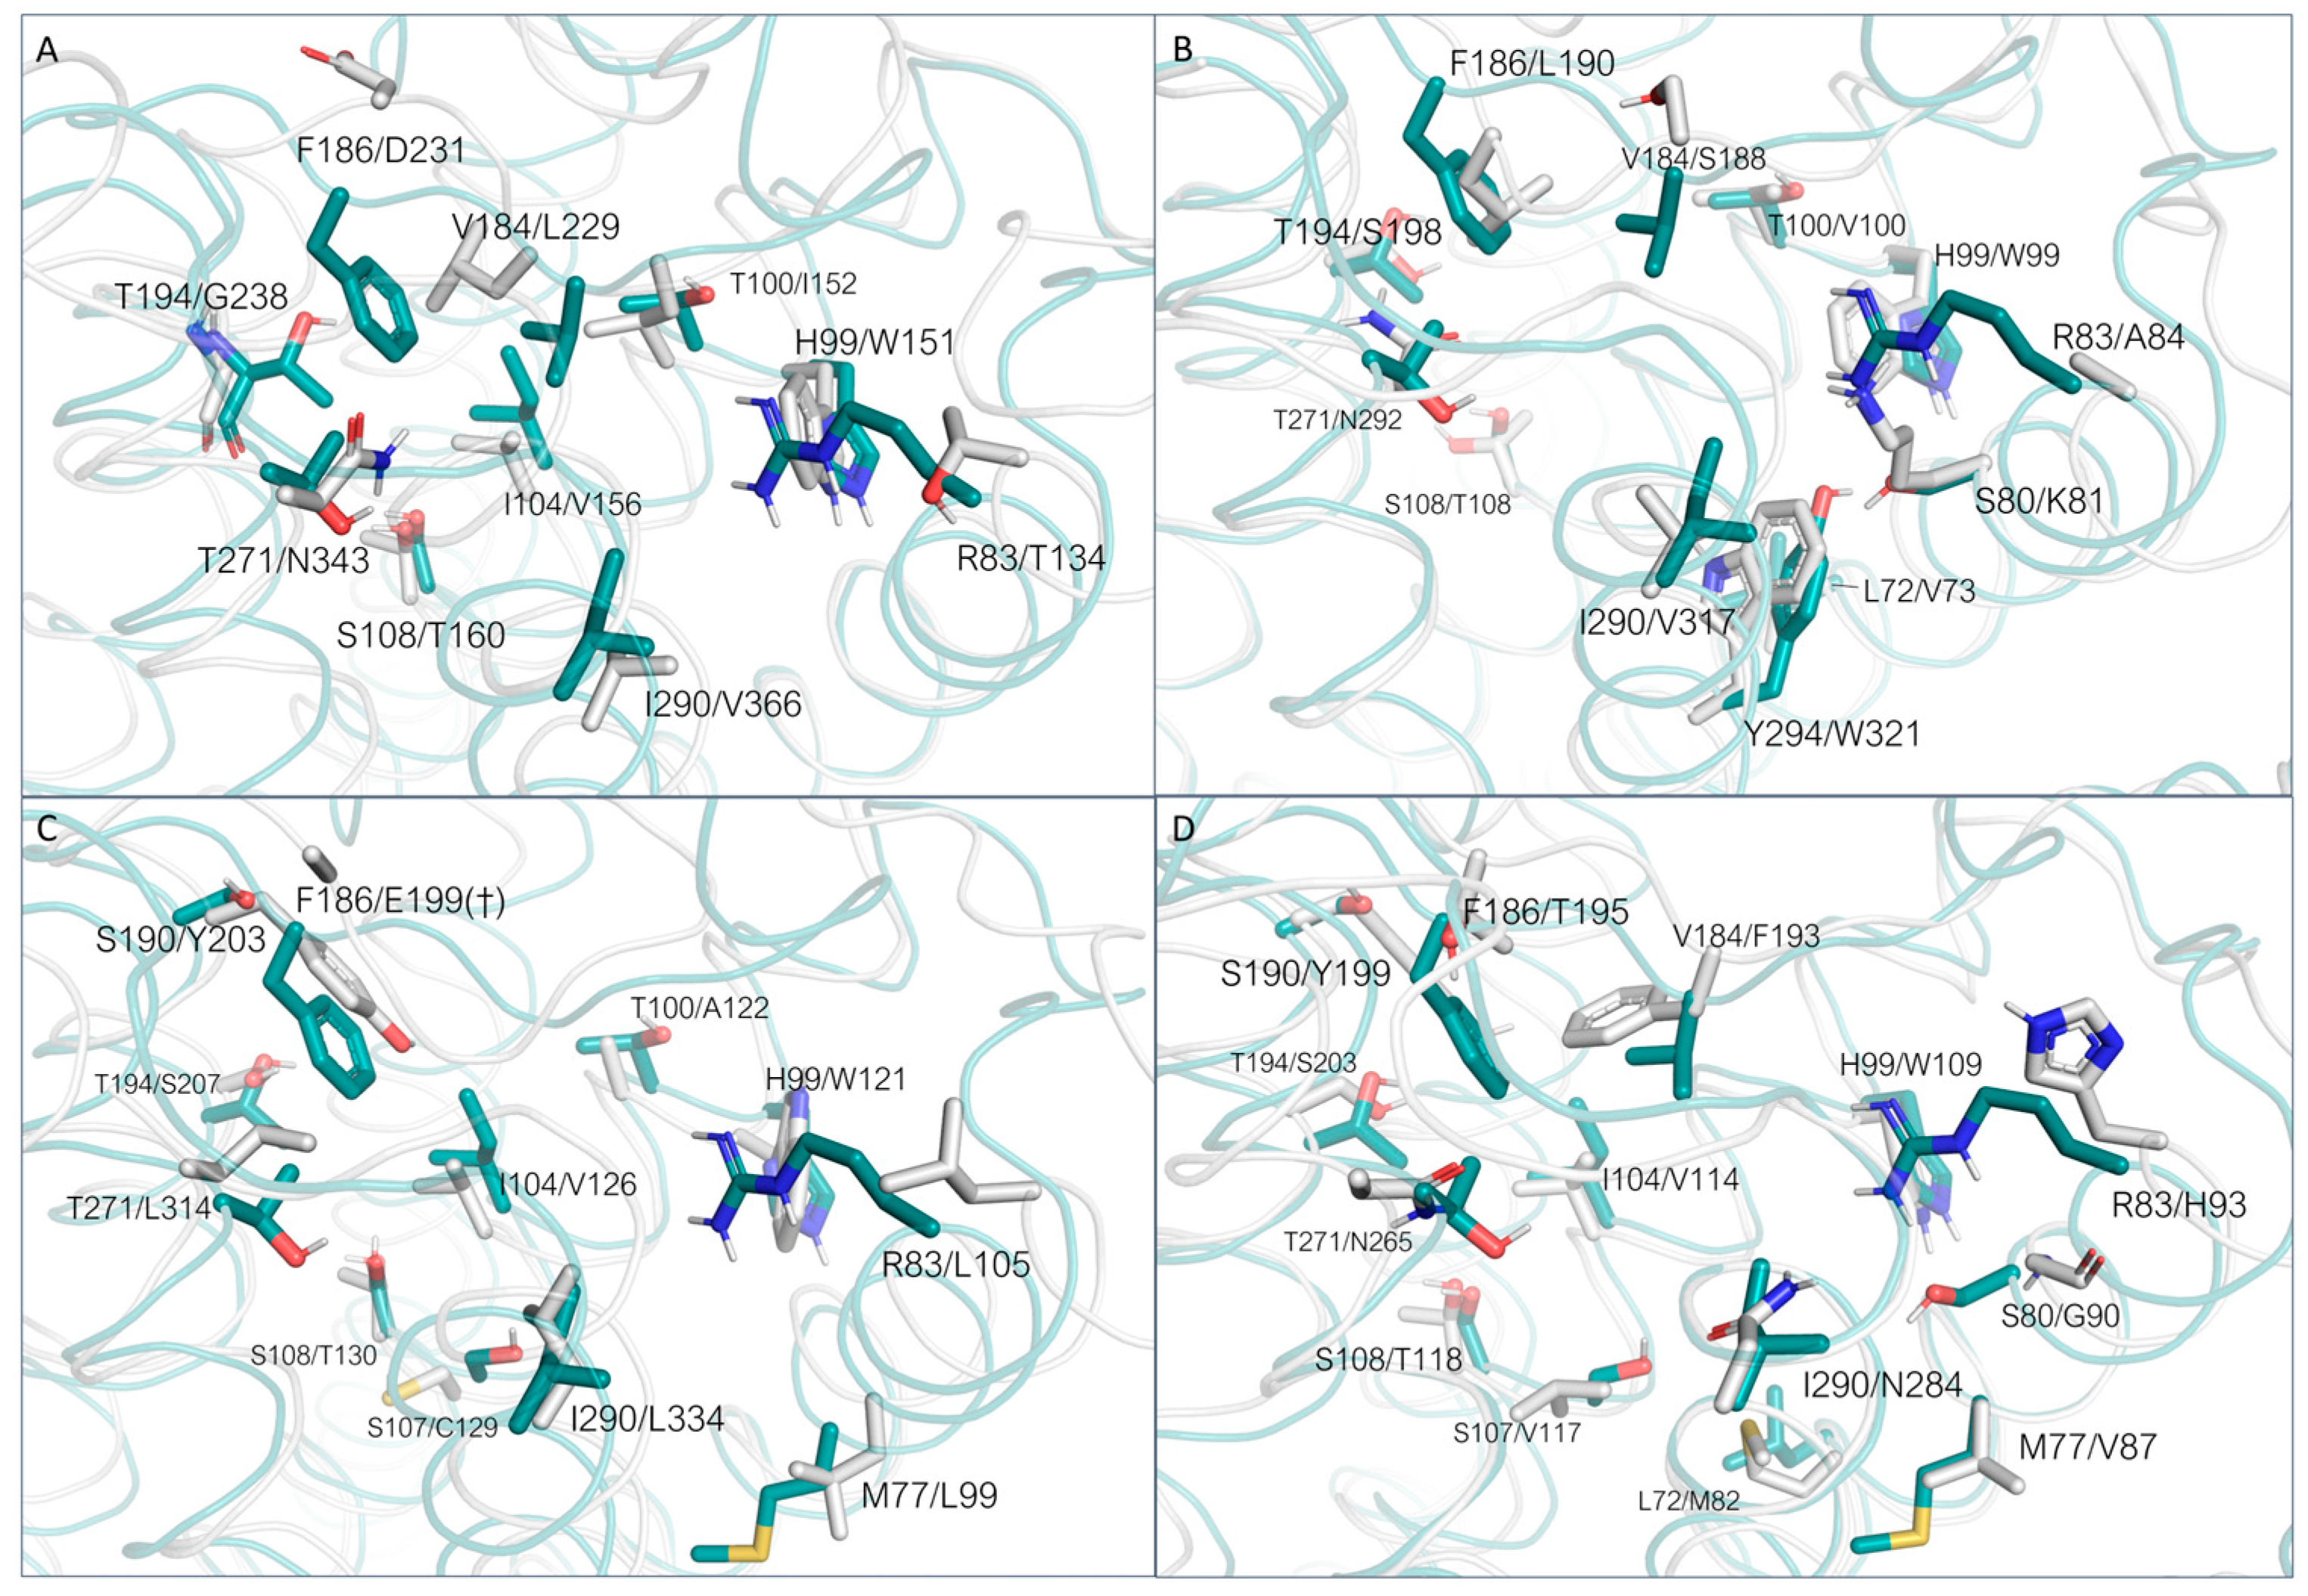
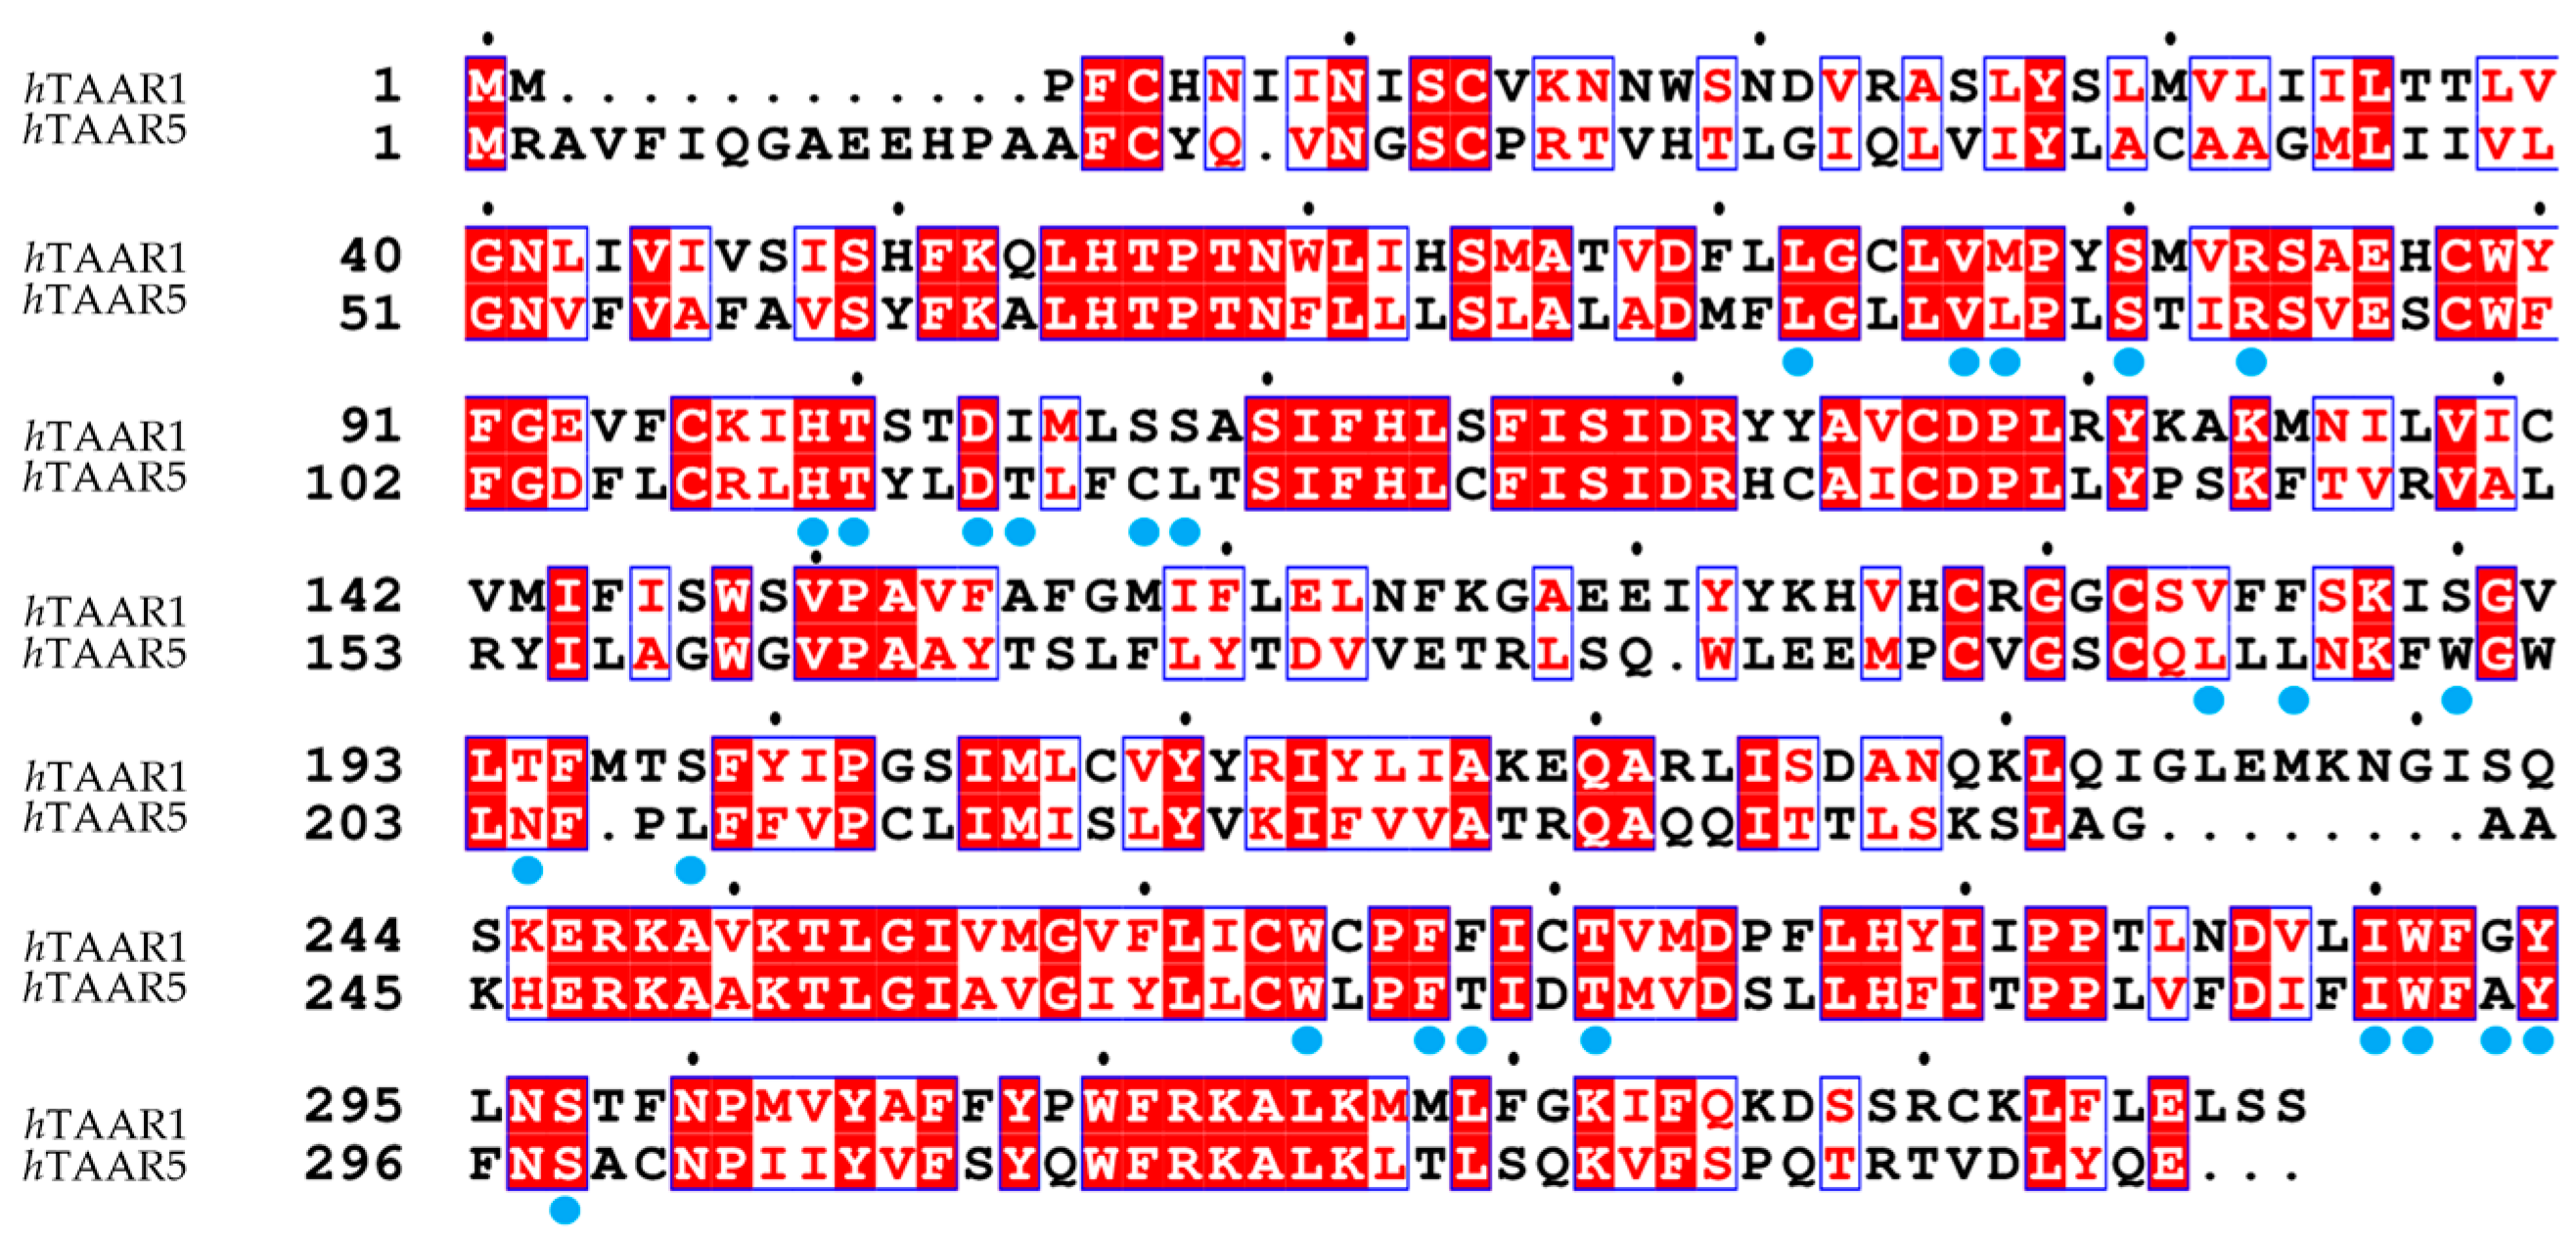
5.1. Comparison of hTAAR1 and Druggable GPCRs
5.2. Comparison of hTAAR5 and Druggable GPCRs
6. Conclusions
Author Contributions
Funding
Institutional Review Board Statement
Informed Consent Statement
Data Availability Statement
Conflicts of Interest
List of Abbreviations
| β-PEA | β-phenylethylamine |
| T1AM | 3-iodothyronamine |
| TMA | trimethylamine |
| CHA | cyclohexylammonium ion |
| METH | methamphetamine |
| AMPH | amphetamine |
| (Q)SAR | (quantitative) structure-activity relationship |
| HM | homology model |
| VS | virtual screening |
| HTS | high throughput screening |
| ROC-AUC | (receiver operating characteristic-area under the curve) |
| RMSD | root mean square deviation |
| AF | AlphaFold |
| β2-ADR | β2-adrenoreceptor |
| 5-HT6R | 5-hydroxytryptamine receptor 6 |
| 5-HT2AR | 5-hydroxytryptamine receptor 2A |
| 5-HT2BR | 5-hydroxytryptamine receptor 2B |
| M3R | muscarinic acetylcholine receptor |
| D1R | dopamine D1 receptor |
| α1A-ADR | α1A-adrenergic receptor |
| α1B-ADR | α 1B-adrenergic receptor |
| α2A-ADR | α2A-adrenergic receptor |
| H2R | hystidine receptor type 2 |
| SEP-363856 | ulotaront |
| RO-6889450 | ralmitaront |
References
- Gainetdinov, R.R.; Hoener, M.C.; Berry, M.D. Trace Amines and Their Receptors. Pharmacol. Rev. 2018, 70, 549–620. [Google Scholar] [CrossRef]
- Bunzow, J.R.; Sonders, M.S.; Arttamangkul, S.; Harrison, L.M.; Zhang, G.; Quigley, D.I.; Darland, T.; Suchland, K.L.; Pasumamula, S.; Kennedy, J.L.; et al. Amphetamine, 3,4-Methylenedioxymethamphetamine, Lysergic Acid Diethylamide, and Metabolites of the Catecholamine Neurotransmitters Are Agonists of a Rat Trace Amine Receptor. Mol. Pharmacol. 2001, 60, 1181–1188. [Google Scholar] [CrossRef] [PubMed]
- Borowsky, B.; Adham, N.; Jones, K.A.; Raddatz, R.; Artymyshyn, R.; Ogozalek, K.L.; Durkin, M.M.; Lakhlani, P.P.; Bonini, J.A.; Pathirana, S.; et al. Trace Amines: Identification of a Family of Mammalian G Protein-Coupled Receptors. Proc. Natl. Acad. Sci. USA 2001, 98, 8966–8971. [Google Scholar] [CrossRef] [PubMed]
- Rutigliano, G.; Accorroni, A.; Zucchi, R. The Case for TAAR1 as a Modulator of Central Nervous System Function. Front. Pharmacol. 2017, 8, 987. [Google Scholar] [CrossRef] [PubMed]
- Liberles, S.D.; Buck, L.B. A Second Class of Chemosensory Receptors in the Olfactory Epithelium. Nature 2006, 442, 645–650. [Google Scholar] [CrossRef] [PubMed]
- Liberles, S.D. Trace Amine-Associated Receptors: Ligands, Neural Circuits, and Behaviors. Curr. Opin. Neurobiol. 2015, 34, 1–7. [Google Scholar] [CrossRef]
- Espinoza, S.; Sukhanov, I.; Efimova, E.V.; Kozlova, A.; Antonova, K.A.; Illiano, P.; Leo, D.; Merkulyeva, N.; Kalinina, D.; Musienko, P.; et al. Trace Amine-Associated Receptor 5 Provides Olfactory Input into Limbic Brain Areas and Modulates Emotional Behaviors and Serotonin Transmission. Front. Mol. Neurosci. 2020, 13, 18. [Google Scholar] [CrossRef]
- Efimova, E.V.; Kuvarzin, S.R.; Mor, M.S.; Katolikova, N.V.; Shemiakova, T.S.; Razenkova, V.; Ptukha, M.; Kozlova, A.A.; Murtazina, R.Z.; Smirnova, D.; et al. Trace Amine-Associated Receptor 2 Is Expressed in the Limbic Brain Areas and Is Involved in Dopamine Regulation and Adult Neurogenesis. Front. Behav. Neurosci. 2022, 16, 847410. [Google Scholar] [CrossRef]
- Zhukov, I.S.; Vaganova, A.N.; Murtazina, R.Z.; Alferova, L.S.; Ermolenko, E.I.; Gainetdinov, R.R. Gut Microbiota Alterations in Trace Amine-Associated Receptor 9 (TAAR9) Knockout Rats. Biomolecules 2022, 12, 1823. [Google Scholar] [CrossRef]
- Lindemann, L.; Meyer, C.A.; Jeanneau, K.; Bradaia, A.; Ozmen, L.; Bluethmann, H.; Bettler, B.; Wettstein, J.G.; Borroni, E.; Moreau, J.-L.; et al. Trace Amine-Associated Receptor 1 Modulates Dopaminergic Activity. J. Pharmacol. Exp. Ther. 2008, 324, 948–956. [Google Scholar] [CrossRef]
- Espinoza, S.; Lignani, G.; Caffino, L.; Maggi, S.; Sukhanov, I.; Leo, D.; Mus, L.; Emanuele, M.; Ronzitti, G.; Harmeier, A.; et al. TAAR1 Modulates Cortical Glutamate NMDA Receptor Function. Neuropsychopharmacology 2015, 40, 2217–2227. [Google Scholar] [CrossRef]
- Espinoza, S.; Ghisi, V.; Emanuele, M.; Leo, D.; Sukhanov, I.; Sotnikova, T.D.; Chieregatti, E.; Gainetdinov, R.R. Postsynaptic D2 Dopamine Receptor Supersensitivity in the Striatum of Mice Lacking TAAR1. Neuropharmacology 2015, 93, 308–313. [Google Scholar] [CrossRef] [PubMed]
- Leo, D.; Mus, L.; Espinoza, S.; Hoener, M.C.; Sotnikova, T.D.; Gainetdinov, R.R. Taar1-Mediated Modulation of Presynaptic Dopaminergic Neurotransmission: Role of D2 Dopamine Autoreceptors. Neuropharmacology 2014, 81, 283–291. [Google Scholar] [CrossRef]
- Espinoza, S.; Salahpour, A.; Masri, B.; Sotnikova, T.D.; Messa, M.; Barak, L.S.; Caron, M.G.; Gainetdinov, R.R. Functional Interaction between Trace Amine-Associated Receptor 1 and Dopamine D2 Receptor. Mol. Pharmacol. 2011, 80, 416–425. [Google Scholar] [CrossRef] [PubMed]
- Revel, F.G.; Moreau, J.-L.; Gainetdinov, R.R.; Bradaia, A.; Sotnikova, T.D.; Mory, R.; Durkin, S.; Zbinden, K.G.; Norcross, R.; Meyer, C.A.; et al. TAAR1 Activation Modulates Monoaminergic Neurotransmission, Preventing Hyperdopaminergic and Hypoglutamatergic Activity. Proc. Natl. Acad. Sci. USA 2011, 108, 8485–8490. [Google Scholar] [CrossRef] [PubMed]
- Halff, E.F.; Rutigliano, G.; Garcia-Hidalgo, A.; Howes, O.D. Trace Amine-Associated Receptor 1 (TAAR1) Agonism as a New Treatment Strategy for Schizophrenia and Related Disorders. Trends Neurosci. 2023, 46, 60–74. [Google Scholar] [CrossRef]
- Koblan, K.S.; Kent, J.; Hopkins, S.C.; Krystal, J.H.; Cheng, H.; Goldman, R.; Loebel, A. A Non–D2-Receptor-Binding Drug for the Treatment of Schizophrenia. N. Engl. J. Med. 2020, 382, 1497–1506. [Google Scholar] [CrossRef]
- Efimova, E.V.; Kozlova, A.A.; Razenkova, V.; Katolikova, N.V.; Antonova, K.A.; Sotnikova, T.D.; Merkulyeva, N.S.; Veshchitskii, A.S.; Kalinina, D.S.; Korzhevskii, D.E.; et al. Increased Dopamine Transmission and Adult Neurogenesis in Trace Amine-Associated Receptor 5 (TAAR5) Knockout Mice. Neuropharmacology 2021, 182, 108373. [Google Scholar] [CrossRef]
- Kalinina, D.S.; Ptukha, M.A.; Goriainova, A.V.; Merkulyeva, N.S.; Kozlova, A.A.; Murtazina, R.Z.; Shemiakova, T.S.; Kuvarzin, S.R.; Vaganova, A.N.; Volnova, A.B.; et al. Role of the Trace Amine Associated Receptor 5 (TAAR5) in the Sensorimotor Functions. Sci. Rep. 2021, 11, 23092. [Google Scholar] [CrossRef]
- Maggi, S.; Bon, C.; Gustincich, S.; Tucci, V.; Gainetdinov, R.R.; Espinoza, S. Improved Cognitive Performance in Trace Amine-Associated Receptor 5 (TAAR5) Knock-out Mice. Sci. Rep. 2022, 12, 14708. [Google Scholar] [CrossRef]
- Hochman, S. Metabolic Recruitment of Spinal Locomotion: Intracellular Neuromodulation by Trace Amines and Their Receptors. Neural Regen. Res. 2015, 10, 1940. [Google Scholar] [CrossRef] [PubMed]
- Dedic, N.; Jones, P.G.; Hopkins, S.C.; Lew, R.; Shao, L.; Campbell, J.E.; Spear, K.L.; Large, T.H.; Campbell, U.C.; Hanania, T.; et al. SEP-363856, a Novel Psychotropic Agent with a Unique, Non-D2 Receptor Mechanism of Action. J. Pharmacol. Exp. Ther. 2019, 371, 1–14. [Google Scholar] [CrossRef] [PubMed]
- Yang, S.M.; Ghoshal, A.; Hubbard, J.M.; Gackière, F.; Teyssié, R.; Neale, S.A.; Hopkins, S.C.; Koblan, K.S.; Bristow, L.J.; Dedic, N. TAAR1 Agonist Ulotaront Modulates Striatal and Hippocampal Glutamate Function in a State-Dependent Manner. Neuropsychopharmacology 2024, 49, 1091–1103. [Google Scholar] [CrossRef] [PubMed]
- Tsukada, H.; Chen, Y.-L.; Xiao, G.; Lennek, L.; Milanovic, S.M.; Worden, M.; Polhamus, D.G.; Chiu, Y.-Y.; Hopkins, S.C.; Galluppi, G.R. A Phase I, Open-Label, Fixed Sequence Study to Investigate the Effect of Cytochrome P450 2D6 Inhibition on the Pharmacokinetics of Ulotaront in Healthy Subjects. Clin. Pharmacokinet. 2023, 62, 1755–1763. [Google Scholar] [CrossRef] [PubMed]
- Kuvarzin, S.R.; Sukhanov, I.; Onokhin, K.; Zakharov, K.; Gainetdinov, R.R. Unlocking the Therapeutic Potential of Ulotaront as a Trace Amine-Associated Receptor 1 Agonist for Neuropsychiatric Disorders. Biomedicines 2023, 11, 1977. [Google Scholar] [CrossRef]
- Ågren, R.; Betari, N.; Saarinen, M.; Zeberg, H.; Svenningsson, P.; Sahlholm, K. In Vitro Comparison of Ulotaront (SEP-363856) and Ralmitaront (RO6889450): Two TAAR1 Agonist Candidate Antipsychotics. Int. J. Neuropsychopharmacol. 2023, 26, 599–606. [Google Scholar] [CrossRef] [PubMed]
- Chiellini, G.; Nesi, G.; Digiacomo, M.; Malvasi, R.; Espinoza, S.; Sabatini, M.; Frascarelli, S.; Laurino, A.; Cichero, E.; Macchia, M.; et al. Design, Synthesis, and Evaluation of Thyronamine Analogues as Novel Potent Mouse Trace Amine Associated Receptor 1 (m TAAR1) Agonists. J. Med. Chem. 2015, 58, 5096–5107. [Google Scholar] [CrossRef] [PubMed]
- Chiellini, G.; Nesi, G.; Sestito, S.; Chiarugi, S.; Runfola, M.; Espinoza, S.; Sabatini, M.; Bellusci, L.; Laurino, A.; Cichero, E.; et al. Hit-to-Lead Optimization of Mouse Trace Amine Associated Receptor 1 (MTAAR1) Agonists with a Diphenylmethane-Scaffold: Design, Synthesis, and Biological Study. J. Med. Chem. 2016, 59, 9825–9836. [Google Scholar] [CrossRef] [PubMed]
- Moro, S.; Deflorian, F.; Bacilieri, M.; Spalluto, G. Ligand-Based Homology Modeling as Attractive Tool to Inspect GPCR Structural Plasticity. Curr. Pharm. Des. 2006, 12, 2175–2185. [Google Scholar] [CrossRef]
- Rosenbaum, D.M.; Zhang, C.; Lyons, J.A.; Holl, R.; Aragao, D.; Arlow, D.H.; Rasmussen, S.G.F.; Choi, H.-J.; DeVree, B.T.; Sunahara, R.K.; et al. Structure and Function of an Irreversible Agonist-Β2 Adrenoceptor Complex. Nature 2011, 469, 236–240. [Google Scholar] [CrossRef]
- MOE: Chemical Computing Group Inc. Montreal. H3A2R7 Canada. Available online: https://www.chemcomp.com/en/index.htm (accessed on 23 November 2023).
- Sybyl X 1.0, Tripos Inc.: St Louis, MO, USA, 2009.
- Cichero, E.; Espinoza, S.; Franchini, S.; Guariento, S.; Brasili, L.; Gainetdinov, R.R.; Fossa, P. Further Insights Into the Pharmacology of the Human Trace Amine-Associated Receptors: Discovery of Novel Ligands for TAAR1 by a Virtual Screening Approach. Chem. Biol. Drug Des. 2014, 84, 712–720. [Google Scholar] [CrossRef] [PubMed]
- Brasili, L.; Sorbi, C.; Franchini, S.; Manicardi, M.; Angeli, P.; Marucci, G.; Leonardi, A.; Poggesi, E. 1,3-Dioxolane-Based Ligands as a Novel Class of A1-Adrenoceptor Antagonists. J. Med. Chem. 2003, 46, 1504–1511. [Google Scholar] [CrossRef] [PubMed]
- Sorbi, C.; Franchini, S.; Tait, A.; Prandi, A.; Gallesi, R.; Angeli, P.; Marucci, G.; Pirona, L.; Poggesi, E.; Brasili, L. 1,3-Dioxolane-Based Ligands as Rigid Analogues of Naftopidil: Structure–Affinity/Activity Relationships at α 1 and 5-HT 1A Receptors. ChemMedChem 2009, 4, 393–399. [Google Scholar] [CrossRef] [PubMed]
- Franchini, S.; Tait, A.; Prandi, A.; Sorbi, C.; Gallesi, R.; Buccioni, M.; Marucci, G.; De Stefani, C.; Cilia, A.; Brasili, L. (2,2-Diphenyl-[1,3]Oxathiolan-5-ylmethyl)-(3-phenyl-propyl)-amine: A Potent and Selective 5-HT 1A Receptor Agonist. ChemMedChem 2009, 4, 196–203. [Google Scholar] [CrossRef]
- Franchini, S.; Prandi, A.; Baraldi, A.; Sorbi, C.; Tait, A.; Buccioni, M.; Marucci, G.; Cilia, A.; Pirona, L.; Fossa, P. 1,3-Dioxolane-Based Ligands Incorporating a Lactam or Imide Moiety: Structure–Affinity/Activity Relationship at A1-Adrenoceptor Subtypes and at 5-HT1A Receptors. Eur. J. Med. Chem. 2010, 45, 3740–3751. [Google Scholar] [CrossRef]
- Franchini, S.; Prandi, A.; Sorbi, C.; Tait, A.; Baraldi, A.; Angeli, P.; Buccioni, M.; Cilia, A.; Poggesi, E.; Fossa, P.; et al. Discovery of a New Series of 5-HT1A Receptor Agonists. Bioorg Med. Chem. Lett. 2010, 20, 2017–2020. [Google Scholar] [CrossRef] [PubMed]
- Prandi, A.; Franchini, S.; Manasieva, L.I.; Fossa, P.; Cichero, E.; Marucci, G.; Buccioni, M.; Cilia, A.; Pirona, L.; Brasili, L. Synthesis, Biological Evaluation, and Docking Studies of Tetrahydrofuran- Cyclopentanone- and Cyclopentanol-Based Ligands Acting at Adrenergic α 1—And Serotonine 5-HT 1A Receptors. J. Med. Chem. 2012, 55, 23–36. [Google Scholar] [CrossRef] [PubMed]
- Cichero, E.; Espinoza, S.; Gainetdinov, R.R.; Brasili, L.; Fossa, P. Insights into the Structure and Pharmacology of the Human Trace Amine-Associated Receptor 1 (HTAAR1): Homology Modelling and Docking Studies. Chem. Biol. Drug Des. 2013, 81, 509–516. [Google Scholar] [CrossRef]
- Lam, V.M.; Rodríguez, D.; Zhang, T.; Koh, E.J.; Carlsson, J.; Salahpour, A. Discovery of Trace Amine-Associated Receptor 1 Ligands by Molecular Docking Screening against a Homology Model. Medchemcomm 2015, 6, 2216–2223. [Google Scholar] [CrossRef]
- Tonelli, M.; Espinoza, S.; Gainetdinov, R.R.; Cichero, E. Novel Biguanide-Based Derivatives Scouted as TAAR1 Agonists: Synthesis, Biological Evaluation, ADME Prediction and Molecular Docking Studies. Eur. J. Med. Chem. 2017, 127, 781–792. [Google Scholar] [CrossRef]
- Guariento, S.; Tonelli, M.; Espinoza, S.; Gerasimov, A.S.; Gainetdinov, R.R.; Cichero, E. Rational Design, Chemical Synthesis and Biological Evaluation of Novel Biguanides Exploring Species-Specificity Responsiveness of TAAR1 Agonists. Eur. J. Med. Chem. 2018, 146, 171–184. [Google Scholar] [CrossRef] [PubMed]
- Francesconi, V.; Cichero, E.; Kanov, E.V.; Laurini, E.; Pricl, S.; Gainetdinov, R.R.; Tonelli, M. Novel 1-Amidino-4-Phenylpiperazines as Potent Agonists at Human TAAR1 Receptor: Rational Design, Synthesis, Biological Evaluation and Molecular Docking Studies. Pharmaceuticals 2020, 13, 391. [Google Scholar] [CrossRef] [PubMed]
- Heffernan, M.L.R.; Herman, L.W.; Brown, S.; Jones, P.G.; Shao, L.; Hewitt, M.C.; Campbell, J.E.; Dedic, N.; Hopkins, S.C.; Koblan, K.S.; et al. Ulotaront: A TAAR1 Agonist for the Treatment of Schizophrenia. ACS Med. Chem. Lett. 2022, 13, 92–98. [Google Scholar] [CrossRef] [PubMed]
- Krasavin, M.; Peshkov, A.A.; Lukin, A.; Komarova, K.; Vinogradova, L.; Smirnova, D.; Kanov, E.V.; Kuvarzin, S.R.; Murtazina, R.Z.; Efimova, E.V.; et al. Discovery and In Vivo Efficacy of Trace Amine-Associated Receptor 1 (TAAR1) Agonist 4-(2-Aminoethyl)-N-(3,5-Dimethylphenyl)Piperidine-1-Carboxamide Hydrochloride (AP163) for the Treatment of Psychotic Disorders. Int. J. Mol. Sci. 2022, 23, 11579. [Google Scholar] [CrossRef]
- Krasavin, M.; Lukin, A.; Sukhanov, I.; Gerasimov, A.S.; Kuvarzin, S.; Efimova, E.V.; Dorofeikova, M.; Nichugovskaya, A.; Matveev, A.; Onokhin, K.; et al. Discovery of Trace Amine-Associated Receptor 1 (TAAR1) Agonist 2-(5-(4′-Chloro-[1,1′-Biphenyl]-4-Yl)-4H-1,2,4-Triazol-3-Yl)Ethan-1-Amine (LK00764) for the Treatment of Psychotic Disorders. Biomolecules 2022, 12, 1650. [Google Scholar] [CrossRef] [PubMed]
- Wang, Y.; Liu, Z.; Lu, J.; Wang, W.; Wang, L.; Yang, Y.; Wang, H.; Ye, L.; Zhang, J.; Tian, J. Biological Evaluation and in Silico Studies of Novel Compounds as Potent TAAR1 Agonists That Could Be Used in Schizophrenia Treatment. Front. Pharmacol. 2023, 14, 1161964. [Google Scholar] [CrossRef] [PubMed]
- Cichero, E.; Francesconi, V.; Casini, B.; Casale, M.; Kanov, E.; Gerasimov, A.S.; Sukhanov, I.; Savchenko, A.; Espinoza, S.; Gainetdinov, R.R.; et al. Discovery of Guanfacine as a Novel TAAR1 Agonist: A Combination Strategy through Molecular Modeling Studies and Biological Assays. Pharmaceuticals 2023, 16, 1632. [Google Scholar] [CrossRef]
- Grossi, G.; Scarano, N.; Musumeci, F.; Tonelli, M.; Kanov, E.; Carbone, A.; Fossa, P.; Gainetdinov, R.R.; Cichero, E.; Schenone, S. Discovery of a Novel Chemo-Type for TAAR1 Agonism via Molecular Modeling. Molecules 2024, 29, 1739. [Google Scholar] [CrossRef] [PubMed]
- Mysinger, M.M.; Shoichet, B.K. Rapid Context-Dependent Ligand Desolvation in Molecular Docking. J. Chem. Inf. Model. 2010, 50, 1561–1573. [Google Scholar] [CrossRef]
- Cherezov, V.; Rosenbaum, D.M.; Hanson, M.A.; Rasmussen, S.G.F.; Thian, F.S.; Kobilka, T.S.; Choi, H.-J.; Kuhn, P.; Weis, W.I.; Kobilka, B.K.; et al. High-Resolution Crystal Structure of an Engineered Human Β2 -Adrenergic G Protein–Coupled Receptor. Science 2007, 318, 1258–1265. [Google Scholar] [CrossRef]
- Galley, G.; Stalder, H.; Goergler, A.; Hoener, M.C.; Norcross, R.D. Optimisation of Imidazole Compounds as Selective TAAR1 Agonists: Discovery of RO5073012. Bioorg Med. Chem. Lett. 2012, 22, 5244–5248. [Google Scholar] [CrossRef]
- Galley, G.; Beurier, A.; Décoret, G.; Goergler, A.; Hutter, R.; Mohr, S.; Pähler, A.; Schmid, P.; Türck, D.; Unger, R.; et al. Discovery and Characterization of 2-Aminooxazolines as Highly Potent, Selective, and Orally Active TAAR1 Agonists. ACS Med. Chem. Lett. 2016, 7, 192–197. [Google Scholar] [CrossRef]
- Kooistra, A.J.; Mordalski, S.; Pándy-Szekeres, G.; Esguerra, M.; Mamyrbekov, A.; Munk, C.; Keserű, G.M.; Gloriam, D.E. GPCRdb in 2021: Integrating GPCR Sequence, Structure and Function. Nucleic Acids Res. 2021, 49, D335–D343. [Google Scholar] [CrossRef]
- Rasmussen, S.G.F.; DeVree, B.T.; Zou, Y.; Kruse, A.C.; Chung, K.Y.; Kobilka, T.S.; Thian, F.S.; Chae, P.S.; Pardon, E.; Calinski, D.; et al. Crystal Structure of the Β2 Adrenergic Receptor–Gs Protein Complex. Nature 2011, 477, 549–555. [Google Scholar] [CrossRef] [PubMed]
- Wang, S.; Che, T.; Levit, A.; Shoichet, B.K.; Wacker, D.; Roth, B.L. Structure of the D2 Dopamine Receptor Bound to the Atypical Antipsychotic Drug Risperidone. Nature 2018, 555, 269–273. [Google Scholar] [CrossRef] [PubMed]
- Wang, C.; Jiang, Y.; Ma, J.; Wu, H.; Wacker, D.; Katritch, V.; Han, G.W.; Liu, W.; Huang, X.-P.; Vardy, E.; et al. Structural Basis for Molecular Recognition at Serotonin Receptors. Science 2013, 340, 610–614. [Google Scholar] [CrossRef] [PubMed]
- Lebon, G.; Edwards, P.C.; Leslie, A.G.W.; Tate, C.G. Molecular Determinants of CGS21680 Binding to the Human Adenosine A 2A Receptor. Mol. Pharmacol. 2015, 87, 907–915. [Google Scholar] [CrossRef]
- McGann, M. FRED Pose Prediction and Virtual Screening Accuracy. J. Chem. Inf. Model. 2011, 51, 578–596. [Google Scholar] [CrossRef]
- Case, D.A.; Aktulga, H.M.; Belfon, K.; Ben-Shalom, I.Y.; Brozell, S.R.; Cerutti, D.S.; Cheatham, T.E., III; Cruzeiro, V.W.D.; Darden, T.A.; Duke, R.E.; et al. Amber20; University of California: San Francisco, CA, USA, 2020. [Google Scholar]
- Jumper, J.; Evans, R.; Pritzel, A.; Green, T.; Figurnov, M.; Ronneberger, O.; Tunyasuvunakool, K.; Bates, R.; Žídek, A.; Potapenko, A.; et al. Highly Accurate Protein Structure Prediction with AlphaFold. Nature 2021, 596, 583–589. [Google Scholar] [CrossRef]
- Varadi, M.; Bertoni, D.; Magana, P.; Paramval, U.; Pidruchna, I.; Radhakrishnan, M.; Tsenkov, M.; Nair, S.; Mirdita, M.; Yeo, J.; et al. AlphaFold Protein Structure Database in 2024: Providing Structure Coverage for over 214 Million Protein Sequences. Nucleic Acids Res. 2024, 52, D368–D375. [Google Scholar] [CrossRef]
- Friesner, R.A.; Banks, J.L.; Murphy, R.B.; Halgren, T.A.; Klicic, J.J.; Mainz, D.T.; Repasky, M.P.; Knoll, E.H.; Shelley, M.; Perry, J.K.; et al. Glide: A New Approach for Rapid, Accurate Docking and Scoring. 1. Method and Assessment of Docking Accuracy. J. Med. Chem. 2004, 47, 1739–1749. [Google Scholar] [CrossRef] [PubMed]
- Greenwood, J.R.; Calkins, D.; Sullivan, A.P.; Shelley, J.C. Towards the Comprehensive, Rapid, and Accurate Prediction of the Favorable Tautomeric States of Drug-like Molecules in Aqueous Solution. J. Comput. Aided Mol. Des. 2010, 24, 591–604. [Google Scholar] [CrossRef] [PubMed]
- Repasky, M.P.; Shelley, M.; Friesner, R.A. Flexible Ligand Docking with Glide. Curr. Protoc. Bioinform. 2007, 18, 8–12. [Google Scholar] [CrossRef] [PubMed]
- Available online: https://www.computabio.com/discovery-studio-libdock-tutorial.html (accessed on 24 July 2024).
- Nair, P.C.; Miners, J.O.; McKinnon, R.A.; Langmead, C.J.; Gregory, K.J.; Copolov, D.; Chan, S.K.W.; Bastiampillai, T. Binding of SEP-363856 within TAAR1 and the 5HT1A Receptor: Implications for the Design of Novel Antipsychotic Drugs. Mol. Psychiatry 2022, 27, 88–94. [Google Scholar] [CrossRef] [PubMed]
- Millan, M.J.; Dekeyne, A.; Newman-Tancredi, A.; Cussac, D.; Audinot, V.; Milligan, G.; Duqueyroix, D.; Girardon, S.; Mullot, J.; Boutin, J.A.; et al. S18616, a Highly Potent, Spiroimidazoline Agonist at Alpha(2)-Adrenoceptors: I. Receptor Profile, Antinociceptive and Hypothermic Actions in Comparison with Dexmedetomidine and Clonidine. J. Pharmacol. Exp. Ther. 2000, 295, 1192–1205. [Google Scholar] [PubMed]
- Available online: https://doi.org/10.2210/Pdb6KUY/Pdb (accessed on 24 July 2024).
- Varadi, M.; Anyango, S.; Deshpande, M.; Nair, S.; Natassia, C.; Yordanova, G.; Yuan, D.; Stroe, O.; Wood, G.; Laydon, A.; et al. AlphaFold Protein Structure Database: Massively Expanding the Structural Coverage of Protein-Sequence Space with High-Accuracy Models. Nucleic Acids Res. 2022, 50, D439–D444. [Google Scholar] [CrossRef] [PubMed]
- Forina, M.; Lanteri, S.; Armanino, C.; Casolino, M.C.; Casale, M.; Oliveri, P. V-PARVUS 2010. An Extendable Package of Programs for Explorative Data Analysis, Classification and Regression Analysis. 2010 Dept. Chimica e Tecnologie Farmaceutiche, University of Genova. Available online: https://doi.org/10.1016/0165-9936(84)87050-8 (accessed on 14 January 2023).
- Baroni, M.; Cruciani, G.; Sciabola, S.; Perruccio, F.; Mason, J.S. A Common Reference Framework for Analyzing/Comparing Proteins and Ligands. Fingerprints for Ligands And Proteins (FLAP): Theory and Application. J. Chem. Inf. Model. 2007, 47, 279–294. [Google Scholar] [CrossRef] [PubMed]
- Cross, S.; Baroni, M.; Goracci, L.; Cruciani, G. GRID-Based Three-Dimensional Pharmacophores I: FLAPpharm, a Novel Approach for Pharmacophore Elucidation. J. Chem. Inf. Model. 2012, 52, 2587–2598. [Google Scholar] [CrossRef] [PubMed]
- Pándy-Szekeres, G.; Caroli, J.; Mamyrbekov, A.; Kermani, A.A.; Keserű, G.M.; Kooistra, A.J.; Gloriam, D.E. GPCRdb in 2023: State-Specific Structure Models Using AlphaFold2 and New Ligand Resources. Nucleic Acids Res. 2023, 51, D395–D402. [Google Scholar] [CrossRef]
- Rasmussen, S.G.F.; Choi, H.-J.; Fung, J.J.; Pardon, E.; Casarosa, P.; Chae, P.S.; DeVree, B.T.; Rosenbaum, D.M.; Thian, F.S.; Kobilka, T.S.; et al. Structure of a Nanobody-Stabilized Active State of the Β2 Adrenoceptor. Nature 2011, 469, 175–180. [Google Scholar] [CrossRef]
- Laeremans, T.; Sands, Z.A.; Claes, P.; De Blieck, A.; De Cesco, S.; Triest, S.; Busch, A.; Felix, D.; Kumar, A.; Jaakola, V.-P.; et al. Accelerating GPCR Drug Discovery With Conformation-Stabilizing VHHs. Front. Mol. Biosci. 2022, 9, 863099. [Google Scholar] [CrossRef] [PubMed]
- Costanzi, S.; Vilar, S. In Silico Screening for Agonists and Blockers of the Β2 Adrenergic Receptor: Implications of Inactive and Activated State Structures. J. Comput. Chem. 2012, 33, 561–572. [Google Scholar] [CrossRef] [PubMed]
- Scharf, M.M.; Bünemann, M.; Baker, J.G.; Kolb, P. Comparative Docking to Distinct G Protein–Coupled Receptor Conformations Exclusively Yields Ligands with Agonist Efficacy. Mol. Pharmacol. 2019, 96, 851–861. [Google Scholar] [CrossRef] [PubMed]
- Altschul, S.F.; Gish, W.; Miller, W.; Myers, E.W.; Lipman, D.J. Basic Local Alignment Search Tool. J. Mol. Biol. 1990, 215, 403–410. [Google Scholar] [CrossRef] [PubMed]
- Altschul, S.F. A Protein Alignment Scoring System Sensitive at All Evolutionary Distances. J. Mol. Evol. 1993, 36, 290–300. [Google Scholar] [CrossRef] [PubMed]
- Park, Y.; Sheetlin, S.; Ma, N.; Madden, T.L.; Spouge, J.L. New Finite-Size Correction for Local Alignment Score Distributions. BMC Res. Notes 2012, 5, 286. [Google Scholar] [CrossRef] [PubMed]
- Bateman, A.; Martin, M.-J.; Orchard, S.; Magrane, M.; Ahmad, S.; Alpi, E.; Bowler-Barnett, E.H.; Britto, R.; Bye-A-Jee, H.; Cukura, A.; et al. UniProt: The Universal Protein Knowledgebase in 2023. Nucleic Acids Res. 2023, 51, D523–D531. [Google Scholar] [CrossRef]
- Eddy, S.R. Where Did the BLOSUM62 Alignment Score Matrix Come From? Nat. Biotechnol. 2004, 22, 1035–1036. [Google Scholar] [CrossRef]
- Yu, Y.-K.; Wootton, J.C.; Altschul, S.F. The Compositional Adjustment of Amino Acid Substitution Matrices. Proc. Natl. Acad. Sci. USA 2003, 100, 15688–15693. [Google Scholar] [CrossRef] [PubMed]
- Cichero, E.; Espinoza, S.; Tonelli, M.; Franchini, S.; Gerasimov, A.S.; Sorbi, C.; Gainetdinov, R.R.; Brasili, L.; Fossa, P. A Homology Modelling-Driven Study Leading to the Discovery of the First Mouse Trace Amine-Associated Receptor 5 (TAAR5) Antagonists. Medchemcomm 2016, 7, 353–364. [Google Scholar] [CrossRef]
- Liu, H.; Zheng, Y.; Wang, Y.; Wang, Y.; He, X.; Xu, P.; Huang, S.; Yuan, Q.; Zhang, X.; Wang, L.; et al. Recognition of Methamphetamine and Other Amines by Trace Amine Receptor TAAR1. Nature 2023, 624, 663–671. [Google Scholar] [CrossRef] [PubMed]
- Yang, D.; Zhou, Q.; Labroska, V.; Qin, S.; Darbalaei, S.; Wu, Y.; Yuliantie, E.; Xie, L.; Tao, H.; Cheng, J.; et al. G Protein-Coupled Receptors: Structure- and Function-Based Drug Discovery. Signal Transduct. Target. Ther. 2021, 6, 7. [Google Scholar] [CrossRef] [PubMed]
- Hauser, A.S.; Kooistra, A.J.; Munk, C.; Heydenreich, F.M.; Veprintsev, D.B.; Bouvier, M.; Babu, M.M.; Gloriam, D.E. GPCR Activation Mechanisms across Classes and Macro/Microscales. Nat. Struct. Mol. Biol. 2021, 28, 879–888. [Google Scholar] [CrossRef] [PubMed]
- Xu, Z.; Guo, L.; Yu, J.; Shen, S.; Wu, C.; Zhang, W.; Zhao, C.; Deng, Y.; Tian, X.; Feng, Y.; et al. Ligand Recognition and G-Protein Coupling of Trace Amine Receptor TAAR1. Nature 2023, 624, 672–681. [Google Scholar] [CrossRef] [PubMed]
- Shang, P.; Rong, N.; Jiang, J.-J.; Cheng, J.; Zhang, M.-H.; Kang, D.; Qi, L.; Guo, L.; Yang, G.-M.; Liu, Q.; et al. Structural and Signaling Mechanisms of TAAR1 Enabled Preferential Agonist Design. Cell 2023, 186, 5347–5362. [Google Scholar] [CrossRef]
- Zilberg, G.; Parpounas, A.K.; Warren, A.L.; Yang, S.; Wacker, D. Molecular Basis of Human Trace Amine-Associated Receptor 1 Activation. Nat. Commun. 2024, 15, 108. [Google Scholar] [CrossRef] [PubMed]
- Wainscott, D.B.; Little, S.P.; Yin, T.; Tu, Y.; Rocco, V.P.; He, J.X.; Nelson, D.L. Pharmacologic Characterization of the Cloned Human Trace Amine-Associated Receptor1 (TAAR1) and Evidence for Species Differences with the Rat TAAR1. J. Pharmacol. Exp. Ther. 2007, 320, 475–485. [Google Scholar] [CrossRef]
- Cichero, E.; Tonelli, M. Targeting Species-Specific Trace Amine-Associated Receptor 1 Ligands: To Date Perspective of the Rational Drug Design Process. Future Med. Chem. 2017, 9, 1507–1527. [Google Scholar] [CrossRef]
- Tan, E.S.; Naylor, J.C.; Groban, E.S.; Bunzow, J.R.; Jacobson, M.P.; Grandy, D.K.; Scanlan, T.S. The Molecular Basis of Species-Specific Ligand Activation of Trace Amine-Associated Receptor 1 (TAAR 1). ACS Chem. Biol. 2009, 4, 209–220. [Google Scholar] [CrossRef]
- Simmler, L.D.; Buchy, D.; Chaboz, S.; Hoener, M.C.; Liechti, M.E. In Vitro Characterization of Psychoactive Substances at Rat, Mouse, and Human Trace Amine-Associated Receptor 1. J. Pharmacol. Exp. Ther. 2016, 357, 134–144. [Google Scholar] [CrossRef] [PubMed]
- Liao, S.; Pino, M.J.; Deleon, C.; Lindner-Jackson, M.; Wu, C. Interaction Analyses of HTAAR1 and MTAAR1 with Antagonist EPPTB. Life Sci. 2022, 300, 120553. [Google Scholar] [CrossRef] [PubMed]
- Stalder, H.; Hoener, M.C.; Norcross, R.D. Selective Antagonists of Mouse Trace Amine-Associated Receptor 1 (MTAAR1): Discovery of EPPTB (RO5212773). Bioorg. Med. Chem. Lett. 2011, 21, 1227–1231. [Google Scholar] [CrossRef]
- Decker, A.M.; Brackeen, M.F.; Mohammadkhani, A.; Kormos, C.M.; Hesk, D.; Borgland, S.L.; Blough, B.E. Identification of a Potent Human Trace Amine-Associated Receptor 1 Antagonist. ACS Chem. Neurosci. 2022, 13, 1082–1095. [Google Scholar] [CrossRef]
- Decker, A.M.; Mathews, K.M.; Blough, B.E.; Gilmour, B.P. Validation of a High-Throughput Calcium Mobilization Assay for the Human Trace Amine-Associated Receptor 1. SLAS Discov. 2021, 26, 140–150. [Google Scholar] [CrossRef] [PubMed]
- Zhang, M.; Chen, T.; Lu, X.; Lan, X.; Chen, Z.; Lu, S. G Protein-Coupled Receptors (GPCRs): Advances in Structures, Mechanisms, and Drug Discovery. Signal Transduct. Target. Ther. 2024, 9, 88. [Google Scholar] [CrossRef]
- Wu, Y.; Tong, J.; Ding, K.; Zhou, Q.; Zhao, S. GPCR Allosteric Modulator Discovery. Adv. Exp. Med. Biol. 2019, 1163, 225–251. [Google Scholar] [CrossRef]
- Liu, X.; Ahn, S.; Kahsai, A.W.; Meng, K.-C.; Latorraca, N.R.; Pani, B.; Venkatakrishnan, A.J.; Masoudi, A.; Weis, W.I.; Dror, R.O.; et al. Mechanism of Intracellular Allosteric Β2AR Antagonist Revealed by X-Ray Crystal Structure. Nature 2017, 548, 480–484. [Google Scholar] [CrossRef]
- Liu, X.; Masoudi, A.; Kahsai, A.W.; Huang, L.-Y.; Pani, B.; Staus, D.P.; Shim, P.J.; Hirata, K.; Simhal, R.K.; Schwalb, A.M.; et al. Mechanism of Β2 AR Regulation by an Intracellular Positive Allosteric Modulator. Science 2019, 364, 1283–1287. [Google Scholar] [CrossRef] [PubMed]
- Liu, X.; Kaindl, J.; Korczynska, M.; Stößel, A.; Dengler, D.; Stanek, M.; Hübner, H.; Clark, M.J.; Mahoney, J.; Matt, R.A.; et al. An Allosteric Modulator Binds to a Conformational Hub in the Β2 Adrenergic Receptor. Nat. Chem. Biol. 2020, 16, 749–755. [Google Scholar] [CrossRef]
- Xu, X.; Kaindl, J.; Clark, M.J.; Hübner, H.; Hirata, K.; Sunahara, R.K.; Gmeiner, P.; Kobilka, B.K.; Liu, X. Binding Pathway Determines Norepinephrine Selectivity for the Human Β1AR over Β2AR. Cell Res. 2021, 31, 569–579. [Google Scholar] [CrossRef]
- Draper-Joyce, C.J.; Bhola, R.; Wang, J.; Bhattarai, A.; Nguyen, A.T.N.; Cowie-Kent, I.; O’Sullivan, K.; Chia, L.Y.; Venugopal, H.; Valant, C.; et al. Positive Allosteric Mechanisms of Adenosine A1 Receptor-Mediated Analgesia. Nature 2021, 597, 571–576. [Google Scholar] [CrossRef] [PubMed]
- Jiao, H.; Pang, B.; Liu, A.; Chen, Q.; Pan, Q.; Wang, X.; Xu, Y.; Chiang, Y.-C.; Ren, R.; Hu, H. Structural Insights into the Activation and Inhibition of CXC Chemokine Receptor 3. Nat. Struct. Mol. Biol. 2024, 31, 610–620. [Google Scholar] [CrossRef]
- Yang, X.; Wang, X.; Xu, Z.; Wu, C.; Zhou, Y.; Wang, Y.; Lin, G.; Li, K.; Wu, M.; Xia, A.; et al. Molecular Mechanism of Allosteric Modulation for the Cannabinoid Receptor CB1. Nat. Chem. Biol. 2022, 18, 831–840. [Google Scholar] [CrossRef] [PubMed]
- Cheng, R.K.Y.; Fiez-Vandal, C.; Schlenker, O.; Edman, K.; Aggeler, B.; Brown, D.G.; Brown, G.A.; Cooke, R.M.; Dumelin, C.E.; Doré, A.S.; et al. Structural Insight into Allosteric Modulation of Protease-Activated Receptor 2. Nature 2017, 545, 112–115. [Google Scholar] [CrossRef]
- Zhang, D.; Gao, Z.-G.; Zhang, K.; Kiselev, E.; Crane, S.; Wang, J.; Paoletta, S.; Yi, C.; Ma, L.; Zhang, W.; et al. Two Disparate Ligand-Binding Sites in the Human P2Y1 Receptor. Nature 2015, 520, 317–321. [Google Scholar] [CrossRef]
- Vuckovic, Z.; Wang, J.; Pham, V.; Mobbs, J.I.; Belousoff, M.J.; Bhattarai, A.; Burger, W.A.C.; Thompson, G.; Yeasmin, M.; Nawaratne, V.; et al. Structural and Dynamic Mechanisms of Allostery at the M4 Muscarinic Acetylcholine Receptor. SSRN Electron. J. 2022. [Google Scholar] [CrossRef]
- Yang, Z.; Wang, J.-Y.; Yang, F.; Zhu, K.-K.; Wang, G.-P.; Guan, Y.; Ning, S.-L.; Lu, Y.; Li, Y.; Zhang, C.; et al. Structure of GPR101–Gs Enables Identification of Ligands with Rejuvenating Potential. Nat. Chem. Biol. 2024, 20, 484–492. [Google Scholar] [CrossRef] [PubMed]
- Lebon, G.; Warne, T.; Edwards, P.C.; Bennett, K.; Langmead, C.J.; Leslie, A.G.W.; Tate, C.G. Agonist-Bound Adenosine A2A Receptor Structures Reveal Common Features of GPCR Activation. Nature 2011, 474, 521–525. [Google Scholar] [CrossRef]
- Sun, B.; Bachhawat, P.; Chu, M.L.-H.; Wood, M.; Ceska, T.; Sands, Z.A.; Mercier, J.; Lebon, F.; Kobilka, T.S.; Kobilka, B.K. Crystal Structure of the Adenosine A2A Receptor Bound to an Antagonist Reveals a Potential Allosteric Pocket. Proc. Natl. Acad. Sci. USA 2017, 114, 2066–2071. [Google Scholar] [CrossRef]
- Reinecke, B.A.; Wang, H.; Zhang, Y. Recent Advances in the Drug Discovery and Development of Dualsteric/Bitopic Activators of G Protein-Coupled Receptors. Curr. Top. Med. Chem. 2019, 19, 2378–2392. [Google Scholar] [CrossRef]
- Egyed, A.; Kiss, D.J.; Keserű, G.M. The Impact of the Secondary Binding Pocket on the Pharmacology of Class A GPCRs. Front. Pharmacol. 2022, 13, 847788. [Google Scholar] [CrossRef] [PubMed]
- Thal, D.M.; Glukhova, A.; Sexton, P.M.; Christopoulos, A. Structural Insights into G-Protein-Coupled Receptor Allostery. Nature 2018, 559, 45–53. [Google Scholar] [CrossRef] [PubMed]
- Glyakina, A.V.; Pavlov, C.D.; Sopova, J.V.; Gainetdinov, R.R.; Leonova, E.I.; Galzitskaya, O.V. Search for Structural Basis of Interactions of Biogenic Amines with Human TAAR1 and TAAR6 Receptors. Int. J. Mol. Sci. 2021, 23, 209. [Google Scholar] [CrossRef] [PubMed]
- Franchini, S.; Battisti, U.M.; Baraldi, A.; Prandi, A.; Fossa, P.; Cichero, E.; Tait, A.; Sorbi, C.; Marucci, G.; Cilia, A.; et al. Structure–Affinity/Activity Relationships of 1,4-Dioxa-Spiro [4.5]Decane Based Ligands at A1 and 5-HT1A Receptors. Eur. J. Med. Chem. 2014, 87, 248–266. [Google Scholar] [CrossRef] [PubMed]
- Bon, C.; Chern, T.-R.; Cichero, E.; O’Brien, T.E.; Gustincich, S.; Gainetdinov, R.R.; Espinoza, S. Discovery of Novel Trace Amine-Associated Receptor 5 (TAAR5) Antagonists Using a Deep Convolutional Neural Network. Int. J. Mol. Sci. 2022, 23, 3127. [Google Scholar] [CrossRef] [PubMed]
- Nicoli, A.; Weber, V.; Bon, C.; Steuer, A.; Gustincich, S.; Gainetdinov, R.R.; Lang, R.; Espinoza, S.; Di Pizio, A. Structure-Based Discovery of Mouse Trace Amine-Associated Receptor 5 Antagonists. J. Chem. Inf. Model. 2023, 63, 6667–6680. [Google Scholar] [CrossRef] [PubMed]
- Lee, Y.; Warne, T.; Nehmé, R.; Pandey, S.; Dwivedi-Agnihotri, H.; Chaturvedi, M.; Edwards, P.C.; García-Nafría, J.; Leslie, A.G.W.; Shukla, A.K.; et al. Molecular Basis of β-Arrestin Coupling to Formoterol-Bound Β1-Adrenoceptor. Nature 2020, 583, 862–866. [Google Scholar] [CrossRef]
- Zou, Y.; Weis, W.I.; Kobilka, B.K. N-Terminal T4 Lysozyme Fusion Facilitates Crystallization of a G Protein Coupled Receptor. PLoS ONE 2012, 7, e46039. [Google Scholar] [CrossRef]
- Warne, T.; Moukhametzianov, R.; Baker, J.G.; Nehmé, R.; Edwards, P.C.; Leslie, A.G.W.; Schertler, G.F.X.; Tate, C.G. The Structural Basis for Agonist and Partial Agonist Action on a Β1-Adrenergic Receptor. Nature 2011, 469, 241–244. [Google Scholar] [CrossRef]
- Yang, Z.; Han, S.; Keller, M.; Kaiser, A.; Bender, B.J.; Bosse, M.; Burkert, K.; Kögler, L.M.; Wifling, D.; Bernhardt, G.; et al. Structural Basis of Ligand Binding Modes at the Neuropeptide Y Y1 Receptor. Nature 2018, 556, 520–524. [Google Scholar] [CrossRef]
- Šali, A.; Blundell, T.L. Comparative Protein Modelling by Satisfaction of Spatial Restraints. J. Mol. Biol. 1993, 234, 779–815. [Google Scholar] [CrossRef] [PubMed]
- Schrödinger Release 2021-3; Maestro; Schrödinger, LLC: New York, NY, USA, 2021.
- Schrödinger Release 2021−2; Phase; Schrödinger, LLC: New York, NY, USA, 2021.
- Schrödinger Release 2021−3; Glide; Schrödinger, LLC: New York, NY, USA, 2021.
- Berman, H.M.; Westbrook, J.; Feng, Z.; Gilliland, G.; Bhat, T.N.; Weissig, H.; Shindyalov, I.N.; Bourne, P.E. The Protein Data Bank. Nucleic Acids Res. 2000, 28, 235–242. [Google Scholar] [CrossRef] [PubMed]
- Hua, Y.; Dai, X.; Xu, Y.; Xing, G.; Liu, H.; Lu, T.; Chen, Y.; Zhang, Y. Drug Repositioning: Progress and Challenges in Drug Discovery for Various Diseases. Eur. J. Med. Chem. 2022, 234, 114239. [Google Scholar] [CrossRef] [PubMed]
- Lewin, A.H.; Miller, G.M.; Gilmour, B. Trace Amine-Associated Receptor 1 Is a Stereoselective Binding Site for Compounds in the Amphetamine Class. Bioorg Med. Chem. 2011, 19, 7044–7048. [Google Scholar] [CrossRef] [PubMed]
- Hu, L.A.; Zhou, T.; Ahn, J.; Wang, S.; Zhou, J.; HU, Y.; Liu, Q. Human and Mouse Trace Amine-Associated Receptor 1 Have Distinct Pharmacology towards Endogenous Monoamines and Imidazoline Receptor Ligands. Biochem. J. 2009, 424, 39–45. [Google Scholar] [CrossRef] [PubMed]
- Cao, D.; Yu, J.; Wang, H.; Luo, Z.; Liu, X.; He, L.; Qi, J.; Fan, L.; Tang, L.; Chen, Z.; et al. Structure-Based Discovery of Nonhallucinogenic Psychedelic Analogs. Science 2022, 375, 403–411. [Google Scholar] [CrossRef] [PubMed]
- Xiao, P.; Yan, W.; Gou, L.; Zhong, Y.-N.; Kong, L.; Wu, C.; Wen, X.; Yuan, Y.; Cao, S.; Qu, C.; et al. Ligand Recognition and Allosteric Regulation of DRD1-Gs Signaling Complexes. Cell 2021, 184, 943–956. [Google Scholar] [CrossRef] [PubMed]
- Deluigi, M.; Morstein, L.; Schuster, M.; Klenk, C.; Merklinger, L.; Cridge, R.R.; de Zhang, L.A.; Klipp, A.; Vacca, S.; Vaid, T.M.; et al. Crystal Structure of the A1B-Adrenergic Receptor Reveals Molecular Determinants of Selective Ligand Recognition. Nat. Commun. 2022, 13, 382. [Google Scholar] [CrossRef]
- Toyoda, Y.; Zhu, A.; Kong, F.; Shan, S.; Zhao, J.; Wang, N.; Sun, X.; Zhang, L.; Yan, C.; Kobilka, B.K.; et al. Structural Basis of A1A-Adrenergic Receptor Activation and Recognition by an Extracellular Nanobody. Nat. Commun. 2023, 14, 3655. [Google Scholar] [CrossRef]
- Robertson, M.J.; Papasergi-Scott, M.M.; He, F.; Seven, A.B.; Meyerowitz, J.G.; Panova, O.; Peroto, M.C.; Che, T.; Skiniotis, G. Structure Determination of Inactive-State GPCRs with a Universal Nanobody. Nat. Struct. Mol. Biol. 2022, 29, 1188–1195. [Google Scholar] [CrossRef]
- He, L.; Zhao, Q.; Qi, J.; Wang, Y.; Han, W.; Chen, Z.; Cong, Y.; Wang, S. Structural Insights into Constitutive Activity of 5-HT6 Receptor. Proc. Natl. Acad. Sci. USA 2023, 120, e2209917120. [Google Scholar] [CrossRef] [PubMed]
- Zhang, S.; Gumpper, R.H.; Huang, X.-P.; Liu, Y.; Krumm, B.E.; Cao, C.; Fay, J.F.; Roth, B.L. Molecular Basis for Selective Activation of DREADD-Based Chemogenetics. Nature 2022, 612, 354–362. [Google Scholar] [CrossRef] [PubMed]
- Notredame, C.; Higgins, D.G.; Heringa, J. T-Coffee: A Novel Method for Fast and Accurate Multiple Sequence Alignment. J. Mol. Biol. 2000, 302, 205–217. [Google Scholar] [CrossRef] [PubMed]
- Madeira, F.; Madhusoodanan, N.; Lee, J.; Eusebi, A.; Niewielska, A.; Tivey, A.R.N.; Lopez, R.; Butcher, S. The EMBL-EBI Job Dispatcher Sequence Analysis Tools Framework in 2024. Nucleic Acids Res. 2024, 52, W521–W525. [Google Scholar] [CrossRef] [PubMed]
- Chang, J.-M.; Di Tommaso, P.; Taly, J.-F.; Notredame, C. Accurate Multiple Sequence Alignment of Transmembrane Proteins with PSI-Coffee. BMC Bioinform. 2012, 13 (Suppl. S4), S1. [Google Scholar] [CrossRef]
- Floden, E.W.; Tommaso, P.D.; Chatzou, M.; Magis, C.; Notredame, C.; Chang, J.-M. PSI/TM-Coffee: A Web Server for Fast and Accurate Multiple Sequence Alignments of Regular and Transmembrane Proteins Using Homology Extension on Reduced Databases. Nucleic Acids Res. 2016, 44, W339–W343. [Google Scholar] [CrossRef]
- Gentili, F.; Pigini, M.; Piergentili, A.; Giannella, M. Agonists and Antagonists Targeting the Different A2-Adrenoceptor Subtypes. Curr. Top. Med. Chem. 2007, 7, 163–186. [Google Scholar] [CrossRef]
- Xing, G.; Yi, C.; Dou, P.; Zhi, Z.; Lin, B.; Cheng, M. Recent Progress in the Development of Β2 Adrenergic Receptor Agonists: A Patent Review (2015–2020). Expert. Opin. Ther. Pat. 2021, 31, 239–246. [Google Scholar] [CrossRef]
- Nirogi, R.; Jayarajan, P.; Shinde, A.; Mohammed, A.R.; Grandhi, V.R.; Benade, V.; Goyal, V.K.; Abraham, R.; Jasti, V.; Cummings, J. Progress in Investigational Agents Targeting Serotonin-6 Receptors for the Treatment of Brain Disorders. Biomolecules 2023, 13, 309. [Google Scholar] [CrossRef]
- Dove, S.; Elz, S.; Seifert, R.; Buschauer, A. Structure-Activity Relationships of Histamine H2 Receptor Ligands+. Mini-Rev. Med. Chem. 2004, 4, 941–954. [Google Scholar] [CrossRef]
- Perez, D.M. A1-Adrenergic Receptors: Insights into Potential Therapeutic Opportunities for COVID-19, Heart Failure, and Alzheimer’s Disease. Int. J. Mol. Sci. 2023, 24, 4188. [Google Scholar] [CrossRef] [PubMed]
- Rodríguez, D.; Brea, J.; Loza, M.I.; Carlsson, J. Structure-Based Discovery of Selective Serotonin 5-HT 1B Receptor Ligands. Structure 2014, 22, 1140–1151. [Google Scholar] [CrossRef] [PubMed]
- Olivier, B.; Soudijn, W.; van Wijngaarden, I. The 5-HT1A Receptor and Its Ligands: Structure and Function. In Progress in Drug Research; Birkhäuser: Basel, Switzerland, 1999; pp. 103–165. [Google Scholar]
- Beaulieu, J.; Espinoza, S.; Gainetdinov, R.R. Dopamine Receptors—IUPHAR Review 13. Br. J. Pharmacol. 2015, 172, 1–23. [Google Scholar] [CrossRef] [PubMed]
- Robert, X.; Gouet, P. Deciphering Key Features in Protein Structures with the New ENDscript Server. Nucleic Acids Res. 2014, 42, W320–W324. [Google Scholar] [CrossRef] [PubMed]


| Entry | Year | Method of Discovery | Use of the Derived Computational-Based Structural Information | Proposed Hit(s) | mTAAR1 EC50 | Ref. |
|---|---|---|---|---|---|---|
| 1 | 2015 | Rational design (synthesis) | SAR rationalization | 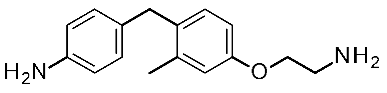 1c | 240 nM | [27] |
| 2 | 2016 | Rational design (synthesis) combined with previously reported docking analysis | Hit-to-lead optimization |  2b | 98 nM | [28] |
| Entry | Year | Method of Discovery | Use of Structural Information | HIT Compound Example | hTAAR1 EC50 (IC50) | Ref. |
|---|---|---|---|---|---|---|
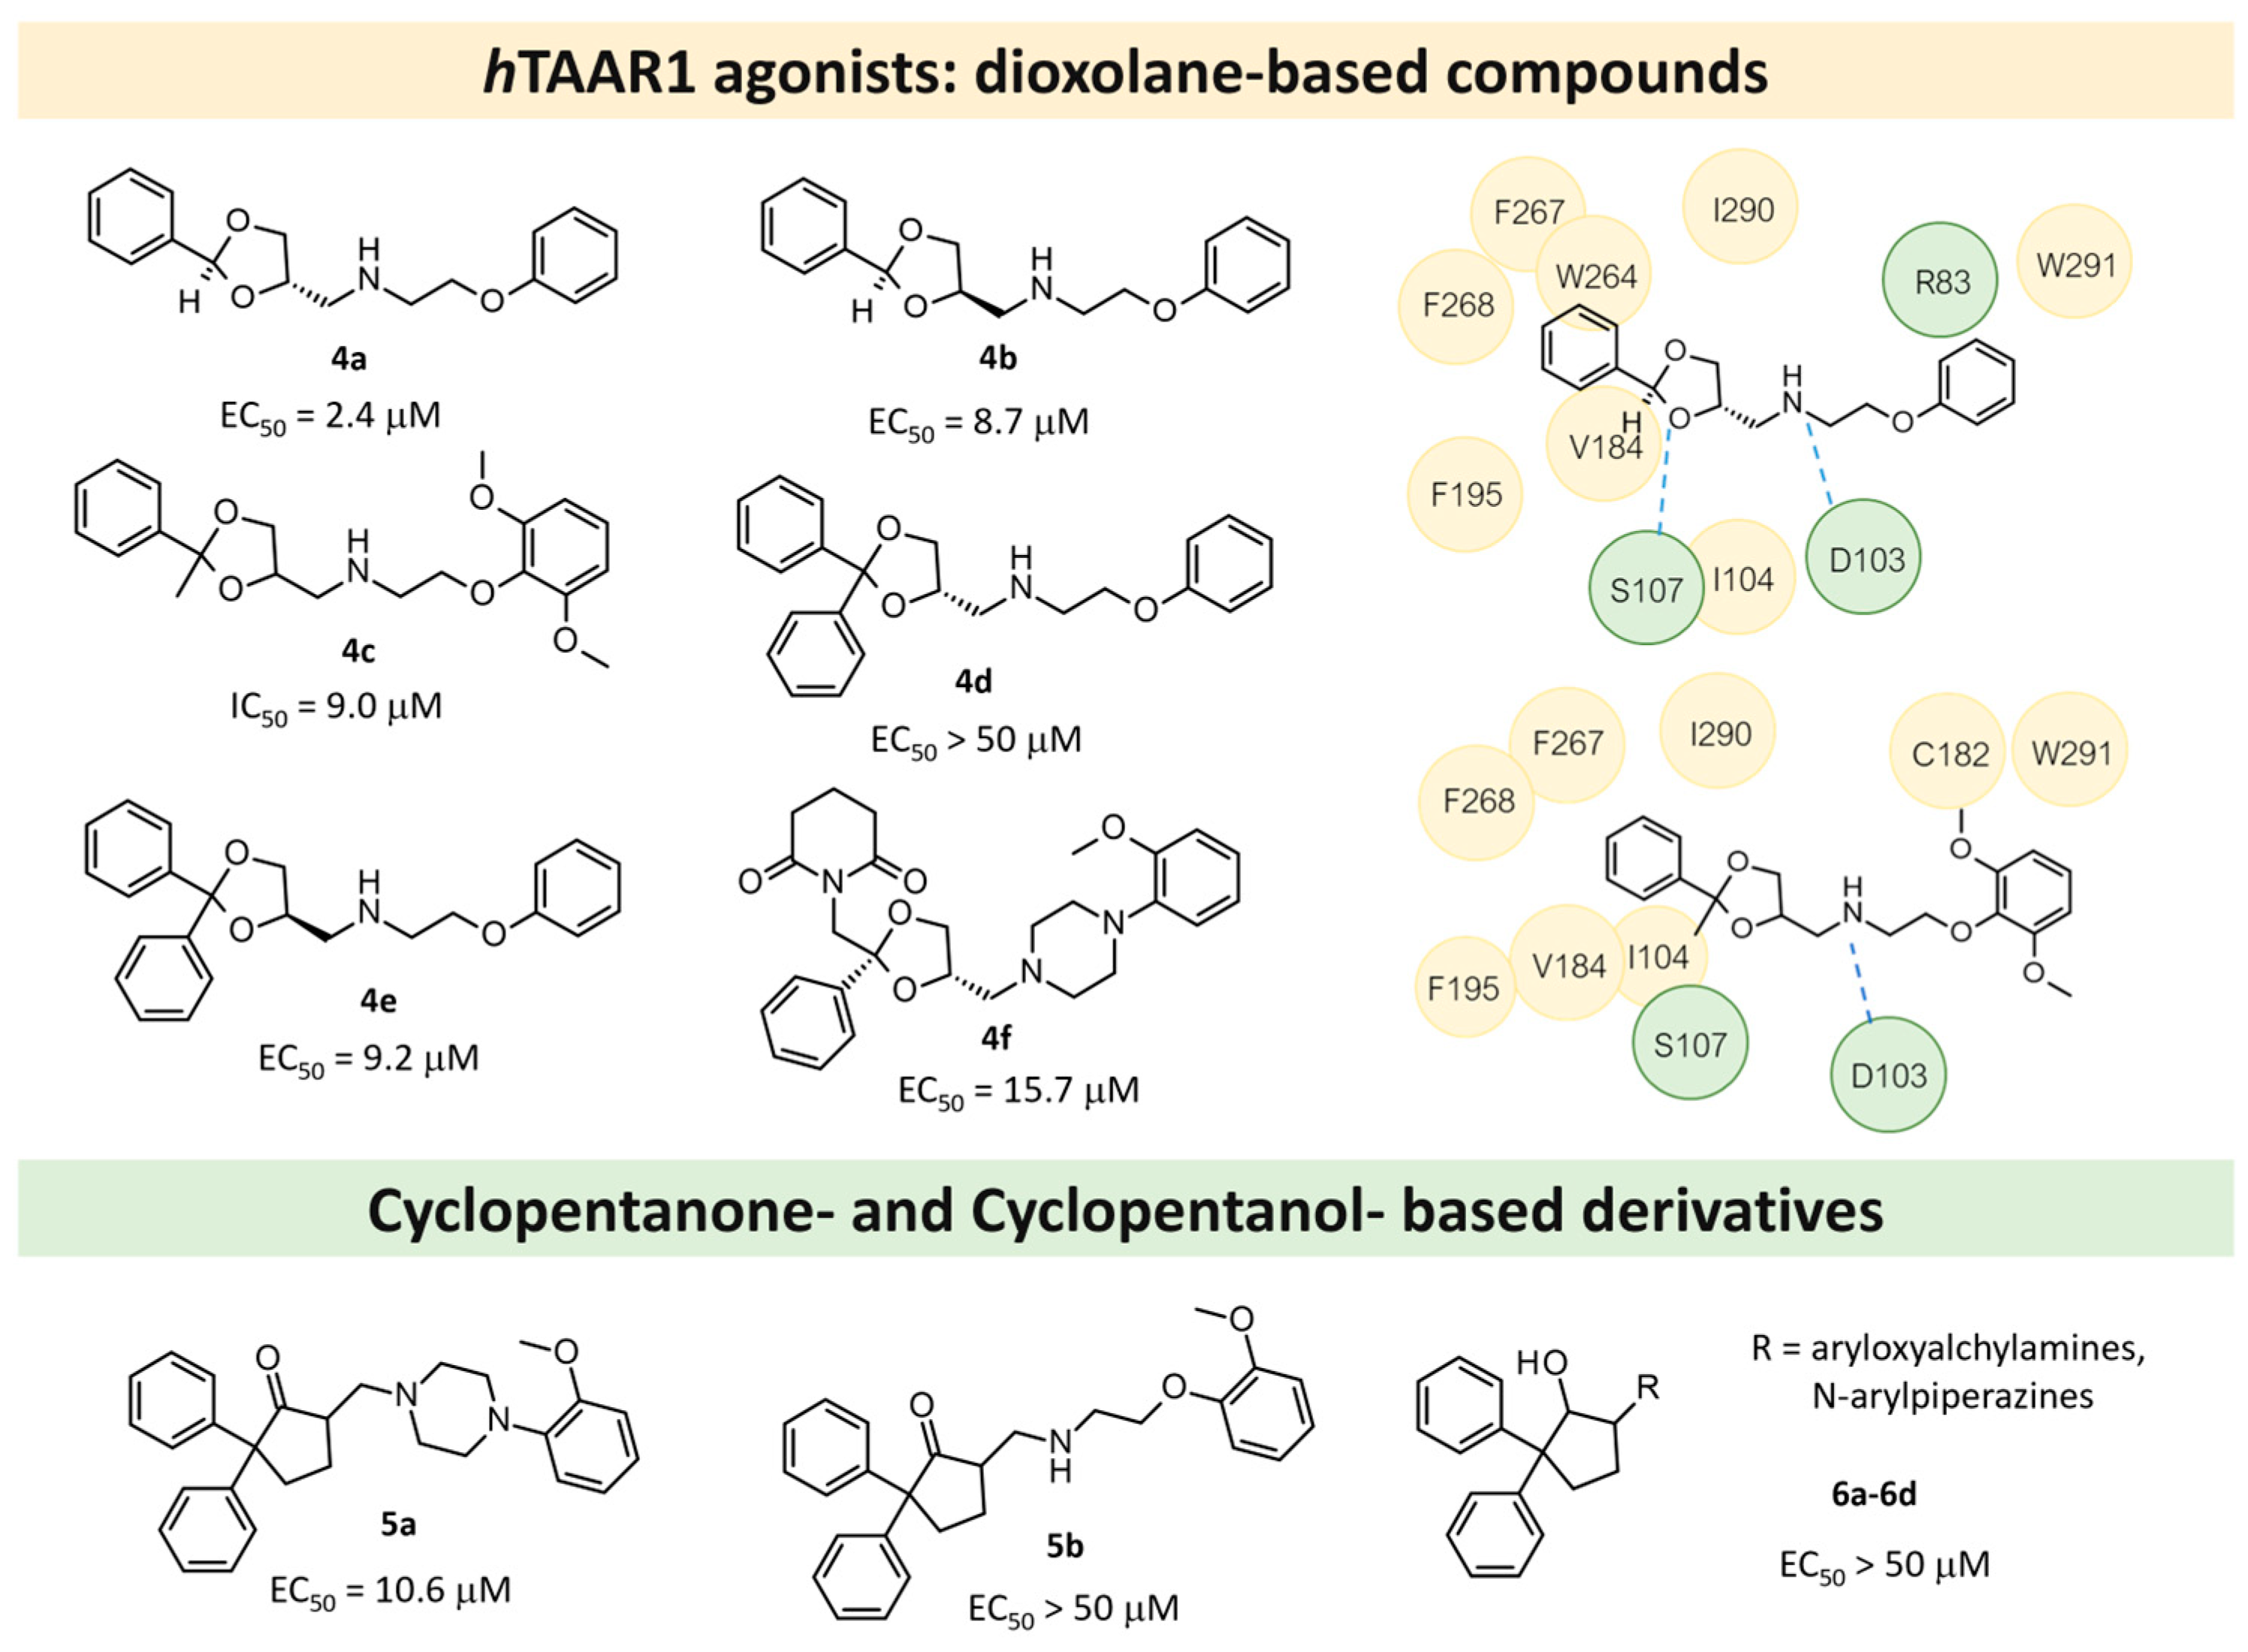
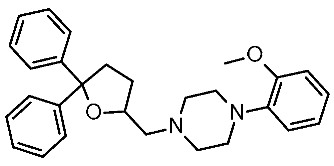
| 1 | 2014 | VS on hTAAR1 HM | Prospective drug discovery, SAR rationalization | 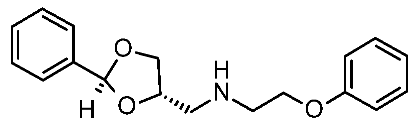 4a | 2.4 μM | [33] |
 4c | 9 μM | [33] | ||||
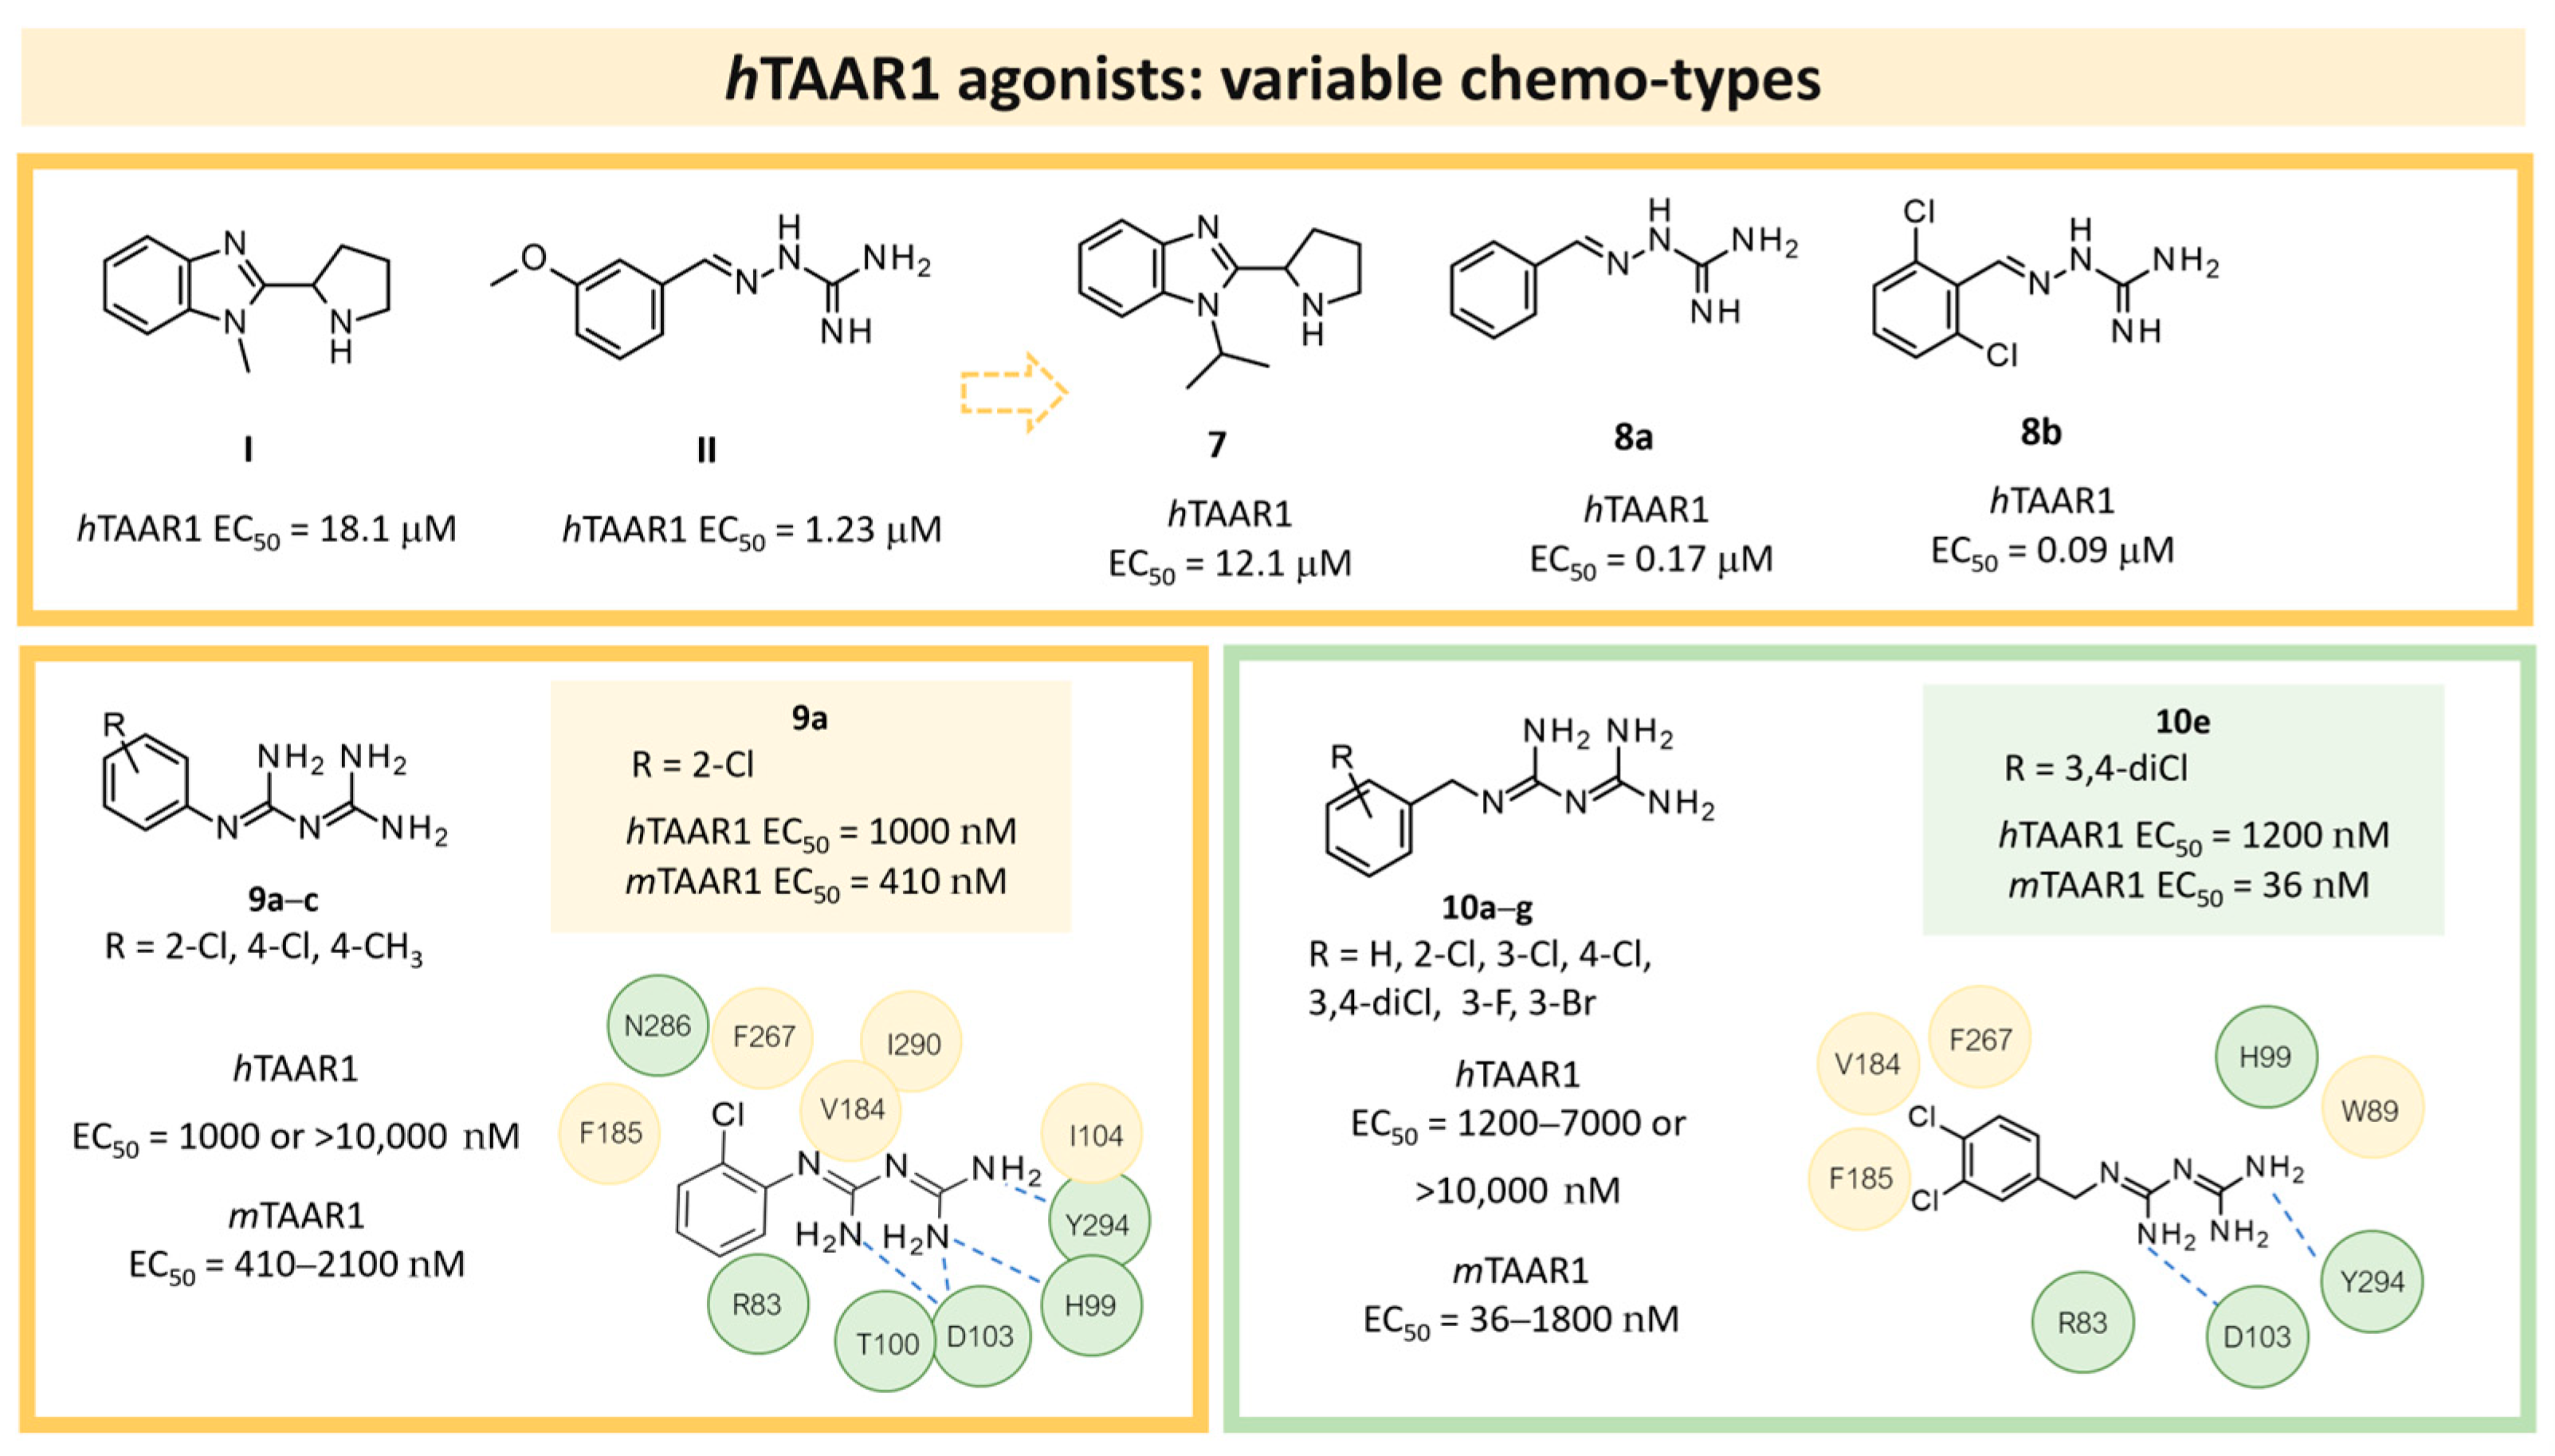
| 2 | 2015 | VS on hTAAR1 HM | Prospective drug discovery |  8b | 0.09 μM | [41] |
| 3 | 2017 | In silico aided-drug design | Prospective drug design, SAR rationalization, selectivity/specificity rationalization | 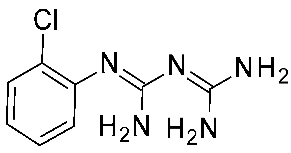 9a | 1 μM | [42] |
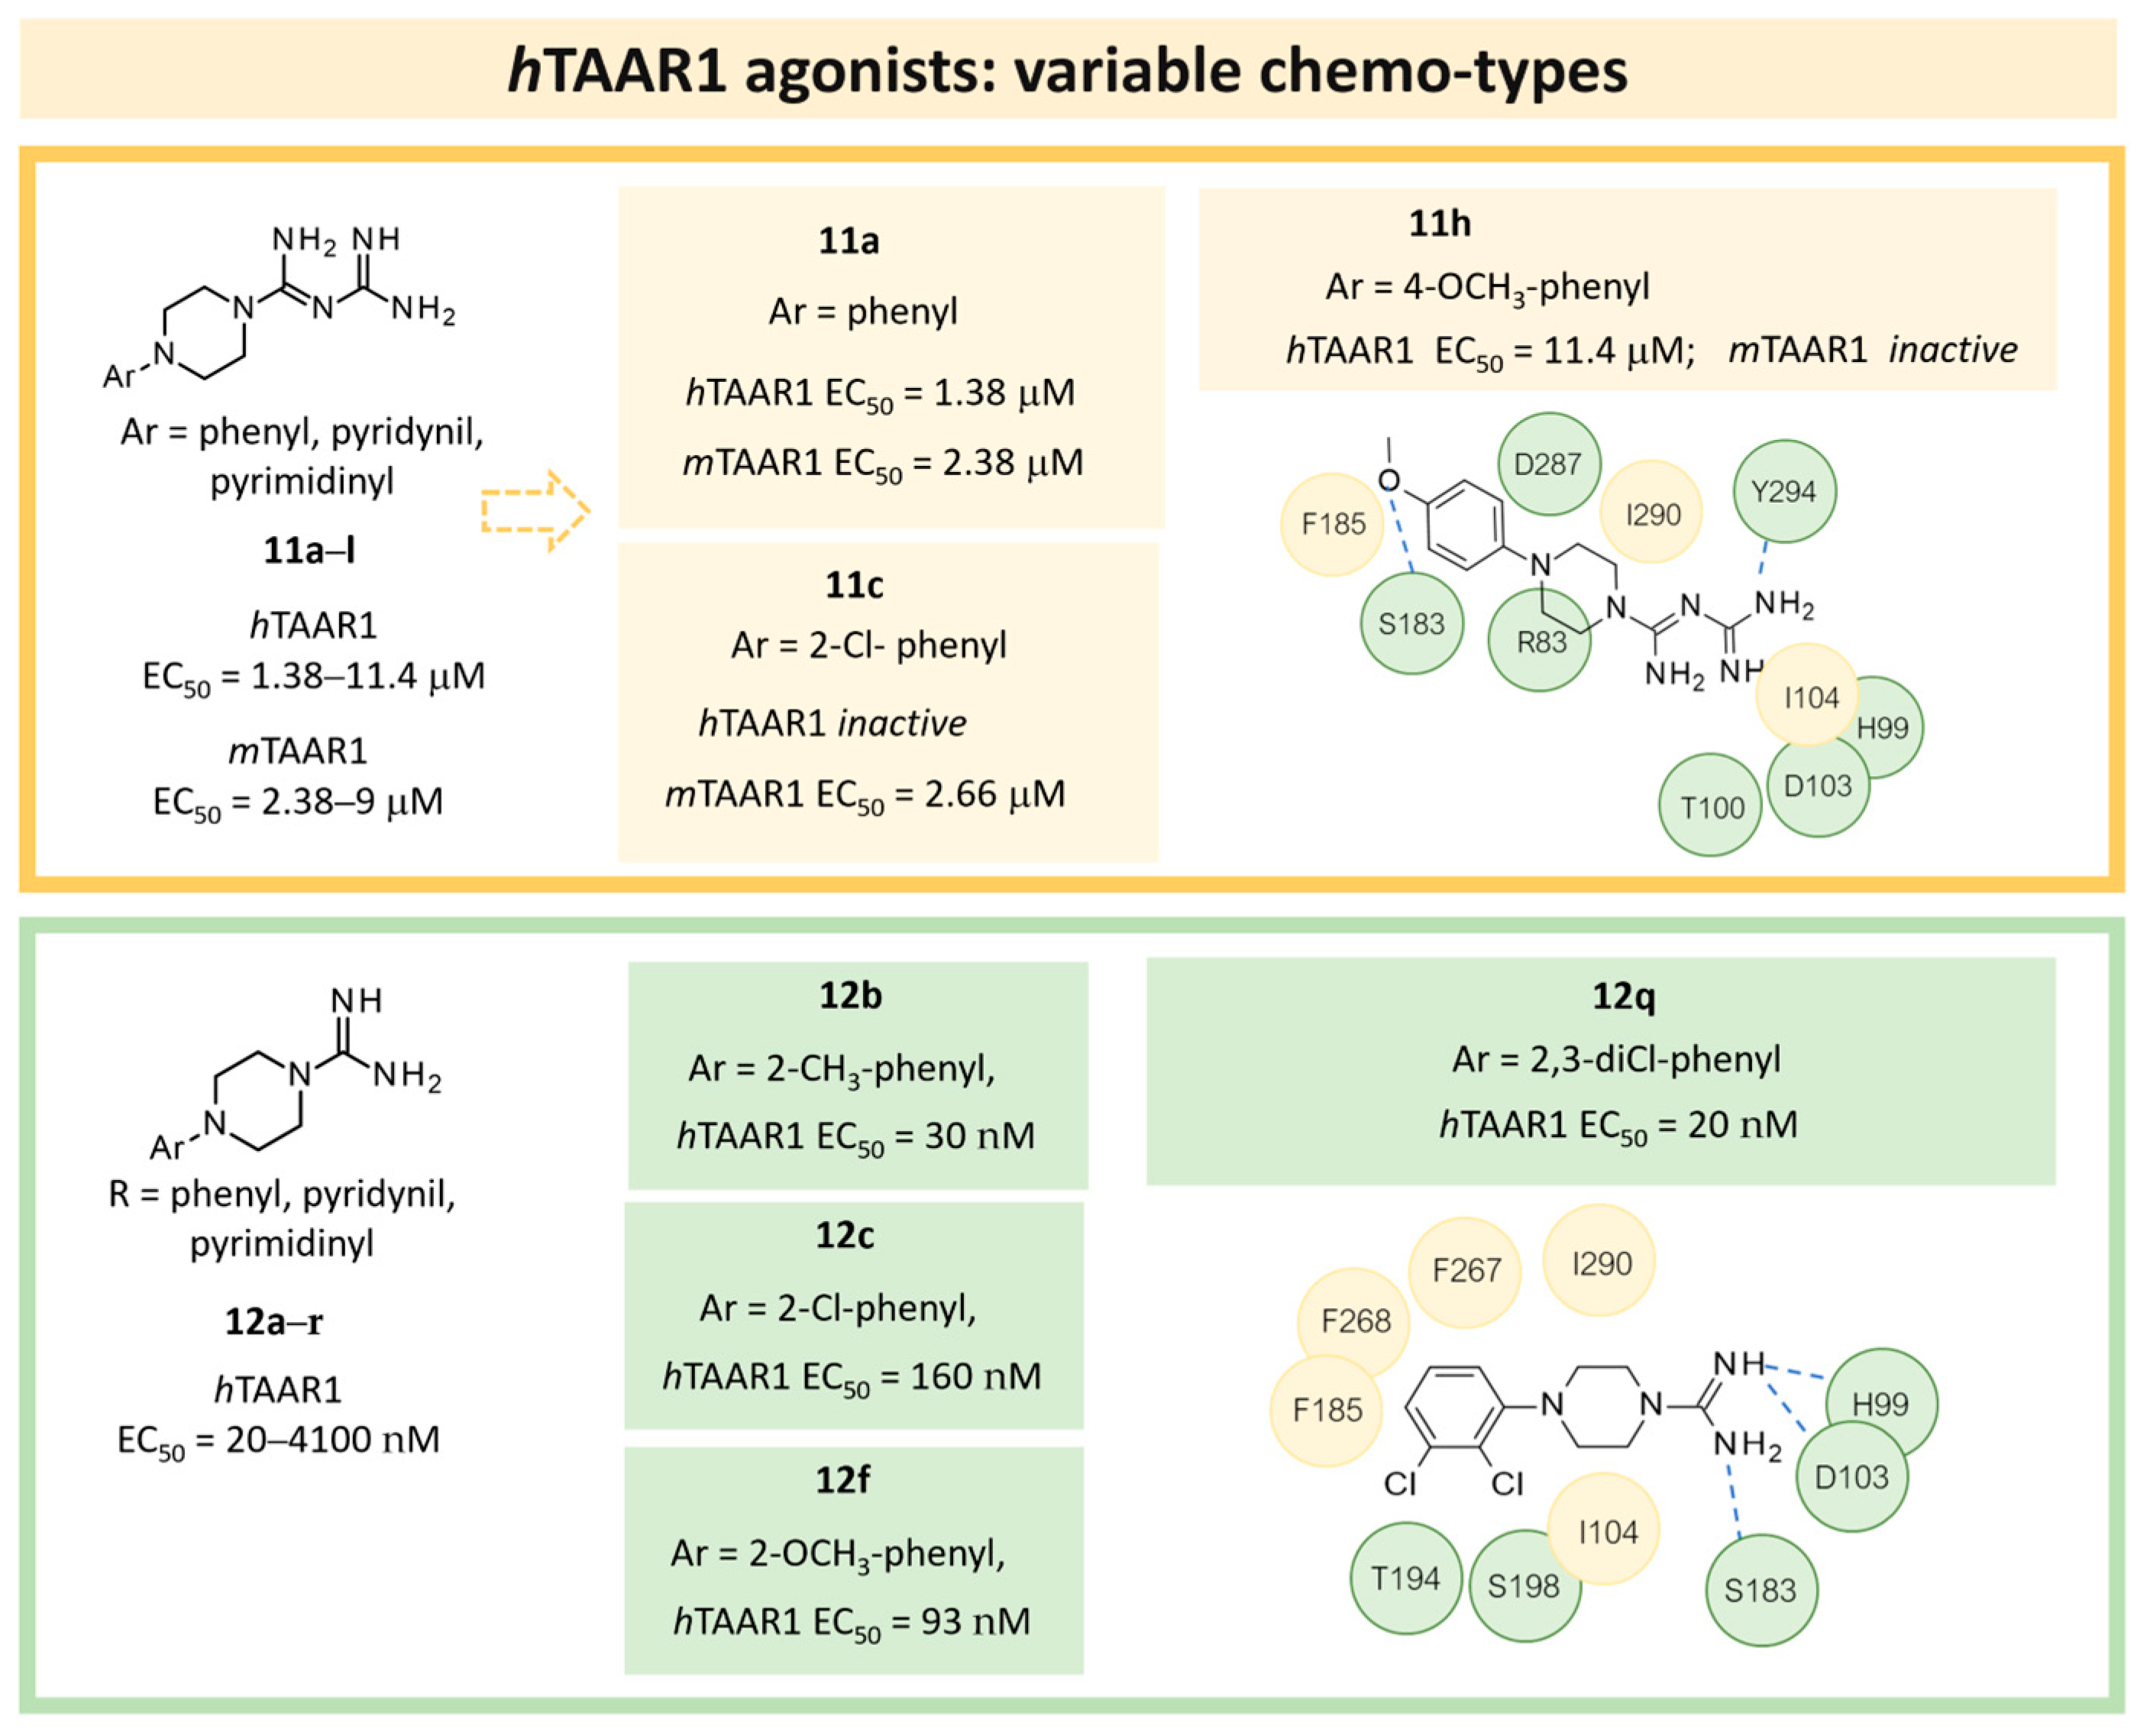
| 4 | 2018 | In silico-aided drug design (QSAR, docking) | QSAR: prospective drug design, docking: selectivity rationalization | 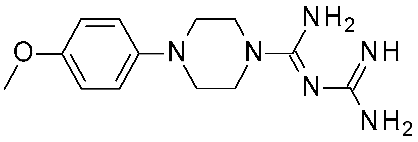 11h | 11.4 μM | [43] |
| 5 | 2020 | In silico aided drug design (pharmacophore model, docking) | Prospective drug design (pharmacophore model), SAR rationalization (docking) | 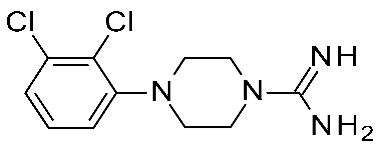 12q | 20 nM | [44] |
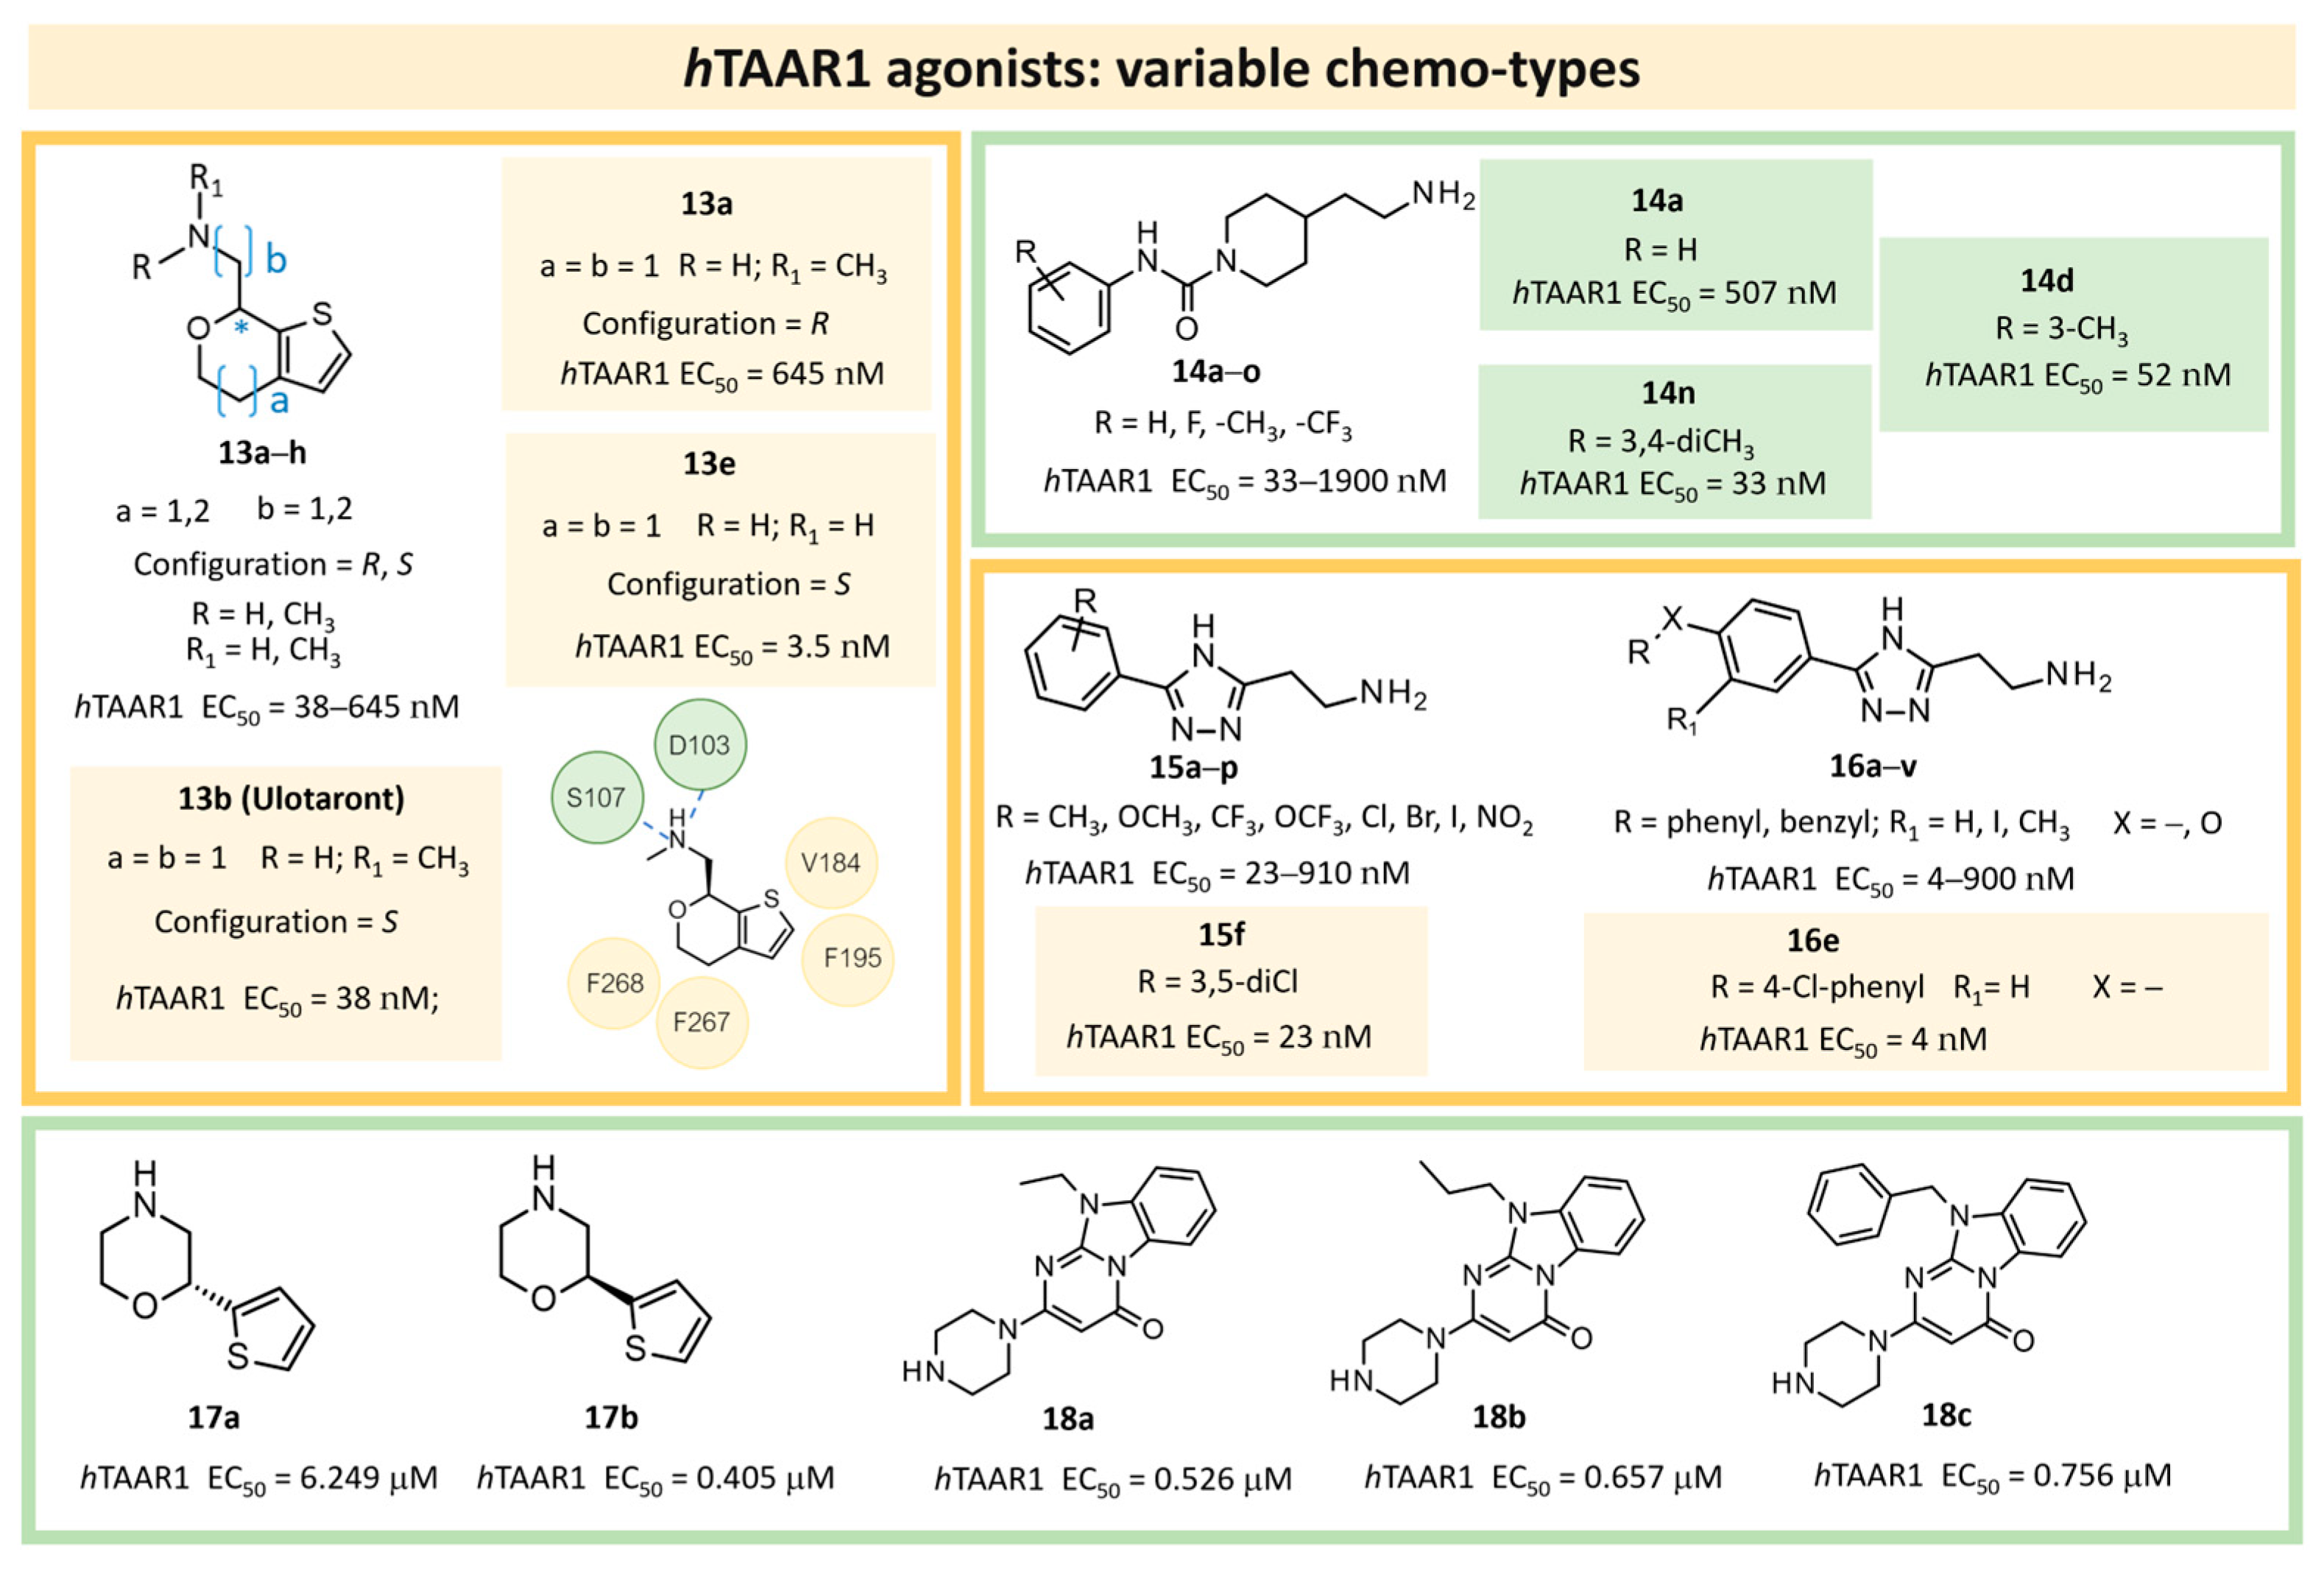
| 6 | 2022 | Hit expansion (synthesis of Ulotaront analogs) * | Study of the mechanism of action of Ulotaront, SAR rationalization. | 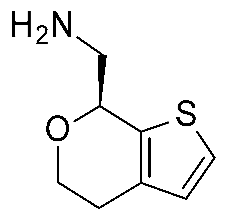 13e | 3.5 nM | [45] |
| 7 | 2022 | HTS+hit expansion | SAR rationalization | 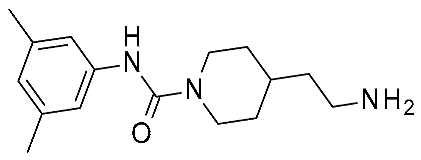 14o | 112 nM | [46] |
| 8 | 2022 | HTS+hit expansion | Interaction mode investigation | 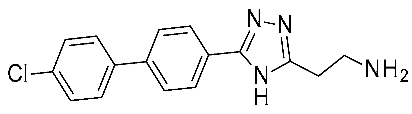 16e | 4 nM | [47] |
| 9 | 2023 | Similarity search+VS+MD | Drug design process | 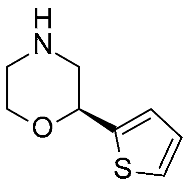 17b | 0.405 μM | [48] |
| 10 | 2023 | Comparative docking+QSAR | Drug design process, selectivity profile elucidation | 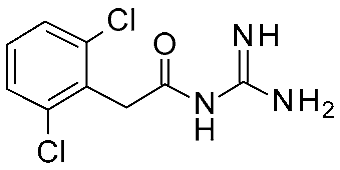 Guanfacine | 20 nM | [49] |
| 11 | 2024 | In silico aided-drug design | SAR rationalization, drug design process | 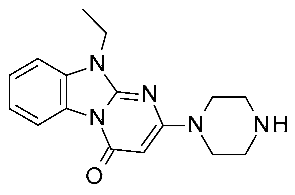 18a | 526 nM | [50] |
| Model n. | TAAR Models | First Published in Ref | Utilized in Ref (s) | Template | R (Å) | R.D. | Presence of Small Molecules/Ligand-Based HM | % Id. (BLAST) |
|---|---|---|---|---|---|---|---|---|
| 1 | hTAAR1 | [40] | [33,40,42,43,44,86] | 3PDS | 3.50 | 2011 | Irreversible agonist (co-crystallized) | 31.60% |
| 2 | hTAAR1 | [41] | [41] | 2RH1 | 2.40 | 2007 | Carazolol (partial inverse agonist) + ligand guided HM | 31.60% |
| 3 | hTAAR1 | [45] | [45] | HM by GPCRdb9 web site. Backbone of the TM helices: 3SN6 (prevalent template) loop coordinates: 6CM4, 4IAQ, 4UHR | 3SN6: 3.2 6CM4: 2.87 4IAQ:2.80 4UHR: 2.60 | 3SN6: 2011 6CM4: 2018 4IAQ:2013 4UHR: 2015 | 3SN6: high affinity agonist (BI-167107) 6CM4: Risperidone (inverse agonist) 4IAQ: Dihydroergotamine (agonist) 4UHR: selective agonist CGS21680 | 31.60% (3SN6) |
| 4 | hTAAR1 | Online source (AlphaFold, Structure ID Q96RJ0) [62,63] last updated in AlphaFold DB version 2022-11-01 | [46,47,48] | Structure ID Q96RJ0 | NA | NA | no | NA |
| 5 | mTAAR1 | [27] | [27,28,42,43,86] | 3PDS | 3.50 | 2011 | Irreversible agonist + ligand-based HM (T1AM) | 31.48% |
| PDB ID | Ligand Name | Resolution (Å) | n. of Non-H Atoms | Ref. |
|---|---|---|---|---|
| 8W88 | Ulotaront | 2.60 | 8307 | [87] |
| 8W87 | METH | 2.80 | 8228 | [87] |
| 8W8A | RO5256390 | 2.80 | 8260 | [87] |
| 8JLQ | Fenoldopam | 2.84 | 9033 | [90] |
| 8WC8 | ZH8651 | 2.90 | 8062 | [91] |
| 8W89 | β-PEA | 3.00 | 8230 | [87] |
| 8JLR | A77636 (adamantane derivative) | 3.00 | 8934 | [90] |
| 8JLP | Ralmitaront | 3.23 | 7343 | [90] |
| 8JLN | T1AM | 3.24 | 9117 | [90] |
| 8UHB | RO5256390 | 3.35 | 8417 | [92] |
| 8JSO | D-AMPH | 3.40 | 9045 | [90] |
| 8WCA | β-PEA | 3.48 | 8160 | [91] |
| 8JLO | Ulotaront | 3.52 | 7343 | [90] |
| 8WC3 | Ulotaront | 3.00 | 8418 | [91] |
| 8WCC | CHA | 3.04 | 2056 | [91] |
| 8JLJ | T1AM | 3.10 | 8918 | [90] |
| 8WCB | CHA | 3.10 | 7784 | [91] |
| 8WC7 | ZH8667 | 3.10 | 8532 | [91] |
| 8WC4 | ZH8651 | 3.10 | 8394 | [91] |
| 8WC9 | ZH8651 | 3.20 | 8394 | [91] |
| 8WC6 | β-PEA | 3.20 | 9183 | [91] |
| 8JLK | Ulotaront | 3.22 | 8824 | [90] |
| 8WC5 | TMA | 3.30 | 8511 | [91] |
| hTAAR1 Agonists | ||||||
|---|---|---|---|---|---|---|
| Protein Mutants | 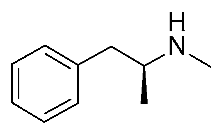 METH [87] |  β-PEA [87] |  (S)-AMPH [87] |  Ulotaront [87] |  RO5256390 [87] |  T1AM [87] |
| D103A | YES | YES | YES | YES | YES | YES |
| I104A | YES | YES | YES | YES | YES | YES |
| S107A | YES | YES | YES | YES | YES | YES |
| F186A | YES | YES | POOR | YES | YES | YES |
| T194A | YES | YES | - | YES | YES | YES |
| W264A | YES | YES | YES | YES | YES | YES |
| F267A | PARTIAL * (70%) | YES | POOR | PARTIAL * (56%) | YES | YES |
| Y294A | YES | YES | YES | YES | YES | YES |
| I290T | YES | YES | - | YES | YES | - |
| I290N | YES | YES | - | YES | YES | - |
| S80A | POOR * (84%) | PARTIAL (47%) | - | PARTIAL (53%) | PARTIAL (52%) | YES |
| R83A | YES | YES | - | YES | YES | YES |
| F185A | NO * (107%) | PARTIAL (52%) | - | PARTIAL (66%) | PARTIAL * (58%) | - |
| H99A | YES | YES | - | YES | YES | YES |
| S107C | YES | YES | - | YES | YES | - |
| S198A | ACTIVATION (150%) | ACTIVATION (129%) | - | NO (99%) | ACTIVATION (113%) | PARTIAL |
| S108A | - | - | - | - | - | YES |
| I290A | - | - | YES | - | - | - |
| F268A | - | - | PARTIAL (~50%) | - | - | YES |
| V184A | - | - | PARTIAL (~50%) | - | - | YES |
| mTAAR1 Agonists | ||||||
|---|---|---|---|---|---|---|
| Protein Mutants | 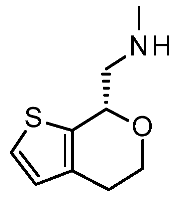 Ulotaront [90] | 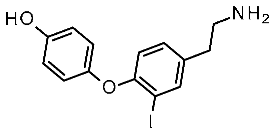 T1AM [90] |  TMA [91] | 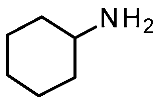 CHA [91] |  β-PEA [91] | 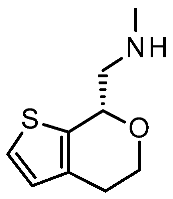 Ulotaront [91] |
| D102A | YES | YES | YES | YES | YES | YES |
| S106A | YES | YES | PARTIAL | NO | YES | PARTIAL |
| I103A | PARTIAL (~60%) | YES | POOR | PARTIAL | PARTIAL | PARTIAL |
| F185A | POOR * | YES | POOR | PARTIAL | PARTIAL | YES |
| W261A | YES | YES | YES | YES | YES | YES |
| F264A | YES | PARTIAL (~50%) | PARTIAL | PARTIAL | PARTIAL | PARTIAL |
| F265A | YES | YES | NO | PARTIAL | YES | PARTIAL |
| Y291A | - | YES | YES | NO * | YES | YES |
| S107A | - | POOR | - | - | - | - |
| P183A | - | POOR | POOR | NO | PARTIAL | YES |
| A193T | - | POOR | - | - | - | - |
| Y153A | - | - | NO | NO | YES | PARTIAL |
| S197A | - | PARTIAL (~50%) | NO | NO | NO | PARTIAL |
| Y287A | - | - | PARTIAL | PARTIAL | YES | PARTIAL |
| Entry | Year | Method of Discovery | Use of Structural Information | Proposed Hits | mTAAR5 IC50 | Ref. |
|---|---|---|---|---|---|---|
| 1 | 2016 | VS on mTAAR5 HM | Prospective VS, selectivity rationalization |  19 | 29 μM | [86] |
 20 | 4.8 μM | |||||
| 2 | 2022 | VS on mTAAR HM | Prospective VS | 21, 22 Chemical structure not shown | 1.1 μM | [121] |
| 3 | 2023 | VS on mTAAR HM | Prospective VS | 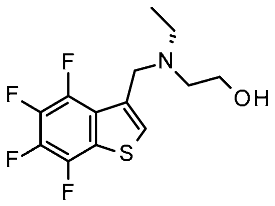 23 | 21 μM | [122] |
 24 | 3.5 μM | |||||
 25 | 2.8 μM |
| Model n. | Modelled TAAR | Generated in Ref. | Utilized in Ref (s) | Template | R (Å) | R.D. | Presence of Small Molecules/Ligand-Based HM | % Id. (BLAST) |
|---|---|---|---|---|---|---|---|---|
| 1 | hTAAR5 | [86] | [42,86] | 3PDS | 3.50 | 2011 | Irreversible agonist | 34.26% |
| 2 | mTAAR5 | [86] | [42,86] | 3PDS | 3.50 | 2011 | Irreversible agonist | 33.89% |
| 3 | mTAAR5 | [121] | [121] | 6IBL | 2.70 | 2019 | Formoterol (agonist) | 33.33% |
| 4 | mTAAR5 | [122] | [122] |
Main templates: 4GBR, 2Y03 ECL2: 5ZBH |
4GBR: 3.99, 2Y03: 2.85, 5ZBH: 3.00 |
4GBR: 2012 2Y03: 2010 5ZBH: 2018 |
4GBR: S-Carazolol (inverse agonist) 2Y03: Isoprenaline (agonist) 5ZBH: BMS-193885 (antagonist) |
4GBR: 33.89% 2Y03: 33.33% 5ZBH: 24.44% |
| PDB ID | Description | Scientific Name | Total Score | Query Cover | % Id. |
|---|---|---|---|---|---|
| 8ITF | Trace amine-associated receptor 9 | Mus musculus | 299 | 97% | 46.45% |
| 8PM2 | Trace amine-associated receptor 7f | Mus musculus | 321 | 96% | 45.65% |
| 8W87 | Trace amine-associated receptor 1 | Homo sapiens | 251 | 95% | 38.74% |
| 8JLN | Trace amine-associated receptor 1 | Homo sapiens | 253 | 99% | 38.33% |
| 8JLJ | Trace amine-associated receptor 1 | Mus musculus | 247 | 99% | 37.90% |
| 6H7J | β-1 adrenergic receptor | Meleagris gallopavo | 158 | 84% | 37.72% |
| 6IBL | β-1 adrenergic receptor | Meleagris gallopavo | 158 | 84% | 37.72% |
| 2VT4 | β-1 adrenergic receptor | Meleagris gallopavo | 155 | 82% | 37.41% |
| 6TKO | β-1 adrenergic receptor | Meleagris gallopavo | 159 | 82% | 37.23% |
| 2Y00 | β-1 adrenergic receptor | Meleagris gallopavo | 153 | 82% | 37.14% |
| 7JJO | β-1 adrenergic receptor | Meleagris gallopavo | 152 | 81% | 36.62% |
| 5A8E | β-1 adrenergic receptor | Meleagris gallopavo | 150 | 82% | 36.43% |
| 4BVN | β-1 adrenergic receptor | Meleagris gallopavo | 149 | 82% | 36.43% |
| 7EJ0 | α-2A adrenergic receptor | Homo sapiens | 160 | 82% | 36.14% |
| 7XT8 | 5-hydroxytryptamine receptor 4 | Homo sapiens | 157 | 80% | 35.45% |
| 4LDE | β-2 adrenergic receptor | Homo sapiens | 139 | 77% | 34.96% |
| 5JQH | β-2 adrenergic receptor | Homo sapiens | 139 | 77% | 34.96% |
| 4QKX | β-2 adrenergic receptor | Homo sapiens | 137 | 77% | 34.96% |
| 8HN1 | α-1A adrenergic receptor | Homo sapiens | 146 | 89% | 34.85% |
| 7BTS | β-1 adrenergic receptor | Homo sapiens | 144 | 81% | 34.78% |
| 6MXT | β-2 adrenergic receptor | Homo sapiens | 137 | 77% | 34.59% |
| 8THK | α-1A adrenergic receptor | Homo sapiens | 150 | 86% | 34.54% |
| 6KUY | α-2A adrenergic receptor | Homo sapiens | 161 | 85% | 34.51% |
| 2R4S | β-2 adrenergic receptor | Homo sapiens | 132 | 77% | 34.27% |
| 2R4R | β-2 adrenergic receptor | Homo sapiens | 131 | 77% | 34.27% |
| 4GBR | β-2 adrenergic receptor | Homo sapiens | 136 | 77% | 34.21% |
| 7YS6 | 5-hydroxytryptamine receptor 6 | Homo sapiens | 134 | 83% | 34.12% |
| 6KUX | α-2A adrenergic receptor | Homo sapiens | 160 | 85% | 34.07% |
| 6WGT | 5-hydroxytryptamine receptor 2A | Homo sapiens | 134 | 82% | 33.78% |
| 3P0G | β-2 adrenergic receptor | Homo sapiens | 147 | 78% | 33.68% |
| 2RH1 | β-2 adrenergic receptor | Homo sapiens | 147 | 78% | 33.68% |
| 7BZ2 | β-2 adrenergic receptor | Homo sapiens | 133 | 77% | 33.46% |
| 7DHI | β-2 adrenergic receptor | Homo sapiens | 133 | 77% | 33.46% |
| 3SN6 | β-2 adrenergic receptor | Homo sapiens | 133 | 77% | 33.45% |
| 6NI3 | β-2 adrenergic receptor | Homo sapiens | 133 | 77% | 33.45% |
| 3D4S | β-2 adrenergic receptor | Homo sapiens | 148 | 78% | 33.16% |
| 6PRZ | β-2 adrenergic receptor | Homo sapiens | 148 | 77% | 33.16% |
| 3PDS | β-2 adrenergic receptor | Homo sapiens | 146 | 77% | 33.16% |
| PDB ID | Description | Organism | Total Score | Query Coverage | % Id. |
|---|---|---|---|---|---|
| 8ITF | Trace amine-associated receptor 9 | Mus musculus | 305 | 97% | 46.45% |
| 8PM2 | Trace amine-associated receptor 7f | Mus musculus | 310 | 95% | 44.24% |
| 8WC3 | Trace amine-associated receptor 1 | Mus musculus | 258 | 89% | 42.44% |
| 8JLJ | Trace amine-associated receptor 1 | Mus musculus | 260 | 89% | 42.44% |
| 8W87 | Trace amine-associated receptor 1 | Homo sapiens | 259 | 94% | 39.27% |
| 8JLN | Trace amine-associated receptor 1 | Homo sapiens | 260 | 94% | 39.27% |
| 8UHB | Trace amine-associated receptor 1 | Homo sapiens | 258 | 96% | 38.39% |
| 6TKO | Beta-1 adrenergic receptor | Meleagris gallopavo | 158 | 83% | 37.46% |
| 2Y00 | Beta-1 adrenergic receptor | Meleagris gallopavo | 155 | 83% | 36.90% |
| 7JJO | Beta-1 adrenergic receptor | Meleagris gallopavo | 154 | 83% | 36.90% |
| 6H7J | Beta-1 adrenergic receptor | Meleagris gallopavo | 159 | 84% | 36.82% |
| 2VT4 | Beta-1 adrenergic receptor | Meleagris gallopavo | 158 | 83% | 36.81% |
| 6WGT | 5-hydroxytryptamine receptor 2A | Homo sapiens | 108 | 86% | 36.70% |
| 6IBL | Beta-1 adrenergic receptor | Meleagris gallopavo | 159 | 86% | 36.67% |
| PDB ID | Description | Total Score | Query Cover | % Id. |
|---|---|---|---|---|
| 8W87 | Trace amine-associated receptor 1 | 697 | 100% | 100.00% |
| 7WC4 | 5-hydroxytryptamine receptor 2A | 67.8 | 23% | 44.58% |
| 7VOD | 5-hydroxytryptamine receptor 2A | 67.8 | 23% | 44.58% |
| 7XT8 | 5-hydroxytryptamine receptor 4 | 199 | 86% | 37.42% |
| 7CKY | D(1A) dopamine receptor | 158 | 82% | 33.55% |
| 7CKX | D(1A) dopamine receptor | 158 | 82% | 33.55% |
| 7CKW | D(1A) dopamine receptor | 158 | 82% | 33.55% |
| 7F0T | D(1A) dopamine receptor | 158 | 82% | 33.55% |
| 7JV5 | D(1A) dopamine receptor | 157 | 82% | 33.55% |
| 7B6W | Alpha-1B adrenergic receptor | 154 | 87% | 32.78% |
| 4GBR | Beta-2 adrenergic receptor | 158 | 85% | 32.65% |
| 7C61 | 5-hydroxytryptamine receptor 1B | 174 | 85% | 32.44% |
| 7BZ2 | Beta-2 adrenergic receptor | 167 | 85% | 31.97% |
| 7DHI | Beta-2 adrenergic receptor | 167 | 85% | 31.97% |
| 7XTC | 5-hydroxytryptamine receptor 7 | 138 | 82% | 31.75% |
| 6KR8 | Beta-2 adrenergic receptor | 170 | 86% | 31.61% |
| 2R4S | Beta-2 adrenergic receptor | 164 | 85% | 31.60% |
| 2R4R | Beta-2 adrenergic receptor | 163 | 85% | 31.60% |
| 3KJ6 | Beta-2 adrenergic receptor | 162 | 85% | 31.60% |
| 5V54 | 5-hydroxytryptamine receptor 1B | 175 | 85% | 31.58% |
| 7YM8 | alpha1A adrenergic receptor | 165 | 78% | 31.58% |
| 7RAN | 5-hydroxytryptamine receptor 2A | 125 | 88% | 31.29% |
| 6LUQ | Chimera of D(2) dopamine receptor and Endolysin | 169 | 84% | 31.16% |
| 7UL3 | Histamine H2 receptor | 139 | 89% | 31.05% |
| 6K42 | Alpha-2A adrenergic receptor | 145 | 84% | 31.03% |
| 7EJ0 | Alpha-2A adrenergic receptor | 167 | 88% | 30.77% |
| 5D5A | Beta-2 adrenergic receptor | 175 | 78% | 30.77% |
| 7YS6 | 5-hydroxytryptamine receptor 6 | 144 | 85% | 30.58% |
| 8E9W | Muscarinic acetylcholine receptor M3 | 132 | 86% | 30.57% |
| 8E9Z | Muscarinic acetylcholine receptor M3 | 131 | 86% | 30.57% |
| 8E9Y | Muscarinic acetylcholine receptor M3 | 131 | 86% | 30.57% |
| 6G79 | 5-hydroxytryptamine receptor 1B | 151 | 85% | 30.43% |
| 8JLZ | 5-hydroxytryptamine receptor 6 | 147 | 85% | 30.42% |
| 7XTB | 5-hydroxytryptamine receptor 6 | 146 | 85% | 30.42% |
| 5CXV | Muscarinic acetylcholine receptor M1 | 140 | 76% | 30.27% |
| 6KUW | Alpha-2C adrenergic receptor | 156 | 85% | 30.26% |
| 7YMJ | Alpha-1A adrenergic receptor | 127 | 87% | 30.00% |
| Reference Proteins | hTAAR1 Binding Site | ||||||||||||||||||||||||
|---|---|---|---|---|---|---|---|---|---|---|---|---|---|---|---|---|---|---|---|---|---|---|---|---|---|
| T100 | I104 | V184 | F186 | D103 | R83 | V76 | M77 | S297 | L72 | Y294 | W291 | G293 | I290 | W264 | F267 | S107 | S108 | T271 | F268 | S198 | T194 | H99 | S80 | S190 | |
| 5-HT2AR | I | V | L | D | † | T | † | † | † | † | † | † | † | V | † | † | † | T | N | † | † | G | W | † | † |
| D1R | V | † | S | L | † | A | † | † | † | V | † | † | † | V | † | † | † | T | N | † | † | S | W | K | † |
| α1B-ADR | A | V | † | E | † | L | † | L | † | † | † | † | † | L | † | † | C | T | L | † | † | S | W | † | Y |
| β2-ADR | † | V | F | T | † | H | † | V | † | M | † | † | † | N | † | † | V | T | N | † | † | S | W | G | Y |
| α1A-ADR | A | V | I | E | † | F | † | L | † | † | † | † | † | F | † | † | C | T | M | † | † | S | W | † | Y |
| H2R | † | V | † | V | † | Y | † | L | † | † | † | † | † | L | † | Y | C | T | F | † | T | D | Y | † | † |
| 5-HT6R | † | V | L | A | † | N | † | † | † | V | † | † | † | T | † | † | C | † | N | † | T | A | W | A | F |
| M3R | L | C | I | L | † | Y | S | † | Y | I | † | † | † | Y | † | Y | † | N | V | N | G | † | W | F | I |
| PDB ID | Description | Total Score | Query Cover | % Id. |
|---|---|---|---|---|
| 8W87 | Trace amine-associated receptor 1 | 251 | 95% | 38.74% |
| 7EJ0 | Alpha-2A adrenergic receptor | 160 | 82% | 36.14% |
| 7XT8 | 5-hydroxytryptamine receptor 4 | 157 | 80% | 35.45% |
| 6KUY | Alpha-2A adrenergic receptor | 161 | 85% | 34.51% |
| 2R4S | Beta-2 adrenergic receptor | 132 | 77% | 34.27% |
| 2R4R | Beta-2 adrenergic receptor | 131 | 77% | 34.27% |
| 4GBR | Beta-2 adrenergic receptor | 136 | 77% | 34.21% |
| 7YS6 | 5-hydroxytryptamine receptor 6 | 134 | 83% | 34.12% |
| 6KUX | Alpha-2A adrenergic receptor | 160 | 85% | 34.07% |
| 5D5A | Beta-2 adrenergic receptor | 147 | 78% | 33.68% |
| 7BZ2 | Beta-2 adrenergic receptor | 133 | 77% | 33.46% |
| 7DHI | Beta-2 adrenergic receptor | 133 | 77% | 33.46% |
| 3KJ6 | Beta-2 adrenergic receptor | 132 | 77% | 33.10% |
| 6KR8 | Beta-2 adrenergic receptor | 136 | 82% | 32.46% |
| 7SRQ | 5-hydroxytryptamine receptor 2B | 114 | 78% | 32.26% |
| 7SRS | 5-hydroxytryptamine receptor 2B | 112 | 78% | 32.26% |
| 8JLZ | 5-hydroxytryptamine receptor 6 | 128 | 83% | 32.17% |
| 7XTB | 5-hydroxytryptamine receptor 6 | 128 | 83% | 32.17% |
| 6K42 | Alpha-2B adrenergic receptor | 133 | 81% | 31.97% |
| 7B6W | Alpha-1B adrenergic receptor | 148 | 91% | 31.78% |
| 7UL3 | Histamine H2 receptor | 108 | 83% | 31.58% |
| 7YMJ | Alpha-1A adrenergic receptor | 123 | 89% | 31.27% |
| 8HDO | Adenosine A2b receptor | 105 | 81% | 31.14% |
| 7YM8 | Alpha-1A adrenergic receptor | 164 | 86% | 30.77% |
| 6KUW | Alpha-2C adrenergic receptor | 146 | 82% | 30.60% |
| 7C61 | 5-hydroxytryptamine receptor 1B | 155 | 80% | 30.33% |
| 6LUQ | Chimera of D(2) dopamine receptor and Endolysin | 150 | 79% | 30.11% |
| 8JSP | 5-hydroxytryptamine receptor 1A | 149 | 79% | 30.00% |
| Reference Proteins | hTAAR5 Binding Site | ||||||||||||||||||||||||
|---|---|---|---|---|---|---|---|---|---|---|---|---|---|---|---|---|---|---|---|---|---|---|---|---|---|
| L83 | V87 | L88 | S91 | R94 | H110 | T111 | D114 | T115 | C118 | L119 | L194 | L196 | W200 | N204 | L207 | W265 | F268 | T269 | T272 | I291 | W292 | A294 | Y295 | S298 | |
| α2A-ADR | V | † | I | † | N | Y | L | † | V | † | T | I | gap | † | S | S | † | † | F | Y | F | † | G | † | † |
| β2-ADR | M | † | V | G | H | W | † | † | V | V | T | F | T | Y | S | S | † | † | F | N | N | † | G | † | † |
| 5-HT6R | V | † | M | A | N | W | † | † | V | † | S | † | A | F | S | T | † | † | F | N | T | † | G | † | † |
| H2R | † | † | † | † | Y | Y | † | † | V | † | T | V | V | Y | D | T | † | Y | F | F | L | † | G | † | † |
| α1A-ADR | † | † | † | † | F | W | A | † | V | † | T | I | E | Y | A | S | † | † | F | M | F | † | G | † | † |
| 5-HT1BR | V | † | M | † | Y | W | L | † | I | † | T | I | Y | gap | T | A | † | † | F | S | T | † | G | † | † |
| 5-HT1AR | V | † | † | A | Y | F | I | † | V | † | T | I | K | Y | T | A | † | † | F | A | N | † | G | † | † |
| D1R | V | † | M | K | A | W | V | † | I | S | T | S | † | Y | S | S | † | † | F | N | V | † | G | W | † |
Disclaimer/Publisher’s Note: The statements, opinions and data contained in all publications are solely those of the individual author(s) and contributor(s) and not of MDPI and/or the editor(s). MDPI and/or the editor(s) disclaim responsibility for any injury to people or property resulting from any ideas, methods, instructions or products referred to in the content. |
© 2024 by the authors. Licensee MDPI, Basel, Switzerland. This article is an open access article distributed under the terms and conditions of the Creative Commons Attribution (CC BY) license (https://creativecommons.org/licenses/by/4.0/).
Share and Cite
Scarano, N.; Espinoza, S.; Brullo, C.; Cichero, E. Computational Methods for the Discovery and Optimization of TAAR1 and TAAR5 Ligands. Int. J. Mol. Sci. 2024, 25, 8226. https://doi.org/10.3390/ijms25158226
Scarano N, Espinoza S, Brullo C, Cichero E. Computational Methods for the Discovery and Optimization of TAAR1 and TAAR5 Ligands. International Journal of Molecular Sciences. 2024; 25(15):8226. https://doi.org/10.3390/ijms25158226
Chicago/Turabian StyleScarano, Naomi, Stefano Espinoza, Chiara Brullo, and Elena Cichero. 2024. "Computational Methods for the Discovery and Optimization of TAAR1 and TAAR5 Ligands" International Journal of Molecular Sciences 25, no. 15: 8226. https://doi.org/10.3390/ijms25158226
APA StyleScarano, N., Espinoza, S., Brullo, C., & Cichero, E. (2024). Computational Methods for the Discovery and Optimization of TAAR1 and TAAR5 Ligands. International Journal of Molecular Sciences, 25(15), 8226. https://doi.org/10.3390/ijms25158226