

Dynamics of Replication-Associated Protein Levels through the Cell Cycle
Abstract
:1. Introduction
2. Results and Discussion
2.1. Double-Tagged Cell Lines for the Study of Cell Cycle-Dependent Expression at the Single-Cell Level
2.2. Sobel-Adjusted PCNA Fluorescence Intensity as an Indicator of Early, Middle, and Late S Phase
2.3. RIF1
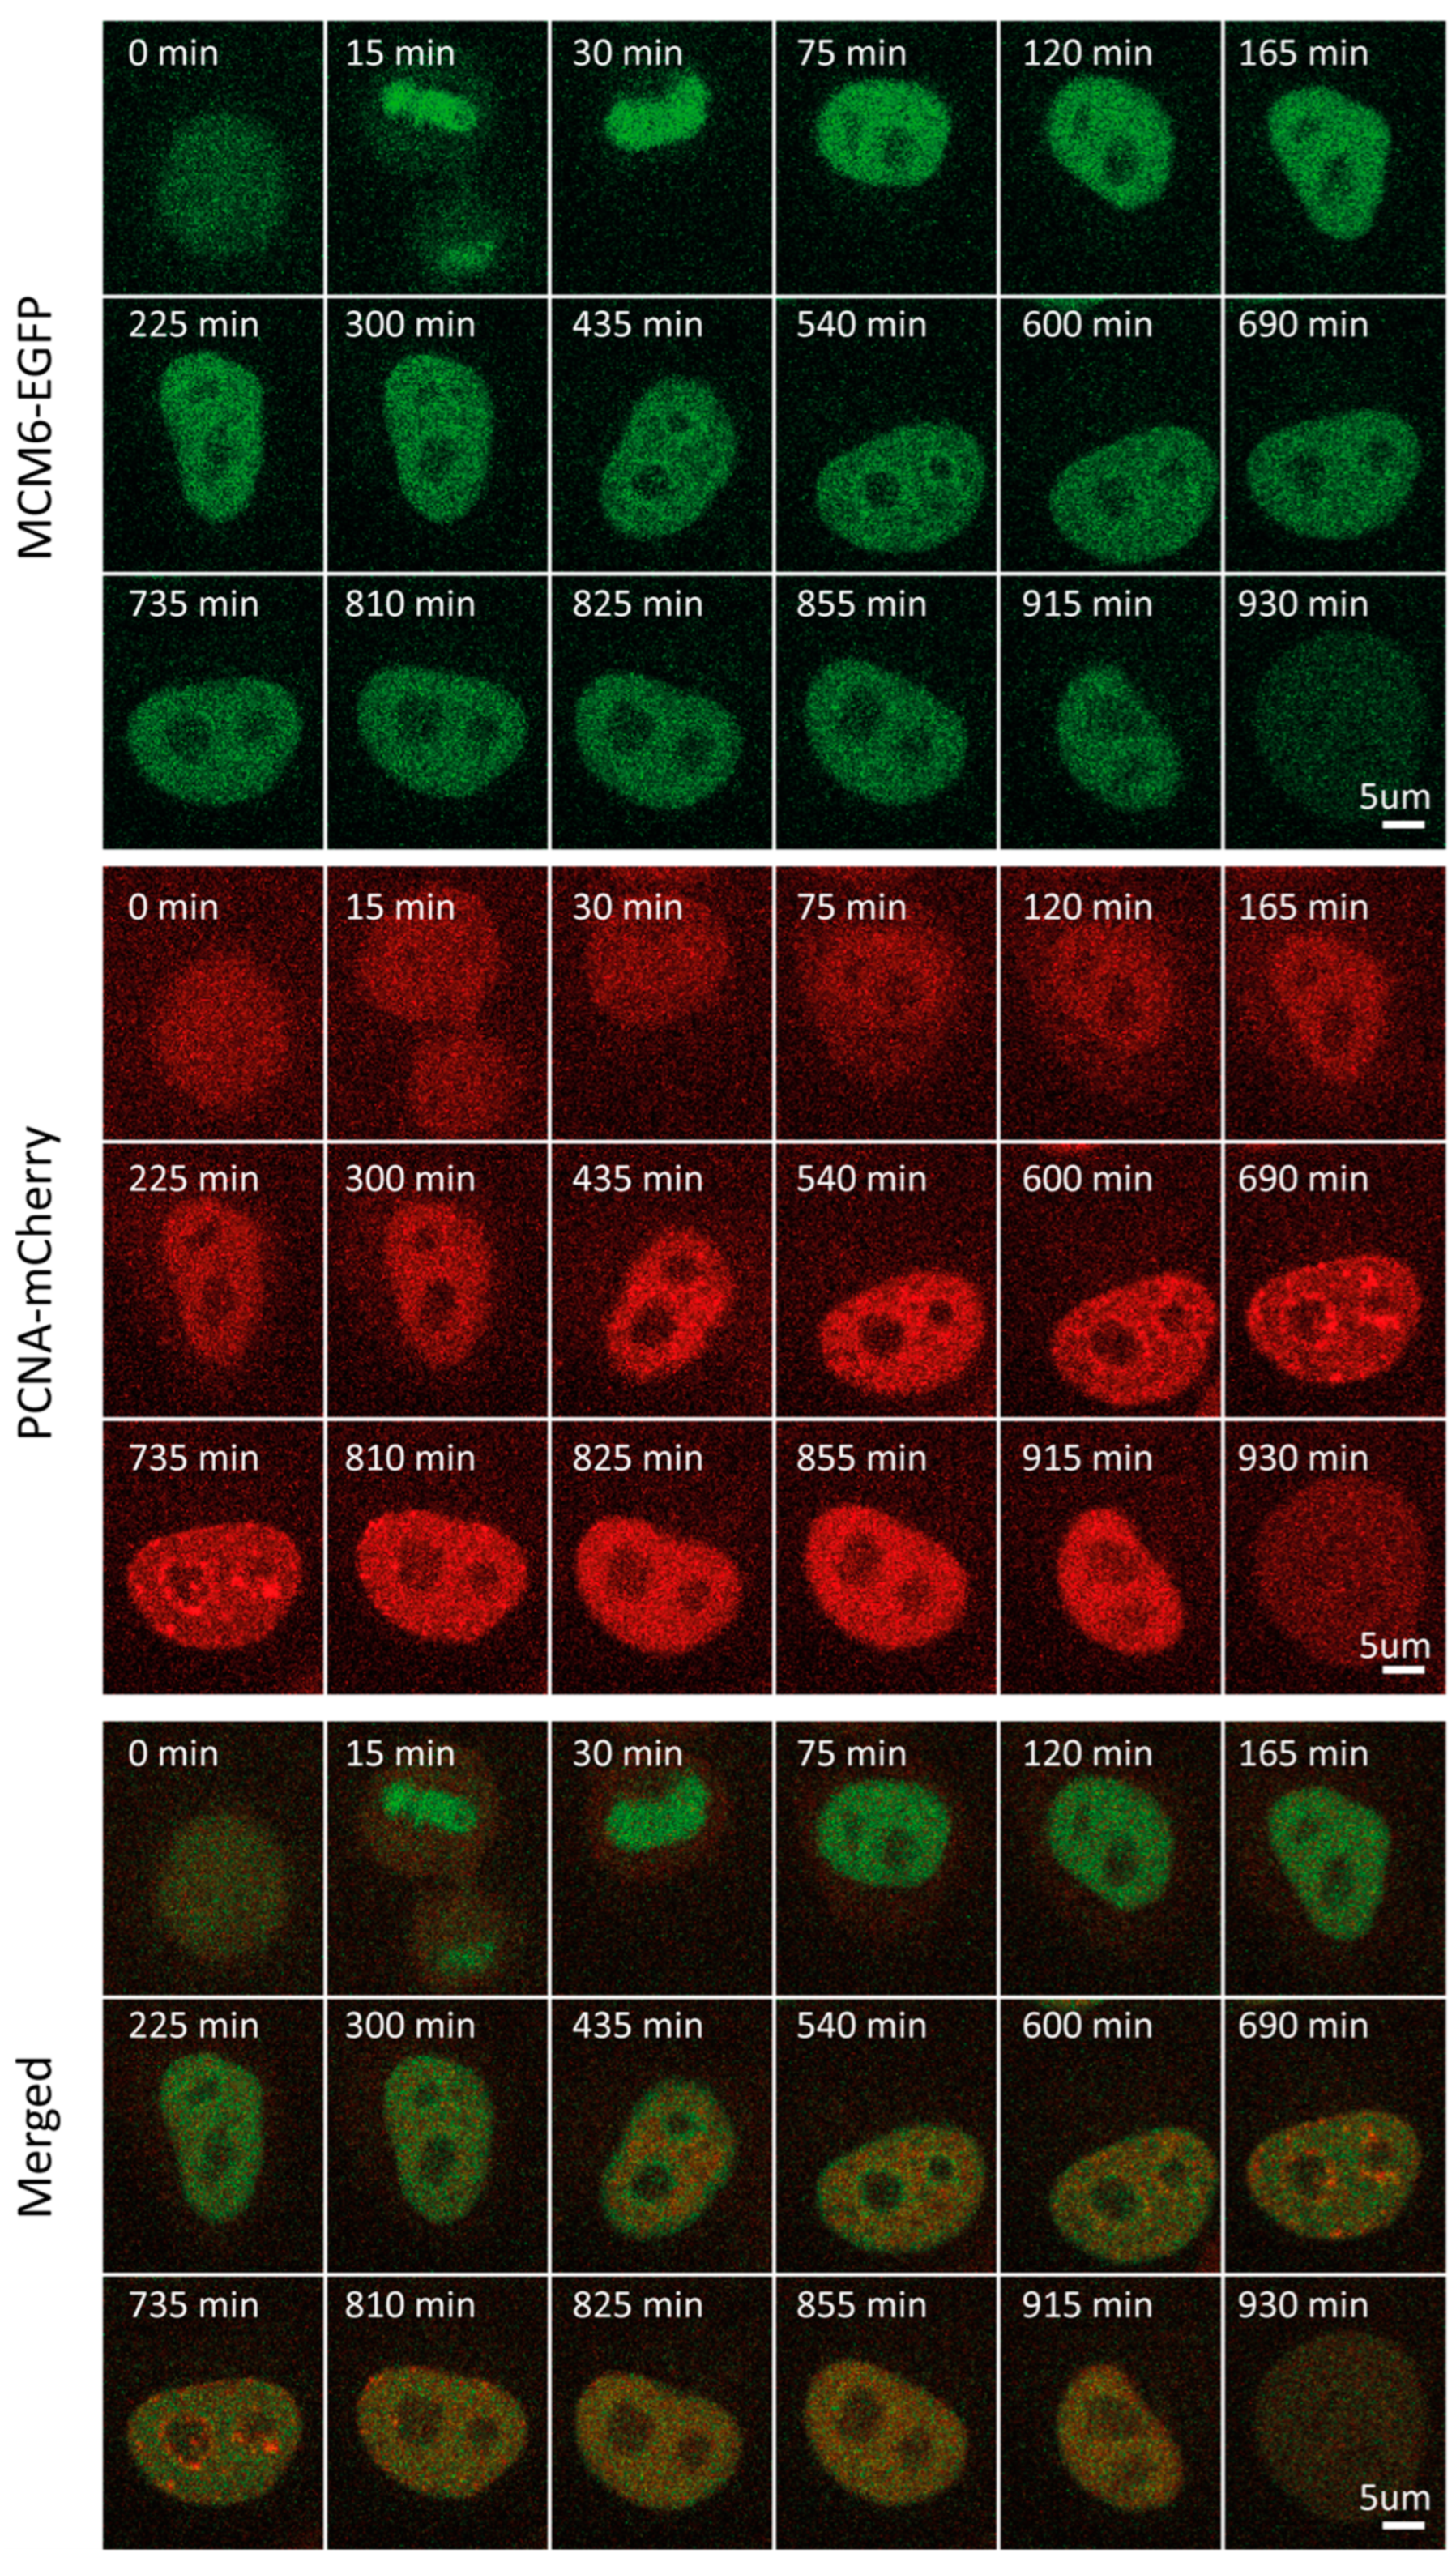
2.4. MCM6
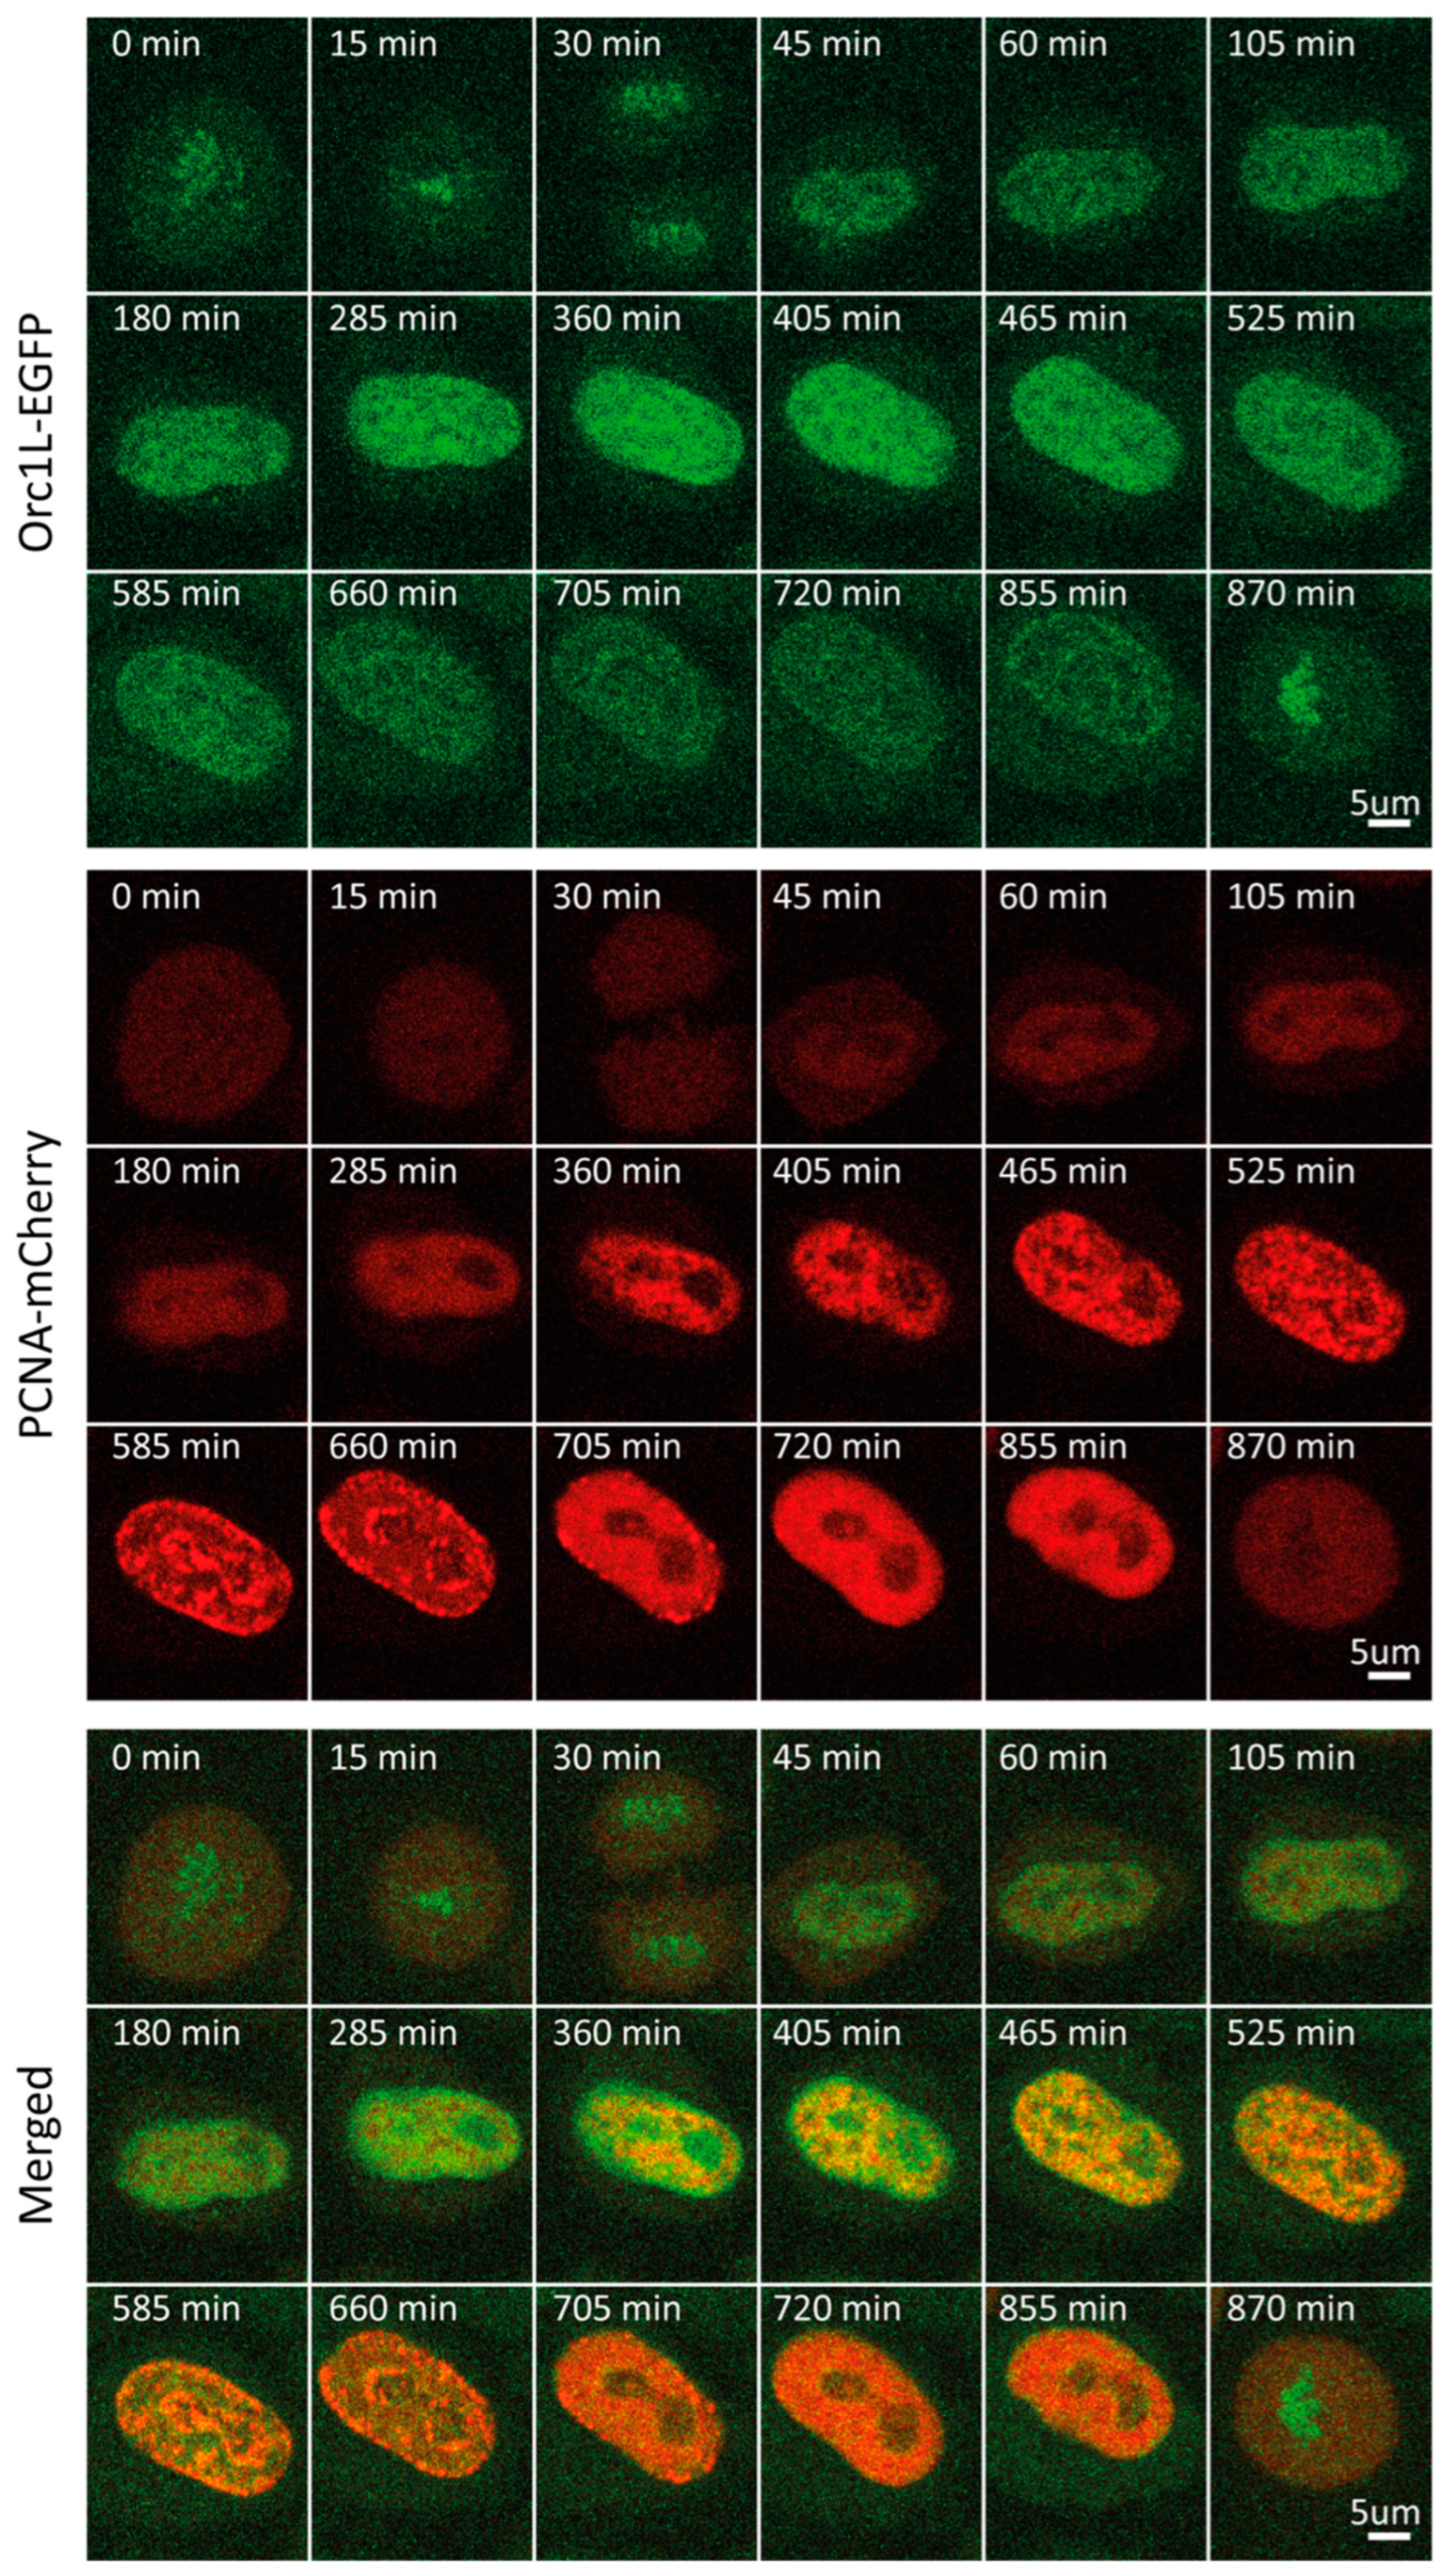
2.5. ORC1
2.6. Claspin
3. Materials and Methods
3.1. Cell Lines and Culture
3.2. Image Acquisition
3.3. Image Analysis and Cell Cycle Normalization
3.4. Software
4. Conclusions
Supplementary Materials
Author Contributions
Funding
Institutional Review Board Statement
Informed Consent Statement
Data Availability Statement
Conflicts of Interest
References
- Barnum, K.J.; O’Connell, M.J. Cell Cycle Regulation by Checkpoints. Methods Mol. Biol. 2014, 1170, 29–40. [Google Scholar] [CrossRef] [PubMed]
- Choksi, S.P.; Byrnes, L.E.; Konjikusic, M.J.; Tsai, B.W.H.; Deleon, R.; Lu, Q.; Westlake, C.J.; Reiter, J.F. An Alternative Cell Cycle Coordinates Multiciliated Cell Differentiation. Nature 2024, 630, 214–221. [Google Scholar] [CrossRef]
- Nabel, E.G. CDKS and CKIS: Molecular Targets for Tissue Remodelling. Nat. Rev. Drug Discov. 2002, 1, 587–598. [Google Scholar] [CrossRef]
- Malumbres, M.; Barbacid, M. Cell Cycle, CDKs and Cancer: A Changing Paradigm. Nat. Rev. Cancer 2009, 9, 153–166. [Google Scholar] [CrossRef] [PubMed]
- BURGER, M.A.X.M.; BOMBIK, B.M.; BRECKENRIDGE, B.M.; SHEPPARD, J.R. Growth Control and Cyclic Alterations of Cyclic AMP in the Cell Cycle. Nat. New Biol. 1972, 239, 161–163. [Google Scholar] [CrossRef]
- Satyanarayana, A.; Kaldis, P. Mammalian Cell-Cycle Regulation: Several Cdks, Numerous Cyclins and Diverse Compensatory Mechanisms. Oncogene 2009, 28, 2925–2939. [Google Scholar] [CrossRef] [PubMed]
- Kornack, D.R.; Rakic, P. Changes in Cell-Cycle Kinetics during the Development and Evolution of Primate Neocortex. Proc. Natl. Acad. Sci. USA 1998, 95, 1242–1246. [Google Scholar] [CrossRef]
- Soufi, A.; Dalton, S. Cycling through Developmental Decisions: How Cell Cycle Dynamics Control Pluripotency, Differentiation and Reprogramming. Development 2016, 143, 4301–4311. [Google Scholar] [CrossRef]
- Liu, J.; Peng, Y.; Wei, W. Cell Cycle on the Crossroad of Tumorigenesis and Cancer Therapy. Trends Cell Biol. 2022, 32, 30–44. [Google Scholar] [CrossRef]
- Gutschner, T.; Diederichs, S. The Hallmarks of Cancer: A Long Non-Coding RNA Point of View. RNA Biol. 2012, 9, 703–719. [Google Scholar] [CrossRef]
- Fischer, M.; Schade, A.E.; Branigan, T.B.; Müller, G.A.; DeCaprio, J.A. Coordinating Gene Expression during the Cell Cycle. Trends Biochem. Sci. 2022, 47, 1009–1022. [Google Scholar] [CrossRef] [PubMed]
- Tarn, W.Y.; Lai, M.C. Translational Control of Cyclins. Cell Div. 2011, 6, 1–9. [Google Scholar] [CrossRef]
- Tatsumi, Y.; Ohta, S.; Kimura, H.; Tsurimoto, T.; Obuse, C. The ORC1 Cycle in Human Cells: I. Cell Cycle-Regulated Oscillation of Human ORC1. J. Biol. Chem. 2003, 278, 41528–41534. [Google Scholar] [CrossRef]
- Ohta, S.; Tatsumi, Y.; Fujita, M.; Tsurimoto, T.; Obuse, C. The ORC1 Cycle in Human Cells: II. Dynamic Changes in the Human ORC Complex during the Cell Cycle. J. Biol. Chem. 2003, 278, 41535–41540. [Google Scholar] [CrossRef] [PubMed]
- Flygare, J.; Benson, F.; Hellgren, D. Expression of the Human RAD51 Gene during the Cell Cycle in Primary Human Peripheral Blood Lymphocytes. Biochim. Biophys. Acta Mol. Cell Res. 1996, 1312, 231–236. [Google Scholar] [CrossRef]
- Yamamoto, A.; Taki, T.; Yagi, H.; Habu, T.; Yoshida, K.; Yoshimura, Y.; Yamamoto, K.; Matsushiro, A.; Nishimune, Y.; Morita, T. Cell Cycle-Dependent Expression of the Mouse Rad51 Gene in Proliferating Cells. Mol. Gen. Genet. 1996, 251, 1–12. [Google Scholar] [CrossRef] [PubMed]
- Kurki, P.; Vanderlaan, M.; Dolbeare, F.; Gray, J.; Tan, E.M. Expression of Proliferating Cell Nuclear Antigen (PCNA)/Cyclin during the Cell Cycle. Exp. Cell Res. 1986, 166, 209–219. [Google Scholar] [CrossRef] [PubMed]
- Somanathan, S.; Suchyna, T.M.; Siegel, A.J.; Berezney, R. Targeting of PCNA to Sites of DNA Replication in the Mammalian Cell Nucleus. J. Cell. Biochem. 2001, 81, 56–67. [Google Scholar] [CrossRef]
- Essers, J.; Theil, A.F.; Baldeyron, C.; van Cappellen, W.A.; Houtsmuller, A.B.; Kanaar, R.; Vermeulen, W. Nuclear Dynamics of PCNA in DNA Replication and Repair. Mol Cell Biol 2005, 25, 9350–9359. [Google Scholar] [CrossRef]
- Alber, A.B.; Suter, D.M. Dynamics of Protein Synthesis and Degradation through the Cell Cycle. Cell Cycle 2019, 18, 784–794. [Google Scholar] [CrossRef]
- Sakaue-Sawano, A.; Kurokawa, H.; Morimura, T.; Hanyu, A.; Hama, H.; Osawa, H.; Kashiwagi, S.; Fukami, K.; Miyata, T.; Miyoshi, H.; et al. Visualizing Spatiotemporal Dynamics of Multicellular Cell-Cycle Progression. Cell 2008, 132, 487–498. [Google Scholar] [CrossRef] [PubMed]
- Zerjatke, T.; Gak, I.A.; Kirova, D.; Fuhrmann, M.; Daniel, K.; Gonciarz, M.; Müller, D.; Glauche, I.; Mansfeld, J. Quantitative Cell Cycle Analysis Based on an Endogenous All-in-One Reporter for Cell Tracking and Classification. Cell Rep. 2017, 19, 1953–1966. [Google Scholar] [CrossRef] [PubMed]
- Kanopoulos, N.; Vasanthavada, N.; Baker, R.L. Design of an Image Edge Detection Filter Using the Sobel Operator. IEEE J. Solid-State Circuits 1988, 23, 358–367. [Google Scholar] [CrossRef]
- Poser, I.; Sarov, M.; Hutchins, J.R.; Heriche, J.K.; Toyoda, Y.; Pozniakovsky, A.; Weigl, D.; Nitzsche, A.; Hegemann, B.; Bird, A.W.; et al. BAC TransgeneOmics: A High-Throughput Method for Exploration of Protein Function in Mammals. Nat Methods 2008, 5, 409–415. [Google Scholar] [CrossRef]
- Hein, M.Y.; Hubner, N.C.; Poser, I.; Cox, J.; Nagaraj, N.; Toyoda, Y.; Gak, I.A.; Weisswange, I.; Mansfeld, J.; Buchholz, F.; et al. A Human Interactome in Three Quantitative Dimensions Organized by Stoichiometries and Abundances. Cell 2015, 163, 712–723. [Google Scholar] [CrossRef] [PubMed]
- Sasaki, K.; Kurose, A.; Ishida, Y. Flow Cytometric Analysis of the Expression of PCNA during the Cell Cycle in Hela Cells and Effects of the Inhibition of DNA Synthesis on It. Cytometry 1993, 14, 876–882. [Google Scholar] [CrossRef]
- Schonenberger, F.; Deutzmann, A.; Ferrando-May, E.; Merhof, D. Discrimination of Cell Cycle Phases in PCNA-Immunolabeled Cells. BMC Bioinform. 2015, 16, 180. [Google Scholar] [CrossRef]
- Hiraga, S.; Ly, T.; Garzón, J.; Hořejší, Z.; Ohkubo, Y.; Endo, A.; Obuse, C.; Boulton, S.J.; Lamond, A.I.; Donaldson, A.D. Human RIF1 and Protein Phosphatase 1 Stimulate DNA Replication Origin Licensing but Suppress Origin Activation. EMBO Rep. 2017, 18, e201641983. [Google Scholar] [CrossRef]
- Foti, R.; Gnan, S.; Cornacchia, D.; Dileep, V.; Bulut-Karslioglu, A.; Diehl, S.; Buness, A.; Klein, F.A.; Huber, W.; Johnstone, E.; et al. Nuclear Architecture Organized by Rif1 Underpins the Replication-Timing Program. Mol. Cell 2016, 61, 260–273. [Google Scholar] [CrossRef]
- Gnan, S.; Flyamer, I.M.; Klein, K.N.; Castelli, E.; Rapp, A.; Maiser, A.; Chen, N.; Weber, P.; Enervald, E.; Cardoso, M.C.; et al. Nuclear Organisation and Replication Timing Are Coupled through RIF1–PP1 Interaction. Nat. Commun. 2021, 12, 1–10. [Google Scholar] [CrossRef]
- Hiraga, S.I.; Alvino, G.M.; Chang, F.J.; Lian, H.Y.; Sridhar, A.; Kubota, T.; Brewer, B.J.; Weinreich, M.; Raghuraman, M.K.; Donaldson, A.D. Rif1 Controls DNA Replication by Directing Protein Phosphatase 1 to Reverse Cdc7- Mediated Phosphorylation of the MCM Complex. Genes Dev. 2014, 28, 372–383. [Google Scholar] [CrossRef] [PubMed]
- Malzl, D.; Peycheva, M.; Rahjouei, A.; Gnan, S.; Klein, K.N.; Nazarova, M.; Schoeberl, U.E.; Gilbert, D.M.; Buonomo, S.C.B.; Di Virgilio, M.; et al. RIF1 Regulates Early Replication Timing in Murine B Cells. Nat. Commun. 2023, 14, 1–18. [Google Scholar] [CrossRef]
- Symeonidou, I.E.; Kotsantis, P.; Roukos, V.; Rapsomaniki, M.A.; Grecco, H.E.; Bastiaens, P.; Taraviras, S.; Lygerou, Z. Multi-Step Loading of Human Minichromosome Maintenance Proteins in Live Human Cells. J. Biol. Chem. 2013, 288, 35852–35867. [Google Scholar] [CrossRef] [PubMed]
- Deegan, T.D.; Mukherjee, P.P.; Fujisawa, R.; Rivera, C.P.; Labib, K. Cmg Helicase Disassembly Is Controlled by Replication Fork Dna, Replisome Components and a Ubiquitin Threshold. Elife 2020, 9, 1–33. [Google Scholar] [CrossRef]
- Sedlackova, H.; Rask, M.-B.; Gupta, R.; Choudhary, C.; Somyajit, K.; Lukas, J. Equilibrium between Nascent and Parental MCM Proteins Protects Replicating Genomes. Nature 2020, 587, 297–302. [Google Scholar] [CrossRef] [PubMed]
- Kara, N.; Hossain, M.; Prasanth, S.G.; Stillman, B. Orc1 Binding to Mitotic Chromosomes Precedes Spatial Patterning during G1 Phase and Assembly of the Origin Recognition Complex in Human Cells. J. Biol. Chem. 2015, 290, 12355–12369. [Google Scholar] [CrossRef] [PubMed]
- DePamphilis, M.L. The “ORC Cycle”: A Novel Pathway for Regulating Eukaryotic DNA Replication. Gene 2003, 310, 1–15. [Google Scholar] [CrossRef] [PubMed]
- Méndez, J.; Stillman, B. Chromatin Association of Human Origin Recognition Complex, Cdc6, and Minichromosome Maintenance Proteins during the Cell Cycle: Assembly of Prereplication Complexes in Late Mitosis. Mol. Cell. Biol. 2000, 20, 8602–8612. [Google Scholar] [CrossRef] [PubMed]
- Kreitz, S.; Ritzi, M.; Baack, M.; Knippers, R. The Human Origin Recognition Complex Protein 1 Dissociates from Chromatin during S Phase in HeLa Cells. J. Biol. Chem. 2001, 276, 6337–6342. [Google Scholar] [CrossRef]
- Kenneth, N.S.; Mudie, S.; Rocha, S. IKK and NF-KappaB-Mediated Regulation of Claspin Impacts on ATR Checkpoint Function. EMBO J. 2010, 29, 2966–2978. [Google Scholar] [CrossRef] [PubMed]
- Peschiaroli, A.; Dorrello, N.V.; Guardavaccaro, D.; Venere, M.; Halazonetis, T.; Sherman, N.E.; Pagano, M. SCFbetaTrCP-Mediated Degradation of Claspin Regulates Recovery from the DNA Replication Checkpoint Response. Mol Cell 2006, 23, 319–329. [Google Scholar] [CrossRef] [PubMed]
- Hsiao, H.-W.; Yang, C.-C.; Masai, H. Roles of Claspin in Regulation of DNA Replication, Replication Stress Responses and Oncogenesis in Human Cells. Genome Instab. Dis. 2021, 2, 263–280. [Google Scholar] [CrossRef]
- Danovski, G.; Dyankova-Danovska, T.; Stamatov, R.; Aleksandrov, R.; Kanev, P.-B.; Stoynov, S. CellTool: An Open-Source Software Combining Bio-Image Analysis and Mathematical Modeling for the Study of DNA Repair Dynamics. Int. J. Mol. Sci. 2023, 24, 16784. [Google Scholar] [CrossRef] [PubMed]
- Schindelin, J.; Arganda-Carreras, I.; Frise, E.; Kaynig, V.; Longair, M.; Pietzsch, T.; Preibisch, S.; Rueden, C.; Saalfeld, S.; Schmid, B.; et al. Fiji: An Open-Source Platform for Biological-Image Analysis. Nat. Methods 2012, 9, 676–682. [Google Scholar] [CrossRef] [PubMed]


Disclaimer/Publisher’s Note: The statements, opinions and data contained in all publications are solely those of the individual author(s) and contributor(s) and not of MDPI and/or the editor(s). MDPI and/or the editor(s) disclaim responsibility for any injury to people or property resulting from any ideas, methods, instructions or products referred to in the content. |
© 2024 by the authors. Licensee MDPI, Basel, Switzerland. This article is an open access article distributed under the terms and conditions of the Creative Commons Attribution (CC BY) license (https://creativecommons.org/licenses/by/4.0/).
Share and Cite
Atemin, A.; Ivanova, A.; Kanev, P.-B.; Uzunova, S.; Nedelcheva-Veleva, M.; Stoynov, S. Dynamics of Replication-Associated Protein Levels through the Cell Cycle. Int. J. Mol. Sci. 2024, 25, 8230. https://doi.org/10.3390/ijms25158230
Atemin A, Ivanova A, Kanev P-B, Uzunova S, Nedelcheva-Veleva M, Stoynov S. Dynamics of Replication-Associated Protein Levels through the Cell Cycle. International Journal of Molecular Sciences. 2024; 25(15):8230. https://doi.org/10.3390/ijms25158230
Chicago/Turabian StyleAtemin, Aleksandar, Aneliya Ivanova, Petar-Bogomil Kanev, Sonya Uzunova, Marina Nedelcheva-Veleva, and Stoyno Stoynov. 2024. "Dynamics of Replication-Associated Protein Levels through the Cell Cycle" International Journal of Molecular Sciences 25, no. 15: 8230. https://doi.org/10.3390/ijms25158230