Article

Relationship between Respiratory Microbiome and Systemic Inflammatory Markers in COPD: A Pilot Study

by
Carme Casadevall
1,2,3,*,
Sara Quero
2,4,
Laura Millares
4,5,
Rosa Faner
2,6,
Borja G. Cosío
2,7,
Germán Peces-Barba
2,8,
Ady Castro-Acosta
9,
Concepción Montón
4,10,
Alexandre Palou
7,
Sergi Pascual-Guardia
1,11,
Alvar Agustí
2,6,
Joaquim Gea
1,2,3,11,
Eduard Monsó
4 and
on behalf of the BIOMEPOC group
1
Hospital del Mar Research Institute (IMIM), Parc de Recerca Biomèdica de Barcelona (PRBB), 08003 Barcelona, Spain
2
Centro de Investigación Biomédica en Red, Área de Enfermedades Respiratorias (CIBERES), Instituto de Salud Carlos III, 28029 Madrid, Spain
3
Department of Medicine and Life Sciences (MELIS), Universitat Pompeu Fabra (UPF), 08003 Barcelona, Spain
4
Airway Inflammation Research Group, Parc Taulí Research and Innovation Institute-I3PT–Parc Taulí Foundation, 08208 Sabadell, Spain
5
Catalan Institute of Oncology–ICO, Hospitalet de Llobregat, 08908 Barcelona, Spain
6
Servei de Pneumologia (Institut Clínic de Respiratori) and Dispositiu Transversal d’Hospitalització a Domicili (Direcció Mèdica i d’Infermeria), Hospital Clínic–Fundació Clínic per la Recerca Biomèdica, Universitat de Barcelona, Institut d’Investigacions Biomèdiques August Pi i Sunyer (IDIBAPS), 08036 Barcelona, Spain
7
Servei de Pneumologia, Hospital Son Espases–Institut d’Investigació Sanitària de Palma (IdISBa), 07120 Palma de Mallorca, Spain
8
Servicio de Neumología, Fundación Jiménez Díaz, Universidad Autónoma de Madrid, 28049 Madrid, Spain
9
Servicio de Neumología, Hospital 12 de Octubre, 28041 Madrid, Spain
10
Servei de Pneumologia, Hospital Universitari Parc Taulí, 08208 Sabadell, Spain
11
Servei de Pneumologia, Hospital del Mar, 08003 Barcelona, Spain
*
Author to whom correspondence should be addressed.
See the Appendix A for members of the group.
Int. J. Mol. Sci. 2024, 25(15), 8467; https://doi.org/10.3390/ijms25158467
Submission received: 12 July 2024 / Revised: 29 July 2024 / Accepted: 1 August 2024 / Published: 2 August 2024

Abstract

:
The respiratory microbiome may influence the development and progression of COPD by modulating local immune and inflammatory events. We aimed to investigate whether relative changes in respiratory bacterial abundance are also associated with systemic inflammation, and explore their relationship with the main clinical COPD phenotypes. Multiplex analysis of inflammatory markers and transcript eosinophil-related markers were analyzed on peripheral blood in a cohort of stable COPD patients (n = 72). Respiratory microbiome composition was analyzed by 16S rRNA microbial sequencing on spontaneous sputum. Spearman correlations were applied to test the relationship between the microbiome composition and systemic inflammation. The concentration of the plasma IL-8 showed an inverted correlation with the relative abundance of 17 bacterial genera in the whole COPD cohort. COPD patients categorized as eosinophilic showed positive relationships with blood eosinophil markers and inversely correlated with the degree of airway obstruction and the number of exacerbations during the previous year. COPD patients categorized as frequent exacerbators were enriched with the bacterial genera Pseudomonas which, in turn, was positively associated with the severity of airflow limitation and the prior year’s exacerbation history. The associative relationships of the sputum microbiome with the severity of the disease emphasize the relevance of the interaction between the respiratory microbiota and systemic inflammation.

1. Introduction

Chronic obstructive pulmonary disease (COPD), a syndrome characterized by airflow obstruction and chronic inflammation, is considered to be a heterogeneous condition encompassing various phenotypes and endotypes [1]. Widely accepted COPD clinical phenotypes include chronic bronchitis, emphysema, asthma-COPD overlap (ACO), and frequent exacerbators [2]; α-1 antitrypsin deficiency and eosinophilic COPD are among the best-described endotypes [3]. This wide variety of conditions is influenced by both the genotype and environmental factors, which contribute to the complex and diverse pathophysiological mechanisms underlying COPD.
Bacteria are thought to play an important role in COPD pathogenesis, and increasing evidence has shed some light on the understanding of the complex microbial communities present in the lung [4]. The microbiome of the respiratory tract of COPD patients differs from that of healthy subjects [5]. In addition, recent data have shown that the airway microbiome is associated with different COPD inflammatory phenotypes, having the potential to influence the pathogenetic processes underlying chronic inflammation [6,7,8,9,10]. Moreover, perturbations to the airway microbiota have been previously associated with disease severity [11,12], frequency of exacerbations [6,11,13], and medication status [14], and therefore may be used to establish prognosis [15]. However, despite some recent advances regarding associations between the respiratory microbiome and airway inflammatory events occurring in COPD [16], the link between the former and chronic systemic inflammation remains incompletely understood.
In this context, the present study addresses this relationship in two of the most widely accepted phenotypes and treatable traits in COPD, patients with peripheral eosinophilia and those considered as frequent exacerbators. We sought to (1) explore the circulating levels of pro-inflammatory markers and selected eosinophilic-related gene transcripts in stable COPD patients with different clinical and biological conditions and (2), examine their association with the relative abundance of respiratory bacterial genera observed in their spontaneous sputum.

2. Results

2.1. Demographic and Clinical Features of Participants

Seventy-two stable COPD patients, including 64 males and 8 females, were finally recruited. The average age at inclusion was 67.9 years and all degrees of disease severity were covered. The main demographic and clinical characteristics of these patients are summarized in Table 1.
To explore the potential relationship between microbiome composition and circulating inflammatory marker levels with different clinical conditions, COPD patients were divided into the previously mentioned subgroups, resulting in 52 IE and 20 FE, as well as 57 Non-EOS and 15 EOS. No significant differences in age and BMI were detected between the different subgroup pairs. However, and as presumably expected, FE patients showed a significant impairment in their lung function compared to IE (Table 1), as reflected in their GOLD stages. The severity classification also displayed some differences between Non-EOS and EOS patients, with a higher percentage of GOLD 4 in the former.

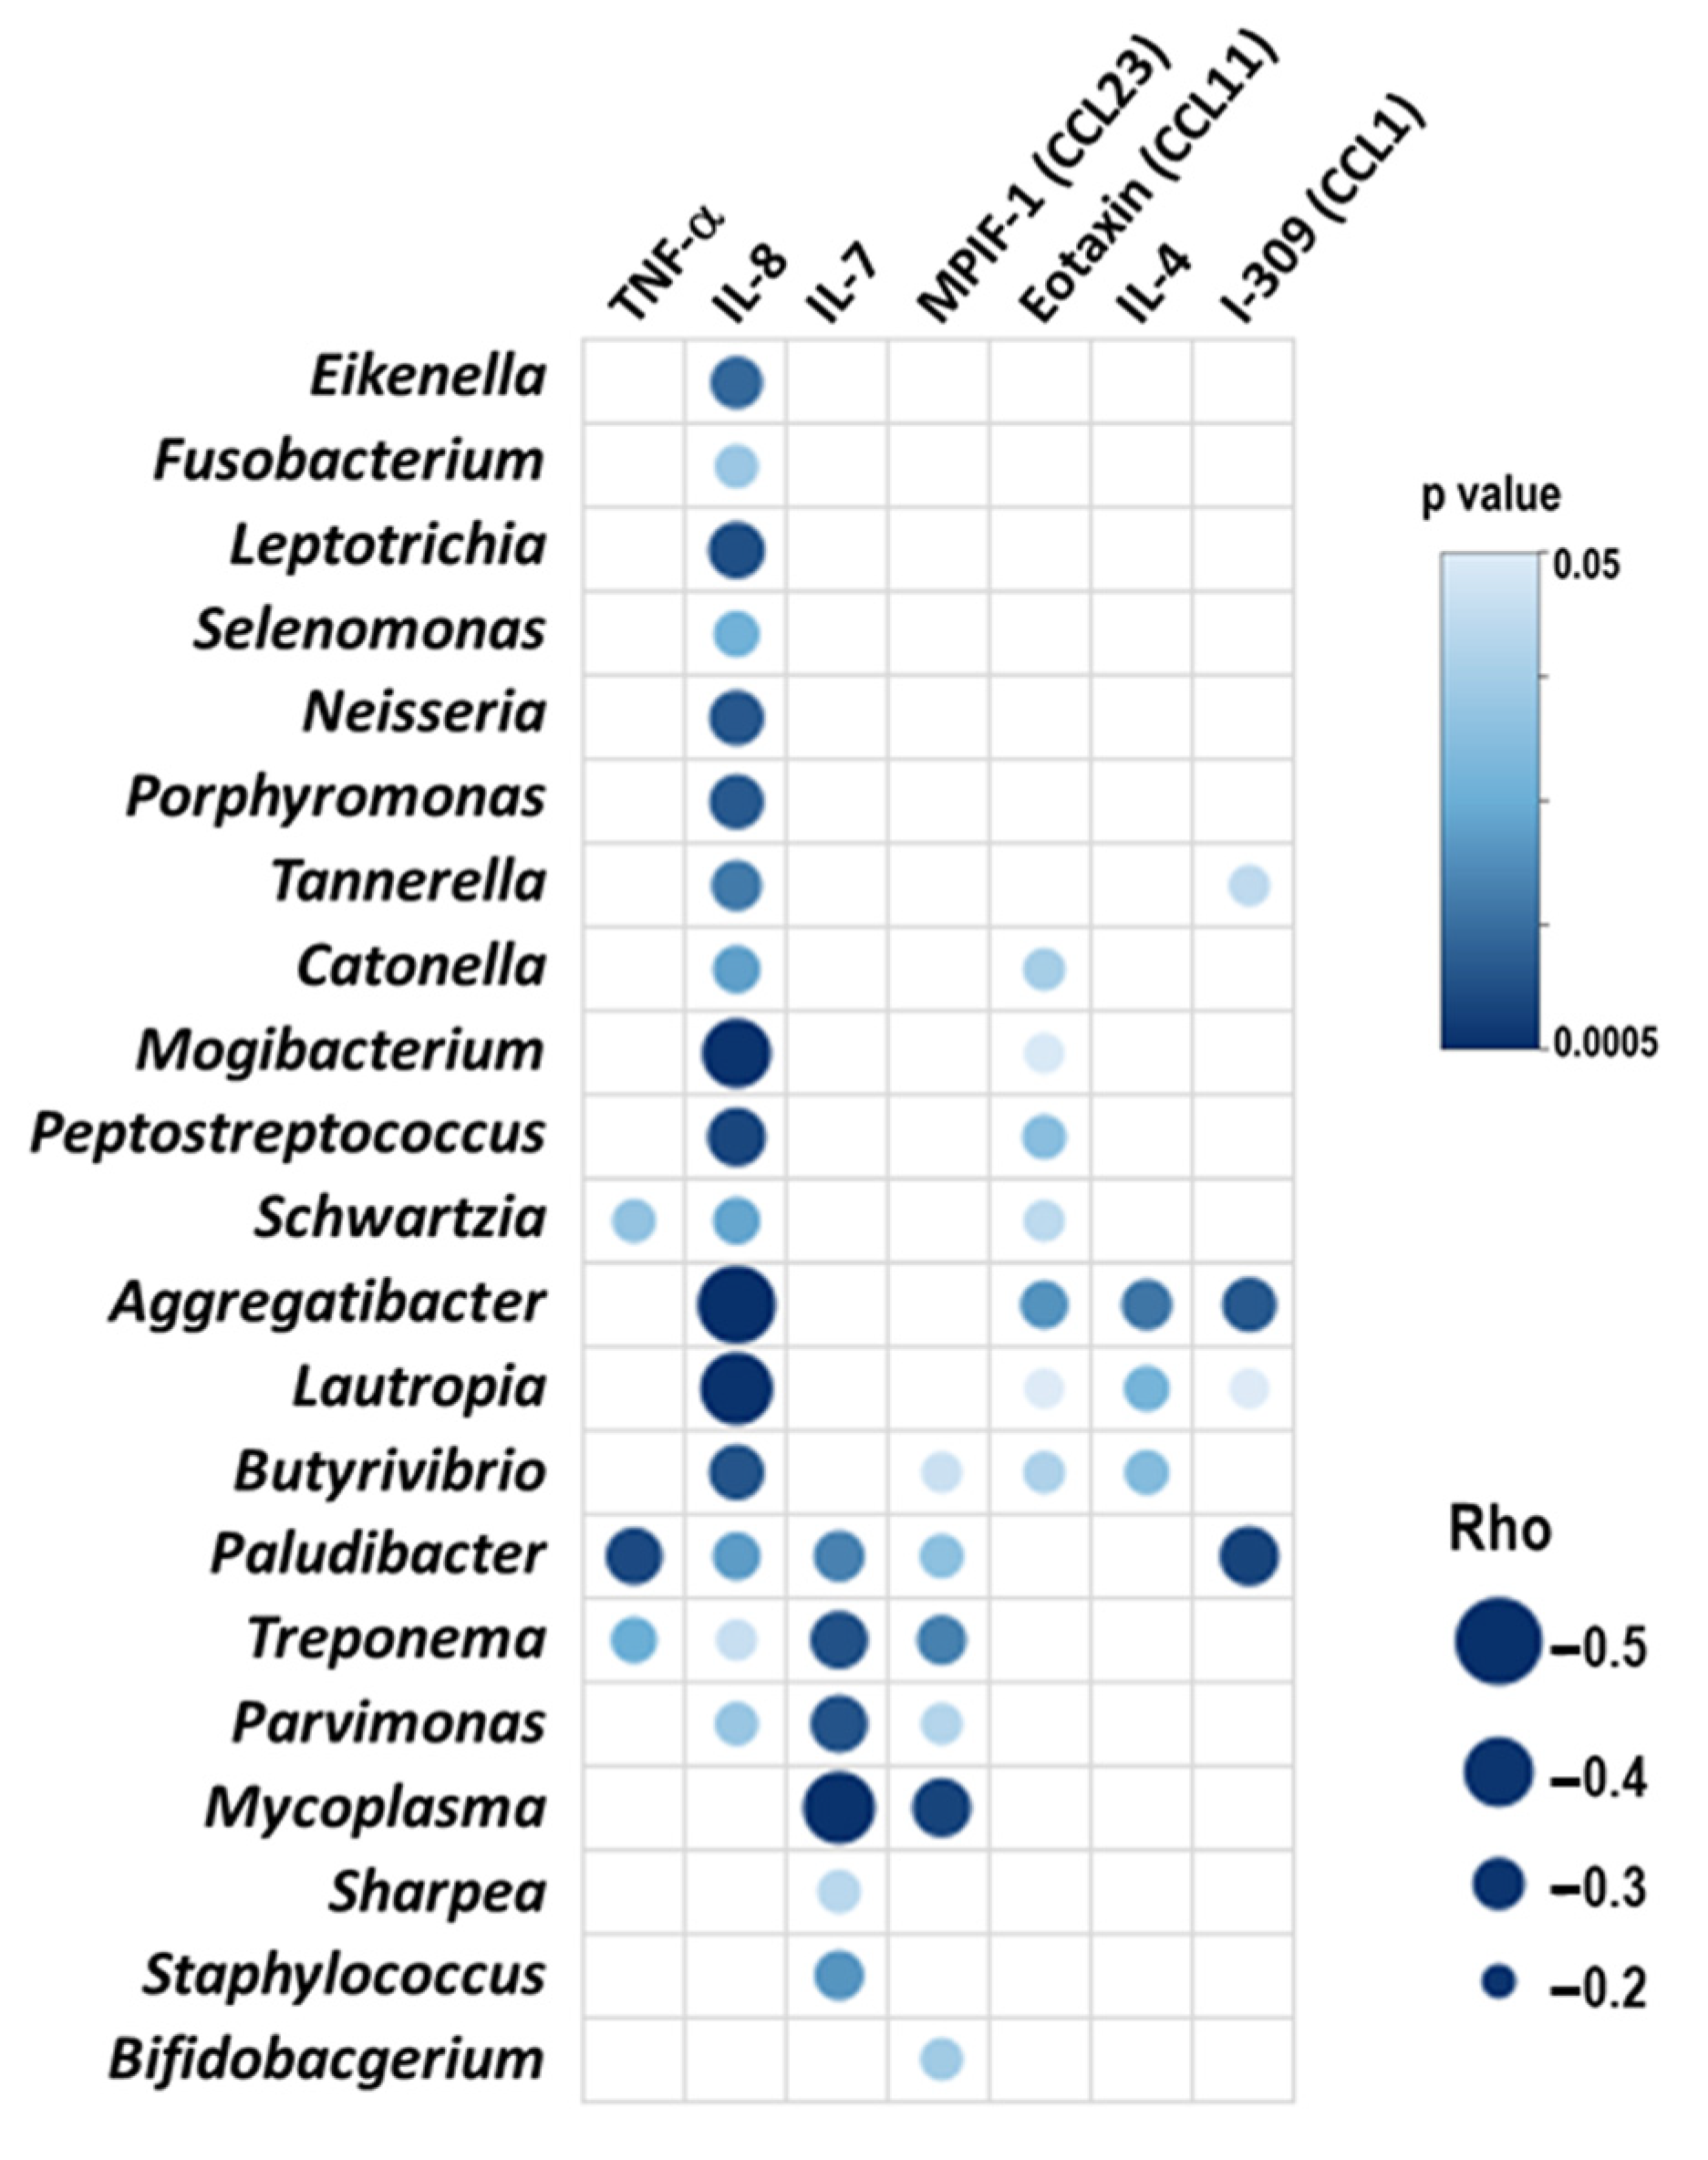
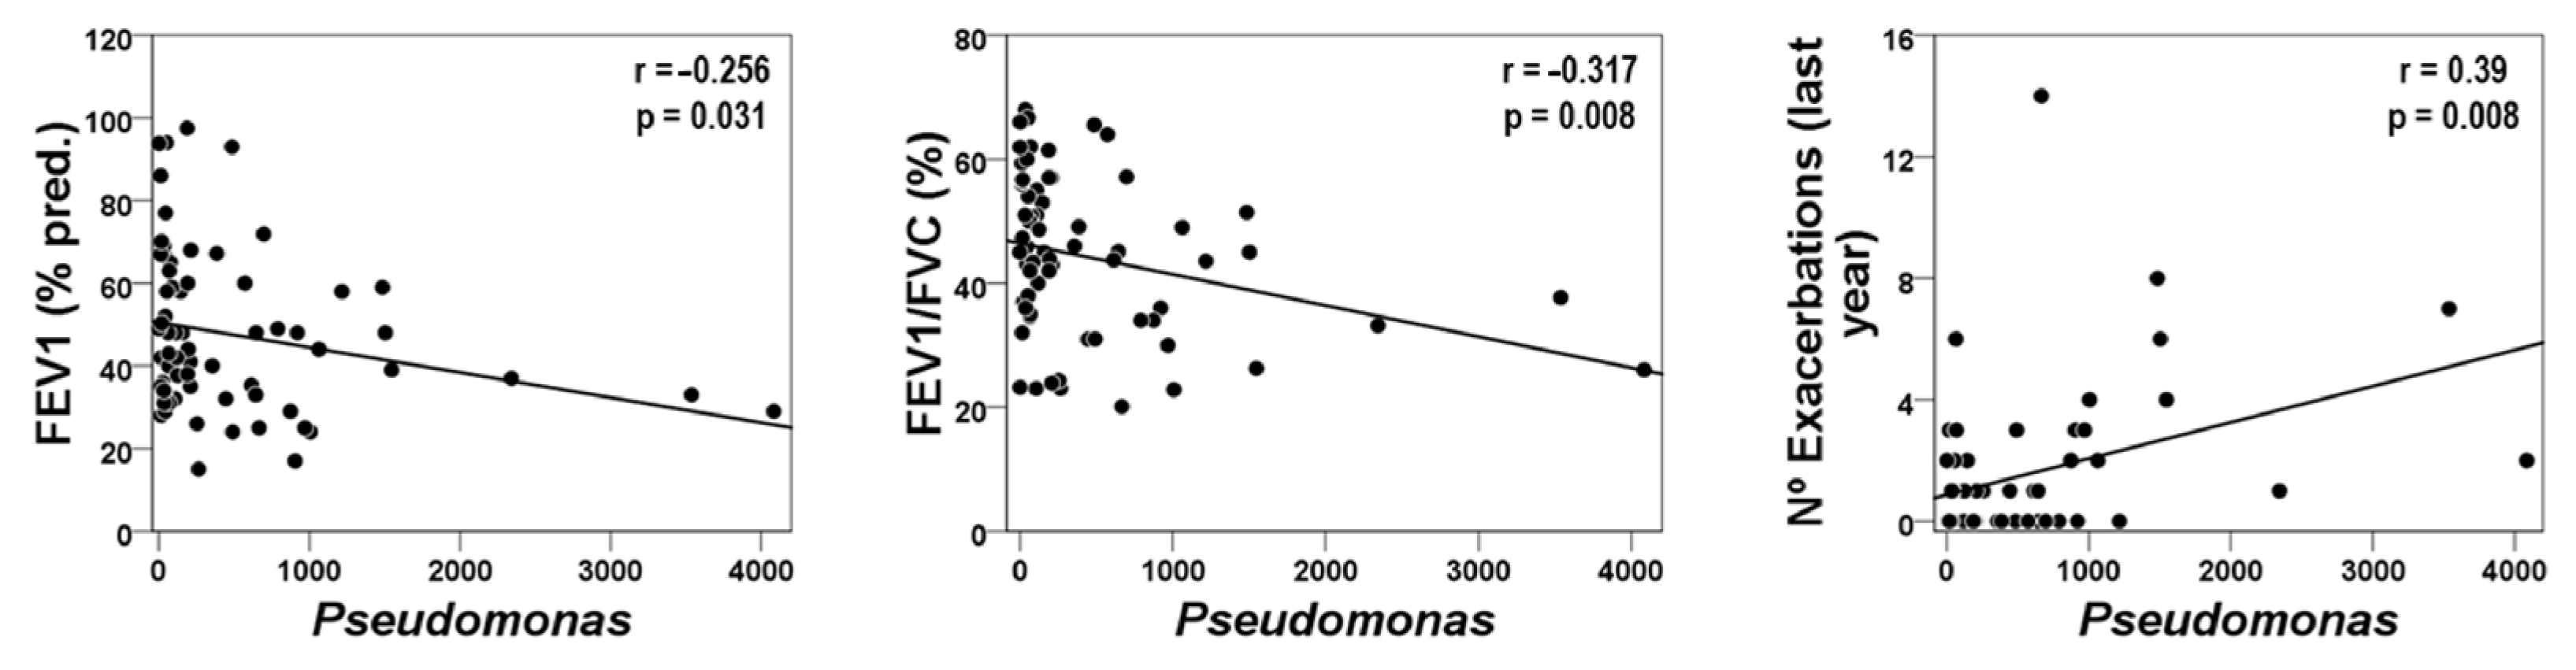
2.2. All Patients: Blood Inflammatory Mediators and Microbiome Interactions

To investigate how the respiratory microbiome was related to systemic inflammation, an ‘all-against-all’ correlation analysis between the relative abundance of bacterial genera and a panel of 58 selected blood inflammatory mediators was employed. The most remarkable finding was the negative association exhibited by IL-8 with 17 bacterial genera (Figure 1). Notably, the relative abundance of four of the bacterial genera (Aggregatibacter, Butyrivibrio, Treponema, and Parvimonas) associated with the levels of this cytokine appears also to be positively but mildly related to lung function and inversely to the number of exacerbations during the previous year, and both expressing better lung health (Table 2). Other inflammatory mediators showed mixed relationships with bacterial genera (Figure 1).

2.3. Blood Inflammatory Mediators and Host–Microbiome Interactions in the FE Phenotype

Relative abundances of microbial genera were also analyzed according to exacerbation phenotypes. FE patients presented a significant reduction in Haemophilus, whereas Pseudomonas were more abundant in this group (Figure 2), also showing an inverse relationship between these two microorganisms (Rho = 0.292, p < 0.05). None of these potentially pathogenic genera, however, showed any significant associations with the circulating inflammatory mediators nor with any of the eosinophilic-related gene transcripts. Nonetheless, it is worth noting that the acute phase protein CRP showed a clear tendency to be higher in FE patients as compared to IE (9.76 ± 11.6 vs. 9.42 ± 25.58 μg/mL, respectively, p = 0.058). Interestingly, the relative abundance of Pseudomonas was negatively correlated with some lung function variables (i.e., FEV1 and FEV1/FVC) and was positively associated with the number of exacerbations during the previous year (Figure 3).

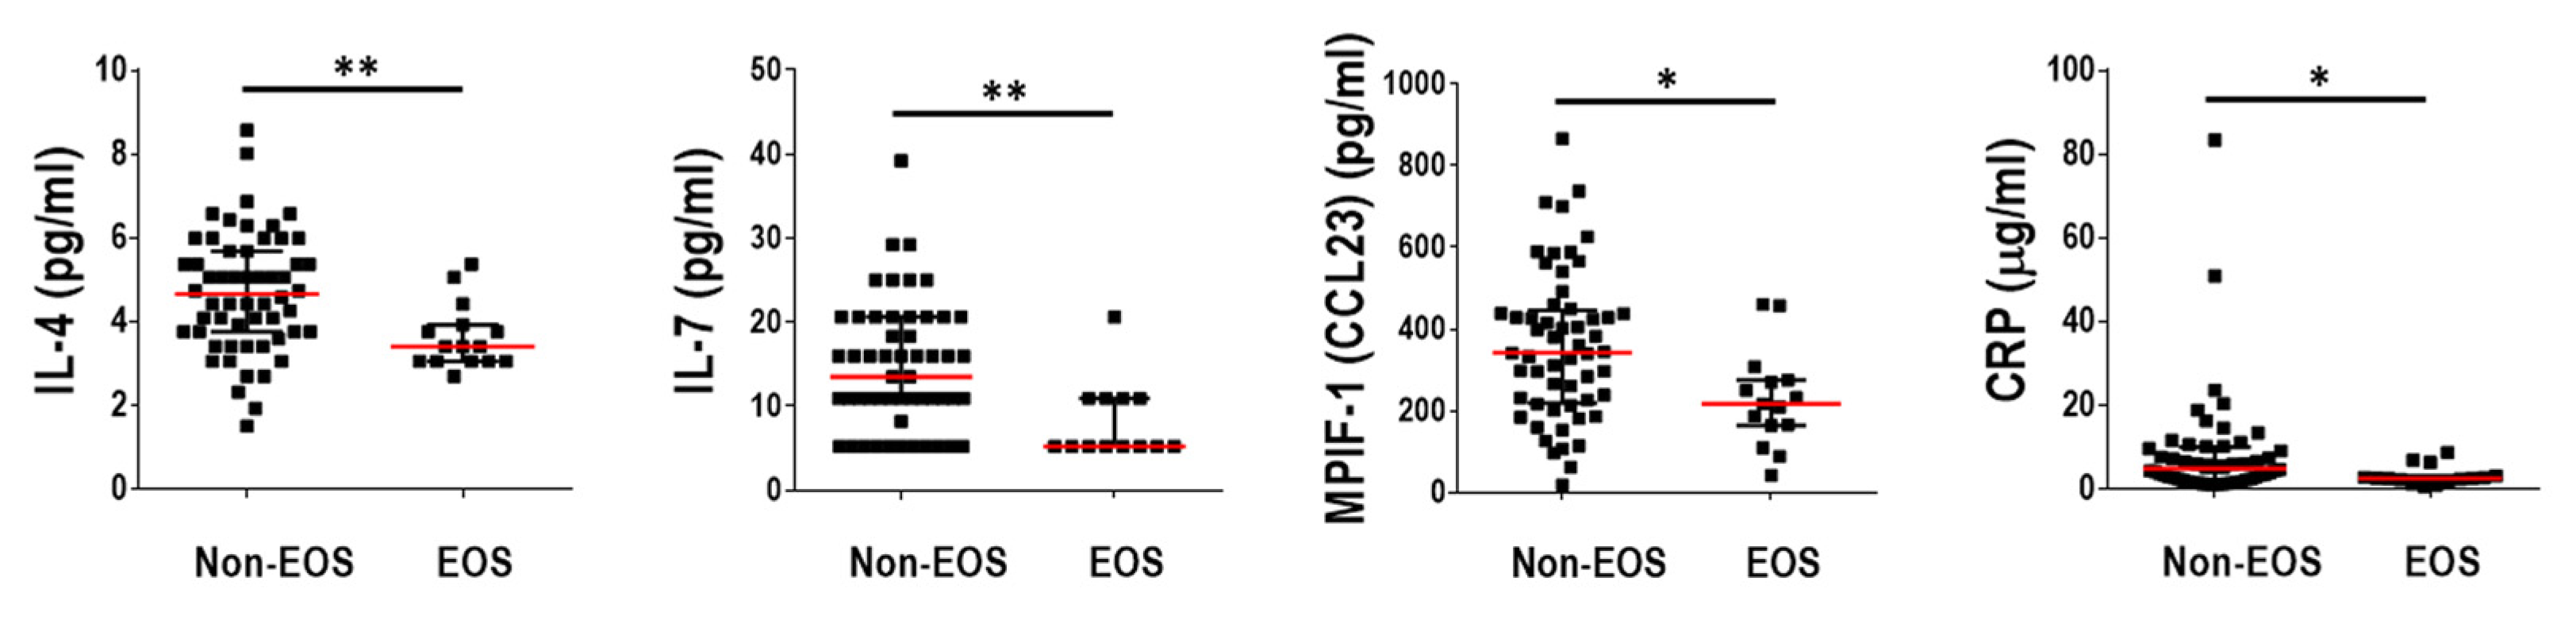
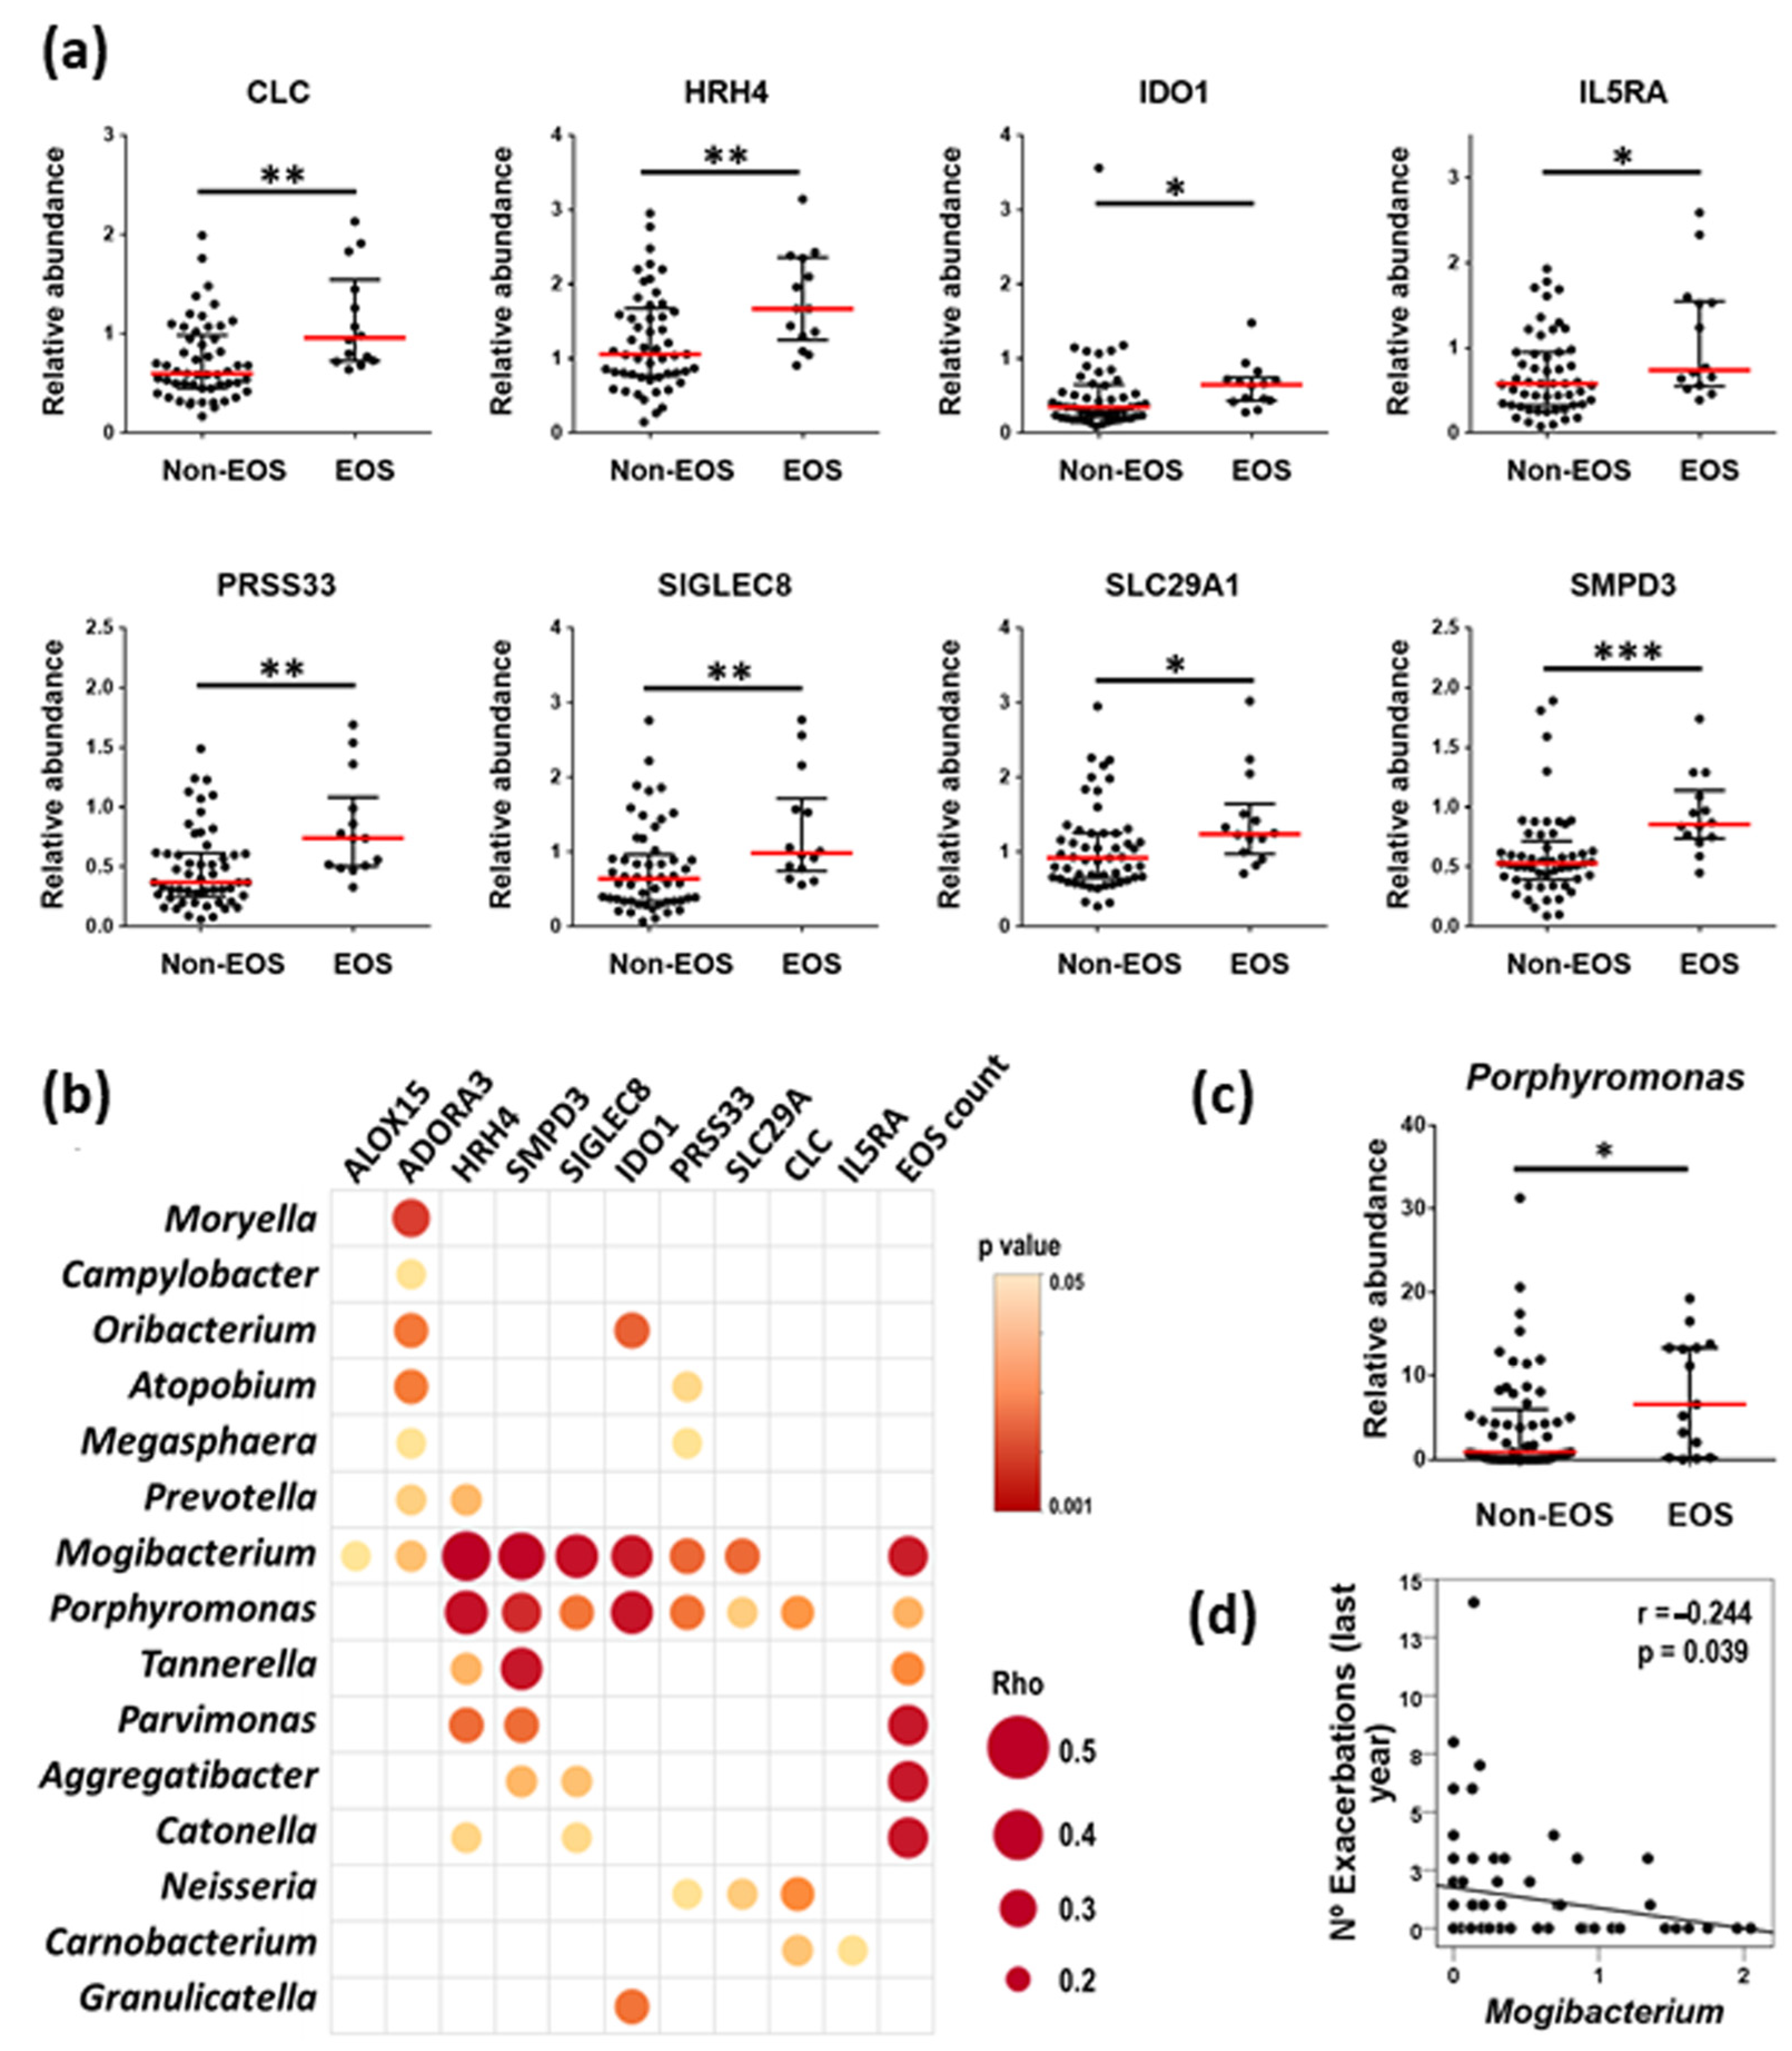
2.4. Blood Inflammatory Mediators and Host–Microbiome Interactions in the EOS Pheno/Endotype

Even though most of the measured blood inflammatory markers did not discriminate EOS from Non-EOS patients, four of them showed significantly lower levels in the former: CRP, IL-4, IL-7, and MPIF-1 (Figure 4). Blood eosinophil counts and the expression levels of 10 eosinophil-related genes [17] were used in turn to analyze the association of eosinophilic inflammation with the respiratory microbiome composition. Expression levels of most of the selected eosinophil marker genes were significantly higher in EOS than in Non-EOS patients (Figure 5a) and showed strong positive correlations with blood eosinophil counts (Table 3). Both, eosinophil counts and most eosinophil-related gene transcripts analyzed showed positive correlations with the relative abundance of several bacterial genera, with particular note for Porphyromonas and Mogibacterium (Figure 5b). Moreover, the relative abundance of Porphyromonas was significantly higher in this subgroup of COPD patients (Figure 5c). Mogibacterium, on the other hand, showed an inverse association with the prior year’s exacerbation history (Figure 5d).

3. Discussion

The main findings of the present study are the direct relationships observed between the respiratory microbiome with the systemic inflammatory pattern and the clinical severity of the disease. Indeed, on the one hand, the relative abundance of several bacterial genera correlated with the plasma level of several proinflammatory markers, with special note for IL-8. On the other, the categorization of patients based on exacerbation frequency showed a predominance of Pseudomonas in the sputum of FE. Moreover, the relative abundance of this microorganism was positively associated with a decline in lung function and the number of exacerbations over the previous year. Finally, when patients were categorized by the blood eosinophilic inflammatory pattern, several bacterial genera, mainly Porhyromonas and Mogibacterium, showed broad associations with eosinophilic markers. Importantly, part of those bacterial genera associated with either circulating IL-8 levels or some eosinophilic markers also showed a positive association with lung function and a negative one with previous exacerbations (i.e., with a more preserved clinical status).

3.1. Microbiome and Inflammation in COPD

IL-8 has previously been identified as an inflammatory biomarker related to systemic inflammation in COPD patients [18], and although their levels are higher at COPD stability compared with controls, the magnitude of the IL-8 increase was even more remarkable during acute exacerbations, mainly in those patients with the FE phenotype [19,20]. The results of the current study showed an inverse association between IL-8 levels and the relative abundance of several bacterial genera in the sputum of stable COPD patients. Furthermore, a subgroup of these genera (including Aggregatibacter, Butyrivibrio, Parvimonas, and Treponema) also showed a positive correlation with lung function parameters and a negative correlation with the number of exacerbations during the previous year, which together can be considered as an expression of a better lung health status. Altogether, these results may suggest that the relative abundance of these bacterial genera at stability may play a protective role against disease impairment through the modulation of the systemic inflammatory status. An alternative explanation would be that lower circulating levels of IL-8 may favor a shift in the microbial composition present in the respiratory system, favoring the proliferation of a relatively beneficial microbiota that may contribute to attenuating lung disease progression. However, although the present results highlight multiple associations between the respiratory microbiome and the profile of the immune response, they do not allow us to establish causality.

3.2. The FE Phenotype

COPD is characterized by a progressive impairment of lung function in most patients, a deterioration that becomes worsened by repeated episodes of acute exacerbations [21]. Moreover, the FE phenotype has been associated with an even more rapid disease progression and higher rates of hospitalization and mortality [21]. Exacerbations, typically caused by respiratory tract infections [21], are accompanied by increased airway and systemic inflammation [21], as well as changes in the respiratory microbiome [6,7]. Variability in microbiome composition, however, has also been described as clinical stability and may probably differ across different COPD phenotypes [6,11,12,13,22]. In the present investigation, the association of bacterial microbiota with blood inflammatory markers was analyzed in FE and IE patients during clinical stability. In this regard, the former group showed a significantly higher relative abundance of Pseudomonas but lower abundance of Haemophilus as compared to the latter. Furthermore, a significant inverse relationship was seen between these two potentially pathogenic microorganisms, suggesting a competitive behavior between them. The Pseudomonas level, in addition, was directly related to a more severe disease since it was associated with the impairment of lung function and a higher number of previous exacerbations. Several microbe studies have shown that Haemophilus and Pseudomonas play a significant role in the pathogenesis and progression of COPD [23], and weaker evidence suggests that Haemophilus may also be associated with more severe airway inflammation [24]. The present results, however, support an anti-inflammatory protecting role for the Haemophilus genus, although additional research will be needed to corroborate this observation.
In line with the present findings, a longitudinal study carried out by Jacobs and cols. Ref. [25] identified negative associations between Pseudomonas and Haemophilus either at stability or during exacerbations in COPD patients. Moreover, interspecific competition between Haemophilus and Pseudomonas has also been described in chronic bacterial lung infections present in non-cystic fibrosis bronchiectasis. Moreover, patients with a predominance of Pseudomonas infections showed an accelerated decline in their lung function and more frequent respiratory exacerbations [26].

3.3. The EOS Phenotype/Endotype

Recent studies have revealed that COPD patients with higher eosinophilic airway inflammation show a distinct structure of bacterial microbiota as compared with either those patients with lower levels of this inflammatory profile or healthy controls [9,11,27]. Moreover, microbiome diversity has been associated with low eosinophil count in peripheral blood [9], and although evidence on the relationship between bronchial and systemic eosinophilia remains controversial, a mounting body of evidence has demonstrated a positive correlation between blood and sputum eosinophil counts [28,29,30]. Subsequently, blood eosinophil counts have emerged as a simple, sensitive, and easily obtained biomarker that can be used in clinical practice. In this study, we sought to explore the associations of respiratory bacterial microbiota with blood eosinophilic inflammation. For this purpose, eosinophilic patients were categorized based on blood percentages of eosinophils and neutrophils. In addition to blood eosinophil proportion, a group of eosinophil-related gene transcripts was used as eosinophilic markers [17]. On the other hand, patients with a low percentage of blood neutrophils were used to reduce biases due to the inflammatory influence of these cells (as it has been previously used to categorize airway inflammatory patterns) [31].
Upregulation of eosinophilic-related gene transcripts in EOS patients and their high correlation with blood eosinophil counts render these genes as reliable surrogate markers to assess differences between EOS and Non-EOS COPD patients. The present study shows multiple positive interactions between eosinophil-related markers and some bacterial genera (with special note for Porphyromonas and Mogibacterium), suggesting an interplay of airway bacterial microbiota with systemic eosinophilic inflammation. Moreover, the relative abundance of Mogibacterium was inversely related to the number of exacerbations over the previous year. These findings partially differ from most published research, which shows a greater risk of exacerbation in patients with high blood eosinophil levels [32,33,34]. However, a deep analysis of two well-phenotyped COPD cohorts (COPDGene and ECLIPSE), revealed that the association of an increased exacerbation risk associated with elevated eosinophil counts was driven by the history of frequent exacerbations [17]. Moreover, a recent report by Miravitlles et al. [35] does not support the use of blood eosinophil count as a reliable marker of the risk of exacerbation in stable COPD patients. These authors reported that patients with the lowest blood eosinophil levels presented the highest frequency of acute episodes during the previous year. Some of these discrepancies may be due to variability in oscillations in eosinophil counts over time and the relative lack of an optimal cut-off for it (either absolute or percentage), which do not allow a reliable and uniform stratification of patients. Larger studies with extended follow-up periods will be needed to provide more insight into this topic.
As for the rest of the biomarkers studied, we found no significant differences between groups except for a reduction in four inflammatory factors, including the acute phase protein CRP, in EOS patients. Lower CRP levels in patients with high eosinophil counts have also been described by previous work [36]. Elevated CRP levels, on the other hand, have been associated with the severity of airway obstruction [37], an elevated risk of having exacerbations [38], a poor short-term outcome in patients admitted for these acute episodes [39], and higher mortality [40].
The present study has several potential limitations. First of all, its cross-sectional nature does not allow us to make causal inferences about the impact of the microbiome on systemic inflammation and clinical outcomes. Another limitation is that we only analyzed the respiratory microbiome of stable COPD patients, and therefore, we could not extend it to the analysis of the potential associations between respiratory microbiota and biological markers in healthy individuals. Additionally, stratification by clinical phenotypes implies a substantial reduction in the number of patients per group limiting the statistical power of the analyses and the conclusiveness of the results. Moreover, the predominance of male subjects in our cohort may introduce some bias due to sex physiological differences. Finally, some of the bacterial genera were barely detected in a significant number of patients, so we were unable to assess their association with inflammation and clinical outcomes in the present cohort.
In conclusion, the present investigation shows that some changes in the bacterial composition of the pulmonary microbiota relate to the systemic inflammatory response and are associated with clinical outcomes. These relationships may be complex and bidirectional. Thus, further studies involving larger cohorts of patients, longitudinal designs, and control for potential confounding factors are necessary to examine the interplay between microbiota and systemic inflammation in more depth.

4. Materials and Methods

4.1. Study Design and Population

This investigation is embedded within the BIOMEPOC project, a prospective controlled multicenter study whose details have been published elsewhere [11,41]. For the current study, stable COPD patients were sequentially recruited from five teaching hospitals, and ethics approval was granted locally at each site by Institutional ethics committees. The investigation was conducted in accordance with the Declaration of Helsinki and informed written consent was obtained from all patients. They were subsequently subdivided by their history of exacerbations [Infrequent exacerbators (IE) vs. Frequent exacerbators (FE)] and by their distinct inflammatory profiles [Non-Eosinophilic (Non-EOS) vs. Eosinophilic (EOS)]. The FE condition was defined as the presence of ≥2 exacerbations over the year preceding the patient’s recruitment [42]. EOS patients were defined as those presenting ≥3% blood eosinophils with <60% circulating neutrophils. This stratification was adapted from previous classifications based on the pattern of airway inflammation in sputum samples [31].

4.2. Samples Processing

Samples from each participant included spontaneous sputum, plasma, and whole blood. Spontaneous sputum was collected and processed within 60 min on the day of the visit. Subsequently, sputum quality was assessed as previously described [11] and samples were frozen until processing. Blood samples in turn were collected by venipuncture and placed into K3-EDTA tubes for plasma obtention and in Tempus tubes (Thermo Fisher Scientific, Waltham, MA, USA) for RNA isolation. K3-EDTA tubes were centrifuged at 1500× g for 15 min at 4 °C, and plasma supernatants were stored at −80 °C until further analyses. Total RNA was purified using the Tempus™ Spin RNA Isolation Kit following the provider’s recommendations (Thermo Fisher Scientific).

4.3. 16S rRNA Gene Sequencing Analysis

16S rRNA gene was amplified following the 16S Metagenomic Sequencing Library Preparation Illumina protocol (Part # 15044223 Rev. A, Illumina, CA, USA). The Quantitative Insights Into Microbial Ecology (QIIME) pipeline 1.9.0 was used for sequence processing to obtain taxonomic information. Detailed procedures of DNA extraction, PCR, and library preparation as well as analysis of the microbiome profile of the present cohort have been previously published by our group [11].

4.4. Measurement of Systemic Inflammatory Mediators

Inflammatory protein profiles were measured in plasma using three magnetic bead-based multiplex immunoassays, namely, Bio-Plex Pro Human Chemokine Panel (40-Plex #171AK99MR2), Bio-Plex Pro Human Cytokine Panel (27-Plex #M500KCAF0Y) and Bio-Plex Pro Human Acute Phase Panel (4-Plex #171A4C09M) following the manufacturer’s specifications (Bio-Rad, Hercules, CA, USA). Briefly, magnetic beads coated with specific antibodies were incubated with the samples for 30 min. After this incubation, the beads were washed using a magnetic plate washer (Bio-Plex Pro Wash Station, Bio-Rad), and then reincubated with biotinylated detection antibodies for 60 min. Then, the beads were washed and incubated with streptavidin-PE for 10 more minutes. The beads were then washed, resuspended in the assay buffer, and run on the BioPlex-200 instrument (Bio-Rad) to measure the analytes. All samples were performed in only one setting. It is worth noting that due to some redundancy between the kits, only 58 immune-soluble constituents were analyzed for each sample. The list of names, acronyms, and official gene symbols for all factors measured are described in Table S1.

4.5. RT-qPCR Assays

First-strand cDNA was generated using oligo (dT)12-18 and Superscript III reverse transcriptase as per the manufacturer’s protocol (Thermo Fisher Scientific). Quantitative PCR of selected genes was carried out using TaqMan Gene Expression Assays products (Table S2) in an ABI PRISM 7900 HT Sequence Detection System (Applied Biosystems, Waltham, MA, USA). Standard TaqMan cycling conditions were used, and all reactions were performed in triplicate. Gene expression levels were normalized to the housekeeping genes GAPDH (Glyceraldehyde-3-phosphate dehydrogenase) and ACTB (Beta-actin), and the relative gene expression analysis was done using the comparative method (Delta-Delta C(T)) [43] by ExpressionSuite Software v1.3.

4.6. Statistical Analyses

Descriptive statistics: Continuous variables are expressed as mean and standard deviations (SD) values if normally distributed or as medians and interquartile ranges if not normally distributed. Categorical variables are presented as frequencies and percentages. Comparisons between study groups were done using independent samples T-tests or Mann–Whitney U tests for normally and not normally distributed variables, respectively. Spearman Rank correlation coefficients were computed to assess associations between the relative abundance of bacterial genera with the plasma concentration of inflammatory and eosinophilic markers, as well as with the clinical variables. Statistical tests used in the study were two-sided, and a p value of ≤0.05 was considered as statistically significant. Statistical analyses were performed using the SPSS statistical software package version 23 (SPSS Inc., Chicago, IL, USA), and GraphPad Prism6 (Dotmatics, Boston, MA, USA) and Cytoscape software (version 3.8.0, Seattle, WA, USA) were used for chart production.

Supplementary Materials

The following supporting information can be downloaded at: https://www.mdpi.com/article/10.3390/ijms25158467/s1.

Author Contributions

Conceptualization, E.M. and J.G.; methodology, C.C., S.Q. and L.M.; formal analysis, C.C.; resources, J.G. and E.M.; data curation, S.P.-G., C.C., S.Q. and L.M.; Management of the patients, R.F., B.G.C., G.P.-B., A.C.-A., C.M., A.P., S.P.-G., A.A. and BIOMEPOC group; writing—original draft preparation, C.C.; writing—review and editing, E.M. and J.G.; supervision, E.M. and J.G.; funding acquisition, E.M. and J.G. All authors have read and agreed to the published version of the manuscript.

Funding

This research was funded by Centro de Investigación Biomédica en Red, Área de Enfermedades Respiratorias (CIBERES), ref. CB06/06/0043 and CB06/06/1097; Fondo de Investigación Sanitaria, Instituto de Salud Carlos III, co-funded by the European Union, grant number PI18/00934 and PI21/00785; Spanish Ministry of Economy and Competitivity, co-funded by the European Union, grant number SAF2014-54371; Agència de Gestió d’Ajuts Universitaris i de Recerca (AGAUR) ref: 2017SGR442 and 2021SGR-00100; Sociedad Española de Neumología y Cirugía Torácica (SEPAR), grant number 2015 and 2019; Societat Catalana de Pneumologia (SOCAP) grant number 2020 Research Grant. The funders had no role in the design, data collection, data analysis, and reporting of this study.

Institutional Review Board Statement

The study was conducted in accordance with the Declaration of Helsinki, and approved by the Ethics Committee of Parc de Salut Mar (protocol code 2014/5895/I, 22 December 2014).

Informed Consent Statement

Informed consent was obtained from all subjects involved in the study.

Data Availability Statement

The raw data supporting the conclusions of this article will be made available by the authors on request.

Acknowledgments

The authors thank all participating patients for their willingness to contribute to medical research and the overall team of investigators, research nurses, and staff involved in the BIOMEPOC study for their daily work, and Jonathan McFarland for his editing support. Some of the patients evaluated in the present study have been already included in previous publications.

Conflicts of Interest

The authors declare no conflicts of interest.

Appendix A

Members of the BIOMEPOC group (alphabetical order): Mireia Admetlló 1,2, Alvar Agustí 2,3, Carlos Alvarez-Martínez 4, Esther Barreiro 1,2, Oswaldo Antonio Caguana 1, Carme Casadevall 1,2, Ferran Casals 5, Robert Castelo 5, Ady Castro-Acosta 4, Rocío Córdova 6, Borja G Cosío 2,6, Rosa Faner 2,3, Laura I Furlong 5,7, Marian García 8, José G. González-García 1, Carmen Hernández-Carcereny 2,3, José Luis López-Campos 2,9, Eduardo Márquez 2,9, Eduard Monsó 8, Concepción Montón 8, Miren Josune Ormaza 8, Alexandre Palou 6, Sergi Pascual 1, Germán Peces-Barba 2,10, Pau Puigdevall 5, Diego A. Rodríguez-Chiaradia 1,2, Ferran Sanz 5,7, Luis Seijó 11, Montserrat Torà 5,12, Yolanda Torralba 3, Carles Vilaplana 13.
1. 
Hospital del Mar Research Institute. Respiratory Medicine Department, Hospital del Mar. MELIS Dept., Universitat Pompeu Fabra (UPF). BRN. Barcelona. Spain.
2. 
Centro de Investigación Biomédica en Red, Área de Enfermedades Respiratorias (CIBERES), Instituto de Salud Carlos III. Madrid. Spain.
3. 
Servei de Pneumologia (Institut Clínic de Respiratori), Hospital Clínic-Fundació Clínic per la Recerca Biomèdica, Universitat de Barcelona. Barcelona. Spain.
4. 
Servicio de Neumología, Hospital 12 de Octubre. Madrid. Spain.
5. 
Dept. MELIS, Universitat Pompeu Fabra. Barcelona. Spain.
6. 
Servicio de Neumología, Hospital Son Espases-Instituto de Investigación Sanitaria de Palma (IdISBa), Universitat de les Illes Balears. Palma de Mallorca. Spain.
7. 
Hospital del Mar Research Institute. Barcelona. Spain.
8. 
Servicio de Neumología, Consorci Sanitari Parc Taulí, Universitat Autònoma de Barcelona. Sabadell. Spain.
9. 
Unidad Médico-Quirúrgica de Enfermedades Respiratorias, Hospital Universitario Virgen del Rocío, Universidad de Sevilla. Sevilla. Spain.
10. 
Servicio de Neumología, Fundación Jiménez Díaz, Universidad Autónoma de Madrid. Madrid. Spain
11. 
Servicio de Neumología, Fundación Jiménez Díaz, Universidad Autónoma de Madrid. Clínica Universidad de Navarra. Madrid. Spain.
12. 
Universitat Autònoma de Barcelona. Barcelona. Spain.
13. 
Laboratori de Referència de Catalunya. El Prat de Llobregat. Spain.

References

  1. Segal, L.N.; Martinez, F.J. Chronic obstructive pulmonary disease subpopulations and phenotyping. J. Allergy Clin. Immunol. 2018, 141, 1961–1971. [Google Scholar] [CrossRef] [PubMed]
  2. Corlateanu, A.; Mendez, Y.; Wang, Y.; Garnica, R.d.J.A.; Botnaru, V.; Siafakas, N. Chronic obstructive pulmonary disease and phenotypes: A state-of-the-art. Pulmonology 2020, 26, 95–100. [Google Scholar] [CrossRef]
  3. Barnes, P.J. Inflammatory endotypes in COPD. Allergy 2019, 74, 1249–1256. [Google Scholar] [CrossRef] [PubMed]
  4. Wypych, T.P.; Wickramasinghe, L.C.; Marsland, B.J. The influence of the microbiome on respiratory health. Nat. Immunol. 2019, 20, 1279–1290. [Google Scholar] [CrossRef] [PubMed]
  5. Ramsheh, M.Y.; Haldar, K.; Esteve-Codina, A.; Purser, L.F.; Richardson, M.; Müller-Quernheim, J.; Greulich, T.; Nowinski, A.; Barta, I.; Stendardo, M.; et al. Lung microbiome composition and bronchial epithelial gene expression in patients with COPD versus healthy individuals: A bacterial 16S rRNA gene sequencing and host transcriptomic analysis. Lancet Microbe 2021, 2, e300–e310. [Google Scholar] [CrossRef]
  6. Wang, Z.; Singh, R.; Miller, B.E.; Tal-Singer, R.; Van Horn, S.; Tomsho, L.; Mackay, A.; Allinson, J.P.; Webb, A.J.; Brookes, A.J.; et al. Sputum microbiome temporal variability and dysbiosis in chronic obstructive pulmonary disease exacerbations: An analysis of the COPDMAP study. Thorax 2018, 73, 331–338. [Google Scholar] [CrossRef] [PubMed]
  7. Wang, Z.; Maschera, B.; Lea, S.; Kolsum, U.; Michalovich, D.; Van Horn, S.; Traini, C.; Brown, J.R.; Hessel, E.M.; Singh, D. Airway host-microbiome interactions in chronic obstructive pulmonary disease. Respir. Res. 2019, 20, 113. [Google Scholar] [CrossRef] [PubMed]
  8. Yang, C.Y.; Li, S.W.; Chin, C.Y.; Hsu, C.W.; Lee, C.C.; Yeh, Y.M.; Wu, K.A. Association of exacerbation phenotype with the sputum microbiome in chronic obstructive pulmonary disease patients during the clinically stable state. J. Transl. Med. 2021, 19, 121. [Google Scholar] [CrossRef] [PubMed]
  9. Dicker, A.J.; Huang, J.T.J.; Lonergan, M.; Keir, H.R.; Fong, C.J.; Tan, B.; Cassidy, A.J.; Finch, S.; Mullerova, H.; Miller, B.E.; et al. The sputum microbiome, airway inflammation, and mortality in chronic obstructive pulmonary disease. J. Allergy Clin. Immunol. 2021, 147, 158–167. [Google Scholar] [CrossRef]
  10. Wang, Z.; Locantore, N.; Haldar, K.; Ramsheh, M.Y.; Beech, A.S.; Ma, W.; Brown, J.R.; Tal-Singer, R.; Barer, M.R.; Bafadhel, M.; et al. Inflammatory Endotype-associated Airway Microbiome in Chronic Obstructive Pulmonary Disease Clinical Stability and Exacerbations: A Multicohort Longitudinal Analysis. Am. J. Respir. Crit. Care Med. 2021, 203, 1488–1502. [Google Scholar] [CrossRef]
  11. Millares, L.; Pascual, S.; Montón, C.; García-Núñez, M.; Lalmolda, C.; Faner, R.; Casadevall, C.; Setó, L.; Capilla, S.; Moreno, A.; et al. Relationship between the respiratory microbiome and the severity of airflow limitation, history of exacerbations and circulating eosinophils in COPD patients. BMC Pulm. Med. 2019, 19, 112. [Google Scholar] [CrossRef] [PubMed]
  12. Liang, W.; Yang, Y.; Gong, S.; Wei, M.; Ma, Y.; Feng, R.; Gao, J.; Liu, X.; Tu, F.; Ma, W.; et al. Airway dysbiosis accelerates lung function decline in chronic obstructive pulmonary disease. Cell Host Microbe 2023, 31, 1054–1070.e9. [Google Scholar] [CrossRef] [PubMed]
  13. Dang, X.; Kang, Y.; Wang, X.; Cao, W.; Li, M.; He, Y.; Pan, X.; Ye, K.; Xu, D. Frequent exacerbators of chronic obstructive pulmonary disease have distinguishable sputum microbiome signatures during clinical stability. Front. Microbiol. 2022, 13, 1037037. [Google Scholar] [CrossRef] [PubMed]
  14. Contoli, M.; Pauletti, A.; Rossi, M.R.; Spanevello, A.; Casolari, P.; Marcellini, A.; Forini, G.; Gnesini, G.; Marku, B.; Barnes, N.; et al. Long-term effects of inhaled corticosteroids on sputum bacterial and viral loads in COPD. Eur. Respir. J. 2017, 50, 1700451. [Google Scholar] [CrossRef]
  15. Filho, F.S.L.; Alotaibi, N.M.; Ngan, D.; Tam, S.; Yang, J.; Hollander, Z.; Chen, V.; FitzGerald, J.M.; Nislow, C.; Leung, J.M.; et al. Sputum Microbiome Is Associated with 1-Year Mortality after Chronic Obstructive Pulmonary Disease Hospitalizations. Am. J. Respir. Crit. Care Med. 2019, 199, 1205–1213. [Google Scholar] [CrossRef]
  16. Xue, Q.; Xie, Y.; He, Y.; Yu, Y.; Fang, G.; Yu, W.; Wu, J.; Li, J.; Zhao, L.; Deng, X.; et al. Lung microbiome and cytokine profiles in different disease states of COPD: A cohort study. Sci. Rep. 2023, 13, 5715. [Google Scholar] [CrossRef]
  17. Yun, J.H.; Chase, R.; Parker, M.M.; Saferali, A.; Castaldi, P.J.; Silverman, E.K.; Hersh, C.P. Peripheral Blood Gene Expression Signatures of Eosinophilic Chronic Obstructive Pulmonary Disease. Am. J. Respir. Cell Mol. Biol. 2019, 61, 398–401. [Google Scholar] [CrossRef]
  18. Agusti, A.; Sin, D.D. Biomarkers in COPD. Clin. Chest Med. 2014, 35, 131–141. [Google Scholar] [CrossRef] [PubMed]
  19. Zhang, J.; Bai, C. The Significance of Serum Interleukin-8 in Acute Exacerbations of Chronic Obstructive Pulmonary Disease. Tanaffos 2018, 17, 13–21. [Google Scholar] [PubMed]
  20. Li, S.; Zhao, S.; Wu, Z.; Wang, F.; Li, W. Alteration of immune profiles is associated with pulmonary function and symptoms in patients with chronic obstructive pulmonary disease. Mol. Med. Rep. 2021, 24, 742. [Google Scholar] [CrossRef]
  21. 202 GOLD Report—Global Initiative for Chronic Obstructive Lung Disease—GOLD. Available online: https://goldcopd.org/2023-gold-report-2/ (accessed on 10 January 2024).
  22. Pragman, A.A.; Knutson, K.A.; Gould, T.J.; Isaacson, R.E.; Reilly, C.S.; Wendt, C.H. Chronic obstructive pulmonary disease upper airway microbiota alpha diversity is associated with exacerbation phenotype: A case-control observational study. Respir. Res. 2019, 20, 114. [Google Scholar] [CrossRef] [PubMed]
  23. Tiew, P.Y.; Jaggi, T.K.; Chan, L.L.Y.; Chotirmall, S.H. The airway microbiome in COPD, bronchiectasis and bronchiectasis-COPD overlap. Clin. Respir. J. 2021, 15, 123–133. [Google Scholar] [CrossRef] [PubMed]
  24. Su, Y.C.; Jalalvand, F.; Thegerström, J.; Riesbeck, K. The Interplay between Immune Response and Bacterial Infection in COPD: Focus Upon Non-typeable Haemophilus influenzae. Front. Immunol. 2018, 9, 2530. [Google Scholar] [CrossRef] [PubMed]
  25. Jacobs, D.M.; Ochs-Balcom, H.M.; Zhao, J.; Murphy, T.F.; Sethi, S. Lower Airway Bacterial Colonization Patterns and Species-Specific Interactions in Chronic Obstructive Pulmonary Disease. J. Clin. Microbiol. 2018, 56, e00330-18. [Google Scholar] [CrossRef] [PubMed]
  26. Rogers, G.B.; Van Der Gast, C.J.; Serisier, D.J. Predominant pathogen competition and core microbiota divergence in chronic airway infection. ISME J. 2015, 9, 217–225. [Google Scholar] [CrossRef] [PubMed]
  27. Yang, R.; Zhang, Q.; Ren, Z.; Li, H.; Ma, Q. Different Airway Inflammatory Phenotypes Correlate with Specific Fungal and Bacterial Microbiota in Asthma and Chronic Obstructive Pulmonary Disease. J. Immunol. Res. 2022, 2022, 2177884. [Google Scholar] [CrossRef] [PubMed]
  28. Singh, D.; Kolsum, U.; Brightling, C.E.; Locantore, N.; Agusti, A. Eosinophilic inflammation in COPD: Prevalence and clinical characteristics. Eur. Respir. J. 2014, 44, 1697–1700. [Google Scholar] [CrossRef] [PubMed]
  29. Negewo, N.A.; McDonald, V.M.; Baines, K.J.; Wark, P.A.B.; Simpson, J.L.; Jones, P.W.; Gibson, P.G. Peripheral blood eosinophils: A surrogate marker for airway eosinophilia in stable COPD. Int. J. Chron. Obstruct Pulmon Dis. 2016, 11, 1495–1504. [Google Scholar] [CrossRef]
  30. Antus, B.; Paska, C.; Barta, I. Predictive Value of Exhaled Nitric Oxide and Blood Eosinophil Count in the Assessment of Airway Eosinophilia in COPD. Int. J. Chron. Obstruct Pulmon Dis. 2020, 15, 2025–2035. [Google Scholar] [CrossRef]
  31. Baines, K.J.; Negewo, N.A.; Gibson, P.G.; Fu, J.J.; Simpson, J.L.; Wark, P.A.B.; Fricker, M.; McDonald, V.M. A Sputum 6 Gene Expression Signature Predicts Inflammatory Phenotypes and Future Exacerbations of COPD. Int. J. Chron. Obstruct Pulmon Dis. 2020, 15, 1577–1590. [Google Scholar] [CrossRef]
  32. Kerkhof, M.; Sonnappa, S.; Postma, D.S.; Brusselle, G.; Agustí, A.; Anzueto, A.; Jones, R.; Papi, A.; Pavord, I.; Pizzichini, E.; et al. Blood eosinophil count and exacerbation risk in patients with COPD. Eur. Respir. J. 2017, 50, 1700761. [Google Scholar] [CrossRef] [PubMed]
  33. Yun, J.H.; Lamb, A.; Chase, R.; Singh, D.; Parker, M.M.; Saferali, A.; Vestbo, J.; Tal-Singer, R.; Castaldi, P.J.; Silverman, E.K.; et al. Blood eosinophil count thresholds and exacerbations in patients with chronic obstructive pulmonary disease. J. Allergy Clin. Immunol. 2018, 141, 2037–2047.e10. [Google Scholar] [CrossRef] [PubMed]
  34. Oh, Y.M.; Lee, K.S.; Hong, Y.; Hwang, S.C.; Kim, J.Y.; Kim, D.K.; Yoo, K.H.; Lee, J.H.; Kim, T.H.; Lim, S.Y.; et al. Blood eosinophil count as a prognostic biomarker in COPD. Int. J. Chron. Obstruct Pulmon Dis. 2018, 13, 3589–3596. [Google Scholar] [CrossRef] [PubMed]
  35. Miravitlles, M.; Monteagudo, M.; Solntseva, I.; Alcázar, B. Blood Eosinophil Counts and Their Variability and Risk of Exacerbations in COPD: A Population-Based Study. Arch. Bronconeumol. 2021, 57, 13–20. [Google Scholar] [CrossRef] [PubMed]
  36. Chis, A.F.; Pop, C.M. Correlations between neutrophil to lymphocyte ratio, blood eosinophils and clinical characteristics in chronic obstructive pulmonary disease. Med. Pharm. Rep. 2020, 93, 169–174. [Google Scholar] [CrossRef] [PubMed]
  37. Yoo, B.; Lee, S.H.; Kim, S.Y.; Leem, A.Y.; Chung, K.S.; Kim, E.Y.; Jung, J.Y.; Kang, Y.A.; Park, M.S.; Chang, J.; et al. Relationship between airway obstruction and C-reactive protein levels in a community-based population of Korea. Int. J. Tuberc. Lung Dis. 2019, 23, 1228–1234. [Google Scholar] [CrossRef] [PubMed]
  38. Nuñez, A.; Marras, V.; Harlander, M.; Mekov, E.; Esquinas, C.; Turel, M.; Lestan, D.; Petkov, R.; Yanev, N.; Pirina, P.; et al. Association between Routine Blood Biomarkers and Clinical Phenotypes and Exacerbations in Chronic Obstructive Pulmonary Disease. Int. J. Chron. Obstruct Pulmon Dis. 2020, 15, 681–690. [Google Scholar] [CrossRef]
  39. Martínez-Gestoso, S.; García-Sanz, M.-T.; Carreira, J.-M.; Nieto-Fontarigo, J.-J.; Calvo-Álvarez, U.; Doval-Oubiña, L.; Camba-Matos, S.; Peleteiro-Pedraza, L.; Roibás-Veiga, I.; González-Barcala, F.J. Prognostic Usefulness of Basic Analytical Data in Chronic Obstructive Pulmonary Disease Exacerbation. Open Respir. Arch. 2023, 5, 100271. [Google Scholar] [CrossRef] [PubMed]
  40. Leuzzi, G.; Galeone, C.; Taverna, F.; Suatoni, P.; Morelli, D.; Pastorino, U. C-reactive protein level predicts mortality in COPD: A systematic review and meta-analysis. Eur. Respir. Rev. 2017, 26, 160070. [Google Scholar] [CrossRef]
  41. Gea, J.; Pascual, S.; Castro-Acosta, A.; Hernández-Carcereny, C.; Castelo, R.; Márquez-Martín, E.; Montón, C.; Palou, A.; Faner, R.; Furlong, L.I.; et al. The BIOMEPOC Project: Personalized Biomarkers and Clinical Profiles in Chronic Obstructive Pulmonary Disease. Arch. Bronconeumol. 2019, 55, 93–99. [Google Scholar] [CrossRef]
  42. Vogelmeier, C.F.; Criner, G.J.; Martinez, F.J.; Anzueto, A.; Barnes, P.J.; Bourbeau, J.; Celli, B.R.; Chen, R.; Decramer, M.; Fabbri, L.M.; et al. Global Strategy for the Diagnosis, Management, and Prevention of Chronic Obstructive Lung Disease 2017 Report. GOLD Executive Summary. Am. J. Respir. Crit. Care Med. 2017, 195, 557–582. [Google Scholar] [CrossRef] [PubMed]
  43. Livak, K.J.; Schmittgen, T.D. Analysis of relative gene expression data using real-time quantitative PCR and the 2(-Delta Delta C(T)) Method. Methods 2001, 25, 402–408. [Google Scholar] [CrossRef] [PubMed]
Figure 1. Most representative significant negative (blue) correlations between blood inflammatory markers and the relative abundance of bacterial genera. Bubble size represents the Spearman’s Rank correlation coefficient and the intensity of bubble color represents the p value.
Ijms 25 08467 g001
Figure 2. Relative abundance of bacterial genera with significant differences between IE and FE COPD patients. Data are presented as individual data points with median as a red line and IQR as black lines where * is p < 0.05.
Ijms 25 08467 g002
Figure 3. Relationships between the relative abundance of Pseudomonas with lung function and the number of exacerbations during the previous year.
Ijms 25 08467 g003
Figure 4. Protein levels of circulating inflammatory markers with significant differences between Non-EOS and EOS patients. Data are presented as individual data points with median as a red line and IQR as black lines. *, p < 0.05: **, p < 0.01.
Ijms 25 08467 g004
Figure 5. (a) Relative expression of eight eosinophil-related gene transcripts with significant differences between Non-EOS and EOS patients. Data are presented as individual data points with median (red line) and IQR (black lines). (b) Most representative direct (red) correlations between the level of eosinophilic-related gene transcripts and blood eosinophil counts with the relative abundance of bacterial genera. Bubble size represents the correlation coefficient and the intensity of bubble color represents the p value. (c) Relative abundance of Porphyromonas in EOS and Non-EOS COPD patients. (d) Spearman’s Rank correlation of relative abundance of Mogibacterium with the number of exacerbations during the previous year. Significances: *, p < 0.05; **, p < 0.01; ***, p < 0.001.
Ijms 25 08467 g005
Table 1. Clinical characteristics of patients.
All
(N = 72)
IE COPD
(N = 52)
FE COPD
(N = 20)
Non-EOS COPD
(N = 57)
EOS COPD
(N = 15)
Age, years
median (IQR)
70 (62–73)69 (62–73)70 (66–74)70 (62–73)69 (62–74)
Sex (male), n (%)64 (89)46 (89)18 (90)50 (88)14 (93)
BMI, kg/m2
median (IQR)
27.4 (24.2–30.1)27.4 (25.1–29.9)27.5 (23.5–30.7)27.8 (24.1–30.5)27.3 (24.7–28.4)
FEV1, (% pred.)
median (IQR)
44 (33–60)48 (35–67)34 (26–47) **43 (32–60)48 (35–67)
FEV1/FVC, (%)
median (IQR)
44 (35–55)46 (37–57)35 (30–45) **45 (34–54.3)43 (37–56)
DLco, (% pred.)
median (IQR)
51 (40–68)51 (45–71)40 (32–60) *49 (40–66)65 (40–82)
Nº of Exacerbations in the previous year,
median (IQR)
1 (0–2)0 (0–1)3 (2–6) ***1 (0–2)0 (0–1)
Blood leucocytes (cells/nL), median (IQR)8 (6.7–9.3)7.6 (6.7–8.7)8.4 (7–10.6)8 (6.7–10)7.1 (6.5–8.5)
Blood eosinophils (cells/nL), median (IQR) 0.2 (0.1–0.3)0.2 (0.1–0.3)0.2 (0.1–0.3)0.2 (0.1–0.2)0.3 (0.2–0.3) ‡‡‡
Blood neutrophils (cells/nL), median (IQR)4.6 (3.9–6.1)4.5 (3.8–5.3)5.7 (4–4.8)4.8 (4.1–6.3)3.8 (3.4–4.6) ‡‡‡
GOLD stages, n (%)
16 (8)6 (12)0 (0) 4 (7)2 (13)
220 (28)17 (32)3 (15)15 (26)5 (33)
335 (49)26 (50)9 (45)28 (49)7 (47)
411 (15)3 (6)8 (40) ***10 (18)1 (7)
Notes: Data are presented as median (IQR) for continuous variables and n (percentage) for categorical variables. *, p < 0.05; **, p ≤ 0.01; ***, p ≤ 0.001 for IE vs. FE COPD patients. ‡‡‡, p ≤ 0.001 for Non-EOS vs. EOS COPD patients. Abbreviations: COPD, Chronic Obstructive Pulmonary Disease; IE, infrequent exacerbators; FE, frequent exacerbators; Non-EOS, non-eosinophilic; EOS, eosinophilic; BMI, body mass index; FEV1, forced expiratory volume in 1 s; FVC, forced vital capacity; DLco, diffusing capacity of the lungs for carbon monoxide; GOLD, Global initiative for obstructive lung disease.
Table 2. Bacterial genera and clinical variables with significant correlations.
FEV1
(% Pred)
DLco
(% Pred)
Nº EXACERBATIONS
(Previous Year)
Aggregatibacter0.252 *0.282 *−0.364 **
Butyrivibrio0.248 *0.320 *−0.311 **
Treponema0.436 ***0.384 **−0.305 **
Parvimonas0.250 *0.335 *-
Notes: Spearman’s correlation coefficients. *, p < 0.05; **, p < 0.01; and ***, p ≤ 0.001. Data missing for 20 patients. Abbreviations: FEV1, forced expiratory volume in 1 s; DLco, diffusing capacity of the lungs for carbon monoxide.
Table 3. Relationship between Eosinophilic-related gene transcripts and blood eosinophil counts.
EOSINOPHIL COUNTS
ADORA30.517 ***
ALOX150.572 ***
CLC0.710 ***
HRH40.547 ***
IDO10.508 ***
IL5RA0.513 ***
PRSS330.703 ***
SIGLEC80.712 ***
SLC29A10.632 ***
SMPD30.618 ***
Notes: Spearman’s correlation coefficient. ***, p < 0.001. Abbreviations: ADORA3: Adenosine A3 receptor; ALOX15: Arachidonate 15-Lipoxygenase; CLC: Charcot–Leyden crystal galectin; HRH4: Histamine Receptor H4; IDO1: Indoleamine 2,3-Dioxygenase 1; IL5RA: Interleukin 5 receptor subunit Alpha; PRSS33: Protease, Serine 33; SIGLEC8: Sialic acid-binding Ig-like Lectin 8; SLC29A1: Solute carrier family 29 member 1; SMPD3: Sphingomyelin Phosphodiesterase 3.
Disclaimer/Publisher’s Note: The statements, opinions and data contained in all publications are solely those of the individual author(s) and contributor(s) and not of MDPI and/or the editor(s). MDPI and/or the editor(s) disclaim responsibility for any injury to people or property resulting from any ideas, methods, instructions or products referred to in the content.

