Abstract
Triticum aestivum is an important crop whose reference genome (International Wheat Genome Sequencing Consortium (IWGSC) RefSeq v2.1) offers a valuable resource for understanding wheat genetic structure, improving agronomic traits, and developing new cultivars. A key aspect of gene model annotation is protein-level evidence of gene expression obtained from proteomics studies, followed up by proteogenomics to physically map proteins to the genome. In this research, we have retrieved the largest recent wheat proteomics datasets publicly available and applied the Basic Local Alignment Search Tool (tBLASTn) algorithm to map the 861,759 identified unique peptides against IWGSC RefSeq v2.1. Of the 92,719 hits, 83,015 unique peptides aligned along 33,612 High Confidence (HC) genes, thus validating 31.4% of all wheat HC gene models. Furthermore, 6685 unique peptides were mapped against 3702 Low Confidence (LC) gene models, and we argue that these gene models should be considered for HC status. The remaining 2934 orphan peptides can be used for novel gene discovery, as exemplified here on chromosome 4D. We demonstrated that tBLASTn could not map peptides exhibiting mid-sequence frame shift. We supply all our proteogenomics results, Galaxy workflow and Python code, as well as Browser Extensible Data (BED) files as a resource for the wheat community via the Apollo Jbrowse, and GitHub repositories. Our workflow could be applied to other proteomics datasets to expand this resource with proteins and peptides from biotically and abiotically stressed samples. This would help tease out wheat gene expression under various environmental conditions, both spatially and temporally.
1. Introduction
Bread wheat (Triticum aestivum) is an allohexaploid species (2n = 6x = 42, AABBDD genomes) resulting from the combination of three interrelated diploid progenitors: T. urartu (AA), a relative of Aegilops speltoides (BB) and T. tauschii (DD) and a major cereal crop widely cultivated across the world [1,2]. It is the staple food of billions of people worldwide and an important source of dietary fiber, proteins, and minerals. In addition, it is widely used in the food and beverage industry, particularly in the production of bread, cereals, pasta, and beer. It is a model for plant domestication and breeding [3]. Wheat is not only economically important but also an essential crop for maintaining global food security. A multilayered global food crisis mitigating near-term food security risks, stabilizing wheat supplies, and transitioning toward long-term agri-food system resilience is proposed to address increasing climate change [4].
The International Wheat Genome Sequencing Consortium (IWGSC) was established in 2005 with the aim of generating a reference genome sequence for T. aestivum. After more than a decade of collaborative efforts, IWGSC released the high-quality reference genome sequence of bread wheat in 2018 (IWGSC RefSeq v1.0) [5], which is considered one of the most complex genomes of any crop plant [6]. A chromosome-scale assembly soon followed, locating 2001 previously annotated or unplaced genes and identifying 5799 additional gene copies [7]. Optical mapping and long sequence reads further helped refine the wheat reference genome, leading to the release of IWGSC RefSeq v2.1 in 2020 [8]. This new assembly contains 266,753 genes, including 105,534 High Confidence (HC) genes and 159,840 Low Confidence (LC) genes. The bread wheat reference genome offers a valuable resource for understanding its genetic structure and improving its agronomic traits, particularly resistance to biotic and abiotic stress [6]. Moreover, T. aestivum genome sequence provides valuable information for developing new wheat varieties with improved yield, quality, and sustainability [9]. It has also been used in numerous studies, including the elucidation of wheat domestication, evolution, and chromosomal organization [6]. The availability of the IWGSC wheat genome sequence will accelerate breeding efforts aimed at improving wheat productivity and sustainability, and ultimately, help meet growing demand for this important food crop.
Proteogenomics, the interface of proteomics and genomics, has become an active area of research owing to the emergence of new DNA, RNA, and protein sequencing technologies [10]. In this approach, mass spectrometry (MS)-based proteomic data are used to provide protein-level evidence of gene expression and to facilitate the annotation of gene models. There are several approaches to physically map peptides to a genome, and the choice of approach will depend on the available resources, the quality of data, and the research question. One such strategy is bottom-up (BU) proteogenomics which is a data-driven method that involves protein digestion with proteases such as trypsin, peptide separation using high-performance liquid chromatography (HPLC), and peptide sequencing by tandem MS (MS/MS) to identify peptides that map to a genome [11]. BU proteogenomics has several advantages, including high sensitivity, high throughput, and the ability to identify post-translational modifications (PTMs) [12]. However, this approach has some limitations, such as reduced coverage of low-abundance proteins and limited ability to identify large proteins or proteins with extensive sequence variation.
In plants, proteogenomics has improved the sensitivity of protein identification for model and nonmodel species, as well as enabling the analysis of complex genome annotation of polyploid organisms such as sweet potatoes [13]. In hexaploid wheat, a comprehensive BU proteogenomics endeavor on various organs and tissues sampled at key developmental stages was achieved by Duncan et al. in 2017 [14]. As many as 1,457,281 matched spectra, representing 89,754 unique peptides at a 2% false discovery rate (FDR), provided the basis for identifying 15,779 proteins and mapping them along IWGSC RefSeq 1.0. More recently, Vincent et al. extensively analyzed the proteome of more than 4000 harvested and stored wheat grains [15,16] based on 195,426 HPLC-MS/MS spectra and yielding 123,638 mascot hits at 5% FDR corresponding to 14,768 unique peptides assigned to 8738 proteins. As these studies not only represented the most comprehensive wheat proteomics datasets to date but also made their raw data accessible, we retrieved their datasets to apply a BU proteogenomics approach and map peptides against IWGSC RefSeq 2.1 genome. Our objective was to process the raw data to map the peptides to the wheat genome, to analyze the results with suitable analytical and visualization tools, and to make all of our work publicly available.
2. Results and Discussion
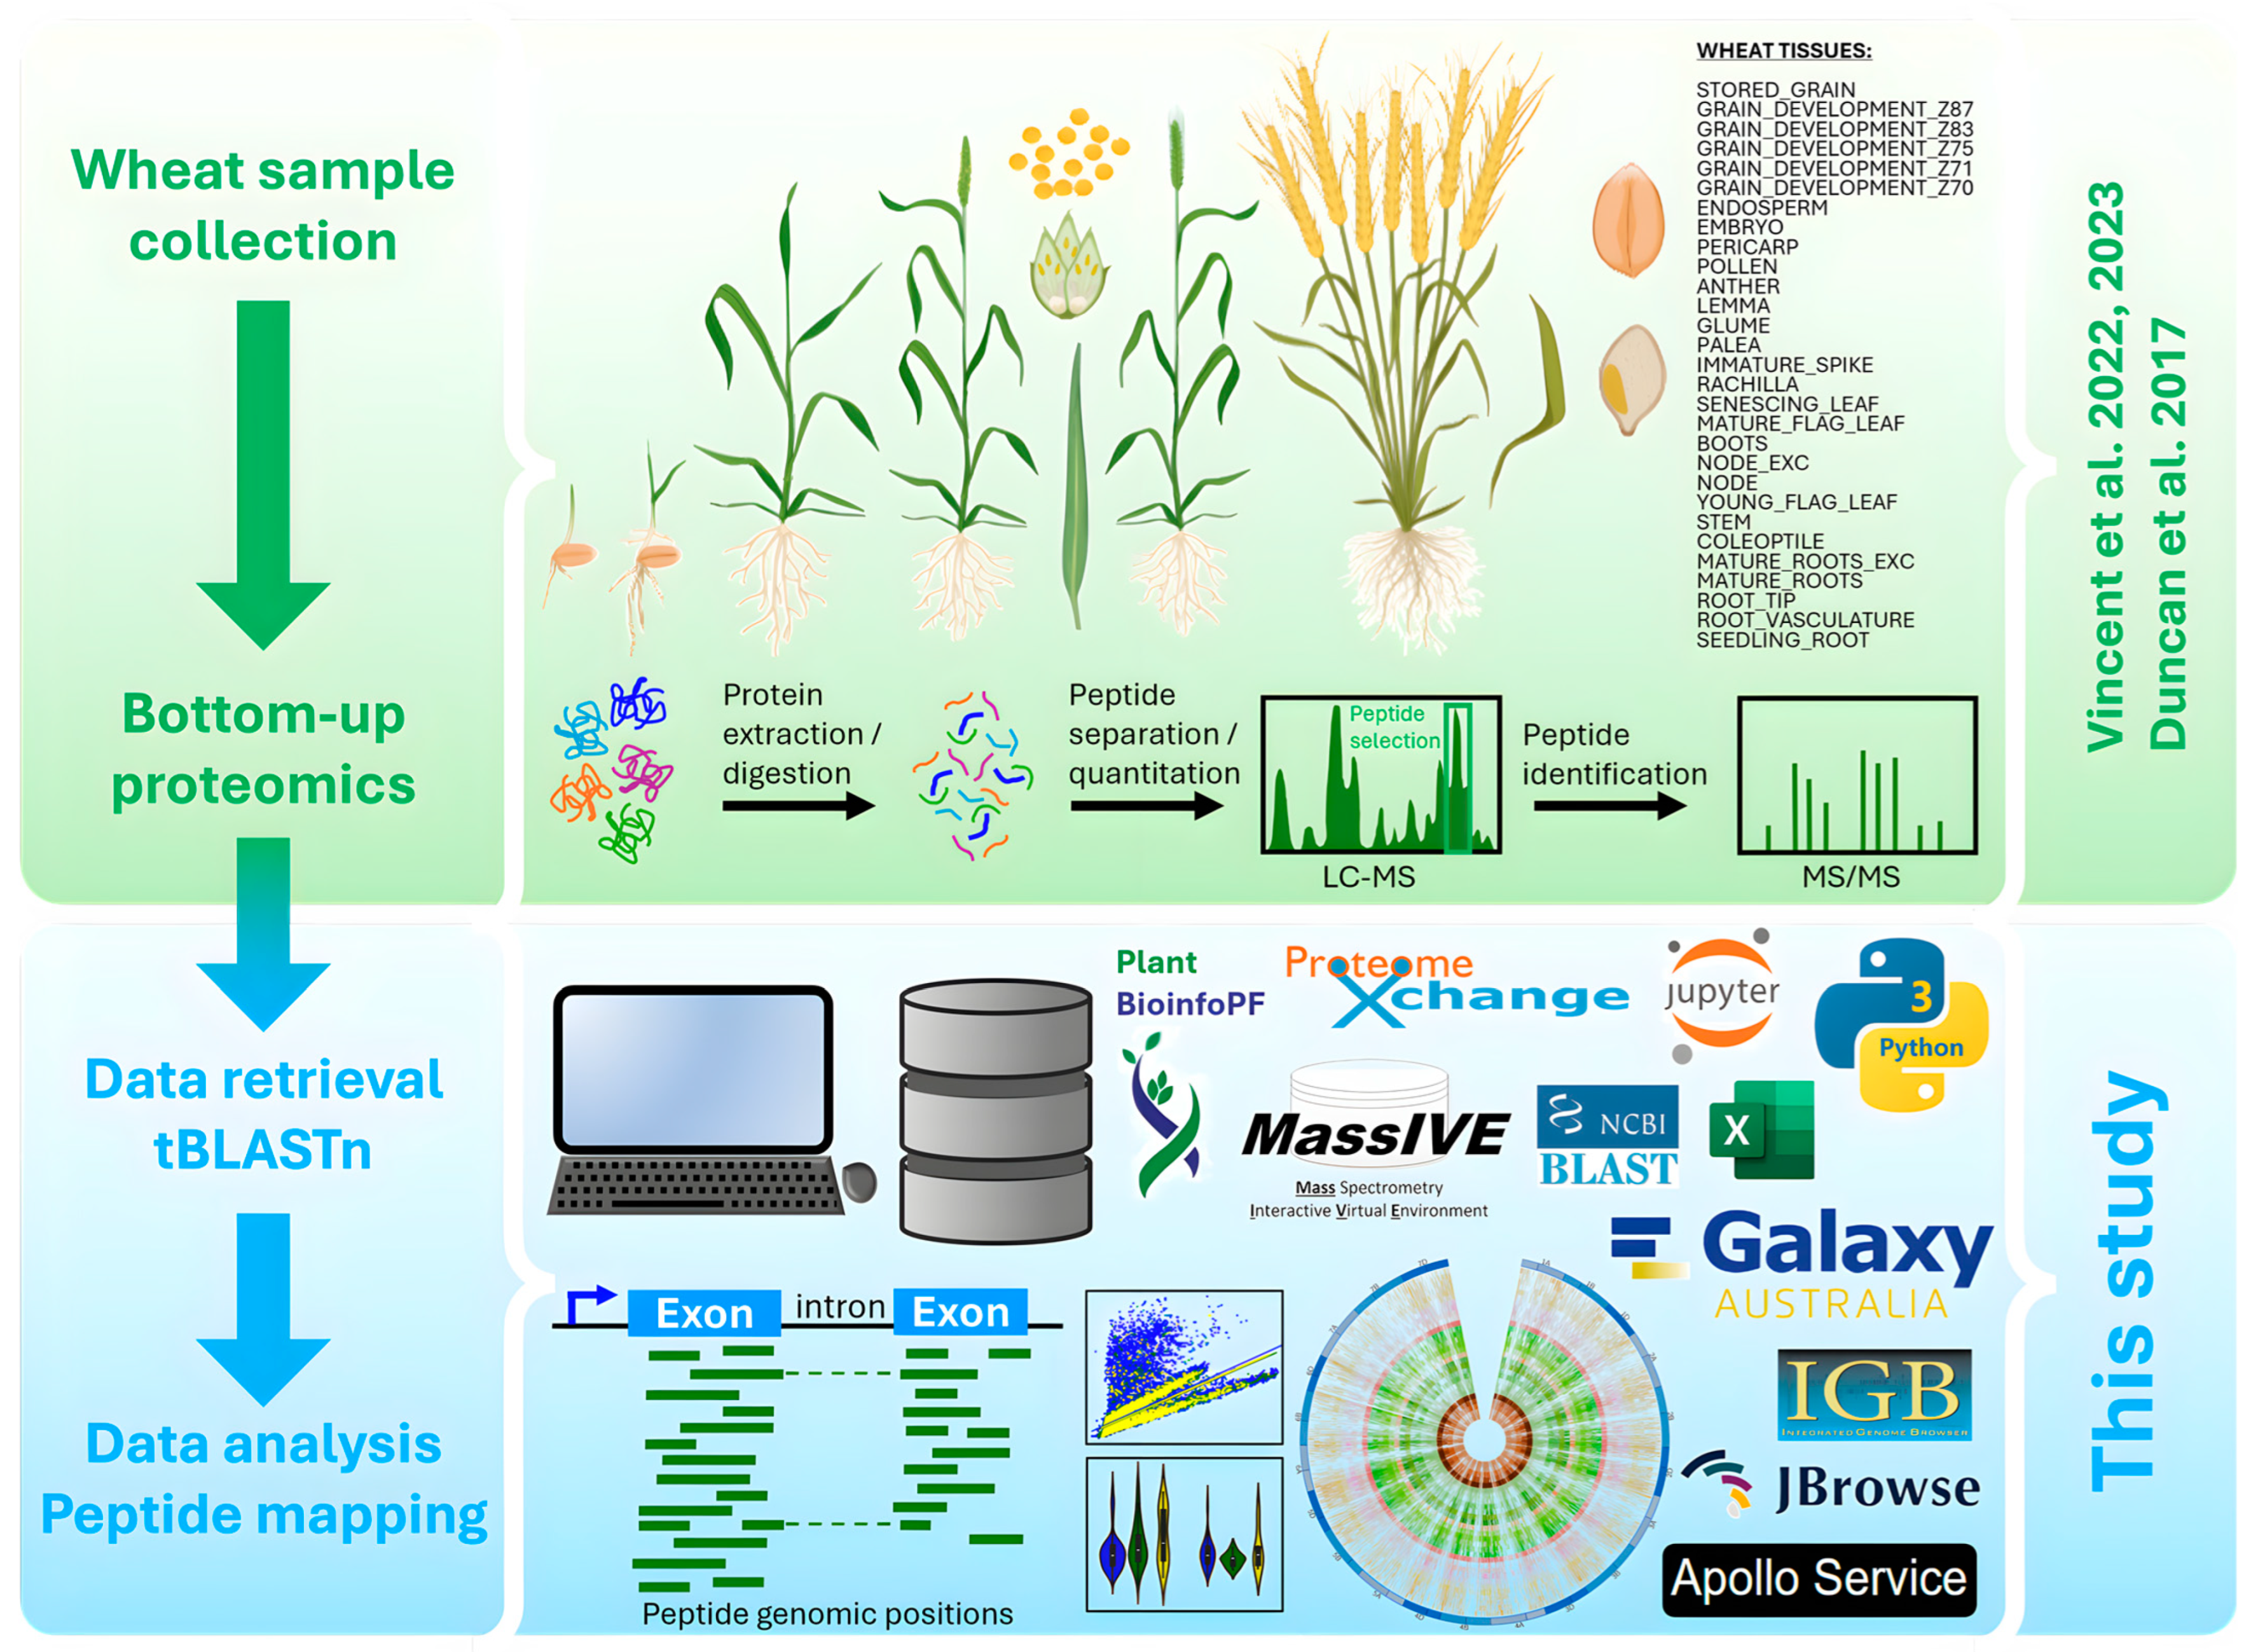
This work exploited extensive HPLC-MS/MS proteomics datasets generated by [14,15,16] to physically map identified peptides along T. aestivum genome using tBLASTn algorithm and various visualization tools. The experimental design is schematized in Figure 1.

Figure 1.
Experimental design of wheat bottom-up (BU) proteogenomics analysis (figure partially created in BioRender). This research was based on organs obtained from plants grown, sampled, and stored in optimal conditions [14,15,16].
2.1. tBLASTn to Align Peptides to Wheat DNA
The algorithm tBLASTn is one of the Basic Local Alignment Search Tool (BLAST) operation modes developed in 1991 [17] that aligns protein (or peptide) sequences to a nucleotide database translated to hypothetical amino acid (AA) sequences in all six reading frames. In 2006, its implementation was modernized with composition-based statistics to greatly improve statistical accuracy and reliability while preserving retrieval accuracy [18]. A tBLASTn search is the only way to pinpoint nucleotide potential coding regions at the protein level. The BLAST+ program was implemented in 2009 to dramatically reduce run times [19]. In 2015, the command line NCBI BLAST+ tool suite was wrapped for use within the Galaxy web-based biomedical data analysis platform [20]. The Galaxy platform offers user-friendly free-to-use tools on generous server space and central processing unit (CPU) times [21]. We took advantage of this resource for our work and ran the sizeable tBLASTn job from Galaxy Australia server (https://usegalaxy.org.au/).
2.1.1. Optimising the tBLASTn Search
A critical element in assessing the quality of a pairwise sequence alignment is the scoring matrix that provides a score for aligning any possible pair of residues [4]. Point accepted mutation (PAM) matrices are suitable for short sequence queries [22], while the Blocks substitution matrix (BLOSUM) caters to longer queries [23]. BLOSUM matrices are based on observed alignments, unlike PAM matrices, which are extrapolated from comparisons of closely related proteins. To compare closely related sequences, PAM matrices with lower numbers (e.g., PAM30) or BLOSUM matrices with higher numbers (e.g., BLOSUM90) are typically employed.
Another essential consideration for multiple sequence alignment is modeling insertions and deletions, otherwise known as gaps. The most prevalent model invokes gap open (existence) and gap extension penalties. Varying the gap open and gap extension costs not only results in very different alignments but also yields different distributions of phylogeny scores [24].
By combining the use of BLOSUM or PAM matrices with various gap costs, we performed 12 tests on HC gene TraesCS4D03G0026600.1 displaying sufficient length (2.2 kb), complexity (5 exons and 4 introns) and peptide coverage (36% with 62 unique peptides). Our test results are summarized in Table 1.

Table 1.
Summary of tBLASTn tests on TraesCS4D03G0026600.1 gene.
We ranked the methods not only according to the number of correctly aligned peptides but also by whether known gaps were detected or not. Another relevant parameter was CPU time, which varied from 2 to 5 min. Correct alignments ranged from 4% (test 11) to 34% (test 8), and correct gap detection ranged from 0% (tests 2–3, 9–11) to 43% (5, 7–8). The largest number of peptides appropriately aligned (21/62) was achieved with test 8 which applied a PAM-30 matrix with gap costs of existence 10 and extension 1. Moreover, these parameters successfully aligned three peptides with gaps that spanned the first intron (Supplementary Table S1). Additionally, this method took the least amount of time to run (2 min), thus minimizing CPU time when aligning hundreds of thousands of sequences. Consequently, the test 8 method ranked the best and was adopted to align all the peptide sequences from our datasets.
2.1.2. Peptides Mapped by tBLASTn
Overall, 2,705,657 peptides were recovered from [14,15,16] across 29 tissue types, which listed 45,620 to 153,644 peptides with an average of 93,299 (±32,163) (Table 2).
Table 2.
Number of peptides processed per tissue type and summary statistics.
As tBLASTn operates on sequence information, we only kept unique AA sequences and eliminated all redundancy related on one hand to charge states and acquired during the electron spray ionization (ESI)-MS analysis, and on the other hand to PTMs, which were abundant [15,16]. A total of 861,759 unique AA peptide sequences were thus searched against the wheat genome (4.2 Gb) using NCBI tBLASTn on the Galaxy Australia server.
Applying our optimized parameters, the analysis required 11 days to complete the tBLASTn job on Galaxy Australia which allocated us 5 cores and 19.6 GB of memory. The 861,759 AA sequences yielded 92,719 (10.8%) peptide hits. With an average of 10.8% (±7.3), hit success rates ranged from 3.7% (young flag leaf) to 35.9% (stored grain). A total of 46,576 peptides mapped to negative the DNA strand, and 46,143 peptides to the positive DNA strand. The distribution across the 6 reading frames was comparable and averaged 15,453 (±198). All the results are available in Supplementary Table S2.
2.1.3. Peptides Missed by tBLASTn
An average of 89% of peptides returned no hit. This could be explained by the fact that BLAST program does not search for splice sites or try to distinguish introns from exons, and tBLASTn in particular does not consider the possibility that an alignment could be extended in another reading frame [18].
To test this hypothesis, we randomly chose the HC gene TraesCS4D03G0026600.1 (2.2 kb) which contains five exons and four introns and exhibits a frame shift. All exons are transcribed into the third reading frame of the positive strand, except exon three, which is transcribed into the second reading frame of the positive strand.
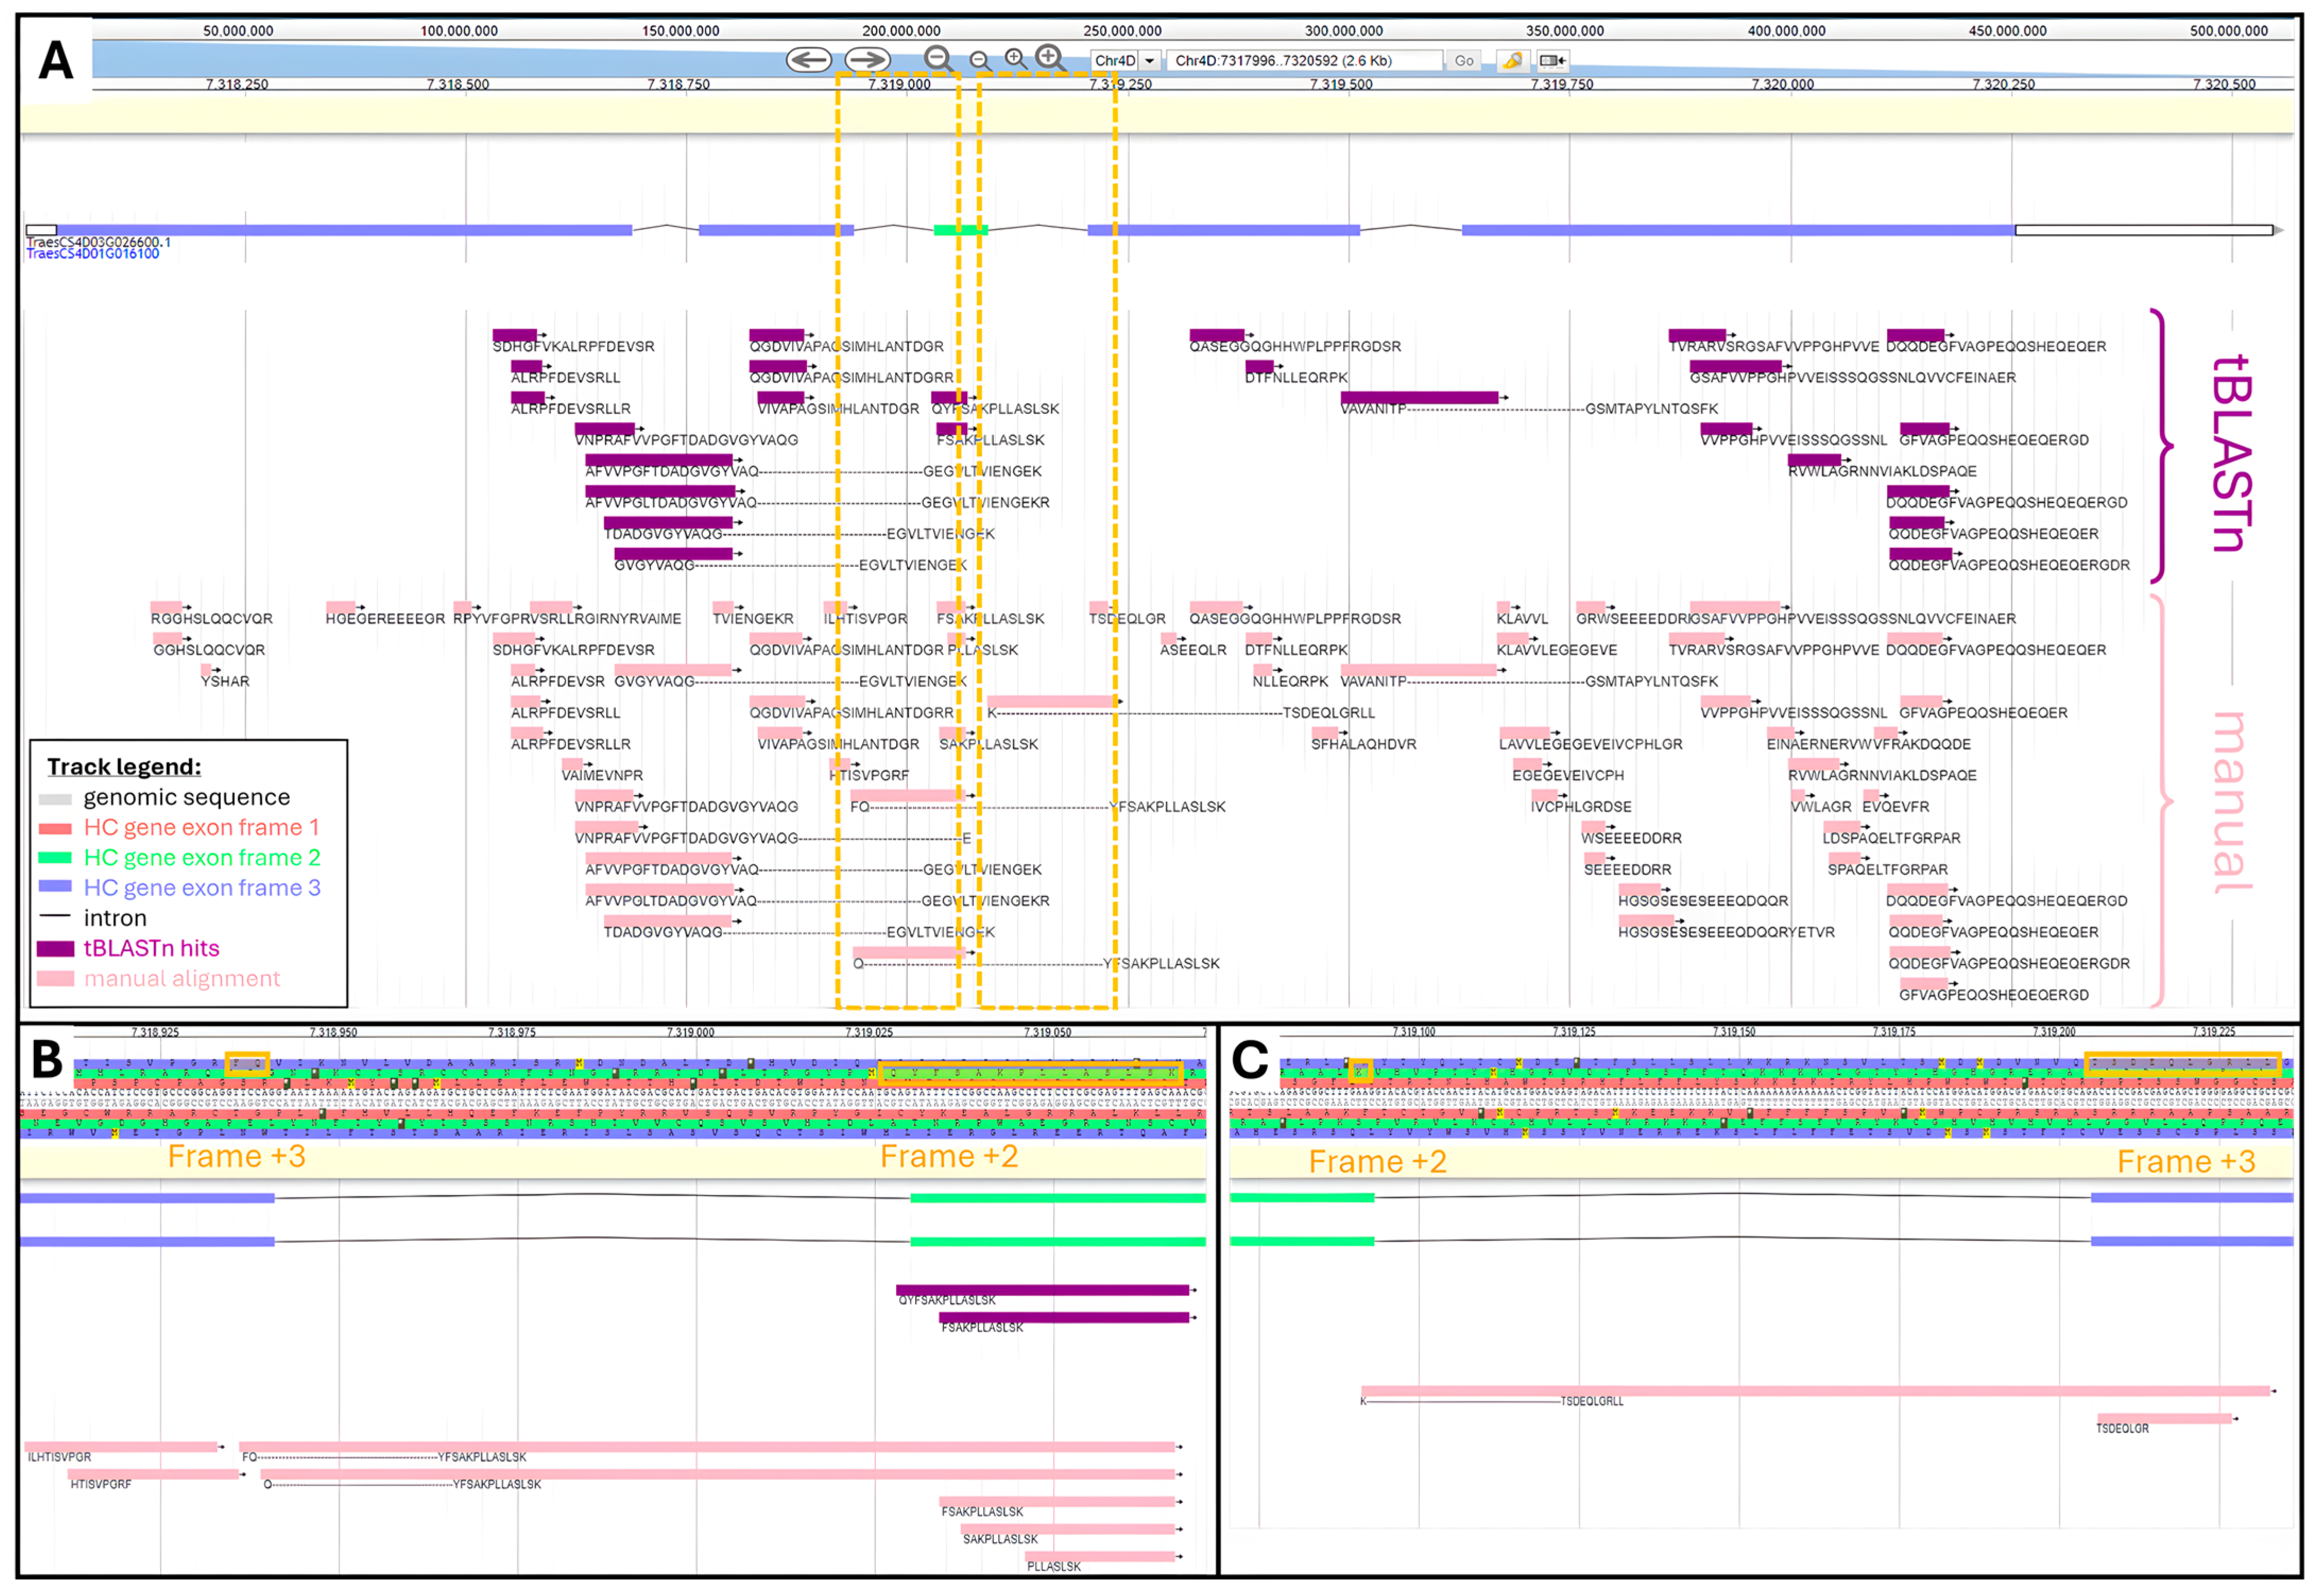
From our recovered datasets, 62 unique peptides belonged to the protein encoded by TraesCS4D03G0026600.1 gene. We manually performed the physical mapping of all these 62 peptides by mathematically converting their AA coordinates into genomic positions. The tBLASTn search yielded 25 (40%) hits out of 62 peptides (Supplementary Table S3). Both manual and tBLASTn alignments were visualized and compared using the bread wheat Apollo Jbrowse server (Figure 2).

Figure 2.
Comparison of tBLASTn and manual alignments along TraesCS4D03G0026600.1 HC gene viewed in Apollo Jbrowse: (A) Alignment along full gene. Boxed areas are zoomed-in in panels (B,C). tBLASTn hits are purple and manual alignment is pink. (B) Zoom-in of genomic region spanning intron between second and third exon. AA sequence is highlighted where frame shift occurs. (C) Zoom-in of genomic region spanning intron between 3rd and 4th exon. AA sequence is highlighted where frame shift occurs.
Figure 2A shows areas not covered by tBLASTn hits, namely ⅔ of the 1st exon, ½ of the third exon, and ⅓ of the fifth exon. We looked at the physicochemical features of TraesCS4D03G0026600.1 peptides to try and explain why they did not produce a tBLASTn hit. It seemed that missed peptides exhibited short length and therefore low molecular weight (MW), extreme values of Grand Average of Hydrophobicity (GRAVY) beyond a range of 0.6 to −2.2, and an aromaticity greater than 0.14 (Supplementary Table S3).
TBLASTn adequately aligned peptides beginning in one exon and finishing in the subsequent exon, thus spanning an intron. This was illustrated with peptide AFVVPGFTDADGVGYVAQ---GEGVLTVIENGEK spanning the second intron and peptide VAVANITP---GSMTAPYLNTQSFK spanning the 4th intron.
TBLASTn algorithm could successfully assign peptides that fully aligned with distinct reading frames, as exemplified with peptides QYFSAKPLLASLSK and FSAKPLLASLSK both found within the third exon on the second frame, while all the other peptides aligned along the third frame. However, the program failed to map peptides whose AA sequence resulted from a frame shift, meaning part of their sequence aligned with a given frame and the rest aligned with another reading frame. This was the case for peptides FQ---YFSAKPLLASLSK and Q---YFSAKPLLASLSK, which started in exon 2 on frame +3 and finished in exon 3 on frame +2 (Figure 2B). Another example is provided with peptide K---TSDEQLGRLL, which started in exon 3 on frame +2 and finished in exon 4 on frame +3 (Figure 2C).
Perhaps, this study could help developers to further refine the BLAST+ program so that short peptides and peptides covering frame shifts can reliably return hits.
2.2. Proteogenomics to Refine Wheat Gene Annotation
Summarized information for mapped peptides can be shown in different tracks on a Circos viewer or a genome browser [12]. Here, we present two genome browsers, a locally installed version of Integrated Genome Browser (IGB) software 10.0.1 [25] and the online public Apollo Jbrowse server (https://bread-wheat-um.genome.edu.au/apollo/49826/jbrowse/) [26], as well as a circular plot using the Circos tool [27] wrapped in Galaxy platform [28].
2.2.1. Physical Mapping of tBLASTn Peptides
Circos plots were originally devised to display genome structure [27]. They offer full flexibility to present complex large datasets in a concise and enticing manner. We layered all the mapped peptides according to the wheat tissue they were extracted from [14,15,16] in a circular plot (Figure 3).

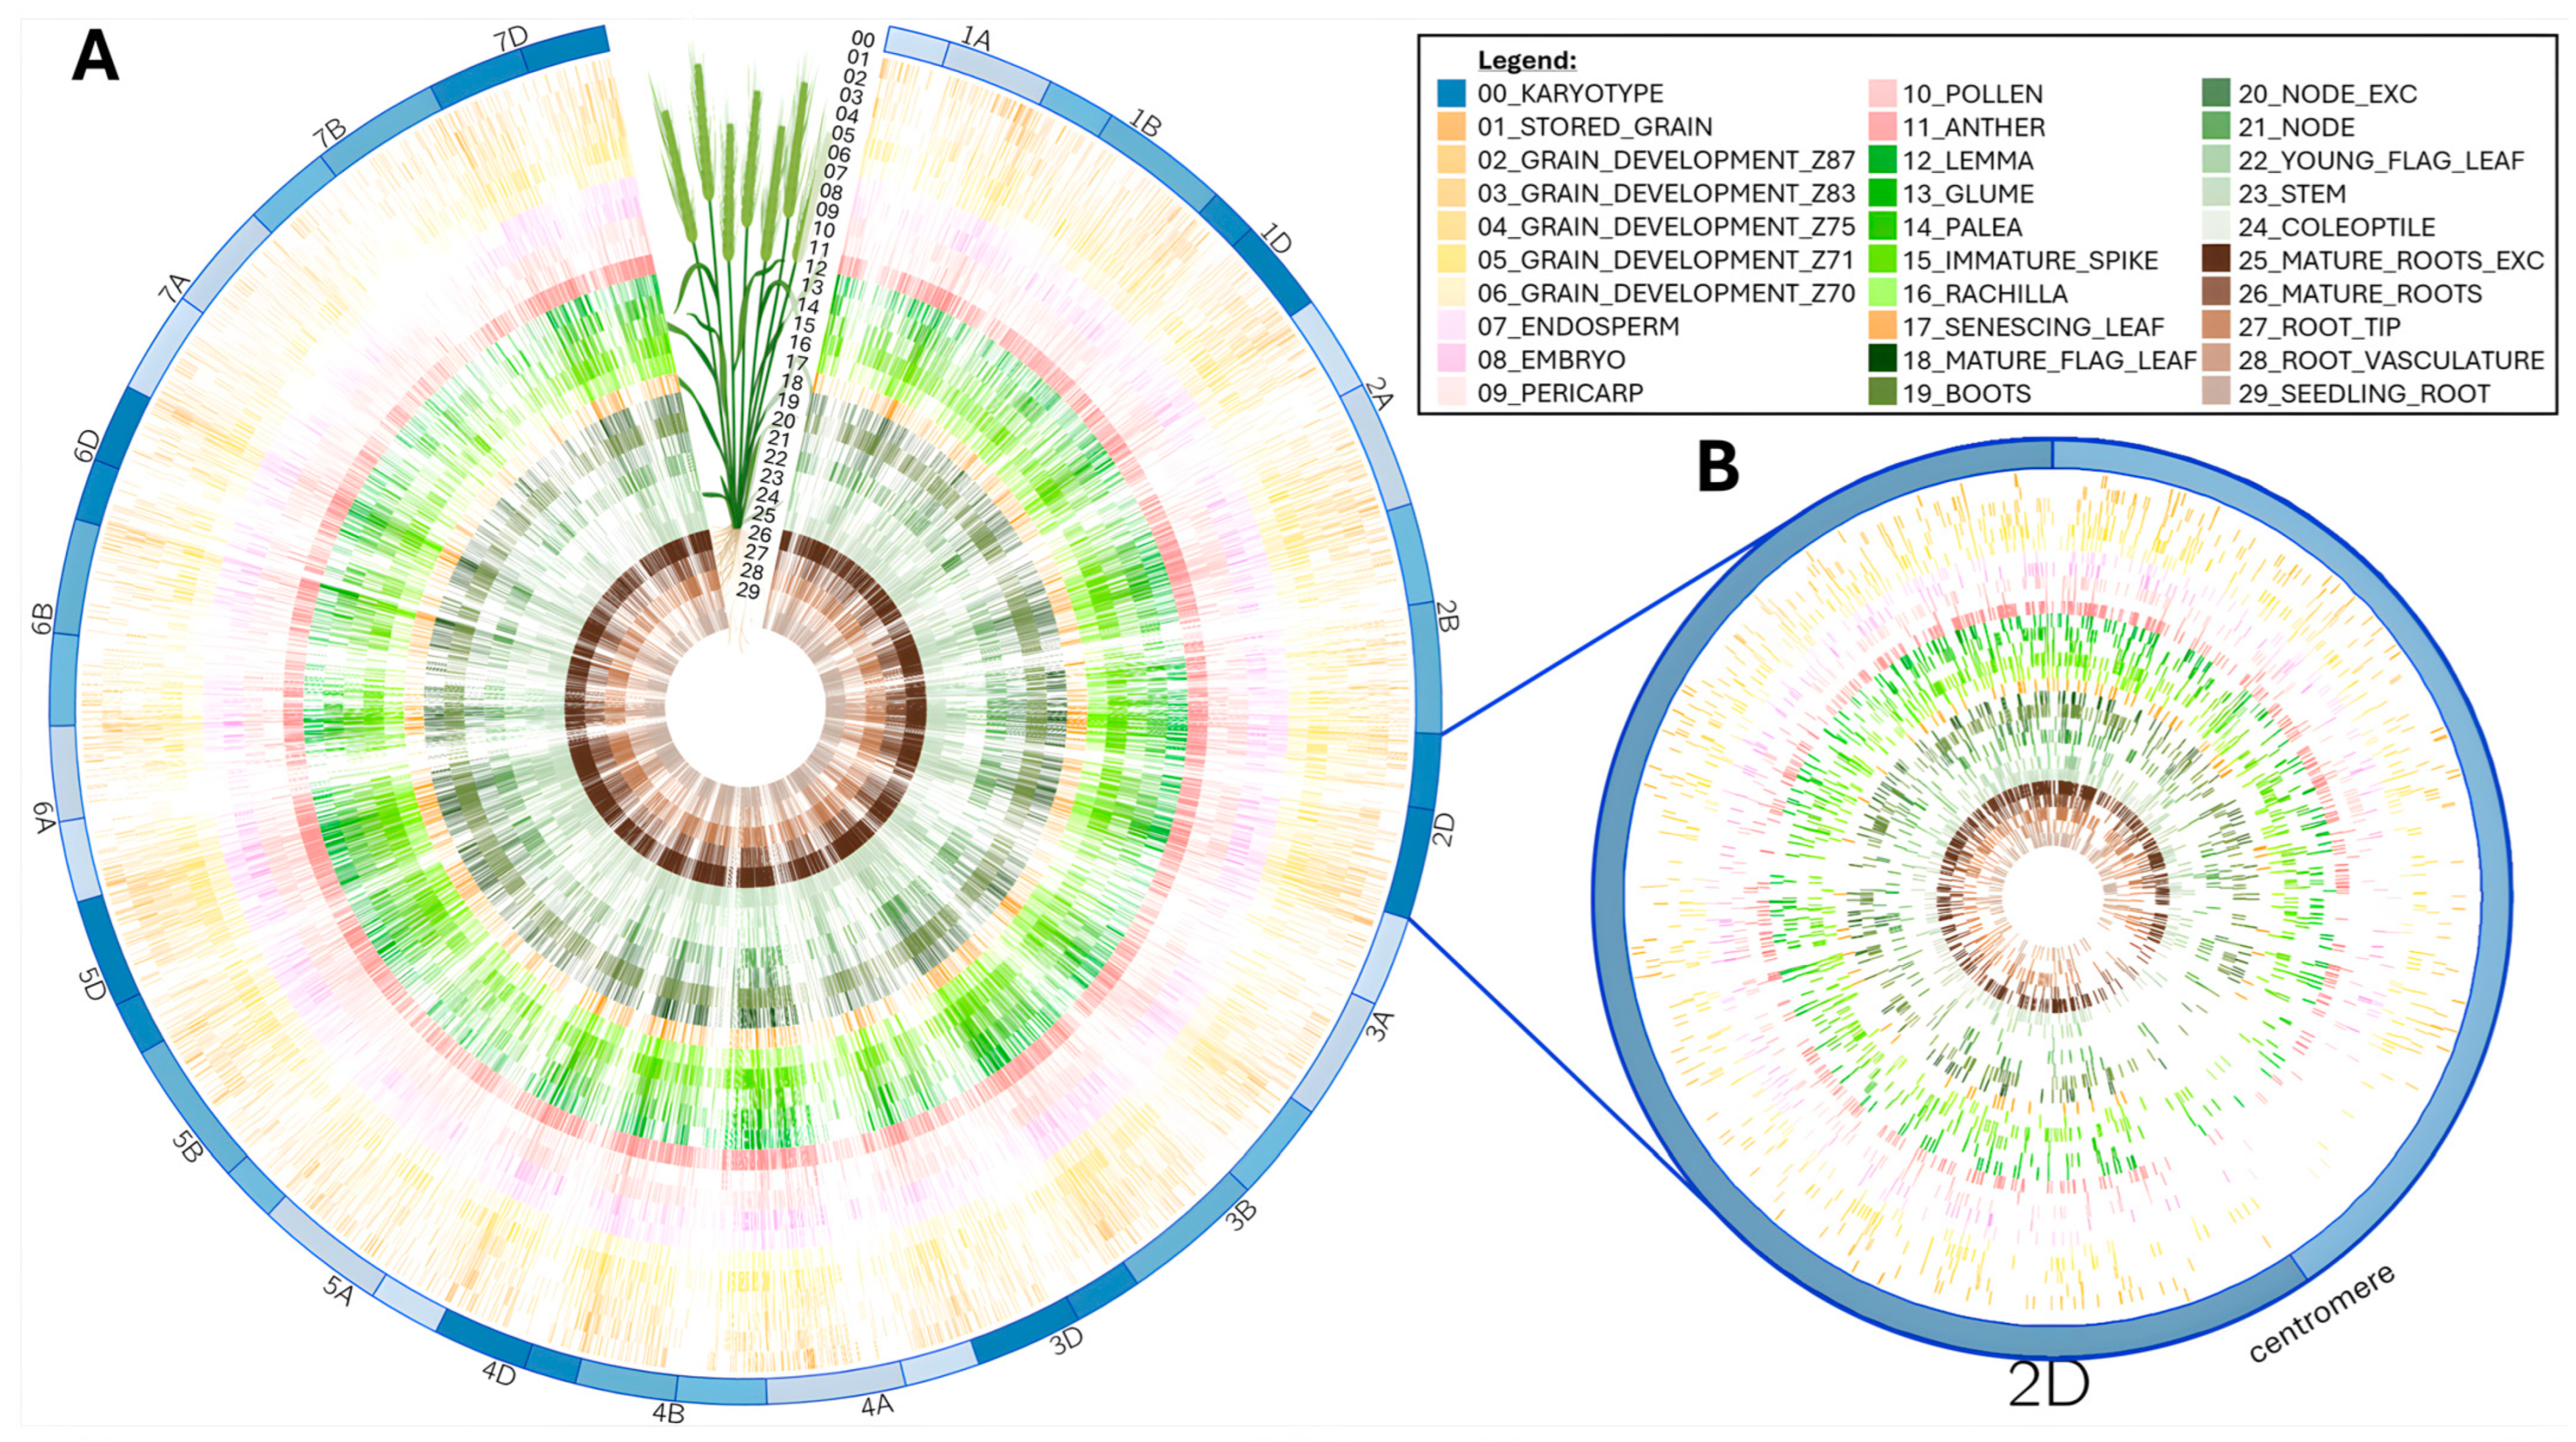
Figure 3.
Circos plot of peptides aligned along wheat chromosomes for each tissue (figure partially created in Galaxy Australia): (A) Full mapping along all 21 T. aestivum chromosomes. (B) Zoomed-in view of chromosome 2D to emphasize low peptide alignment around centromeric region.
This condensed visualization shows that the 92,719 peptides homogenously cover all the chromosomes regardless of tissue type (Figure 3A). Noticeably, centromeric regions present a lesser peptide density coincidently with a reported lack of genes [5]. This can better be appreciated at a single chromosome scale, as exemplified on chromosome 2D in Figure 3B. The wheat proteogenome paucity in the centromere region was previously reported [14,16] and attributed to uneven distribution of coding capacity across the chromosomes [14].
The number of mapped peptides per chromosome varied from 2304 to 8287 with an average of 4411 (Table 3).
Table 3.
Number of peptides and genes aligned along wheat chromosomes.
Duncan et al. noted a low peptide coverage on chromosomes 1A, 2A, and 4B [14], which was not substantiated by our analysis. In our study, chromosomes 1A, 2A, and 4B featured 3197, 5125, and 4449 peptides, respectively. Chromosomes with the lowest peptide density were 7B (2304), 3D (2859), and 6D (3074), while the most densely covered chromosomes were 5D (5804), 2D (6208), and 3B (8287). There was a strong positive correlation (R2 = 0.93) between the number of genes per chromosome and the number of peptides mapped, which is in agreement with chromosome size (Supplementary Figure S1). This confirmed that the variation in peptide density per chromosome matched that of genes.
Genome browsers such as Integrated Genome Browser (IGB) afford a scalable view of the proteogenomic mapping by allowing general viewing at a whole chromosome level (Supplementary Figure S2A) or very fine detailing by zooming in all the way to the peptide sequence level and ultimately individual nucleotides (Supplementary Figure S2B–D). We can see in Supplementary Figure S2C how processing multiple wheat organs helped increase genome coverage. Indeed, proteogenomic coverage achieved up to 21% of genes located on chromosome 3B and averaged 14% per chromosome (Table 3).
2.2.2. Gene Validation, Promotion and Discovery
Peptide genomic coordinates were used to retrieve the names of HC and LC genes encompassing them. Orphan peptides that could not be assigned a gene were deemed “novel”. Overall, 83,015 unique peptides aligned along 33,612 HC genes thus validating 31.4% of all HC gene models (Table 3). On average, 32% and up to 46% (Chromosome 3B) of HC gene annotations were confirmed by our results. We illustrated annotation validation by proteomics using HC gene TraesCS5A03G451700 displaying ample peptide sequence coverage along all coding areas (Figure 4A). A few peptides spanned the second intronic region, while the rest aligned with exons translated in reading frames +1, +2, or +3.
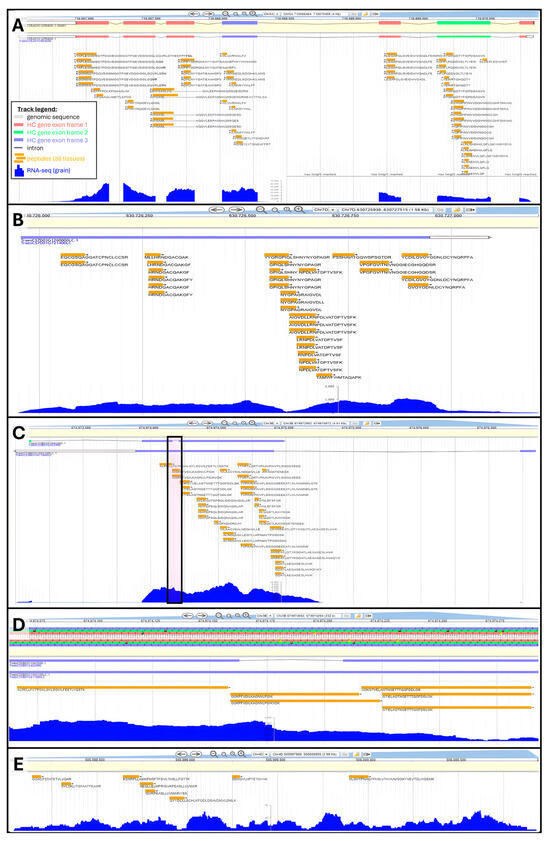
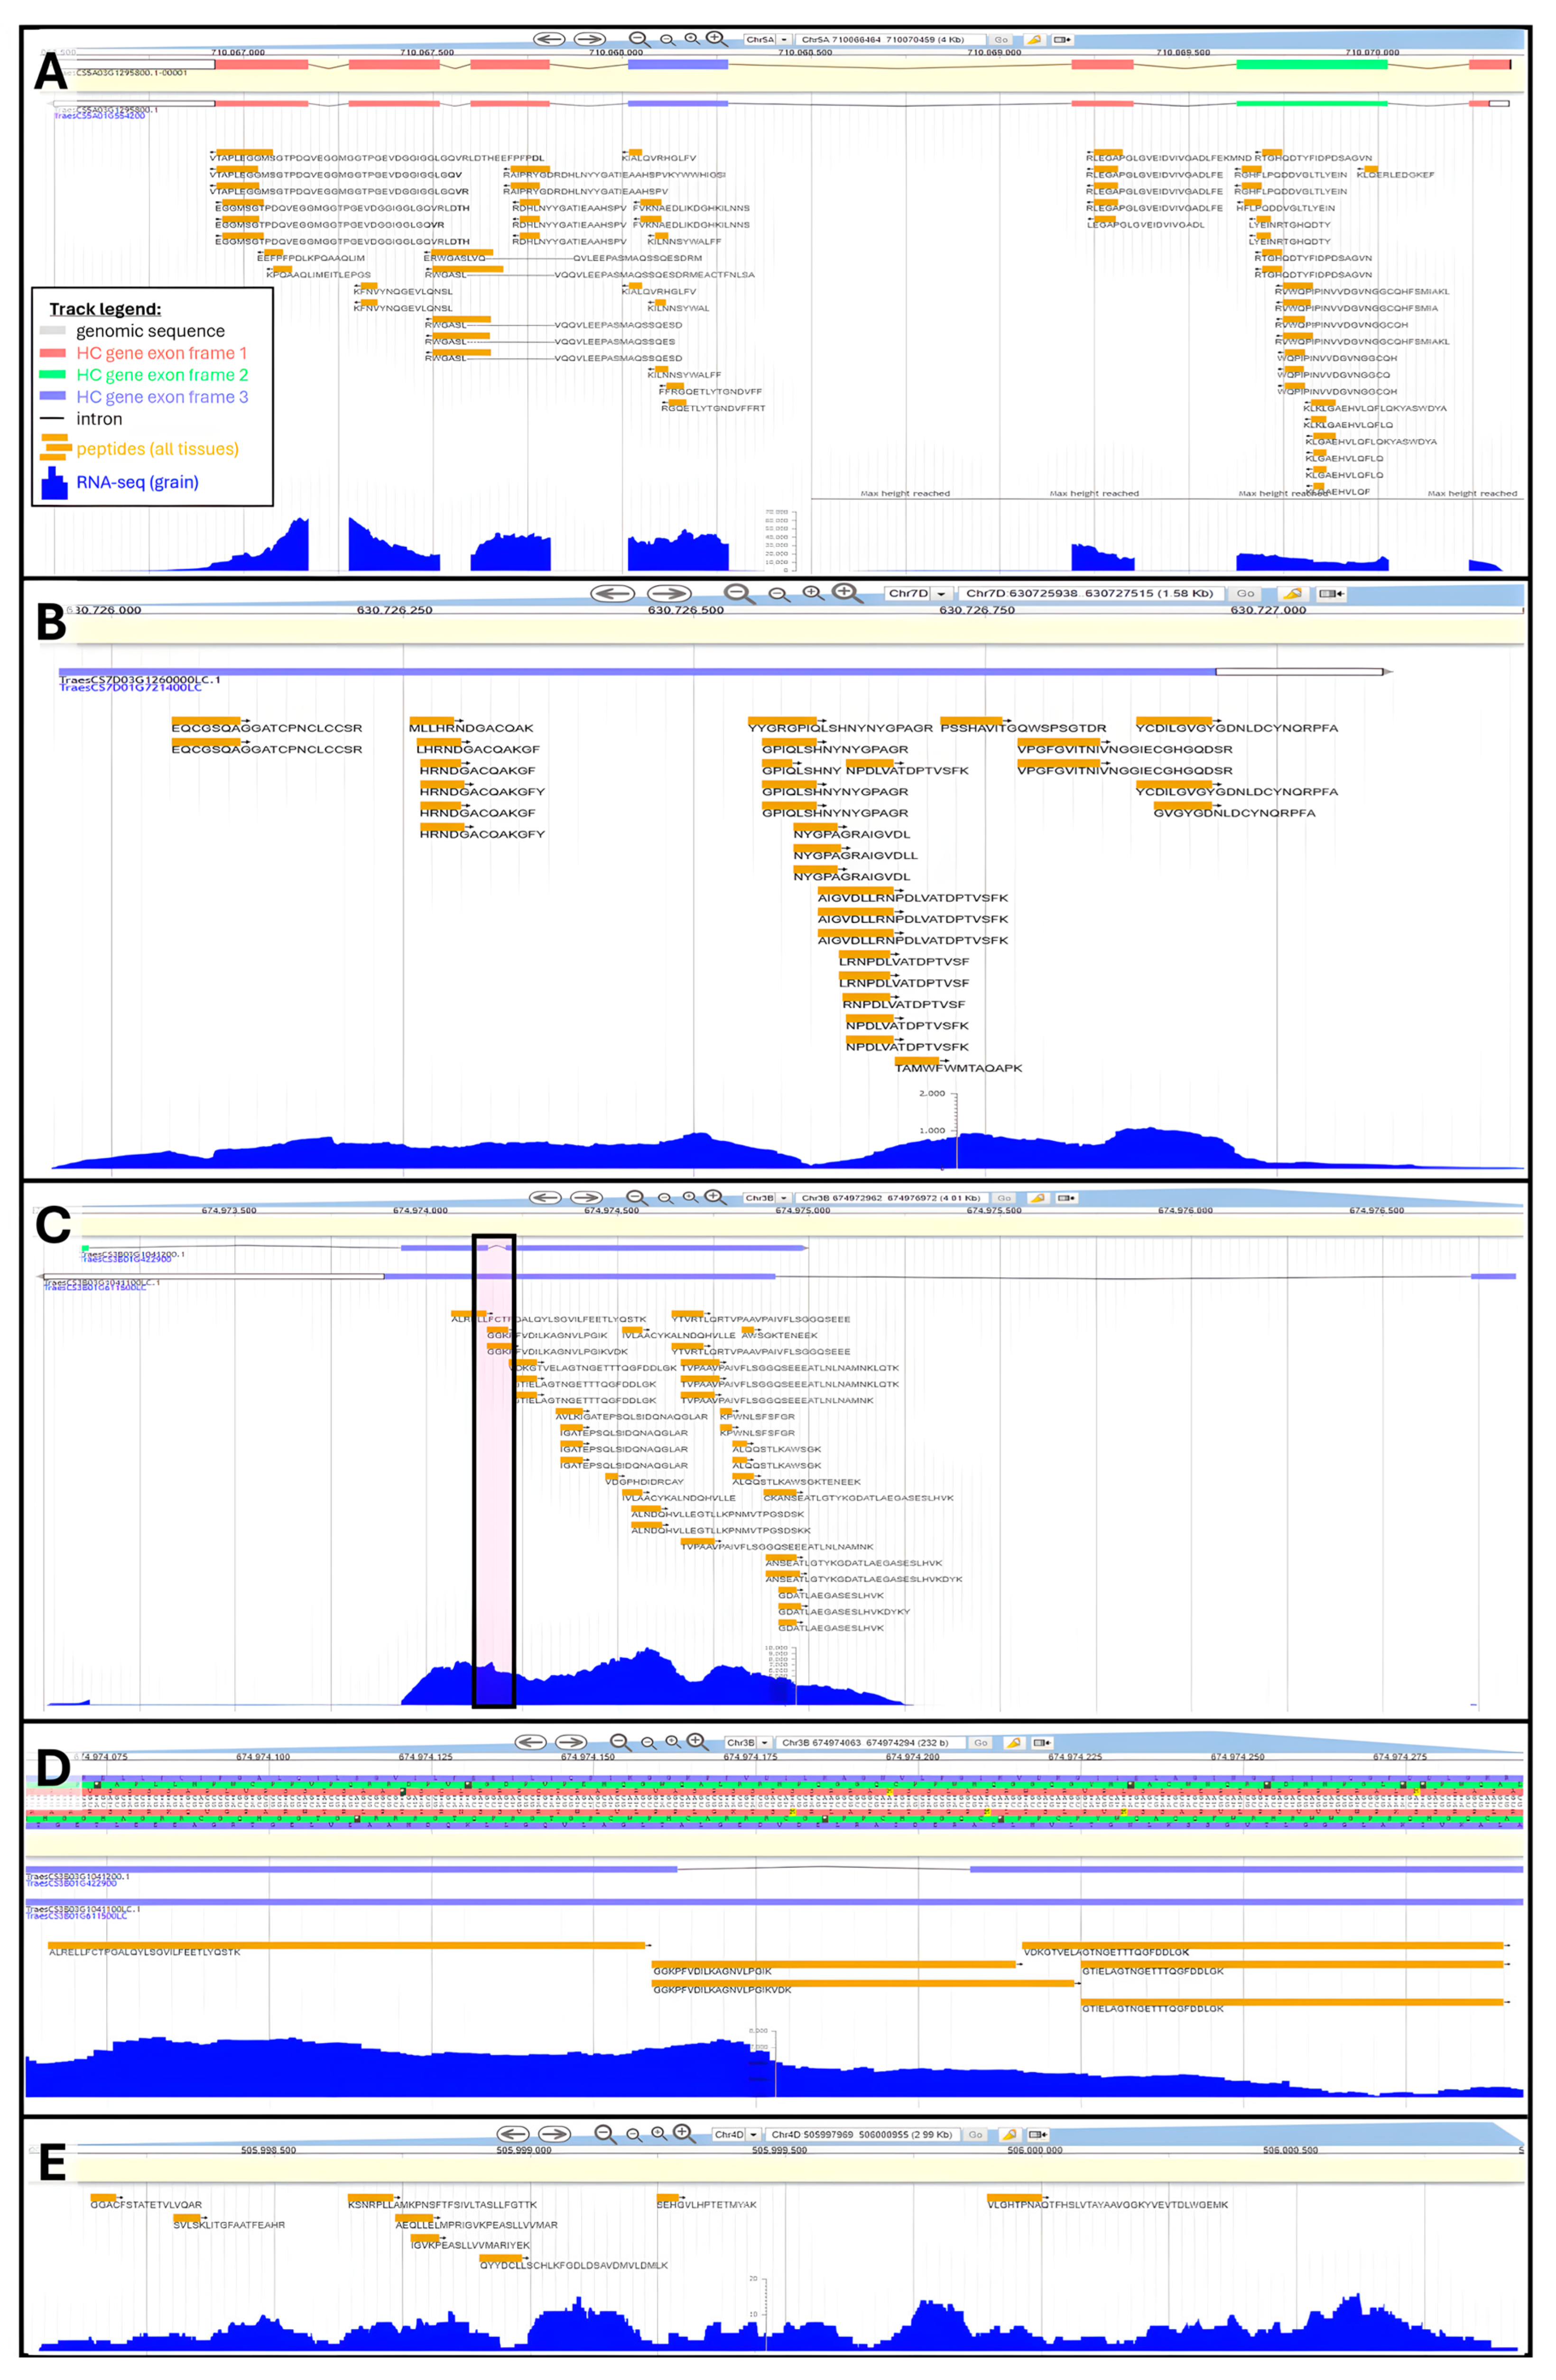
Figure 4.
Examples of peptide alignments to refine wheat genome annotation using Apollo Jbrowse Australia: (A) Validation of HC gene TraesCS5A03G451700. Inset shows track legend across all panels. (B) Promotion of LC gene TraesCS7D03G1260000LC to HC status. (C) Promotion of LC gene TraesCS3B03G1041100LC to HC status and amendment of underlying HC gene TraesCS3B03G1041200. Boxed area is zoomed-in on Panel (D). Panel (C) zoomed-in on intron. (E) Novel gene discovery exemplified at genomic position Chr4D:505997969..506000955.
A total of 6685 unique peptides were mapped against 3702 LC gene models, which should be promoted to HC status. Overall, 2.3% of all LC annotations were sanctioned by our results (Table 3), reaching 5% on chromosome 3B. We chose the LC gene TraesCS7D03G1260000LC to illustrate a proteogenome alignment (Figure 4B). This gene does not feature intronic areas and is well covered by the tBLASTn hits, particularly the second half of its sequence. In another instance, we raise a situation where peptide mapping not only supports the existence of an LC gene but also could be used to refine the annotation of an underlying HC gene. Figure 4C focuses on LC gene TraesCS3B03G1041100LC bearing a long exon followed by a much shorter exon. Peptide coverage was extensive along the 1st exon. At these genomic coordinates, HC gene TraesCS3B03G1041200 displaying a very short intron was also found, which is not endorsed by our mapping results, as peptides GGKPFVDILKAGNVLPGIK and GGKPFVDILKAGNVLPGIKVDK fully span this area and present no gap (Figure 4D). Furthermore, the intron was also marked by an abundant transcript expression. Therefore, HC gene TraesCS3B03G1041200 deserved to be reannotated. Similar examples can be found in this mapping result, and we hope the wheat community will explore our data and take the required steps to update genome annotations accordingly.
Finally, 2934 peptides could not be assigned any gene; we refer to these orphans as novel peptides. These novel peptides can be used to discover novel T. aestivum genes. We highlight this type of scenario on chromosome 4D genomic area 505997969 to 506000955, which featured eight unique peptides and sufficient levels of transcripts to presume the existence of a gene (Figure 4E).
In all, 37,314 HC and LC gene models were mapped and thus validated in our study. Duncan et al. employed a trypsin-based BU proteomics workflow and identified 15,779 wheat proteins across tissue_nb 3-29 [14]. Vincent et al. identified 8738 proteins from a few stored mature grains following a multiprotease digestion BU proteomics strategy [15] and, later on, screened 4061 stored grain samples using trypsin digestion, which yielded 8044 protein identities [16]. The present study successfully converted protein identities into genomic physical mapping. Our proteogenomic results should be used to update T. aestivum genome annotations.
2.3. Data Analysis of Mapped Peptides
The outputs from tBLASTn were quantitative thus lending themselves to statistics for identifying trends in alignment processes, which we handled using Python 3 Matplotlib and Seaborn packages extensive statistical and plotting capabilities.
2.3.1. Global Data Analysis
Global summary statistics showed that mapped peptides contained 8 to 108 AA residues (Supplementary Table S4). The tBLASTn score ranged from 61 to 353, and the percentage of identical matches (pident) varied from 30–100%, containing up to 20 mismatches, a maximum of three gap openings (gapopens), with the longest gap spanning 69 AAs (207 bp). A valuable statistics to assess the alignment confidence is the expectation value (e-value), which indicates the expected number of times the score would occur by chance [29]. Although e-value depends on database size, alignments with expectation values inferior to 0.001 can reliably be used to infer homology. In our study, e-values ranged from 0.01 to 6.03 × 10−42 with a Q1 of 2.8 × 10⁻¹¹, Q2 of 6.6 × 10⁻⁵, and Q3 of 1.8 × 10⁻⁴. Such e-values placed our hits as true homologs (e-value < 10 × 10−6) or closely related sequences (10 × 10−10 < e-value < 10 × 10−50).
We produced a correlation matrix on a subset of numerical variables to observe which ones were associated (Figure 5A).
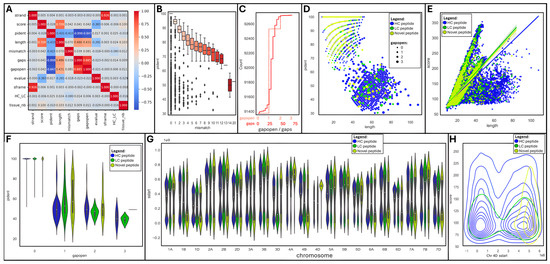
Figure 5.
Data visualization of tBLASTn outputs using JupyterLab Python 3 Seaborn and Matplotlib libraries: (A) Correlation matrix. (B) Boxplot of mismatch vs. pident. (C) Cumulative histograms of gaps and gapopens. (D) Scatter plot of length vs. pident per peptide type and gapopen size. (E) Lm plot of length vs. score per peptide type. (F) Violin plot of gapopen vs. pident per peptide type. (G) Violin plot of tissue vs. score. (H) Density plot of chromosome 4D sstart vs. score per peptide type.
Unsurprisingly, strands and reading frames (sframe) were very strongly positively correlated (R2 = 0.926); so were gap openings (gapopens) and sizes (gaps) (R2 = 0.885). Yet, they were not correlated with any other variable. Interestingly, peptide length was positively associated with score (R2 = 0.709), gap size (R2 = 0.486), and openings (R2 = 0.431), as well as negatively linked to identity percentage (R2 = −0.431) and e-value (R2 = −0.281). Moreover, the percentage of identical matches (pident) was strongly negatively correlated with gap size (R2 = −0.898) and number (R2 = −0.847), and to a lesser extent with the number of mismatches (R2 = −0.415).
A box plot further emphasized that the percentage of identical matches progressively diminished from 100 to 70% as the number of mismatches augmented, dropping down to 50% when mismatches exceeded 13 (Figure 5B). Most mapped peptides were gapless (91,259, 98%); 1254 (1.4%), 197 (0.2%), and 9 peptides hosted 1, 2, or 3 gaps, respectively (Figure 5C). Gap sizes oscillated between 1 and 69, with the greatest frequency from 24–37, thus only spanning short introns.
A pairgrid function enabled us to plot multiple aspects of our tBLASTn dataset in a single chart for a quick appraisal of the main variables (Supplementary Figure S3A). Some clear patterns appeared when peptide types were highlighted (HC, LC, or novel) and were further drilled into. A scatterplot of peptide length versus the percentage of identical matches (pident) highlighted a negative relationship between both variables; most novel peptides achieved high identity despite short sizes (Figure 5D). The introduction of gaps (gapopen) logically increased peptide lengths at the cost of sequence homology. An lmplot of length against score confirmed their strong positive correlation; short novel peptides were clustered and exhibited a wide range of scores (Figure 5E), despite high levels of identical matches (pident) as indicated above. The effect of gap introduction on sequence homology can be seen on a violin plot featuring gapopens versus pident, with a drastic drop in the percentage of identical matches as soon as a gap exists (Figure 5F).
Another violin plot showing the distribution of peptide starting position (sstart) per chromosome revealed a fairly homogenous pattern across all chromosomes regardless of peptide types (HC, LC, or novel) (Figure 5G), with the exception of chromosome 4D, which presented unusually high density of novel peptides towards its end tail.
2.3.2. Focus on Chromosome 4D
Looking in more detail at chromosome 4D via a distplot of peptide starting position (sstart) against scores further illustrated the conglomeration of novel peptides within the terminal region of the chromosome (Figure 5H). HC and LC peptides were homogenously distributed along the whole chromosome.
Visualizing the last 5.6 Mb of chromosome 4D in Apollo Jbrowse showed 143 novel peptides in this gene-depleted zone (Supplementary Figure S4A). By zooming into regions where transcripts are abundant, such as the 3.6 Kb area covering 515,319,968 to 515,323,561 and mapping 20 peptides, we can presume the existence of 1 or 2 candidate genes (Supplementary Figure S4B). Other likely candidate genes are outlined in regions 515873999–515890302 (16.3 Kb Supplementary Figure S4C) and 517010333–517013855 (3.52 Kb Supplementary Figure S4D).
We investigated whether a link existed between novel peptides and wheat tissues. All peptides mapped homogenously along the genome, as shown on the Circos plot (Figure 3) and more explicitly using box plots (Supplementary Figure S3B). When filtering the data to novel peptides only for all chromosomes, tissue differences appeared, as evidenced by the variation in quartiles (Supplementary Figure S3C). Peptide numbers ranged from 35 (young flag leaf) to 352 (mature root exc.). When focusing on novel peptides aligned along chromosome 4D only, the majority of tissues condensed novel peptides in the end-tail region of the chromosome, with the exception of grain developmental stage Z87 more widely distributed (Supplementary Figure S3D). Grain developmental stages Z83 (tissue_nb 3), Z70 (tissue_nb 6), pollen (tissue_nb 10), mature flag leaf (tissue_nb 18), young flag leaf (tissue_nb 22), root tip (tissue_nb 27), and root vasculature (tissue_nb 28) yielded very few novel peptides on chromosome 4D. Therefore, our results suggest that analyzing different organ types helped detect novel peptides.
3. Materials and Methods
The experimental design is schematized in Figure 1.
3.1. Raw Data Retrieval and Processing
3.1.1. Data Source, Conversion, and Redundancy Removal
T. aestivum genomic sequence (IWGSC RefSeq v2.1 [8]) was retrieved from https://urgi.versailles.inra.fr/download/iwgsc/IWGSC_RefSeq_Assemblies/v2.1/ (accessed on 25 August 2023) as a fasta file. Genome annotations were downloaded from https://urgi.versailles.inrae.fr/download/iwgsc/IWGSC_RefSeq_Annotations/v2.1/ (accessed on 25 August 2023) for HC and LC genes as gff3 files.
MS-proteomics outputs of [14,15,16] were accessed from the following public repositories: ProteomeXchange (https://www.proteomexchange.org/, accessed on 11 May 2024) dataset PXD004720 and MassIVE (https://massive.ucsd.edu/ProteoSAFe/static/massive.jsp, accessed on 11 May 2024) datasets MSV000088253 and MSV000090572. An example of LC-MS/MS spectrum is provided (Supplementary Figure S5). These recent studies represented the most extensive proteome coverage of 29 wheat tissues to date (Table 2).
Pep.xml files were downloaded directly into Galaxy Australia platform [21] version 24.1.2 using the “Upload data” and “Paste/Fetch data” tools and pasting the relevant FTP URLs. The pep.xml files were converted into tab-delimited text files using the “PepXML to Table” tool.
Tabular outputs were exported to MS Office 365 Excel. Decoy peptides were discarded and an index column with unique identifiers was added for tracking purposes. Redundant target peptide AA sequences were eliminated using the “Remove Duplicates” tool. Nonredundant peptides from each tissue were combined into a single table using the “Get Data From Folder” tool and were formatted into a fasta file using the index and the peptide AA sequence.
3.1.2. Database Creation and tBLASTn Search
Both peptide and wheat DNA fasta files were imported into Galaxy Australia platform [21] version 24.1.2 using the “Upload data” and “Choose local file” tools.
The genomic fasta file was converted into a BLAST database using the “NCBI BLAST+ makeblastdb” tool.
Several tBLASTn substitution matrices and gap costs were tested on test gene TraesCS4D03G0026600.1: BLOSUM45, BLOSUM90, PAM30, PAM250, with 5–21 existences and 1–3 extensions. Results are summarized in Table 1 and Supplementary Table S1. The tBLASTn search was performed on all unique peptide sequences against wheat genome using the “NCBI BLAST+ tblastn” tool [19,20] with the following optimized parameters: peptide fasta sequence as the query sequences, DNA blastdbn file as the nucleotide BLAST database, traditional tblastn as BLAST type, 0.01 expectation value cutoff, extended 25 columns tabular output, standard genetic code, PAM30 scoring matrix with gap costs existence 10 and extension 1, 3 maximum hits, 1 maximum HSP, 25% minimum coverage, and default-composition-based statistics.
The tBLASTn output was exported to be further processed in Excel and Python 3 and is available in Supplementary Table S2.
3.2. Peptide Mapping and Data Analysis
3.2.1. Gene Assignment
Wheat genome gff3 annotations were parsed in miniconda JupyterLab Python 3 (version 3.6.3) to extract gene names, chromosome names, LC or HC status, and gene start and end positions and saved as a CSV file. A Python 3 script was written to loop through each tBLASTn hit and, where possible, assign it to a gene if the chromosome names matched, the peptide start position was greater than the gene start position, and the peptide end position was smaller than the gene end position. Peptides that were not assigned to a gene were deemed “novel”.
3.2.2. Peptide Physical Mapping Using Genome Browsers
Relevant columns from the tBLASTn output (saccver, sstart, send, qseq, score, strand) were extracted to create BED files for each individual tissue, as well as combined into one single file. BED files were permanently uploaded into the bread wheat Apollo Jbrowse server (uploaded on 21 June 2024 at https://bread-wheat-um.genome.edu.au/apollo/49826/jbrowse/) [26] under the label “Proteome hit (tBlastn)”.
The genomic sequence, GFF3, and BED files were also uploaded into a locally installed Integrated Genome Browser (IGB) [25] (https://www.bioviz.org/, accessed on 15 May 2024) for further visualization.
3.2.3. Peptide Physical Mapping Using Circos
Relevant columns from the tBLASTn output (saccver, sstart, send) were extracted to create TXT files for each individual tissue. The wheat karyotype TXT file was created by retrieving the genomic start and end positions of each chromosome. Centromere positions were obtained from [7].
The files were imported into Galaxy Australia platform [21] using the “Upload data” and “Choose local file” tools. The circular plot was produced using the “Circos” tool [27,28] and each tissue as a 2D Data Plot and plot types set to “Highlight”.
3.2.4. Mathematical Mapping of Peptides against TraesCS4D03G0026600.1 Gene
The 62 mascot-identified peptides obtained from [15,16] and assigned to HC gene TraesCS4D03G0026600.1 were retrieved along with their start and end position in the protein AA sequence. The gene structure was extracted from GFF3 file and the positions of the 5 exons and 4 introns were computed in miniconda JupyterLab Python 3. A Python script was written to loop through each peptide and mathematically convert the AA coordinates into nucleotide coordinates by considering the genomic position and size of exons and introns. The output was exported as CSV and BED files.
The tBLASTn peptide hits assigned to TraesCS4D03G0026600.1 gene were extracted and saved as CSV and BED files.
Both BED files were uploaded into the bread wheat Apollo Jbrowse server for comparison purposes. Both CSV files were combined into Supplementary Table S3.
Various physicochemical parameters for TraesCS4D03G0026600.1 peptides were computed based on AA squences using BioPython SeqUtils ProtParam module: length, MW, GRAVY, aromaticity, and isoelectric point (pI).
3.2.5. Data Analysis, Statistics, and Visualization
The tBLASTn output was imported into miniconda JupyterLab Python 3 (version 3.6.3) and converted into a pandas dataframe. Descriptive statistics were produced using the pandas method “.describe()” and consigned to Supplementary Table S4.
Correlation matrix and all charts (boxplot, violin plot, lmplot, scatterplot, hitsplot distplot, pairgrid, and joinplot) were generated using matplotlib and seaborn libraries.
Our Jupyter Notebook Python code is publicly available via GitHub (uploaded on 4 August 2024 at https://github.com/dlf2024/Python_Wheat_Proteogenomics).
4. Conclusions
To our knowledge, this is the largest proteogenomics study tackled in a single experiment. In this work, we optimized tBLASTn parameters to align 861,759 unique peptides along IWGSC RefSeq 2.1 genome. Of the 92,719 hits, 89,785 (97%) confirmed the existence of 37,314 HC and LC gene models. Of these, 83,015 unique peptides aligned along 33,612 HC genes, thus validating 31.4% of all HC gene models. Additionally, 6685 unique peptides mapped against 3702 LC gene models (2.3% of all LC annotations), thus deserving HC promotion. The remaining 2934 novel peptides should be used for gene discovery. We supply all our results as a resource for the wheat community, and we hope that IWGSC will use our data to refine T. aestivum genome annotation.
A large proportion of peptides (89%) did not produce a hit, among those were peptides exhibiting a reading frame shift mid-sequence. We urge developers to further improve BLAST+ program so that short peptides and peptides covering frame shifts can reliably return hits. We provide a relatively simple workflow that can be applied to any other BU proteomics datasets and hopefully expand this resource with proteins and peptides from biotically and abiotically stressed samples.
Supplementary Materials
The supporting information can be downloaded at https://www.mdpi.com/article/10.3390/ijms25168614/s1.
Author Contributions
Conceptualization, D.V. and R.A.; methodology, D.V.; software, D.V.; validation, D.V.; formal analysis, D.V.; investigation, D.V.; resources, D.V.; data curation, D.V.; writing—original draft preparation, D.V.; writing—review and editing, D.V. and R.A.; visualization, D.V.; supervision, D.V.; project administration, D.V.; permanent upload of proteogenomic peptides to Apollo Jbrowse: R.A. All authors have read and agreed to the published version of the manuscript.
Funding
This research received no funding.
Data Availability Statement
All the results reported in this study are available as Supplementary Files, including all peptide mapping BED files for upload in IGB or T. aestivum Apollo Jbrowse repository (https://bread-wheat-um.genome.edu.au/apollo/49826/jbrowse/), The Python code and Galaxy workflow, as well as BED files are available on GitHub (https://github.com/dlf2024/Python_Wheat_Proteogenomics).
Acknowledgments
The authors acknowledge the valuable assistance provided by colleagues in the Australia BioCommons (https://www.biocommons.org.au/team) to import and manage the wheat proteome data. In particular, we thank Mike Thang, for uploading peptide BED files to bread wheat Apollo Jbrowse server and thus enabling the viewing of proteogenomics results to the wider community.
Conflicts of Interest
The authors declare no conflicts of interest.
Abbreviations
AA, amino acid; BED, Browser Extensible Data; BLAST, Basic Local Alignment Search Tool; BLOSUM, BLOcks SUbstitution Matrix; BU, bottom-up; CPU, central processing unit; DNA, deoxyribonucleic acid; e-value, expectation value; ESI, electron spray ionization; FDR, false discovery rate; gapopen, number of gap openings; GRAVY, Grand Average of Hydrophobicity; HC, High Confidence; HPLC, high-performance liquid chromatography; IGB, Integrated Genome Browser; IWGSC, International Wheat Genome Sequencing Consortium; LC, Low Confidence; MS, mass spectrometry; MS/MS, tandem mass spectrometry; MW, molecular weight; PAM, Point Accepted Mutation; pI, isoelectric point; pident, percentage of identical matches; PTM, post-translational modification; RefSeq, reference sequence; RNA, ribonucleic acid; send, end of BLAST alignment in subject (database hit); sframe, reading frame; sstart, start of BLAST alignment in subject (database hit).
References
- Shewry, P.R. Wheat. J. Exp. Bot. 2009, 60, 1537–1553. [Google Scholar] [CrossRef] [PubMed]
- El Baidouri, M.; Murat, F.; Veyssiere, M.; Molinier, M.; Flores, R.; Burlot, L.; Alaux, M.; Quesneville, H.; Pont, C.; Salse, J. Reconciling the Evolutionary Origin of Bread Wheat (Triticum aestivum). New Phytol. 2017, 213, 1477–1486. [Google Scholar] [CrossRef] [PubMed]
- Venske, E.; Dos Santos, R.S.; Busanello, C.; Gustafson, P.; Costa De Oliveira, A. Bread Wheat: A Role Model for Plant Domestication and Breeding. Hereditas 2019, 156, 16. [Google Scholar] [CrossRef] [PubMed]
- Bentley, A.R.; Donovan, J.; Sonder, K.; Baudron, F.; Lewis, J.M.; Voss, R.; Rutsaert, P.; Poole, N.; Kamoun, S.; Saunders, D.G.O.; et al. Near- to Long-Term Measures to Stabilize Global Wheat Supplies and Food Security. Nat. Food 2022, 3, 483–486. [Google Scholar] [CrossRef] [PubMed]
- The International Wheat Genome Sequencing Consortium (IWGSC); Appels, R.; Eversole, K.; Stein, N.; Feuillet, C.; Keller, B.; Rogers, J.; Pozniak, C.J.; Choulet, F.; Distelfeld, A.; et al. Shifting the Limits in Wheat Research and Breeding Using a Fully Annotated Reference Genome. Science 2018, 361, eaar7191. [Google Scholar] [CrossRef]
- Guan, J.; Garcia, D.F.; Zhou, Y.; Appels, R.; Li, A.; Mao, L. The Battle to Sequence the Bread Wheat Genome: A Tale of the Three Kingdoms. Genom. Proteom. Bioinform. 2020, 18, 221–229. [Google Scholar] [CrossRef] [PubMed]
- Alonge, M.; Shumate, A.; Puiu, D.; Zimin, A.V.; Salzberg, S.L. Chromosome-Scale Assembly of the Bread Wheat Genome Reveals Thousands of Additional Gene Copies. Genetics 2020, 216, 599–608. [Google Scholar] [CrossRef]
- Zhu, T.; Wang, L.; Rimbert, H.; Rodriguez, J.C.; Deal, K.R.; De Oliveira, R.; Choulet, F.; Keeble-Gagnère, G.; Tibbits, J.; Rogers, J.; et al. Optical Maps Refine the Bread Wheat Triticum aestivum Cv. Chinese Spring Genome Assembly. Plant J. 2021, 107, 303–314. [Google Scholar] [CrossRef]
- Hussain, B.; Akpınar, B.A.; Alaux, M.; Algharib, A.M.; Sehgal, D.; Ali, Z.; Aradottir, G.I.; Batley, J.; Bellec, A.; Bentley, A.R.; et al. Capturing Wheat Phenotypes at the Genome Level. Front. Plant Sci. 2022, 13, 851079. [Google Scholar] [CrossRef]
- Nesvizhskii, A.I. Proteogenomics: Concepts, Applications and Computational Strategies. Nat. Methods 2014, 11, 1114–1125. [Google Scholar] [CrossRef] [PubMed]
- Dupree, E.J.; Jayathirtha, M.; Yorkey, H.; Mihasan, M.; Petre, B.A.; Darie, C.C. A Critical Review of Bottom-Up Proteomics: The Good, the Bad, and the Future of This Field. Proteomes 2020, 8, 14. [Google Scholar] [CrossRef] [PubMed]
- Raj, A.; Aggarwal, S.; Kumar, D.; Yadav, A.K.; Dash, D. Proteogenomics 101: A Primer on Database Search Strategies. J. Proteins Proteom. 2023, 14, 287–301. [Google Scholar] [CrossRef]
- Song, Y.-C.; Das, D.; Zhang, Y.; Chen, M.-X.; Fernie, A.R.; Zhu, F.-Y.; Han, J. Proteogenomics-Based Functional Genome Research: Approaches, Applications, and Perspectives in Plants. Trends Biotechnol. 2023, 41, 1532–1548. [Google Scholar] [CrossRef] [PubMed]
- Duncan, O.; Trösch, J.; Fenske, R.; Taylor, N.L.; Millar, A.H. Resource: Mapping the Triticum aestivum Proteome. Plant J. 2017, 89, 601–616. [Google Scholar] [CrossRef] [PubMed]
- Vincent, D.; Bui, A.; Ram, D.; Ezernieks, V.; Bedon, F.; Panozzo, J.; Maharjan, P.; Rochfort, S.; Daetwyler, H.; Hayden, M. Mining the Wheat Grain Proteome. Int. J. Mol. Sci. 2022, 23, 713. [Google Scholar] [CrossRef]
- Vincent, D.; Bui, A.; Ezernieks, V.; Shahinfar, S.; Luke, T.; Ram, D.; Rigas, N.; Panozzo, J.; Rochfort, S.; Daetwyler, H.; et al. A Community Resource to Mass Explore the Wheat Grain Proteome and Its Application to the Late-Maturity Alpha-Amylase (LMA) Problem. GigaScience 2023, 12, giad084. [Google Scholar] [CrossRef] [PubMed]
- Altschul, S.F.; Gish, W.; Miller, W.; Myers, E.W.; Lipman, D.J. Basic Local Alignment Search Tool. J. Mol. Biol. 1990, 215, 403–410. [Google Scholar] [CrossRef]
- Gertz, E.M.; Yu, Y.-K.; Agarwala, R.; Schäffer, A.A.; Altschul, S.F. Composition-Based Statistics and Translated Nucleotide Searches: Improving the TBLASTN Module of BLAST. BMC Biol. 2006, 4, 41. [Google Scholar] [CrossRef]
- Camacho, C.; Coulouris, G.; Avagyan, V.; Ma, N.; Papadopoulos, J.; Bealer, K.; Madden, T.L. BLAST+: Architecture and Applications. BMC Bioinform. 2009, 10, 421. [Google Scholar] [CrossRef]
- Cock, P.J.A.; Chilton, J.M.; Grüning, B.; Johnson, J.E.; Soranzo, N. NCBI BLAST+ Integrated into Galaxy. Gigascience 2015, 4, 39. [Google Scholar] [CrossRef]
- The Galaxy Community; Abueg, L.A.L.; Afgan, E.; Allart, O.; Awan, A.H.; Bacon, W.A.; Baker, D.; Bassetti, M.; Batut, B.; Bernt, M.; et al. The Galaxy Platform for Accessible, Reproducible, and Collaborative Data Analyses: 2024 Update. Nucleic Acids Res. 2024, 52, gkae410. [Google Scholar] [CrossRef]
- Dayhoff, M.O.; Schwarts, R.M.; Orcutt, B.C. A Model of Evolutionary Change in Proteins. In Atlas of Protein Sequence and Structure; National Biomedical Research Foundation: Washington, DC, USA, 1978; Volume 5, pp. 345–352. [Google Scholar]
- Henikoff, S.; Henikoff, J.G. Amino Acid Substitution Matrices from Protein Blocks. Proc. Natl. Acad. Sci. USA 1992, 89, 10915–10919. [Google Scholar] [CrossRef] [PubMed]
- Carroll, H.; Clement, M.J.; Ridge, P.; Snell, Q.O. Effects of Gap Open and Gap Extension Penalties. Fac. Publ. 2006, 290, 19–23. [Google Scholar]
- Freese, N.H.; Norris, D.C.; Loraine, A.E. Integrated Genome Browser: Visual Analytics Platform for Genomics. Bioinformatics 2016, 32, 2089–2095. [Google Scholar] [CrossRef] [PubMed]
- Dunn, N.A.; Unni, D.R.; Diesh, C.; Munoz-Torres, M.; Harris, N.L.; Yao, E.; Rasche, H.; Holmes, I.H.; Elsik, C.G.; Lewis, S.E. Apollo: Democratizing Genome Annotation. PLoS Comput. Biol. 2019, 15, e1006790. [Google Scholar] [CrossRef]
- Krzywinski, M.; Schein, J.; Birol, İ.; Connors, J.; Gascoyne, R.; Horsman, D.; Jones, S.J.; Marra, M.A. Circos: An Information Aesthetic for Comparative Genomics. Genome Res. 2009, 19, 1639–1645. [Google Scholar] [CrossRef]
- Rasche, H.; Hiltemann, S. Galactic Circos: User-Friendly Circos Plots within the Galaxy Platform. GigaScience 2020, 9, giaa065. [Google Scholar] [CrossRef]
- Pearson, W.R. An Introduction to Sequence Similarity (“Homology”) Searching. Curr. Protoc. Bioinform. 2013, 42. [Google Scholar] [CrossRef]

Disclaimer/Publisher’s Note: The statements, opinions and data contained in all publications are solely those of the individual author(s) and contributor(s) and not of MDPI and/or the editor(s). MDPI and/or the editor(s) disclaim responsibility for any injury to people or property resulting from any ideas, methods, instructions or products referred to in the content. |
© 2024 by the authors. Licensee MDPI, Basel, Switzerland. This article is an open access article distributed under the terms and conditions of the Creative Commons Attribution (CC BY) license (https://creativecommons.org/licenses/by/4.0/).