
Candidate Signature miRNAs from Secreted miRNAome of Human Lung Microvascular Endothelial Cells in Response to Different Oxygen Conditions: A Pilot Study
 , ,
, ,  , and
, and
Abstract
:1. Introduction
2. Results
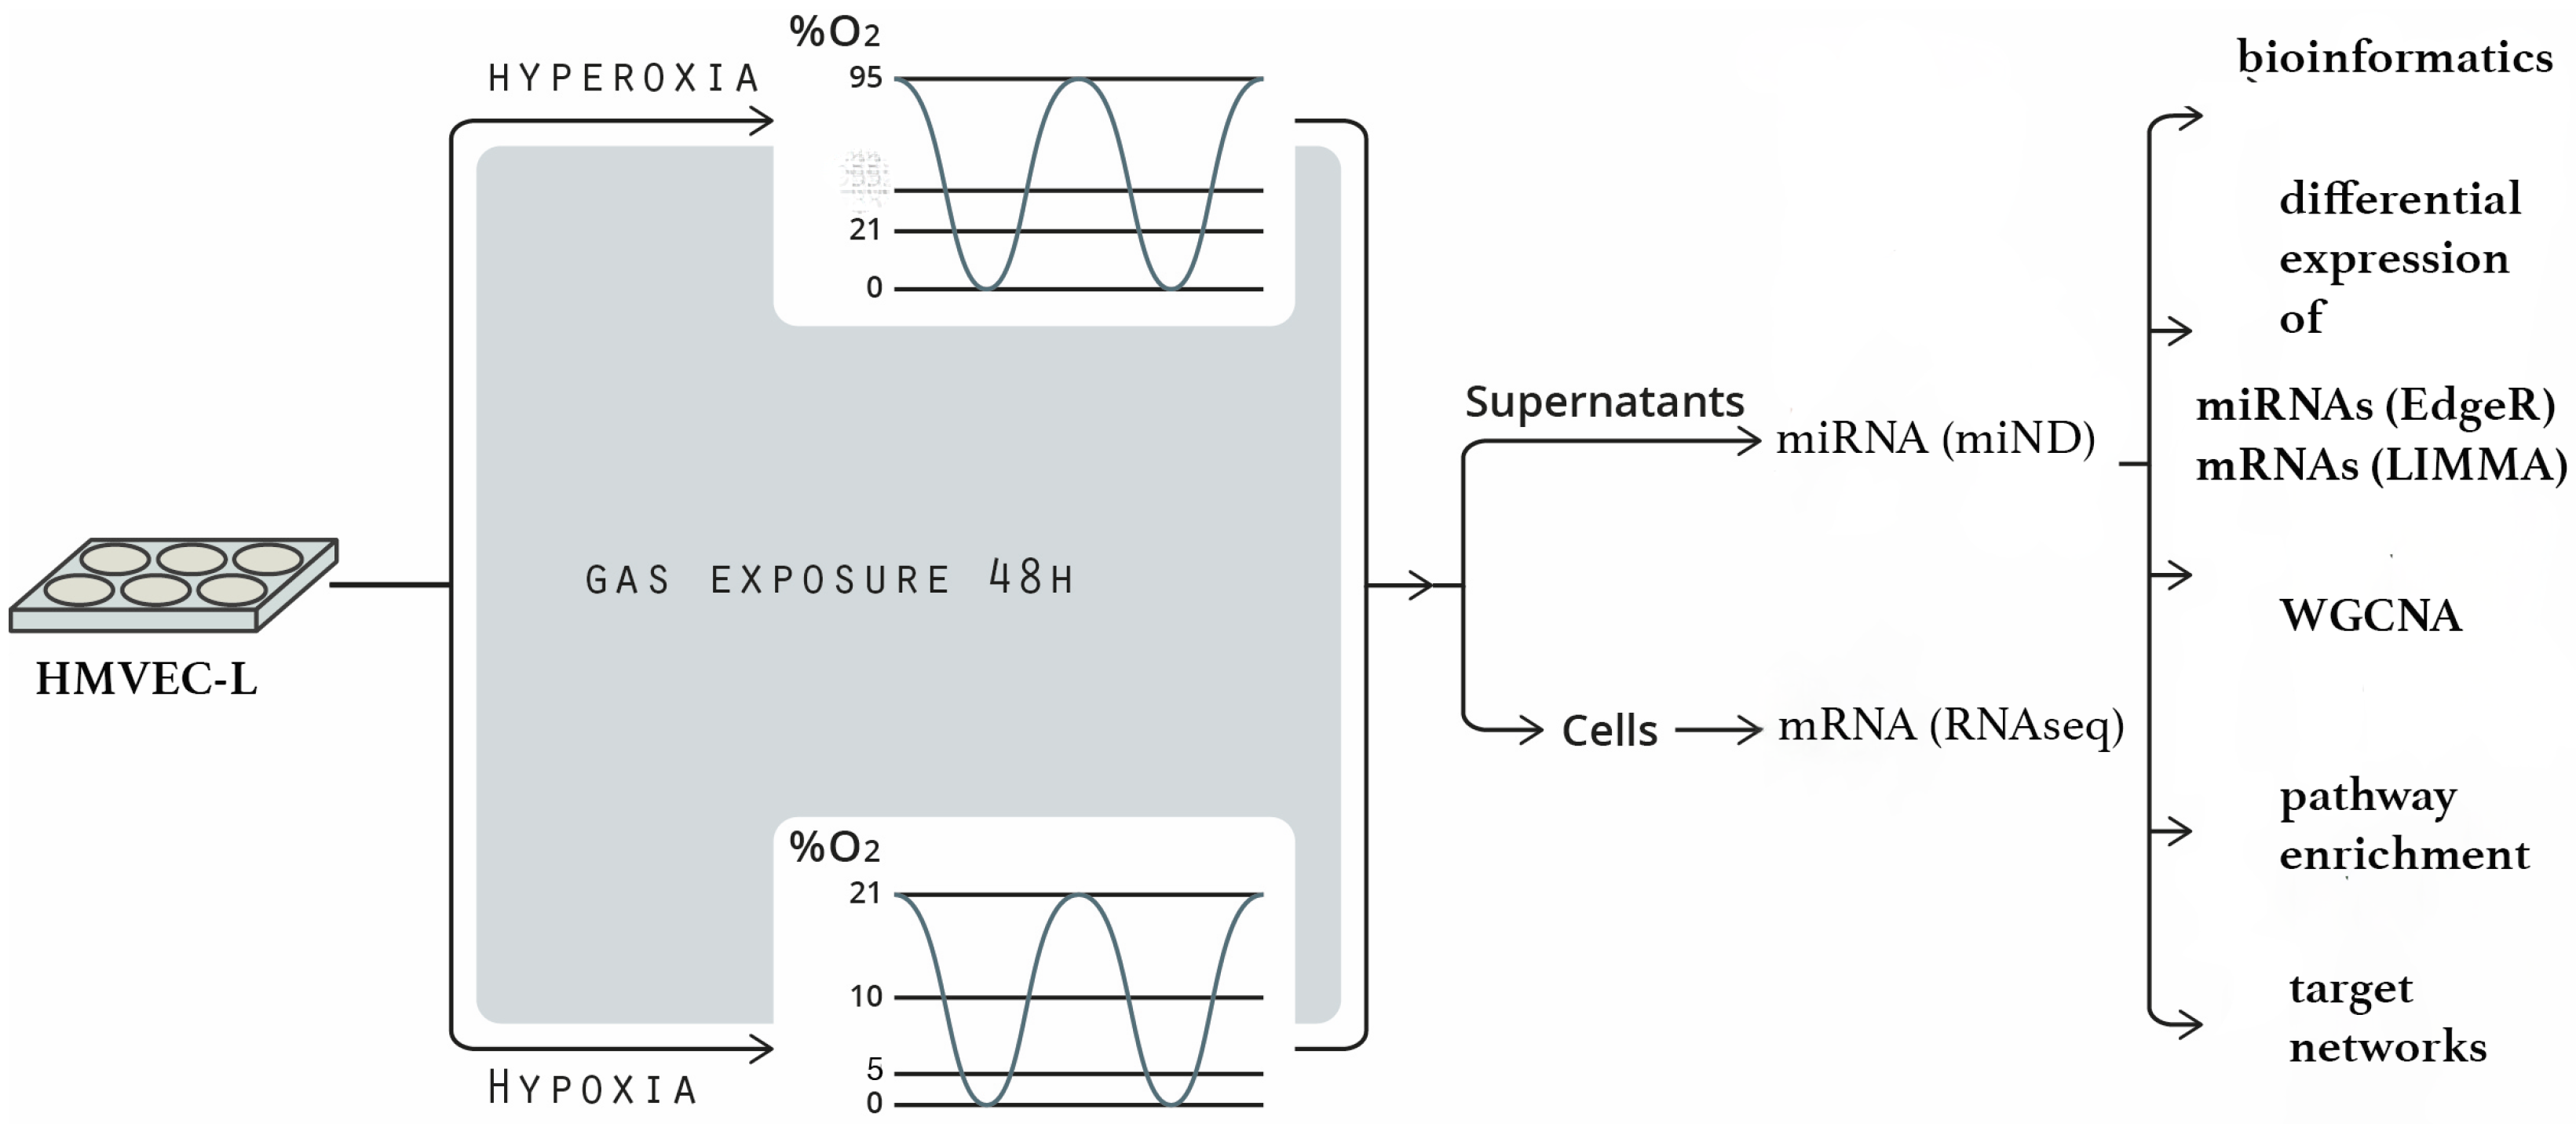
2.1. Workflow
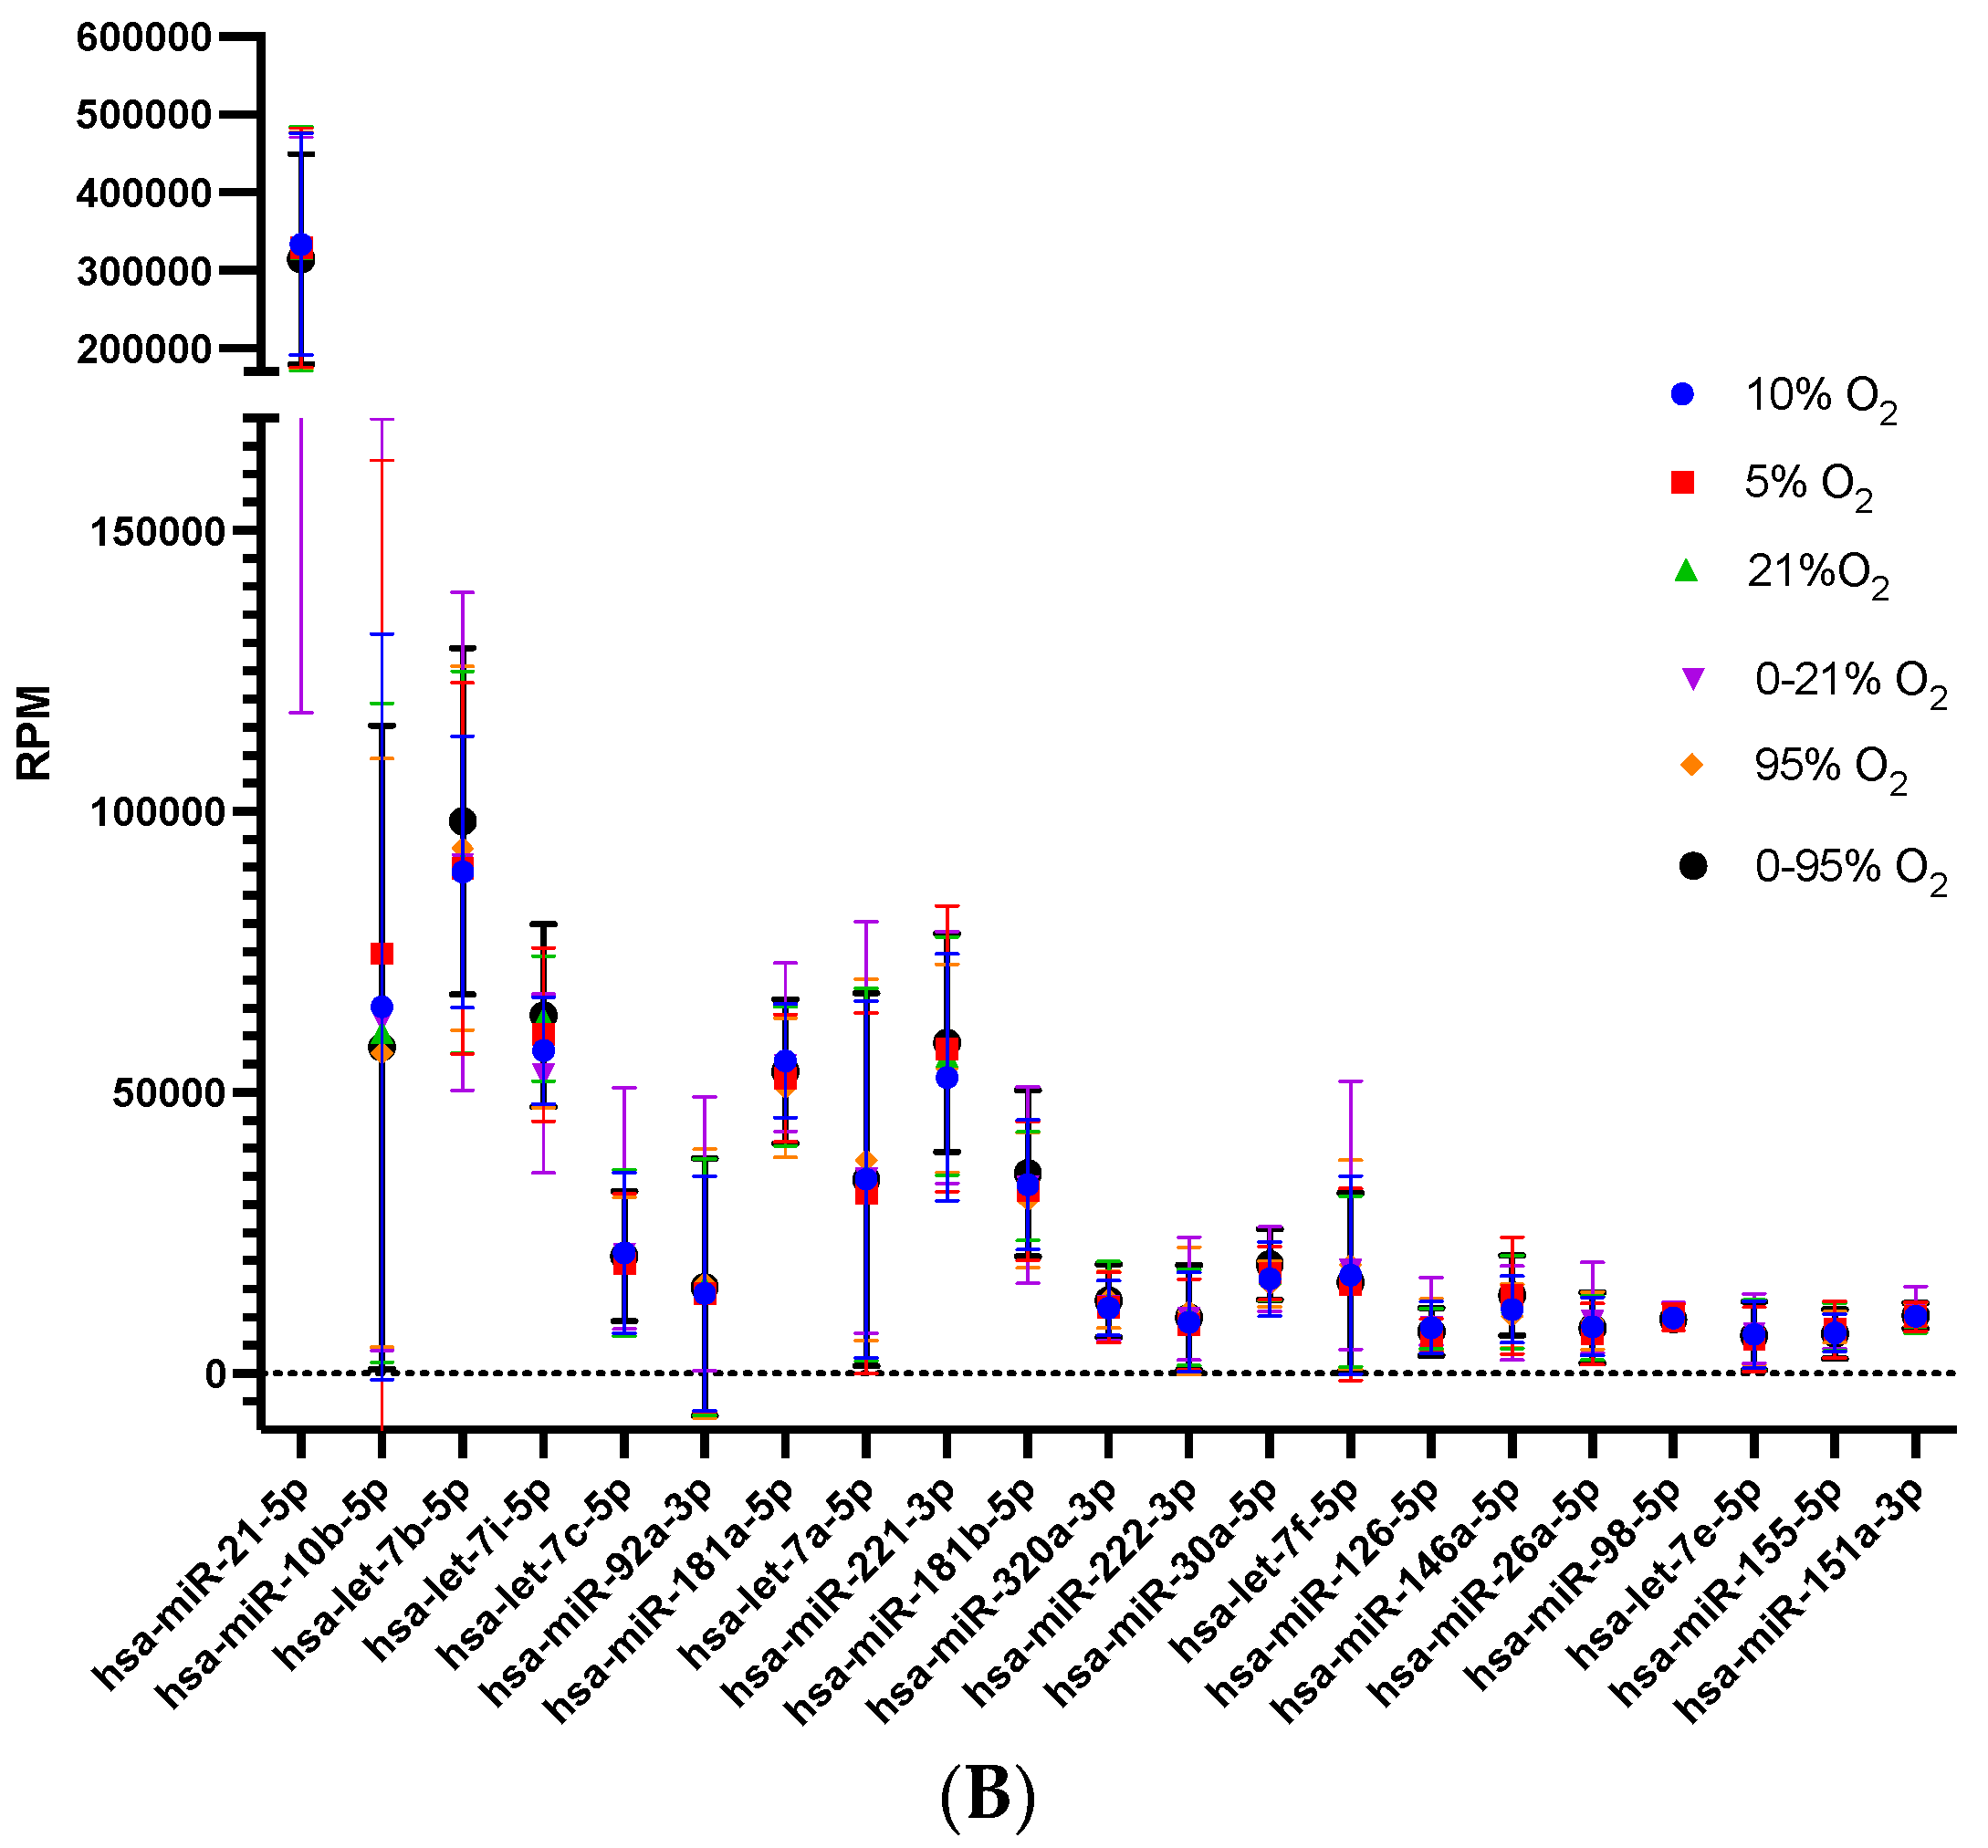
2.2. Characterization of Secreted miRNA during Different Oxygen Conditions
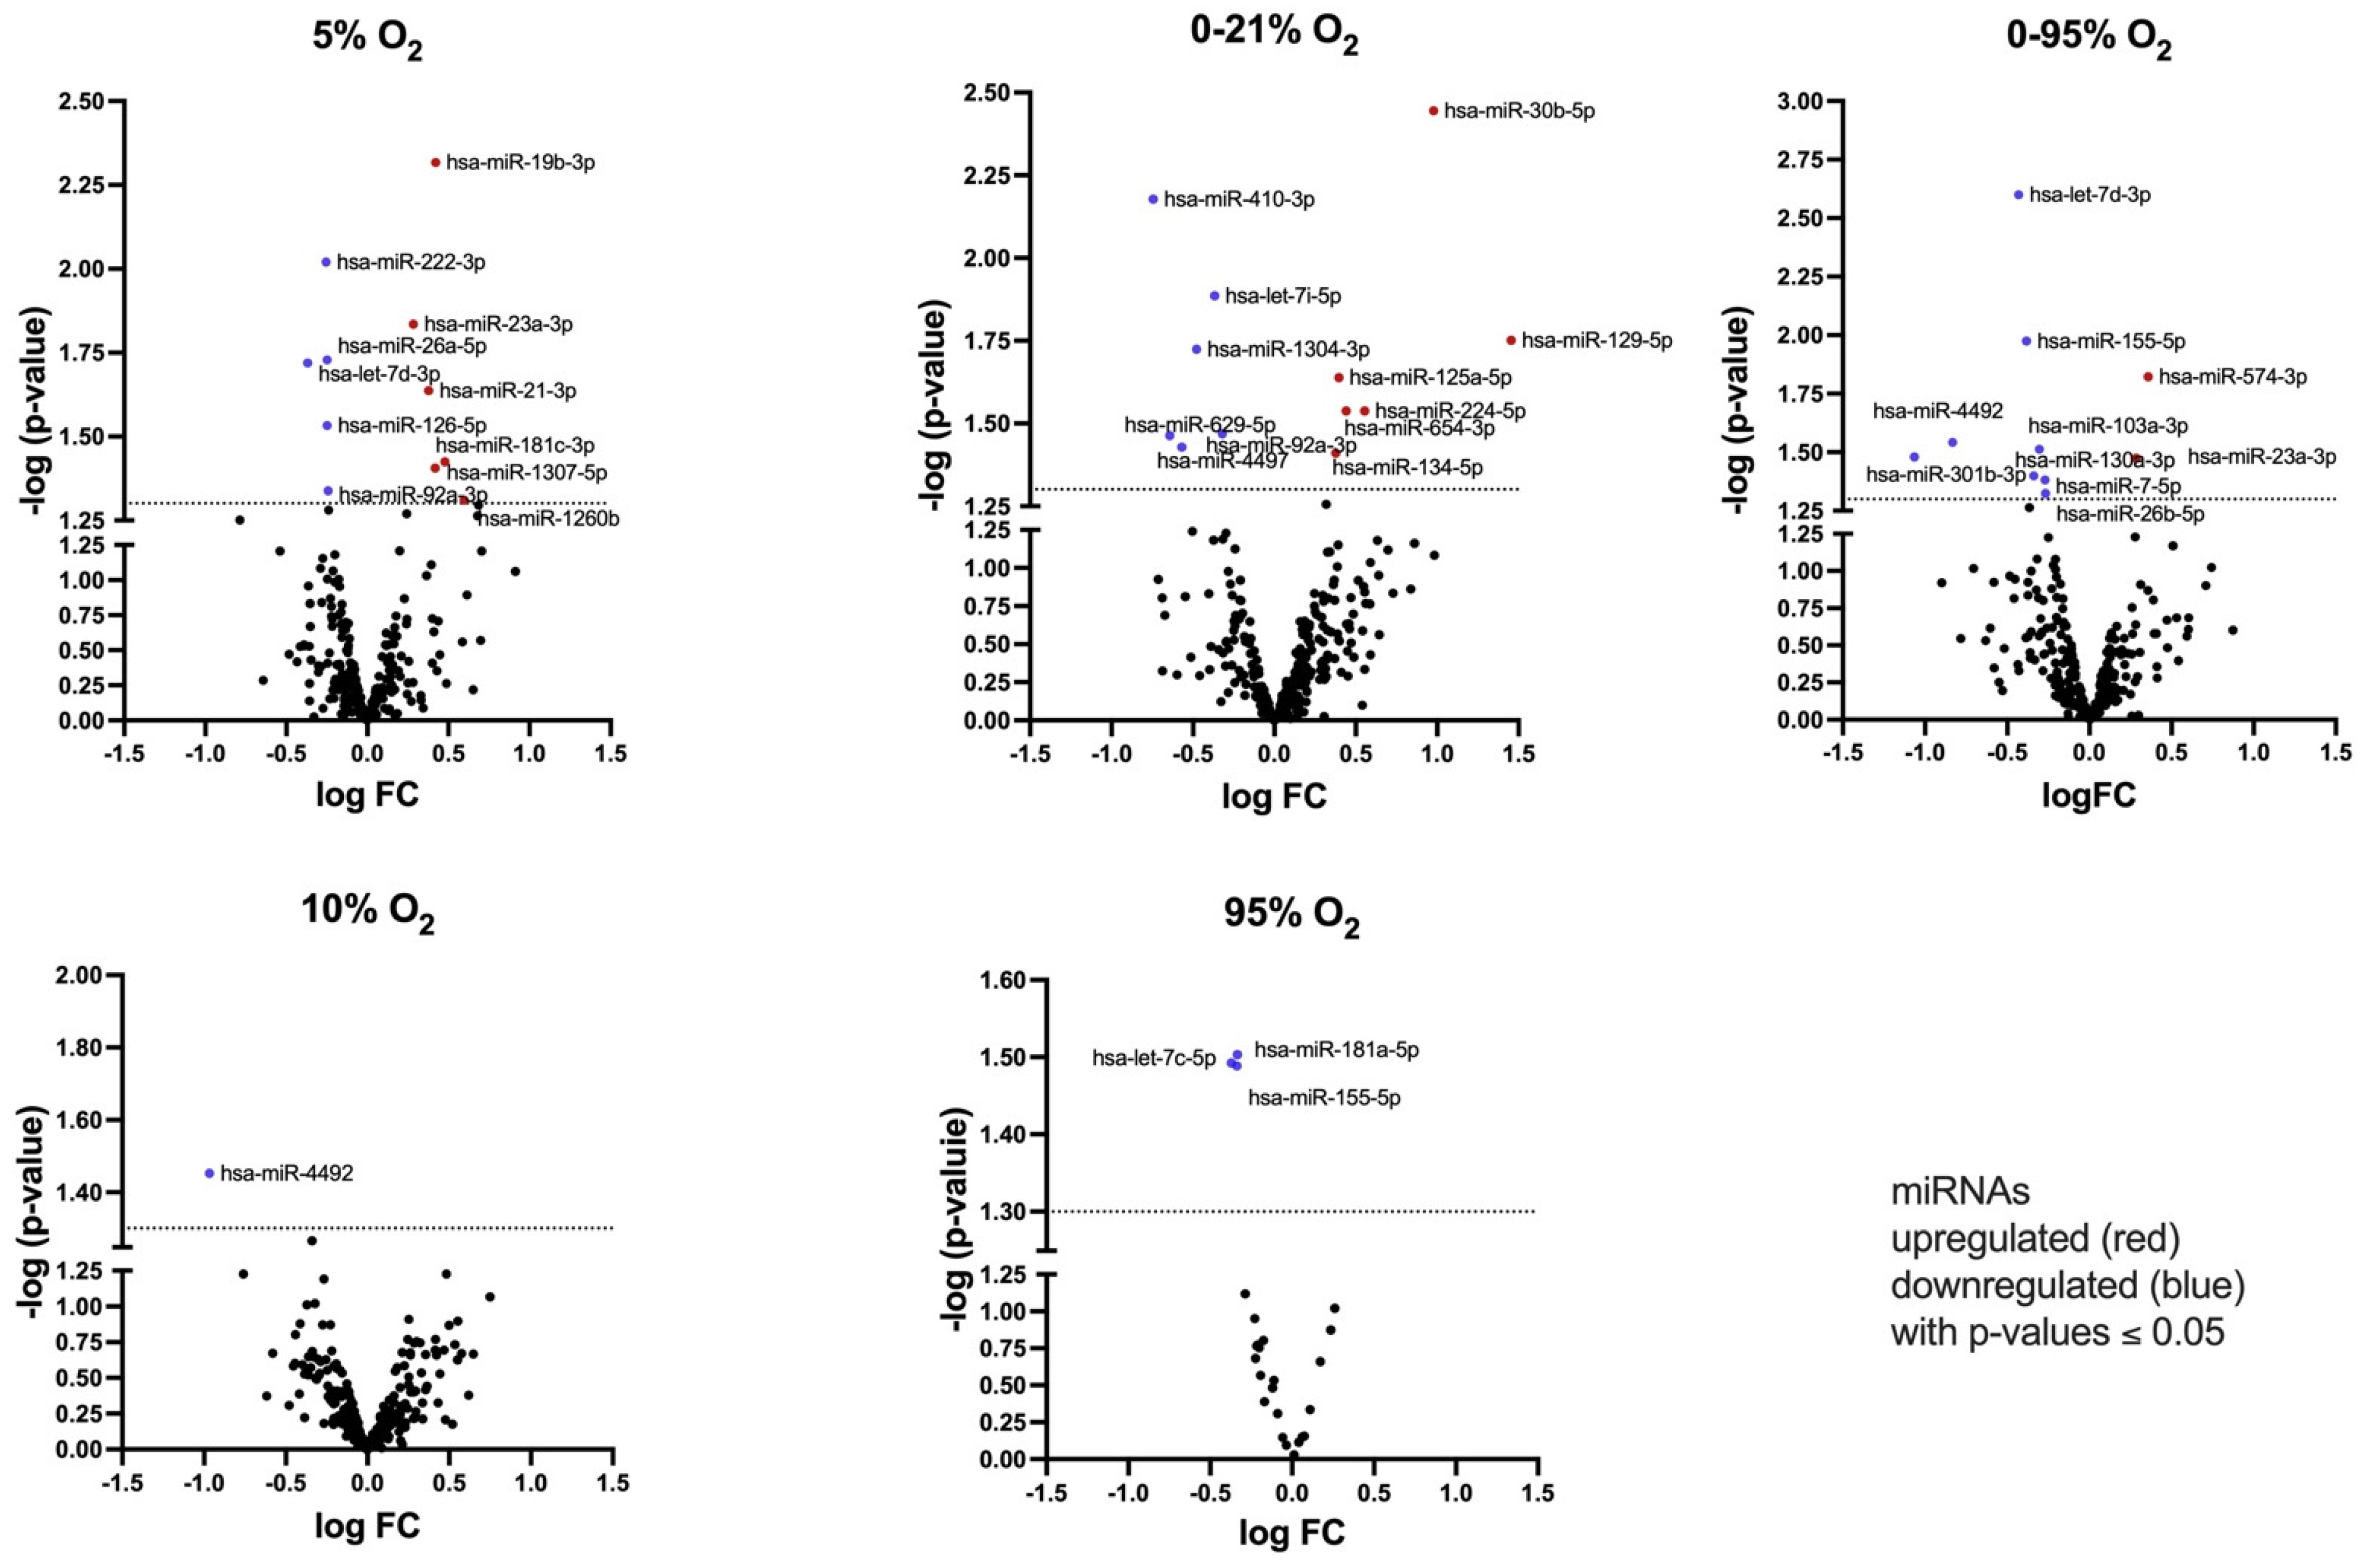
2.3. Identification of Secreted miRNA Subsets in Response to Different Oxygen Conditions
2.4. RNA Sequencing from the Mother Cells of the Secretome
2.5. Comparison of Cellular Signaling in Response to O2 Oscillations with Different Amplitudes
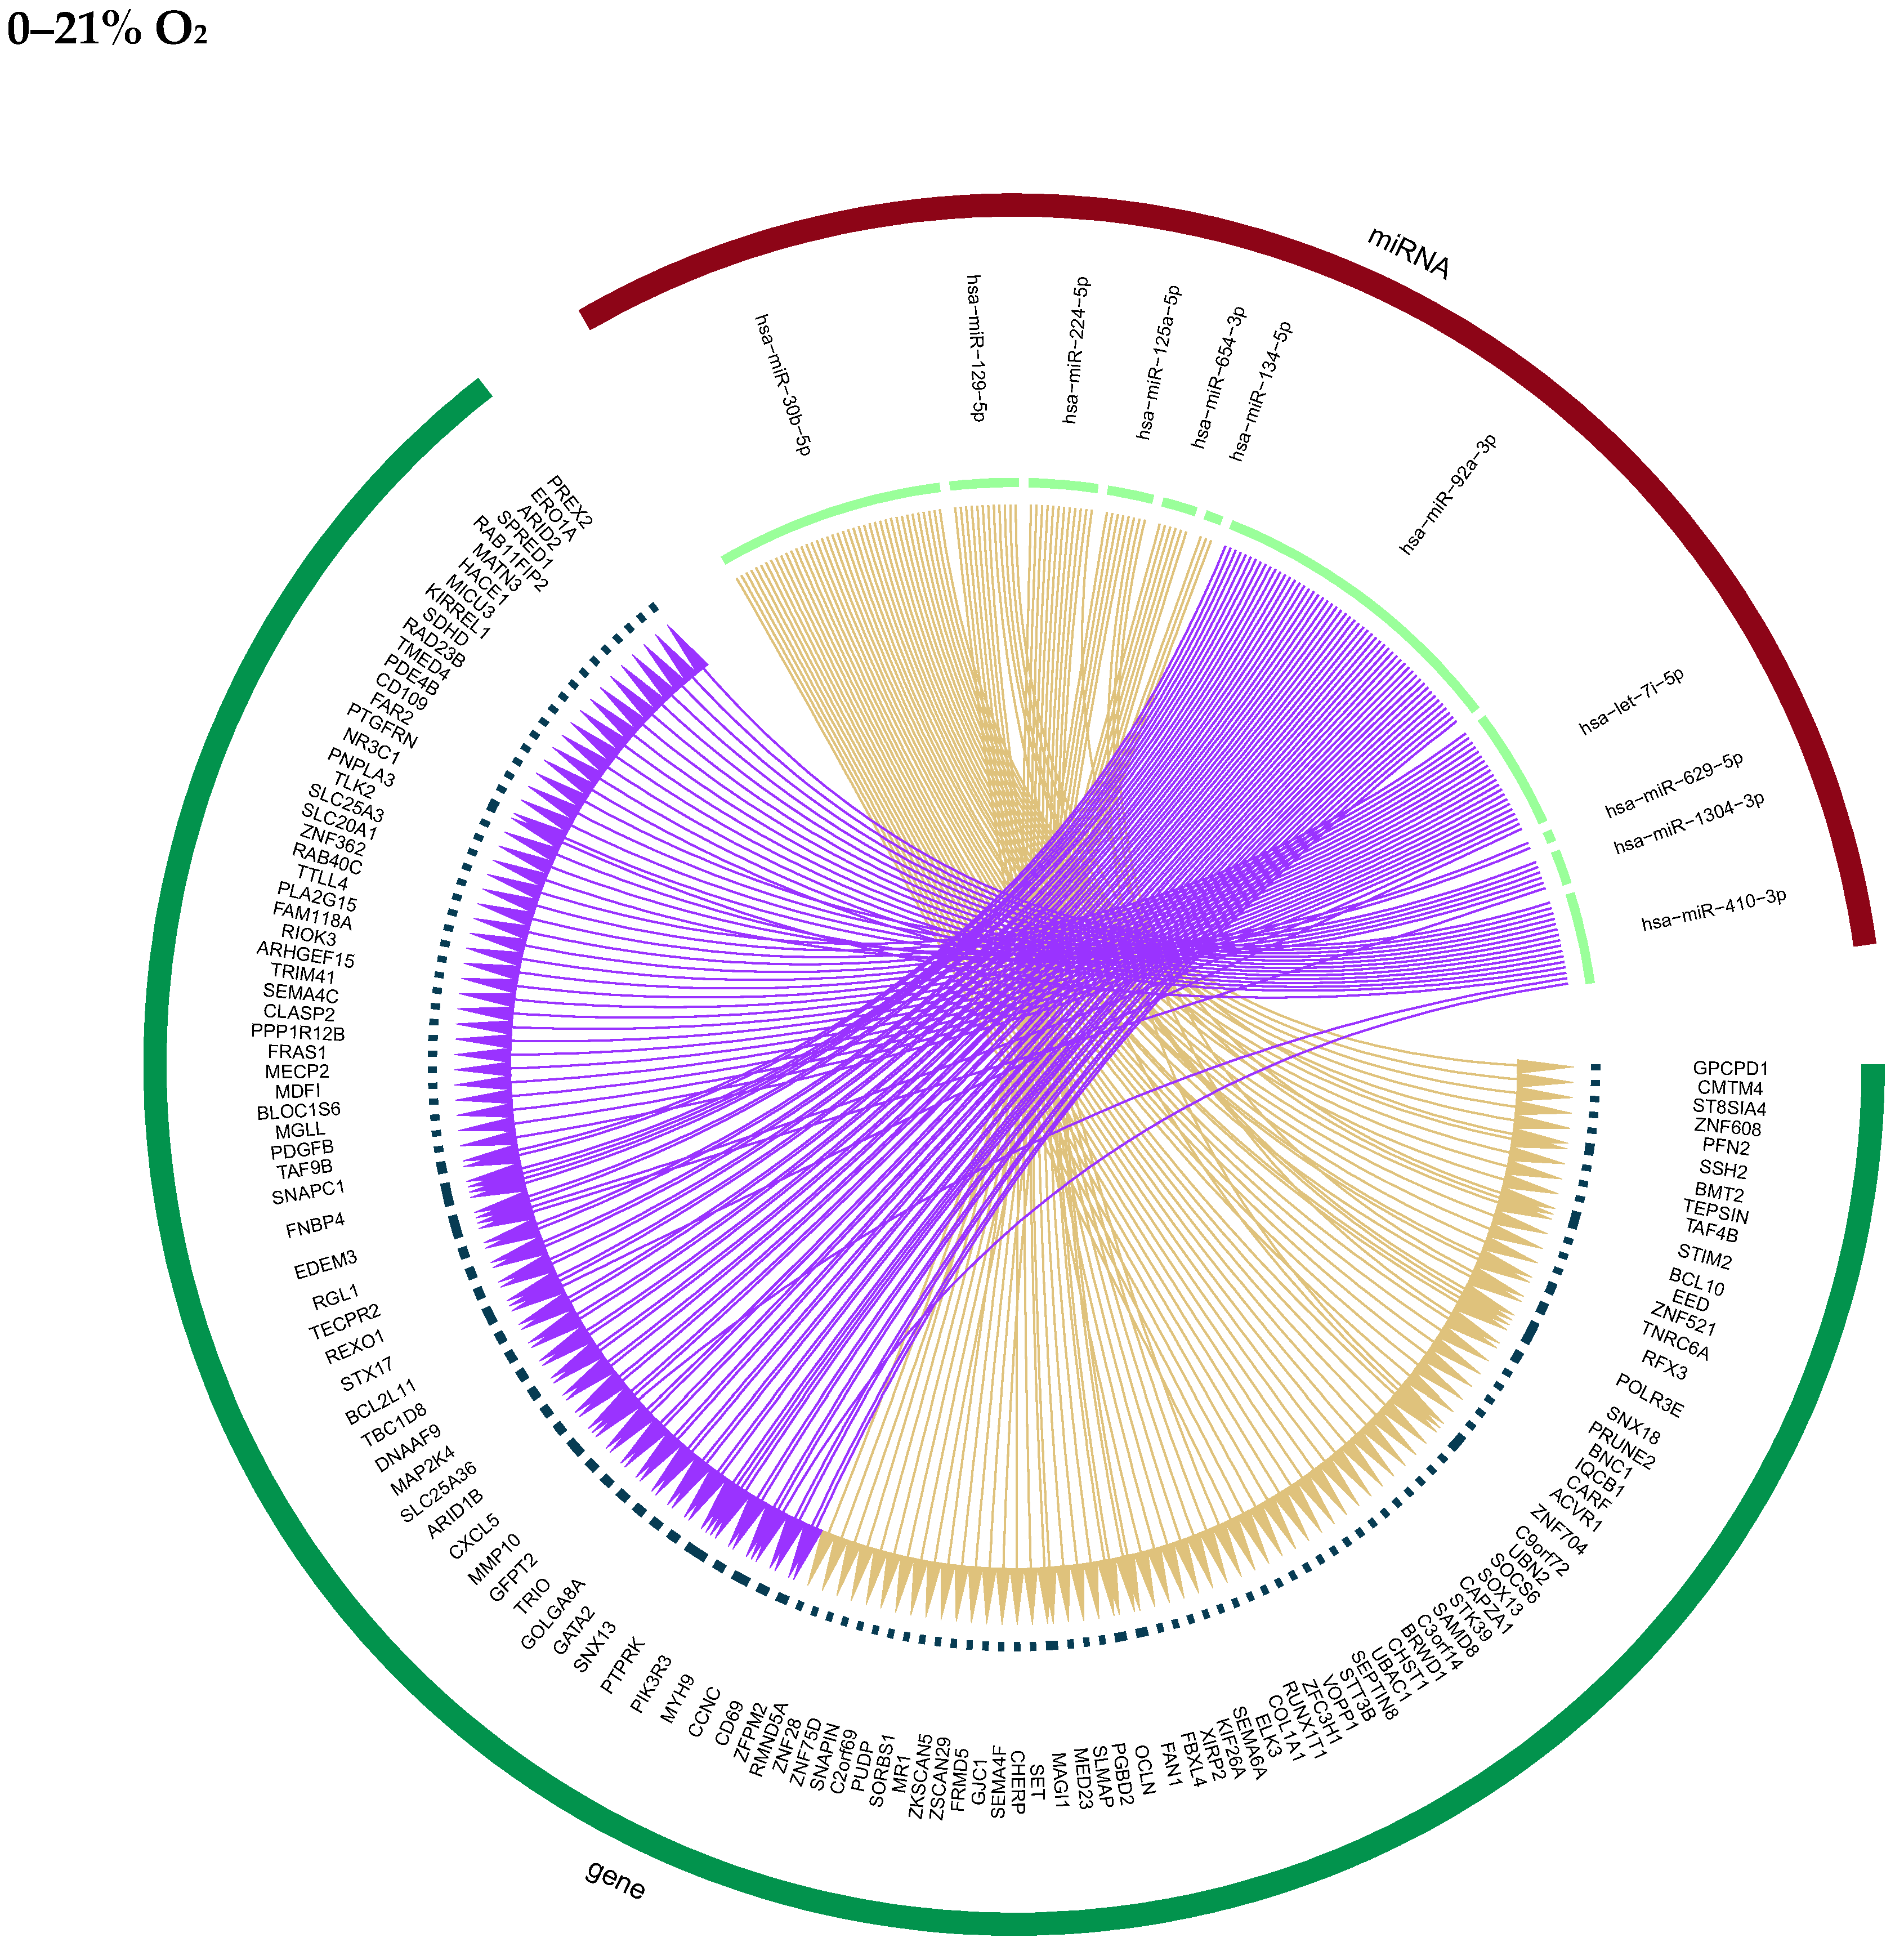
2.6. Putative Autocrine Effects of Secreted miRNAs on Cellular mRNA Targets
2.7. Putative Para- and Endocrine Effects
3. Discussion
4. Materials and Methods
4.1. Cell Culture
4.2. Exposure to Oxygen Conditions
4.3. Processing of Cell Culture Supernatants
4.4. RNA Isolation for Next-Generation Sequencing
4.5. Small RNA-Sequencing Analysis (Next-Generation Sequencing)
4.6. Quantitative Real-Time PCR
4.7. RNA Sequencing (RNAseq) of Cellular mRNAs
4.8. Data Analysis of qRT-PCR Results and Statistical Evaluation
4.9. Bioinformatical Processing of Data
4.9.1. Extracellular miRNAs
4.9.2. Cellular mRNAs
5. Conclusions
Supplementary Materials
Author Contributions
Funding
Institutional Review Board Statement
Informed Consent Statement
Data Availability Statement
Acknowledgments
Conflicts of Interest
References
- Bartel, D.P. Metazoan MicroRNAs. Cell 2018, 173, 20–51. [Google Scholar] [CrossRef] [PubMed]
- Cunha, E.R.K.; Ying, W.; Olefsky, J.M. Exosome-Mediated Impact on Systemic Metabolism. Annu. Rev. Physiol. 2024, 86, 225–253. [Google Scholar] [CrossRef] [PubMed]
- Lozano-Velasco, E.; Inacio, J.M.; Sousa, I.; Guimaraes, A.R.; Franco, D.; Moura, G.; Belo, J.A. miRNAs in Heart Development and Disease. Int. J. Mol. Sci. 2024, 25, 1673. [Google Scholar] [CrossRef] [PubMed]
- Jordan-Alejandre, E.; Campos-Parra, A.D.; Castro-Lopez, D.L.; Silva-Cazares, M.B. Potential miRNA Use as a Biomarker: From Breast Cancer Diagnosis to Metastasis. Cells 2023, 12, 525. [Google Scholar] [CrossRef] [PubMed]
- Dos Santos, C.C.; Lopes-Pacheco, M.; English, K.; Rolandsson Enes, S.; Krasnodembskaya, A.; Rocco, P.R.M. The MSC-EV-microRNAome: A Perspective on Therapeutic Mechanisms of Action in Sepsis and ARDS. Cells 2024, 13, 122. [Google Scholar] [CrossRef] [PubMed]
- Boehme, S.; Hartmann, E.K.; Tripp, T.; Thal, S.C.; David, M.; Abraham, D.; Baumgardner, J.E.; Markstaller, K.; Klein, K.U. PO2 oscillations induce lung injury and inflammation. Crit. Care 2019, 23, 102. [Google Scholar] [CrossRef] [PubMed]
- Wohlrab, P.; Johann Danhofer, M.; Schaubmayr, W.; Tiboldi, A.; Krenn, K.; Markstaller, K.; Ullrich, R.; Ulrich Klein, K.; Tretter, V. Oxygen conditions oscillating between hypoxia and hyperoxia induce different effects in the pulmonary endothelium compared to constant oxygen conditions. Physiol. Rep. 2021, 9, e14590. [Google Scholar] [CrossRef]
- Van der Maaten, L.; Hinton, G. Visualizing data using t-SNE. J. Mach. Learn. Res. 2008, 9, 2579–2605. [Google Scholar]
- Langfelder, P.; Horvath, S. WGCNA: An R package for weighted correlation network analysis. BMC Bioinform. 2008, 9, 559. [Google Scholar] [CrossRef]
- Wohlrab, P.; Soto-Gonzales, L.; Benesch, T.; Winter, M.P.; Lang, I.M.; Markstaller, K.; Tretter, V.; Klein, K.U. Intermittent Hypoxia Activates Duration-Dependent Protective and Injurious Mechanisms in Mouse Lung Endothelial Cells. Front. Physiol. 2018, 9, 1754. [Google Scholar] [CrossRef]
- Wang, Y.; Wang, R.; Zhang, S.; Song, S.; Jiang, C.; Han, G.; Wang, M.; Ajani, J.; Futreal, A.; Wang, L. iTALK: An R package to characterize and illustrate intercellular communication. Biorxiv 2019. [Google Scholar]
- Armingol, E.; Officer, A.; Harismendy, O.; Lewis, N.E. Deciphering cell-cell interactions and communication from gene expression. Nat. Rev. Genet. 2021, 22, 71–88. [Google Scholar] [CrossRef]
- Silina, M.V.; Dzhalilova, D.S.; Makarova, O. Role of microRNAs in regulation of cellular responses to hypoxia. Biochemistry 2023, 88, 741–757. [Google Scholar] [PubMed]
- Vijay, A.; Jha, P.K.; Garg, I.; Sharma, M.; Ashraf, M.Z.; Kumar, B. micro-RNAs dependent regulation of DNMT and HIF1alpha gene expression in thrombotic disorders. Sci. Rep. 2019, 9, 4815. [Google Scholar] [CrossRef] [PubMed]
- Cao, L.Q.; Yang, X.W.; Chen, Y.B.; Zhang, D.W.; Jiang, X.F.; Xue, P. Exosomal miR-21 regulates the TETs/PTENp1/PTEN pathway to promote hepatocellular carcinoma growth. Mol. Cancer 2019, 18, 148. [Google Scholar] [CrossRef] [PubMed]
- Ma, Y.; Shen, N.; Wicha, M.S.; Luo, M. The Roles of the Let-7 Family of MicroRNAs in the Regulation of Cancer Stemness. Cells 2021, 10, 2415. [Google Scholar] [CrossRef] [PubMed]
- Boateng, E.; Krauss-Etschmann, S. miRNAs in Lung Development and Diseases. Int. J. Mol. Sci. 2020, 21, 2765. [Google Scholar] [CrossRef] [PubMed]
- Arisan, E.D.; Dart, D.A.; Grant, G.H.; Dalby, A.; Kancagi, D.D.; Turan, R.D.; Yurtsever, B.; Karakus, G.S.; Ovali, E.; Lange, S.; et al. microRNA 1307 Is a Potential Target for SARS-CoV-2 Infection: An in Vitro Model. ACS Omega 2022, 7, 38003–38014. [Google Scholar] [CrossRef] [PubMed]
- Samak, M.; Kaltenborn, D.; Kues, A.; Le Noble, F.; Hinkel, R.; Germena, G. Micro-RNA 92a as a Therapeutic Target for Cardiac Microvascular Dysfunction in Diabetes. Biomedicines 2021, 10, 58. [Google Scholar] [CrossRef]
- Mallikarjuna, P.; Zhou, Y.; Landstrom, M. The Synergistic Cooperation between TGF-beta and Hypoxia in Cancer and Fibrosis. Biomolecules 2022, 12, 635. [Google Scholar] [CrossRef]
- Singleton, D.C.; Harris, A.L. ATF4, Hypoxia and Treatment Resistance in Cancer. In The Unfolded Protein Response in Cancer; Clarke, R., Ed.; Cancer Drug Discovery and Development; Humana Press: Cham, Switzerland, 2019. [Google Scholar]
- Yan, S.F.; Mackman, N.; Kisiel, W.; Stern, D.M.; Pinsky, D.J. Hypoxia/Hypoxemia-Induced activation of the procoagulant pathways and the pathogenesis of ischemia-associated thrombosis. Arter. Thromb. Vasc. Biol. 1999, 19, 2029–2035. [Google Scholar] [CrossRef] [PubMed]
- Berg, J.T.; Breen, E.C.; Fu, Z.; Mathieu-Costello, O.; West, J.B. Alveolar hypoxia increases gene expression of extracellular matrix proteins and platelet-derived growth factor-B in lung parenchyma. Am. J. Respir. Crit. Care Med. 1998, 158, 1920–1928. [Google Scholar] [CrossRef] [PubMed]
- Zhang, C.; Liu, J.; Wang, J.; Zhang, T.; Xu, D.; Hu, W.; Feng, Z. The Interplay Between Tumor Suppressor p53 and Hypoxia Signaling Pathways in Cancer. Front. Cell Dev. Biol. 2021, 9, 648808. [Google Scholar] [CrossRef] [PubMed]
- Ochoa, S.V.; Otero, L.; Aristizabal-Pachon, A.F.; Hinostroza, F.; Carvacho, I.; Torres, Y.P. Hypoxic Regulation of the Large-Conductance, Calcium and Voltage-Activated Potassium Channel, BK. Front. Physiol. 2021, 12, 780206. [Google Scholar] [CrossRef] [PubMed]
- Mamun, A.A.; Hayashi, H.; Yamamura, A.; Nayeem, M.J.; Sato, M. Hypoxia induces the translocation of glucose transporter 1 to the plasma membrane in vascular endothelial cells. J. Physiol. Sci. 2020, 70, 44. [Google Scholar] [CrossRef] [PubMed]
- Mylonis, I.; Simos, G.; Paraskeva, E. Hypoxia-Inducible Factors and the Regulation of Lipid Metabolism. Cells 2019, 8, 214. [Google Scholar] [CrossRef] [PubMed]
- Carrella, S.; Di Guida, M.; Brillante, S.; Piccolo, D.; Ciampi, L.; Guadagnino, I.; Garcia Piqueras, J.; Pizzo, M.; Marrocco, E.; Molinari, M.; et al. miR-181a/b downregulation: A mutation-independent therapeutic approach for inherited retinal diseases. EMBO Mol. Med. 2022, 14, e15941. [Google Scholar] [CrossRef] [PubMed]
- Hu, J.; Huang, S.; Liu, X.; Zhang, Y.; Wei, S.; Hu, X. miR-155: An Important Role in Inflammation Response. J. Immunol. Res. 2022, 2022, 7437281. [Google Scholar] [CrossRef] [PubMed]
- Guo, H.; Pu, M.; Tai, Y.; Chen, Y.; Lu, H.; Qiao, J.; Wang, G.; Chen, J.; Qi, X.; Huang, R.; et al. Nuclear miR-30b-5p suppresses TFEB-mediated lysosomal biogenesis and autophagy. Cell Death Differ. 2021, 28, 320–336. [Google Scholar] [CrossRef]
- Qiu, H.; Shen, X.; Chen, B.; Chen, T.; Feng, G.; Chen, S.; Feng, D.; Xu, Q. miR-30b-5p inhibits cancer progression and enhances cisplatin sensitivity in lung cancer through targeting LRP8. Apoptosis 2021, 26, 261–276. [Google Scholar] [CrossRef]
- Chen, Z.X.; He, D.; Mo, Q.W.; Xie, L.P.; Liang, J.R.; Liu, L.; Fu, W.J. MiR-129-5p protects against myocardial ischemia-reperfusion injury via targeting HMGB1. Eur. Rev. Med. Pharmacol. Sci. 2020, 24, 4440–4450. [Google Scholar]
- Hirota, K.; Yamashita, A.; Abe, E.; Yamaji, T.; Azushima, K.; Tanaka, S.; Taguchi, S.; Tsukamoto, S.; Wakui, H.; Tamura, K. miR-125a-5p/miR-125b-5p contributes to pathological activation of angiotensin II-AT1R in mouse distal convoluted tubule cells by the suppression of Atrap. J. Biol. Chem. 2023, 299, 105478. [Google Scholar] [CrossRef]
- Tang, X.; Yin, R.; Shi, H.; Wang, X.; Shen, D.; Wang, X.; Pan, C. LncRNA ZFAS1 confers inflammatory responses and reduces cholesterol efflux in atherosclerosis through regulating miR-654-3p-ADAM10/RAB22A axis. Int. J. Cardiol. 2020, 315, 72–80. [Google Scholar] [CrossRef]
- Yu, B.; Zeng, A.; Liu, H.; Yang, Z.; Fu, M. MiR-654-3p, reduced by the excessive ALKBH5, Alleviated the Inflammation in OA by targeting TNFRSF9, the trigger of the NF-kappaB pathway. Biochem. Biophys. Res. Commun. 2022, 634, 30–39. [Google Scholar] [CrossRef] [PubMed]
- Scisciani, C.; Vossio, S.; Guerrieri, F.; Schinzari, V.; De Iaco, R.; D’Onorio de Meo, P.; Cervello, M.; Montalto, G.; Pollicino, T.; Raimondo, G.; et al. Transcriptional regulation of miR-224 upregulated in human HCCs by NFkappaB inflammatory pathways. J. Hepatol. 2012, 56, 855–861. [Google Scholar] [CrossRef]
- Shen, L.; Huang, F.; Ye, L.; Zhu, W.; Zhang, X.; Wang, S.; Wang, W.; Ning, G. Circulating microRNA predicts insensitivity to glucocorticoid therapy in Graves’ ophthalmopathy. Endocrine 2015, 49, 445–456. [Google Scholar] [CrossRef]
- Wang, Y.; Dong, C.Q.; Peng, G.Y.; Huang, H.Y.; Yu, Y.S.; Ji, Z.C.; Shen, Z.Y. MicroRNA-134-5p Regulates Media Degeneration through Inhibiting VSMC Phenotypic Switch and Migration in Thoracic Aortic Dissection. Mol. Ther. Nucleic Acids 2019, 16, 284–294. [Google Scholar] [CrossRef]
- Sun, D.; Ding, Z.; Shen, L.; Yang, F.; Han, J.; Wu, G. miR-410-3P inhibits adipocyte differentiation by targeting IRS-1 in cancer-associated cachexia patients. Lipids Health Dis. 2021, 20, 115. [Google Scholar] [CrossRef]
- Li, S.; Yuan, L.; Su, L.; Lian, Z.; Liu, C.; Zhang, F.; Cui, Y.; Wu, M.; Chen, H. Decreased miR-92a-3p expression potentially mediates the pro-angiogenic effects of oxidative stress-activated endothelial cell-derived exosomes by targeting tissue factor. Int. J. Mol. Med. 2020, 46, 1886–1898. [Google Scholar] [CrossRef]
- Schaubmayr, W.; Hochreiter, B.; Hunyadi-Gulyas, E.; Riegler, L.; Schmidt, K.; Tiboldi, A.; Moser, B.; Klein, K.U.; Krenn, K.; Scharbert, G.; et al. The Proteome of Extracellular Vesicles Released from Pulmonary Microvascular Endothelium Reveals Impact of Oxygen Conditions on Biotrauma. Int. J. Mol. Sci. 2024, 25, 2415. [Google Scholar] [CrossRef]
- Tang, H.; Pan, L.; Xiong, Y.; Wang, L.; Cui, Y.; Liu, J.; Tang, L. Down-regulation of the Sp1 transcription factor by an increase of microRNA-4497 in human placenta is associated with early recurrent miscarriage. Reprod. Biol. Endocrinol. 2021, 19, 21. [Google Scholar] [CrossRef] [PubMed]
- Zhao, M.; Chen, N.; Li, X.; Lin, L. MiR-629 regulates hypoxic pulmonary vascular remodelling by targeting FOXO3 and PERP. J. Cell. Mol. Med. 2019, 23, 5165–5175. [Google Scholar] [CrossRef]
- Hafner, C.; Wu, J.; Tiboldi, A.; Hess, M.; Mitulovic, G.; Kaun, C.; Krychtiuk, K.A.; Wojta, J.; Ullrich, R.; Tretter, E.V.; et al. Hyperoxia Induces Inflammation and Cytotoxicity in Human Adult Cardiac Myocytes. Shock 2017, 47, 436–444. [Google Scholar] [CrossRef]
- Zhang, R.; Miao, Z.; Liu, Y.; Zhang, X.; Yang, Q. A positive feedback loop between miR-574-3p and HIF-1alpha in promoting angiogenesis under hypoxia. Microvasc. Res. 2023, 150, 104589. [Google Scholar] [CrossRef]
- Chang, K.C.; Barth, A.S.; Sasano, T.; Kizana, E.; Kashiwakura, Y.; Zhang, Y.; Foster, D.B.; Marban, E. CAPON modulates cardiac repolarization via neuronal nitric oxide synthase signaling in the heart. Proc. Natl. Acad. Sci. USA 2008, 105, 4477–4482. [Google Scholar] [CrossRef]
- Gu, M.; Liu, K.; Xiong, H.; You, Q. MiR-130a-3p inhibits endothelial inflammation by regulating the expression of MAPK8 in endothelial cells. Heliyon 2024, 10, e24541. [Google Scholar] [CrossRef]
- Yu, S.; Zhai, J.; Yu, J.; Yang, Q.; Yang, J. miR-98-5p protects against cerebral ischemia/reperfusion injury through anti-apoptosis and anti-oxidative stress in mice. J. Biochem. 2021, 169, 195–206. [Google Scholar] [CrossRef]
- Raju, S.; Botts, S.R.; Blaser, M.; Prajapati, K.; Ho, T.W.W.; Ching, C.; Galant, N.J.; Fiddes, L.; Wu, R.; Clift, C.L.; et al. Endothelial cells secrete small extracellular vesicles bidirectionally containing distinct cargo to uniquely reprogram vascular cells in the circulation and vessel wall. Biorxiv 2023. [Google Scholar] [CrossRef]
- Hafner, C.; Qi, H.; Soto-Gonzalez, L.; Doerr, K.; Ullrich, R.; Tretter, E.V.; Markstaller, K.; Klein, K.U. Argon Preconditioning Protects Airway Epithelial Cells against Hydrogen Peroxide-Induced Oxidative Stress. Eur. Surg. Res. 2016, 57, 252–262. [Google Scholar] [CrossRef] [PubMed]
- Khamina, K.; Diendorfer, A.B.; Skalicky, S.; Weigl, M.; Pultar, M.; Krammer, T.L.; Fournier, C.A.; Schofield, A.L.; Otto, C.; Smith, A.T.; et al. A MicroRNA Next-Generation-Sequencing Discovery Assay (miND) for Genome-Scale Analysis and Absolute Quantitation of Circulating MicroRNA Biomarkers. Int. J. Mol. Sci. 2022, 23, 1226. [Google Scholar] [CrossRef]
- Diendorfer, A.; Khamina, K.; Pultar, M.; Hackl, M. miND (miRNA NGS Discovery pipeline): A small RNA-seq analysis pipeline and report generator for microRNA biomarker discovery studies. F1000Research 2022, 11, 233. [Google Scholar] [CrossRef]
- Dobin, A.; Davis, C.A.; Schlesinger, F.; Drenkow, J.; Zaleski, C.; Jha, S.; Batut, P.; Chaisson, M.; Gingeras, T.R. STAR: Ultrafast universal RNA-seq aligner. Bioinformatics 2013, 29, 15–21. [Google Scholar] [CrossRef] [PubMed]
- Robinson, M.D.; McCarthy, D.J.; Smyth, G.K. edgeR: A Bioconductor package for differential expression analysis of digital gene expression data. Bioinformatics 2010, 26, 139–140. [Google Scholar] [CrossRef] [PubMed]
- Hanzelmann, S.; Castelo, R.; Guinney, J. GSVA: Gene set variation analysis for microarray and RNA-seq data. BMC Bioinform. 2013, 14, 7. [Google Scholar] [CrossRef] [PubMed]
- Wu, T.; Hu, E.; Xu, E.; Chen, M.; Guo, P.; Dai, Z.; Feng, L.; Zhou, W.; Tang, L.; Zhan, L.; et al. clusterProfiler 4.0: A universaö enrichment tool for interpreting omics data. Innovation 2021, 2, 100141. [Google Scholar] [CrossRef]
- Liberzon, A.; Birger, C.; Thorvaldsdóttir, H.; Ghandi, M.; Mesirov Jill, P.; Tamayo, P. The Molecular Signatures Database Hallmark Gene Set Collection. Cell Syst. 2015, 1, 417–425. [Google Scholar] [CrossRef]


| O2 Condition | miRNA | NGS Results NGS (Donors 1–6) | miRNAs with p < 0.1 after qPCR Validation (Incl. Donors 7–12) | |
|---|---|---|---|---|
| Fold Change (Rel. to 21% O2) | p-Value (<0.05) | Fold Change (Rel. to 21% O2) | ||
| 5% O2 | hsa-miR-19b-3p | 1.3386 | 0.0049 | 1.3068 |
| hsa-miR-222-3p | 0.8383 | 0.0092 | 0.8405 | |
| hsa-miR-23a-3p | 1.2177 | 0.0145 | 1.080 | |
| hsa-miR-26a-5p | 0.8414 | 0.0185 | 0.8906 | |
| hsa-let-7d-3p | 0.7748 | 0.0197 | 1.119 * | |
| hsa-miR-21-3p | 1.2995 | 0.0228 | 1.388 | |
| hsa-miR-126-5p | 0.8418 | 0.0294 | 1.0665 | |
| hsa-miR-181c-3p | 1.3927 | 0.0384 | ||
| hsa-miR-1307-5p | 1.3358 | 0.0392 | ||
| hsa-miR-92a-3p | 0.8453 | 0.0464 | ||
| 10% O2 | hsa-miR-4492 | 0.5117 | 0.0365 | |
| 95% O2 | hsa-miR-181b-5p | 0.6695 | 0.0037 (FDR = 0.096) | 1.097 * |
| hsa-miR-181a-5p | 0.7929 | 0.0314 | 0.899 | |
| hsa-miR-155-5p | 0.7728 | 0.0322 | 1.033 * | |
| hsa-let-7c-5p | 0.7914 | 0.0325 | ||
| 0–21% O2 | hsa-miR-30b-5p | 1.9702 | 0.0036 | 2.1687 |
| hsa-miR-410-3p | 0.5967 | 0.0067 | 0.993 | |
| hsa-let-7i-5p | 0.7756 | 0.0130 | 1.190 * | |
| hsa-miR-129-5p | 2.7431 | 0.0171 | Ct > 35 | |
| hsa-miR-1304-3p | 0.7181 | 0.0189 | ||
| hsa-miR-125a-5p | 1.3159 | 0.0229 | 0.956 | |
| hsa-miR-654-3p | 1.3576 | 0.0289 | ||
| hsa-miR-224-5p | 1.4676 | 0.0290 | ||
| hsa-miR-92a-3p | 0.8009 | 0.0339 | ||
| hsa-miR-4497 | 0.6404 | 0.0344 | ||
| hsa-miR-629-5p | 0.6743 | 0.0377 | ||
| hsa-miR-134-5p | 1.2977 | 0.0388 | ||
| 0–95% O2 | hsa-let-7d-3p | 0.7424 | 0.0026 | 0.8045 |
| hsa-miR-155-5p | 0.7668 | 0.0110 | 0.7423 | |
| hsa-miR-574-3p | 1.2817 | 0.0154 | 1.1975 | |
| hsa-miR-4492 | 0.5622 | 0.0298 | ||
| hsa-miR-103a-3p | 0.8102 | 0.0313 | ||
| hsa-miR-23a-3p | 1.2192 | 0.0338 | 1.018 | |
| hsa-miR-301b-3p | 0.4778 | 0.0339 | ||
| hsa-miR-130a-3p | 0.7906 | 0.0391 | ||
| hsa-miR-7-5p | 0.8296 | 0.0414 | ||
| hsa-miR-26b-5p | 0.8316 | 0.0479 | ||
| hsa-miR-98-5p | (0.9409) | (0.1476) | (0.8409) | |
| O2 Condition | miRNA | Affected Pathways via Target Genes (Reactome Database) |
|---|---|---|
| 5% O2 | hsa-miR-19b-3p (↑) | Signaling by TGFßR, ErbB, SCF-KIT, Wnt. VEGFR-mediated cell proliferation |
| hsa-miR-222-3p (↓) | Cell senescence, PI3K/Akt activation, cell cycle, signaling by SCF-KIT, DAP12, FGFR | |
| hsa-miR-23a-3p (↑) | IL6-signaling, ATF4 activated genes, signaling by SCF-KIT, EGFR, PI3K/Akt | |
| hsa-miR-26a-5p (↓) | Cellular response to stress, gene expression, cellular senescence, cell cycle, DNA damage/telomer stress induction | |
| hsa-let-7d-3p (↓) | Anti-cell proliferation, granulopoiesis, T-cell differentiation, cell division (not annotated to exosomes) | |
| hsa-miR-21-3p (↑) | Methylation, VEGFA-VEGFR2 signaling, Rho-GTPase signaling, transcriptional regulation by TP53, regulation of actin dynamics | |
| hsa-miR-126-5p (↓) | IL-6 signaling, collagen degradation, miRNA biogenesis, PIP3K/Akt, NOTCH | |
| hsa-miR-181c-3p (↑) | Calcium activated K + channels, fibrin clot formation, detoxification of ROS, smooth muscle contraction | |
| hsa-miR-1307-5p (↑) | Cell–extracellular matrix interaction, mRNA splicing, translocation of GLUT4 to plasma membrane, VEGFA-VEGFR2 signaling, apoptosis, synthesis of very long fatty acids-CoA | |
| hsa-miR-92a-3p (↓) | Cell cycle, gene expression, translation | |
| 10% O2 | hsa-miR-4492 (↓) | Cellular senescence (oxidative stress induced), DAP12 interactions, heme degradation, nuclear events |
| 95% O2 | hsa-miR-181b-5p (↓) | Cellular senescence and response to stress, DNA fragmentation, apoptosis, signaling by ERBB, NOTCH, calcium-dependent events, IL-1 signaling, interferon signaling, TLR 7/8 |
| hsa-miR-181a-5p (↓) | Cell response to stress, signaling by EGFR, ERBB, FGFR, PDGF, RAF/MAPK cascade, signaling by interleukins, immune system, DNA fragmentation | |
| hsa-miR-155-5p (↓) | NFKB, B-cell, T-cell receptor, p53, NOD-like receptor, TLR, SMAD, and interleukin (-6) signaling; cellular response to stress, cellular senescence | |
| hsa-let-7c-5p (↓) | IL-6, SMAD, SCF-KIT, PI3K/Akt, p53, and NOTCH signaling, respiratory electron transport, cellular senescence, platelet activation, aggregation and degranulation, immune system, ATF6-dependent activation of chaperons | |
| 0–21% O2 | hsa-miR-30b-5p (↑) | NOTCH, SMAD, TGFßR, and IFNA signaling, intrinsic pathway of apoptosis, cellular senescence, DNA repair, response to oxidative stress |
| hsa-miR-410-3p (↓) | Beta-catenin phosphorylation cascade, platelet activation, signaling and aggregation, prolonged ERK activity, CaM pathway, calmodulin induced events | |
| hsa-let-7i-5p (↓) | Platelet degranulation, DNA damage/stress-induced senescence, cytokine signaling in immune system, ATF4-activated genes, IFN signaling, PERK regulated gene expression, intrinsic pathway of apoptosis, chromatin organization | |
| hsa-miR-129-5p (↑) | RSK activation, sphingolipid metabolism, circadian clock, ERK/MAPK targets, immune system, GABA/NMDA receptor activation, eNOS activation, oxidative stress-induced senescence | |
| hsa-miR-1304-3p (↓) | mRNA splicing, ER quality control, biosynthesis of N-glycan precursors, calnexin/calreticulin cycle, Asn-linked N-glycosylation, N-glycan trimming in ER, actin dynamics | |
| hsa-miR-125a-5p (↑) | Glycolysis, NGF, SCF-KIT, PDGF, Akt, CTLA4, NOTCH, VEGF, FGFR, TLR, and MAPK signaling | |
| hsa-miR-654-3p (↑) | Akt-, IFNG-, FGFR-, EGFR-, PDGF-signaling | |
| hsa-miR-224-5p (↑) | SCF-KIT, EGFR, NGF, VEGF, DAP12, Akt, and MAPK signaling: Rho GTPases activate PAKs, intrinsic pathway of apoptosis | |
| hsa-miR-92a-3p (↓) | Cell cycle, NOTCH-, Wnt-signaling | |
| hsa-miR-4497 (↓) | Rho-GTPases, VEGF and leptin-signaling; response to hypoxia, smooth muscle contraction, platelet degranulation, DNA repair, cytokine signaling in immune system | |
| hsa-miR-629-5p (↓) | HATs deacetylate histones, chromatin organization, DNA methylation, NLRP3 inflammasome, tight junctions, cell cycle, apoptosis | |
| hsa-miR-134-5p (↑) | Telomere maintenance and extension, cell response to hypoxia, VEGF and interleukin-(-6) signaling, NLRP3 inflammasome, p38MAPK, SOS-mediated signaling, oxygen-dependent proline hydroxylation | |
| 0–95% O2 | hsa-let-7d-3p (↓) | Transcription, cGMP effects, metabolism of non-coding RNAs, platelet homeostasis |
| hsa--miR-155-5p (↓) | See above (as with 95% O2) | |
| hsa-miR-574-3p (↑) | Regulation of HIFs, PCP/CE pathway, DSCAM and LICAM interactions, inactivation of Cdc42 and Rac, RhoGTPases activation of NOX, TRAF-dependent IRF activation, Rho GTPases activate IQGAPs | |
| hsa--miR-4492 (↓) | Crosslinking of collagen fibrils, heme degradation, nuclear events, GPVI-mediated activation cascade | |
| hsa-miR-103a-3p (↓) | siRNA biogenesis, Ca2+ pathway, G-protein activation, opoid signaling, insulin processing, cell cycle | |
| hsa-miR-23a-3p (↑) | IL-6 signaling, ERBB, SCF-KIT, EGFR, FGFR, PI3K/Akt, and SMAD signaling, death receptor signaling, Ca2+ pathway | |
| hsa-miR-301b-3p (↓) | NF-KB activation for survival, oxygen-dependent proline hydroxylation, Ca2+ pathways, regulated necrosis, IRAK2-mediated activation of TAK1, insuline receptor recycling | |
| hsa-miR-130a-3p (↓) | O2-dependent proline hydroxylation, Ca2+ pathways, Wnt, NOTCH, and BMP signaling, glycogen synthesis, circadian clock, regulation of necroptotic cell death, IRAK1 recruits IKK | |
| hsa-miR-7-5p (↓) | IRS-mediated signaling, SCF-KIT, EGFR, ERK, NGF, ERBB, Akt, FGFR, and VEGF signaling, immune system, IL-2 signaling, apoptosis | |
| hsa-miR-98-5p (↓) | IL-6 and IFN-signaling, cellular stress response and senescence, HATs acetylate histones, glucose transport |
| Module | 10% O2 | 21% O2 | 5% O2 | 95% O2 | 0–21% O2 | 0–95% O2 |
|---|---|---|---|---|---|---|
| M13 | −0.125 | −0.007 | 0.059 | −0.082 | −0.204 | 0.359 |
| p = 0.663 | p = 0.980 | p = 0.837 | p = 0.777 | p = 0.473 | p = 0.193 | |
| M8 | −0.243 | 0.154 | 0.393 | −0.062 | −0.294 | 0.051 |
| p = 0.391 | p = 0.590 | p = 0.149 | p = 0.829 | p = 0.294 | p = 0.861 | |
| M0 | −0.227 | 0.203 | 0.156 | 0.042 | −0.271 | 0.098 |
| p = 0.424 | p = 0.476 | p = 0.586 | p = 0.886 | p = 0.334 | p = 0.734 | |
| M2 | −0.192 | 0.157 | 0.196 | 0.025 | −0.252 | 0.066 |
| p = 0.502 | p = 0.583 | p = 0.492 | p = 0.932 | p = 0.372 | p = 0.819 | |
| M4 | 0.260 | −0.014 | 0.0278 | −0.0623 | −0.166 | −0.045 |
| p = 0.356 | p = 0.961 | p = 0.924 | p = 0.828 | p = 0.562 | p = 0.875 | |
| M7 | 0.138 | 0,028 | 0.061 | −0.024 | −0.208 | 0.004 |
| p = 0.629 | p = 0.924 | p = 0.833 | p = 0.935 | p = 0.465 | p = 0.988 | |
| M14 | −0.173 | −0.029 | −0.008 | 0.325 | −0.136 | 0.021 |
| p = 0.546 | p = 0.920 | p = 0.976 | p = 0.243 | p = 0.636 | p = 0.0.942 | |
| M6 | −0.243 | 0.069 | 0.113 | −0.049 | 0.075 | 0.037 |
| p = 0.390 | p = 0.811 | p = 0.695 | p = 0.864 | p = 0.796 | p = 0.899 | |
| M5 | −0.020 | −0.007 | −0.006 | 0.090 | 0.051 | −0.109 |
| p = 0.945 | p = 0.982 | p = 0.985 | p = 0.754 | p = 0.859 | p = 0.704 | |
| M9 | 0.000 | 0.000 | −0.054 | 0.064 | 0.030 | −0.041 |
| p = 0.999 | p = 0.999 | p = 0.853 | p = 0.825 | p = 0.917 | p = 0.888 | |
| M1 | −0.022 | −0.015 | 0.044 | −0.013 | 0.023 | −0.017 |
| p = 0.940 | p = 0.957 | p = 0.879 | p = 0.964 | p = 0.936 | p = 0.953 | |
| M10 | −0.006 | −0.025 | 0.046 | −0.034 | 0.011 | 0.007 |
| p = 0.984 | p = 0.931 | p = 0.873 | p = 0.907 | p = 0.970 | p = 0.979 | |
| M12 | 0.018 | −0.012 | 0.005 | 0.025 | −0.034 | −0.002 |
| p = 0.951 | p = 0.966 | p = 0.986 | p = 0.931 | p = 0.907 | p = 0.995 | |
| M11 | 0.009 | 0.000 | 0.023 | −0.027 | −0.023 | 0.017 |
| p = 0.975 | p = 0.999 | p = 0.936 | p = 0.925 | p = 0.937 | p = 0.952 | |
| M3 | 0.027 | 0.036 | 0.004 | −0.018 | −0.034 | −0.015 |
| p = 0.926 | p = 0.902 | p = 0.988 | p = 0.949 | p = 0.907 | p = 0.960 |
| O2 Condition | miRNA | Connectivity | |||
|---|---|---|---|---|---|
| Module | kTotal | kwithin | Kwithin norm | ||
| 5% O2 | hsa-miR-19b-3p | M1 | 26.839 | 15.669 | 0.948 |
| hsa-miR-222-3p | M3 | 22.589 | 7.305 | 0.504 | |
| hsa-miR-23a-3p | M1 | 9.843 | 6.341 | 0.384 | |
| hsa-miR-26a-5p | M9 | 7.440 | 4.546 | 0.618 | |
| hsa-let-7d-3p | M3 | 10.311 | 4.149 | 0.286 | |
| hsa-miR-21-3p | M3 | 17.604 | 9.434 | 0.651 | |
| hsa-miR-126-5p | M3 | 2.830 | 1.143 | 0.079 | |
| hsa-miR-181c-3p | M11 | 0.259 | 0.002 | 0.000 | |
| hsa-miR-1307-5p | M1 | 7.606 | 4.265 | 0.258 | |
| hsa-miR-92a-3p | M3 | 31.065 | 14.481 | 1.000 | |
| 10% O2 | hsa-miR-4492 | M3 | 23.365 | 7.392 | 0.510 |
| 95% O2 | hsa-miR-181b-5p | M1 | 12.731 | 7.049 | 0.426 |
| hsa-miR-181a-5p | M10 | 0.852 | 0.412 | 0.088 | |
| hsa-miR-155-5p | M9 | 4.433 | 2.099 | 0.285 | |
| hsa-let-7c-5p | M3 | 15.407 | 6.221 | 0.430 | |
| 0–21% O2 | hsa-miR-30b-5p | M5 | 1.718 | 1.051 | 0.361 |
| hsa-miR-410-3p | M14 | 2.224 | 1.517 | 0.578 | |
| hsa-let-7i-5p | M11 | 0.673 | 0.068 | 0.026 | |
| hsa-miR-129-5p | M12 | 0.758 | 0.429 | 0.246 | |
| hsa-miR-1304-3p | M6 | 0.831 | 0.122 | 0.009 | |
| hsa-miR-125a-5p | M3 | 0.188 | 0.057 | 0.004 | |
| hsa-miR-654-3p | M10 | 3.774 | 2.657 | 0.568 | |
| hsa-miR-224-5p | M9 | 0.452 | 0.188 | 0.026 | |
| hsa-miR-92a-3p | M3 | 31.065 | 14.481 | 1.000 | |
| hsa-miR-4497 | M3 | 2.830 | 1.143 | 0.079 | |
| hsa-miR-629-5p | M3 | 10.974 | 6.603 | 0.456 | |
| hsa-miR-134-5p | M10 | 4.226 | 3.025 | 0.647 | |
| 0–95% O2 | hsa-let-7d-3p | M3 | 10.311 | 4.149 | 0.286 |
| hsa-miR-155-5p | M9 | 4.433 | 2.099 | 0.285 | |
| hsa-miR-574-3p | M0 | 1.747 | 0.174 | 0.014 | |
| hsa-miR-4492 | M3 | 23.365 | 7.392 | 0.510 | |
| hsa-miR-103a-3p | M5 | 3.904 | 2.828 | 0.972 | |
| hsa-miR-23a-3p | M1 | 9.843 | 6.341 | 0.384 | |
| hsa-miR-301b-3p | M5 | 0.940 | 0.322 | 0.111 | |
| hsa-miR-130a-3p | M1 | 3.773 | 2.369 | 0.143 | |
| hsa-miR-7-5p | M1 | 26.829 | 13.911 | 0.842 | |
| hsa-miR-26b-5p | M5 | 3.067 | 2.454 | 0.843 | |
| hsa-miR-98-5p | (M0) | 0.378 | 0.082 | 0.007 | |
| Module | 10% O2 | 21% O2 | 5% O2 | 95% O2 | 0–21% O2 | 0–95% O2 | Module | 10% O2 | 21% O2 | 5% O2 | 95% O2 | 0–21% O2 | 0–95% O2 |
|---|---|---|---|---|---|---|---|---|---|---|---|---|---|
| M87 | 0.17 | −0.16 | 0.39 | −0.48 | 0.18 | −0.05 | M39 | −0.04 | −0.21 | 0.00 | 0.51 | 0.13 | −0.16 |
| M16 | 0.09 | 0.05 | −0.03 | −0.35 | 0.18 | 0.19 | M40 | 0.11 | −0.30 | −0.32 | 0.41 | 0.20 | −0.17 |
| M73 | 0.19 | 0.04 | −0.05 | −0.26 | 0.09 | −0.09 | M67 | 0.20 | −0.32 | −0.02 | 0.39 | −0.07 | −0.23 |
| M90 | 0.14 | 0.07 | 0.13 | −0.33 | 0.10 | 0.02 | M72 | 0.00 | 0.11 | −0.22 | 0.45 | −0.25 | 0.30 |
| M12 | 0.03 | 0.18 | 0.04 | −0.29 | −0.03 | 0.04 | M80 | 0.11 | −0.16 | −0.11 | 0.03 | 0.22 | 0.30 |
| M70 | 0.18 | 0.09 | 0.03 | −0.25 | −0.03 | −0.01 | M48 | 0.13 | −0.02 | −0.11 | 0.14 | −0.19 | 0.34 |
| M82 | 0.09 | 0.01 | 0.28 | −0.27 | 0.09 | 0.20 | M89 | 0.21 | −0.07 | −0.08 | 0.05 | −0.03 | 0.17 |
| M71 | 0.20 | 0.02 | 0.18 | −0.15 | −0.02 | −0.01 | M44 | −0.09 | 0.32 | 0.21 | 0.08 | −0.10 | −0.10 |
| M30 | 0.14 | 0.00 | 0.26 | −0.13 | −0.05 | 0.13 | M76 | −0.19 | 0.31 | 0.09 | 0.03 | 0.18 | 0.07 |
| M6 | 0.04 | 0.04 | 0.19 | −0.11 | −0.07 | 0.16 | M52 | −0.04 | 0.03 | 0.13 | 0.29 | −0.03 | −0.02 |
| M8 | 0.19 | 0.05 | 0.24 | −0.30 | 0.37 | −0.21 | M86 | −0.01 | −0.05 | 0.21 | 0.14 | −0.11 | −0.01 |
| M84 | 0.16 | 0.15 | 0.10 | −0.23 | 0.28 | −0.23 | M28 | 0.13 | 0.13 | 0.28 | −0.06 | −0.32 | 0.11 |
| M47 | 0.05 | −0.04 | 0.08 | −0.34 | 0.45 | 0.23 | M9 | 0.21 | 0.10 | 0.03 | 0.08 | −0.23 | 0.03 |
| M63 | −0.02 | −0.18 | 0.18 | −0.19 | 0.33 | 0.11 | M27 | 0.38 | −0.23 | 0.34 | −0.11 | −0.13 | −0.15 |
| M91 | −0.01 | −0.16 | 0.46 | −0.18 | 0.56 | −0.39 | M35 | 0.20 | 0.03 | 0.34 | −0.27 | −0.33 | 0.02 |
| M54 | −0.19 | 0.10 | 0.16 | 0.04 | 0.39 | −0.33 | M93 | 0.18 | 0.02 | 0.28 | −0.23 | −0.16 | −0.04 |
| M41 | −0.18 | 0.12 | −0.05 | 0.03 | 0.32 | −0.06 | M62 | 0.25 | −0.48 | 0.12 | −0.15 | 0.02 | 0.16 |
| M79 | −0.10 | 0.03 | −0.06 | 0.15 | 0.38 | −0.17 | M69 | 0.10 | −0.16 | −0.17 | −0.15 | 0.17 | 0.11 |
| M19 | 0.17 | −0.25 | 0.04 | −0.08 | 0.44 | −0.06 | M81 | 0.00 | −0.17 | 0.03 | −0.32 | 0.15 | 0.06 |
| M64 | 0.03 | −0.25 | −0.08 | −0.02 | 0.54 | −0.05 | M42 | 0.08 | 0.21 | −0.01 | 0.10 | −0.46 | −0.20 |
| M21 | 0.22 | −0.10 | −0.09 | −0.08 | 0.30 | −0.02 | M14 | 0.07 | 0.31 | −0.21 | 0.15 | −0.25 | −0.26 |
| M55 | 0.13 | −0.01 | −0.22 | −0.04 | 0.44 | −0.14 | M32 | 0.12 | 0.37 | −0.24 | −0.01 | −0.23 | −0.20 |
| M85 | −0.25 | 0.14 | −0.28 | 0.43 | −0.03 | 0.02 | M66 | 0.10 | 0.27 | 0.18 | −0.21 | −0.23 | −0.35 |
| M15 | −0.11 | −0.14 | 0.03 | 0.34 | −0.19 | 0.06 | M17 | 0.06 | 0.26 | 0.22 | −0.18 | −0.41 | −0.04 |
| M31 | −0.33 | −0.14 | −0.01 | 0.29 | 0.02 | 0.06 | M57 | 0.11 | 0.22 | 0.29 | −0.02 | −0.51 | −0.14 |
| M60 | −0.29 | 0.07 | 0.02 | 0.26 | −0.02 | 0.00 | M58 | −0.06 | 0.16 | −0.07 | −0.17 | 0.09 | −0.09 |
| M43 | −0.30 | 0.13 | −0.21 | 0.39 | −0.52 | 0.01 | M18 | −0.06 | 0.19 | −0.22 | 0.03 | 0.06 | −0.14 |
| M29 | 0.04 | −0.02 | 0.05 | 0.24 | −0.50 | 0.16 | M53 | 0.00 | 0.10 | −0.13 | 0.01 | 0.18 | −0.14 |
| M25 | 0.10 | −0.01 | −0.06 | 0.31 | −0.42 | −0.05 | M34 | 0.10 | 0.04 | 0.10 | 0.14 | −0.15 | −0.26 |
| M50 | −0.01 | 0.11 | −0.01 | 0.15 | −0.46 | 0.01 | M46 | 0.23 | −0.10 | 0.10 | 0.17 | −0.13 | −0.15 |
| M23 | −0.03 | 0.05 | −0.13 | 0.10 | −0.51 | 0.28 | M88 | 0.00 | −0.15 | 0.04 | 0.09 | 0.15 | −0.04 |
| M49 | −0.12 | −0.01 | −0.11 | 0.20 | −0.40 | 0.04 | M3 | 0.03 | 0.02 | 0.04 | 0.00 | −0.07 | 0.01 |
| M92 | −0.14 | 0.05 | −0.07 | 0.16 | −0.52 | 0.16 | M0 | 0.05 | −0.07 | 0.06 | 0.08 | −0.04 | −0.02 |
| M51 | −0.33 | 0.08 | −0.40 | 0.19 | 0.00 | 0.18 | M2 | 0.01 | −0.07 | 0.03 | 0.06 | −0.01 | 0.02 |
| M68 | −0.15 | 0.09 | −0.38 | −0.06 | 0.11 | 0.12 | M20 | 0.00 | −0.05 | 0.02 | 0.01 | −0.03 | 0.04 |
| M65 | −0.42 | −0.12 | 0.03 | −0.05 | 0.06 | 0.30 | M78 | 0.10 | −0.15 | 0.11 | −0.09 | 0.07 | −0.02 |
| M4 | −0.31 | 0.04 | −0.15 | 0.05 | −0.17 | 0.22 | M5 | 0.00 | −0.02 | 0.02 | −0.01 | 0.07 | −0.03 |
| M74 | −0.23 | −0.12 | −0.03 | −0.01 | −0.01 | 0.13 | M36 | 0.10 | 0.00 | 0.05 | −0.11 | 0.03 | −0.01 |
| M94 | −0.25 | −0.04 | −0.10 | 0.13 | −0.11 | 0.07 | M1 | 0.05 | 0.04 | 0.05 | −0.12 | 0.10 | −0.09 |
| M37 | −0.11 | −0.43 | −0.22 | 0.28 | 0.24 | 0.11 | M10 | 0.07 | −0.01 | 0.10 | −0.05 | 0.06 | −0.11 |
| M77 | −0.16 | −0.39 | −0.14 | 0.17 | 0.29 | 0.28 | M61 | 0.16 | 0.38 | −0.25 | −0.19 | −0.14 | 0.16 |
| M13 | −0.16 | −0.12 | −0.15 | 0.00 | 0.28 | −0.02 | M22 | −0.18 | 0.04 | 0.12 | 0.10 | −0.29 | 0.22 |
| M59 | −0.22 | −0.20 | −0.17 | −0.14 | 0.48 | 0.18 | M75 | −0.22 | 0.23 | 0.13 | −0.09 | −0.17 | 0.28 |
| M33 | 0.06 | −0.33 | −0.12 | 0.34 | −0.30 | 0.10 | M56 | −0.06 | 0.24 | −0.06 | −0.21 | −0.33 | 0.25 |
| M38 | 0.06 | −0.33 | −0.01 | 0.37 | −0.25 | −0.02 | M7 | −0.04 | 0.04 | 0.03 | −0.13 | −0.28 | 0.22 |
| M26 | 0.13 | −0.33 | −0.28 | 0.54 | −0.10 | 0.08 | M11 | 0.10 | 0.20 | 0.05 | −0.16 | −0.23 | −0.03 |
| M83 | −0.10 | −0.22 | −0.19 | 0.53 | −0.12 | −0.01 | M24 | −0.01 | 0.08 | −0.07 | −0.09 | −0.10 | 0.11 |
| M45 | −0.16 | 0.22 | −0.05 | −0.06 | −0.15 | 0.04 |
| 5% O2 | ||
| positive correl. | M87 | Microtubule cytoskeleton organization, cell–cell junction assembly, macroautophagy, store-operated calcium entry |
| M91 | Regulation of ROS biosynthesis, cytokine production, mitochondrial calcium homeostasis | |
| negative correl. | M51 | Membrane organization, cytokinesis, cell division |
| 10% O2 | ||
| negative correl. | M65 | Protein polyubiquitination, cell division |
| 0–21% O2 | ||
| positive correl. | M91 | (see above) |
| M54 | Intertypic cell–cell adhesion, positive regulation of stress fiber assembly, reactive nitrogen species metabolism, IL-1, IFNγ production | |
| M19 | Glycosylation, lipid biosynthesis, positive regulation of IKß kinase, NFKB signaling, cell-matrix adhesion | |
| M64 | VEGF/VEGFR1 pathway, angiopoietin receptor pathway, PI3K/Akt signaling, NTRK2/TRKB signaling | |
| M59 | Glycosphingolipid biosynthesis, TOLL-like receptor signaling, apoptosis | |
| negative correl. | M43 | Protein sumoylation, ribosome biogenesis |
| M29 | Epigenetic regulation of gene expression, base excision repair, telomere maintenance, lipid homeostasis | |
| M25 | Mitochondrial outer-membrane permeabilization, fatty acid beta oxidation | |
| M50 | Base excision repair, thrombin PAR1 pathway | |
| M23 | Vesicle organization, cellular senescence | |
| M49 | P53 signaling pathway, protein targeting to lysosome, respiration electron tramsport | |
| M92 | Telomere maintenance via telomere lengthening, chaperone mediated protein folding, gene silencing by RNA | |
| M42 | Nucleotide excision repair, receptor mediated endocytosis | |
| M17 | Proteasome mediated ubiquitin-dependent protein catabolic process, protein exit from ER | |
| M57 | Negative regulation of TOR and TORC1 signaling, signaling by FGFR, peroxisome | |
| 95% O2 | ||
| positive correl. | M85 | Response to ionizing radiation, transcriptional activation of mitochondrial biogenesis, respiratory electron transport |
| M43 | (see above) | |
| M26 | DNA damage/telomere stress-induced senescence, negative regulation of cell development, regulation of oxidative stress-induced intrinsic apoptotic signaling | |
| M83 | Response to oxidative stress, DNA damage response, DNA integrity checkpoint signaling, negative regulation of mitochondrial cell cycle, transcriptional regulation by TP53 | |
| M39 | Negative regulation of developmental growth, positive regulation of fat cell differentiation, negative regulation of fibroblast prolifertation | |
| M40 | Protein mono-, polyubiquitiniation, protein catabolic process, negative regulation of NOTCH signaling | |
| M67 | Lipid homeostasis, DNA repair, DNA replication fidelity, telomere maintenance, cholesterol biosynthesis | |
| M72 | Regulation of extrinsic apoptosis, DNA repair | |
| negative correl. | M87 | (see above) |
| 0–95% O2 | ||
| negative correl. | M91 | (see above) |
| 95% O2 | 0–21% O2 | |
|---|---|---|
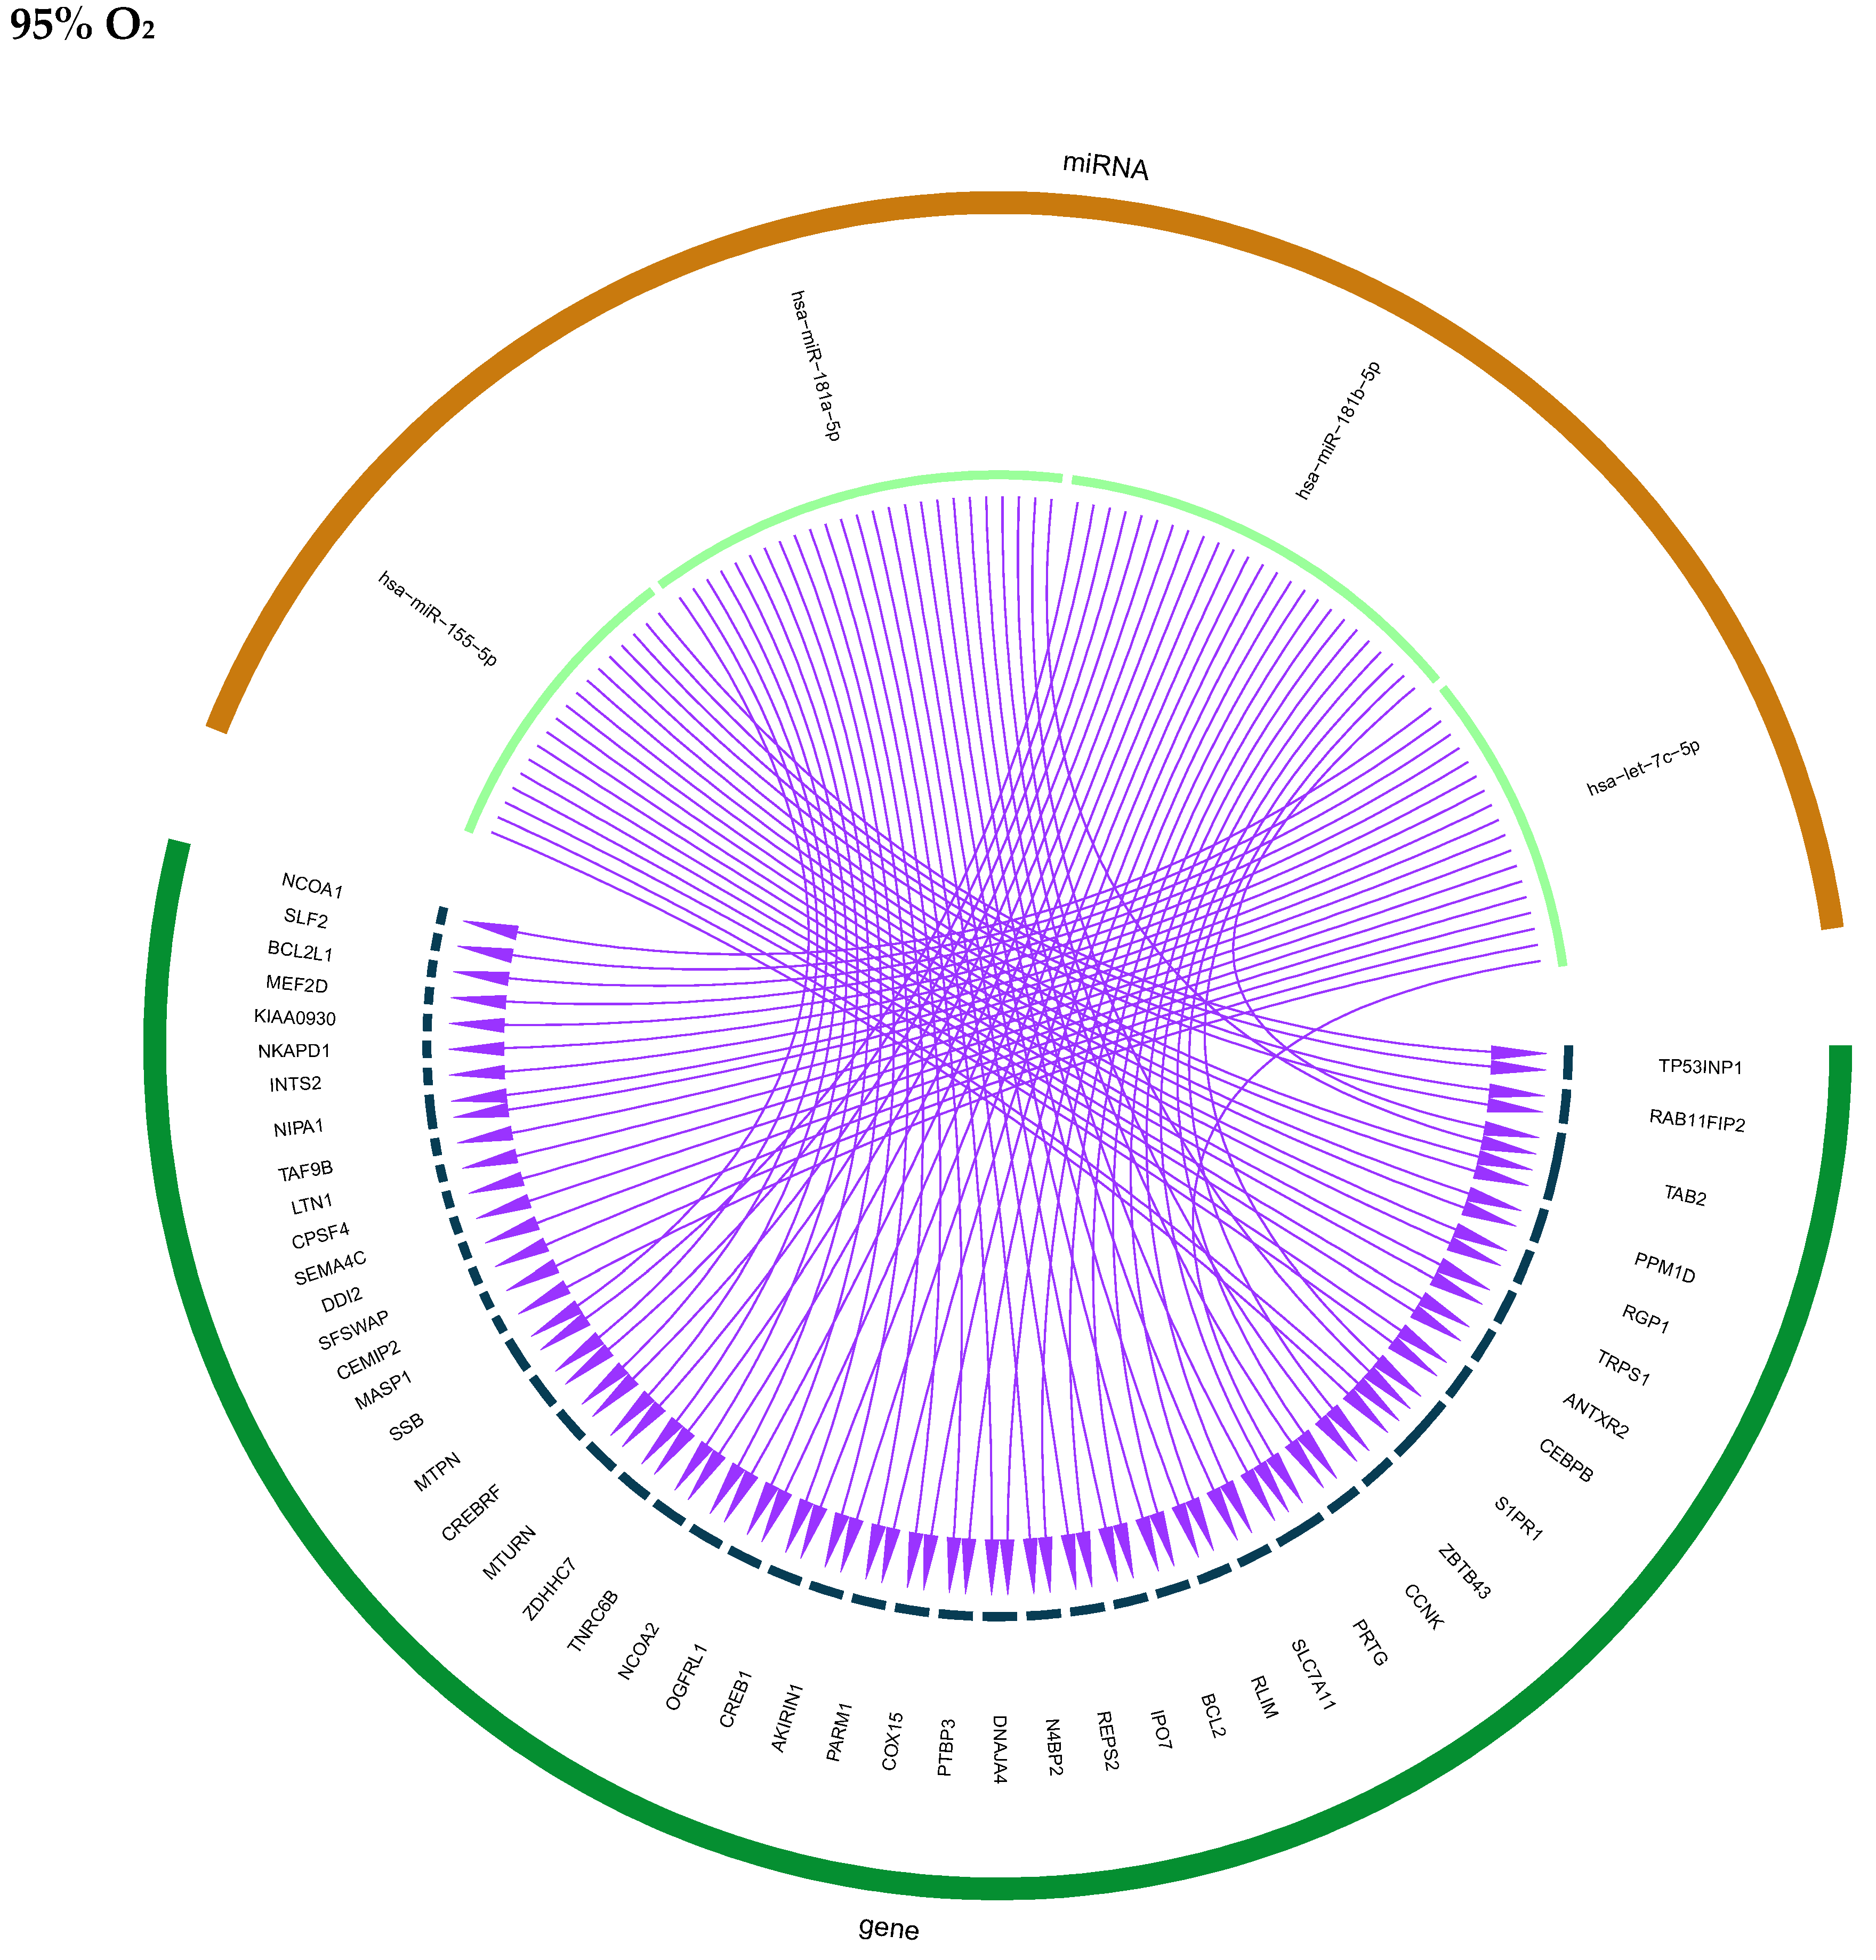
| miRNAs and Target genes altered in HMVEC-L | hsa-miR-155-5p_(TP53INP1, RAB11FIP2, TAB2, PPM1D, RGP1,TRPS1, ANTXR2, CEBPB, SIPR1) hsa-miR-181a-5p (ZBTB43. CCNK, PRTG, SLC7A11, RLIM, TAB2, BCL2, IPO7, REPS2, N4BP2, DNAJA4, PTBP3, COX15, PARM1, AKIRIN1, CREB1, OGFRL1, NCOA2, TNRC6B, ZDHHC7, MTURN, S1PR1, CREBRF, MTPN, SSB, PRTG) hsa-let-7c-5p (PRTG, MASP1, CEMIP2, SFSWAP, DDI2, SEMA4C, CPSF4, LTN1, TAF98, NIPA1, INTS2, NKAPD1, KIAA0930, MEF2D, BCL2L1, SLF2, NCOA1) | hsa-miR-30b-5p hsa-miR-129-5p hsa-miR-224-5p hsa-miR-125a-5p hsa-miR-654-3p hsa-miR-134-5p hsa-miR-92a-3p hsa-let-7i-5p hsa-miR-629-5p hsa-miR-1304-3p hsa-miR-410-3p corresponding target genes altered in mother cell (see Supplemental Data S4) |
| Signaling pathways | Intrinsic apoptosis Cell response to (chemical stress) ESR-mediated signaling KEAP1-NFE2L2 pathway IL4 and IL13 signaling NLRP1 inflammasome Transcriptional activation of mitochondrial biogenesis Circadian clock | Regulation of MECP2 expression and activity RUNX1 regulates expression of tight junctions IL7 signaling Transcription of BIM |
| 5% O2 | 0–21% O2 |
| Signaling by ERBB2, FGFR, GAB1, DAP12, NOTCH, PDGF, NGF PIE/Akt activation Ca2+ pathway Cellular response to stress | Cellular response to stress Oxidative stress-induced senescence (mitotic) cell cycle Signaling by RhoGTPase, NOTCH, Wnt, EGFR, FGFR, DAP12 Chromatin modification Epigenetic regulation of gene expression VEGFR2-mediated cell proliferation Histone methylation, DNA damage/telomere stress-induced senescence Ca2+ pathway |
| 95% O2 | 0–95% O2 |
| Cellular response to stress (oxidative stress-induced) cellular senescence Negative regulation of rRNA expression Immune system Cytokine signaling (IL-6) Apoptosis Activated TLR4 signaling | Oxidative stress-induced senescence PIP3/Akt activation Immune system Ca2+ pathway TP53 regulation of metabolic genes DNA methylation VEGFA/VEGFR2 pathway |
Disclaimer/Publisher’s Note: The statements, opinions and data contained in all publications are solely those of the individual author(s) and contributor(s) and not of MDPI and/or the editor(s). MDPI and/or the editor(s) disclaim responsibility for any injury to people or property resulting from any ideas, methods, instructions or products referred to in the content. |
© 2024 by the authors. Licensee MDPI, Basel, Switzerland. This article is an open access article distributed under the terms and conditions of the Creative Commons Attribution (CC BY) license (https://creativecommons.org/licenses/by/4.0/).
Share and Cite
Schaubmayr, W.; Hackl, M.; Pultar, M.; Ghanim, B.D.; Klein, K.U.; Schmid, J.A.; Mohr, T.; Tretter, V. Candidate Signature miRNAs from Secreted miRNAome of Human Lung Microvascular Endothelial Cells in Response to Different Oxygen Conditions: A Pilot Study. Int. J. Mol. Sci. 2024, 25, 8798. https://doi.org/10.3390/ijms25168798
Schaubmayr W, Hackl M, Pultar M, Ghanim BD, Klein KU, Schmid JA, Mohr T, Tretter V. Candidate Signature miRNAs from Secreted miRNAome of Human Lung Microvascular Endothelial Cells in Response to Different Oxygen Conditions: A Pilot Study. International Journal of Molecular Sciences. 2024; 25(16):8798. https://doi.org/10.3390/ijms25168798
Chicago/Turabian StyleSchaubmayr, Wolfgang, Matthias Hackl, Marianne Pultar, Bahil D. Ghanim, Klaus U. Klein, Johannes A. Schmid, Thomas Mohr, and Verena Tretter. 2024. "Candidate Signature miRNAs from Secreted miRNAome of Human Lung Microvascular Endothelial Cells in Response to Different Oxygen Conditions: A Pilot Study" International Journal of Molecular Sciences 25, no. 16: 8798. https://doi.org/10.3390/ijms25168798