Article

Activation of the G Protein-Coupled Bile Acid Receptor TGR5 Modulates the HCP5/miR-139-5p/DDIT4 Axis to Antagonize Cervical Cancer Progression

1
State Key Laboratory of Chemical Resource Engineering, College of Life Science and Technology, Beijing University of Chemical Technology, Beijing 100029, China
2
Key Laboratory of Receptors-Mediated Gene Regulation and Drug Discovery, School of Basic Medical Science, Inner Mongolia Medical University, Hohhot 010107, China
3
Key Laboratory of Receptors-Mediated Gene Regulation, School of Basic Medical Sciences, Henan University, Kaifeng 475001, China
*
Authors to whom correspondence should be addressed.
These authors contributed equally to this work.
Int. J. Mol. Sci. 2024, 25(16), 8932; https://doi.org/10.3390/ijms25168932
Submission received: 10 July 2024 / Revised: 10 August 2024 / Accepted: 12 August 2024 / Published: 16 August 2024
(This article belongs to the Special Issue Functional Analysis and Therapeutic Targets of Long Non-coding RNAs)

Abstract

:
A growing body of evidence indicates that the G protein-coupled bile acid receptor, TGR5, plays a critical role in multiple physiological processes ranging from metabolic disorders to cancers. However, the biological functions of TGR5 in cervical cancer (CC) have not been elucidated. Here, using TGR5 knockout mice, we found that a deficiency of TGR5 leads to greater sensitivity to the progression of cervical inflammation. Activation of TGR5 by its specific ligands significantly attenuated the malignant behavior of CC cells. In addition, we found that TGR5 can negatively modulate the expression of lncRNA HCP5 by blocking its transcription activation when mediated by p65. HCP5 was highly expressed in CC tissues, which was positively correlated with the poor prognosis of CC patients. HCP5 knockdown notably restrained CC cell proliferation, colony formation, and migration in vitro, and inhibited tumor growth in vivo. Furthermore, HCP5 can function as the molecular sponge for miR-139-5p to upregulate DNA damage-induced transcript 4 (DDIT4) in CC cells. Murine xenograft studies demonstrated that TGR5 suppressed the tumor formation of CC cells and downregulated HCP5 and DDIT4 while increasing miR-139-5p in the xenografts. Taken together, these findings, for the first time, indicate that TGR5 inhibits CC progression by regulating the HCP5/miR-139-5p/DDIT4 axis, suggesting that it may represent a novel and potent target for CC treatment.

1. Introduction

Cervical cancer (CC) is one of the most common malignant cancers in women, causing over 34,000 deaths annually all over the world [1]. The high incidence and mortality rate of CC make it a risky threat to women’s health [2]. With the development of clinical treatment strategies such as surgery, radiotherapy, and chemotherapy, the clinical outcome of early-stage cervical cancer has been improved significantly; however, treatment of those with advanced-stage cervical cancer remains unsatisfactory [3]. Therefore, further studies on the molecular mechanisms underlying the occurrence and development of CC remain a top priority, especially those that explore new methods for early diagnosis and treatment.
Takeda G protein-coupled receptor-5 (TGR5), also known as GPBAR1, is a novel transmembrane bile acid (BA) receptor and is involved in multiple pathological processes [4]. Previous studies have shown the critical role of TGR5 in energy homeostasis and glucose metabolism [5]. More than that, increasing evidence demonstrates that TGR5 is closely associated with the inflammatory process and cancer development. For example, activation of TGR5 has been shown to inhibit the inflammatory response by modulating the NLRP3 inflammasome [6]. Our group has implicated TGR5 as a negative regulator in the development of hepatitis and gastritis [7,8]. In addition, TGR5 has been shown to have anti-tumor activity in liver and kidney cancers [9,10]. Interestingly, TGR5 was found to be a tumor promoter in lung cancer [11]. The bidirectional role of TGR5 in different cancers may be related to its tissue specificity. However, to date, the role of TGR5 in the progression of CC and the regulatory mechanisms involved remain unclear.
Long non-coding RNAs (LncRNAs) are a subclass of non-coding RNAs that are longer than 200 nucleotides without the ability to encode proteins. Until now, a mounting number of reports indicated that lncRNAs played a crucial role in multiple cancers, including CC [12,13]. For instance, lncRNA surfactant associated 1 (SFTA1P) is highly expressed in CC tissues and directly interacts with polypyrimidine tract binding protein 1 (PTBP1) to facilitate the proliferation, migration, and invasion progression of CC cells through enhancing the mRNA stability of tropomyosin 4 (TPM4) [14]. LncRNA LINC00511 functions as an oncogene in CC by promoting the malignant behavior of CC cells through competitively binding to miR-497-5p to upregulate the expression of MAPK1 [15]. LncRNA lymph node metastasis-associated suppressor (LNMAS) is closely associated with lymph node metastasis; its inhibition drives the EMT and immune evasion via enhancing the interaction between high mobility group box 1 (HMGB1) and BRG1, which contributes to the metastatic progression of CC [16]. In sum, lncRNA-based diagnostic and therapeutic targets may greatly benefit from the clinical management of CC.
In this study, we demonstrate that TGR5 reduced the expression of HCP5, leading to the induction of miR-139-5p and reduction of DNA damage-induced transcript 4 (DDIT4), which attenuates the development of CC both in vivo and in vitro. These findings show that TGR5 exerts an anti-tumor effect by regulating the HCP5/miR-139-5p/DDIT4 signaling axis, which is a novel anti-tumor mechanism of TGR5, suggesting that the TGR5/HCP5/miR-139-5p/DDIT4 axis may be a promising target for CC treatment.

2. Results

2.1. TGR5 Is Downregulated in CC, and Its Deficiency Promotes Cervical Inflammation Response

The expression levels of TGR5 were investigated using The Cancer Genome Atlas (TCGA) database (http://cancergenome.nih.gov/, accessed on 1 July 2020). We found that TGR5 expression was at a lower level in cervical cancer than in non-tumor tissues (Figure 1A). Consistent with the results in the TCGA database, the expression of TGR5 was downregulated in cancer tissues according to the GSE6791 dataset (Figure 1B). Meanwhile, overall survival (OS) analysis showed that patients with low TGR5 levels had shorter survival times than patients with high TGR5 levels (Figure 1C). Taken together, these results verify that TGR5 might act as a negative regulator during CC progression.
Next, we compared the expression of proinflammatory genes in the cervices of both TGR5 knockout (KO) and WT mice. We found that intercellular adhesion molecule 1 (ICAM1), complement C3 (C3), interferon-inducible protein (IP)-10, chemokine C-C motif ligand 2 (MCP-1), matrix metallopeptidase 9 (MMP9), and matrix metallopeptidase 12 (MMP12) were differentially upregulated in TGR5 KO mice (Figure 1D). We then compared the mRNA levels of proinflammation genes in the cervices of both TGR5 KO and WT mice after being treated with lipopolysaccharide (LPS). The upregulation of MCP-1, MMP7, and MMP9 induced by LPS was more intense in TGR5 KO mice than in WT mice (Figure 1E). Furthermore, we tested whether ligand-activated TGR5 could downregulate the expression levels of these proinflammatory genes induced by LPS. INT-777 treatment, which can activate TGR5, suppressed LPS-induced MCP-1, MMP9, IP-10, and C3 expression in the cervix tissues of WT mice (Figure 1F). Persistent activation of STAT3 has been found in various cancer types, including cervical cancer. It is regarded as a crucial regulator during the initiation and progression of cancers [17,18]. Furthermore, STAT3 signaling has been demonstrated to promote inflammation-regulated carcinogenesis [19]. We observed that the phosphorylation of STAT3 in TGR5 KO cervices was much higher than that in WT cervices under the LPS treatment (Figure 1G). Then, we used LPS to enhance the activation of the STAT3 pathway in the mouse cervix. TGR5 agonist treatment significantly weakens LPS-induced STAT3 phosphorylation in WT mice (Figure 1H). These results show that TGR5 acted as a negative modulator in the cervical inflammation response and was closely related to CC progression.

2.2. TGR5 Activation Suppresses Cervical Cancer Progression through the Downregulation of HCP5 Expression

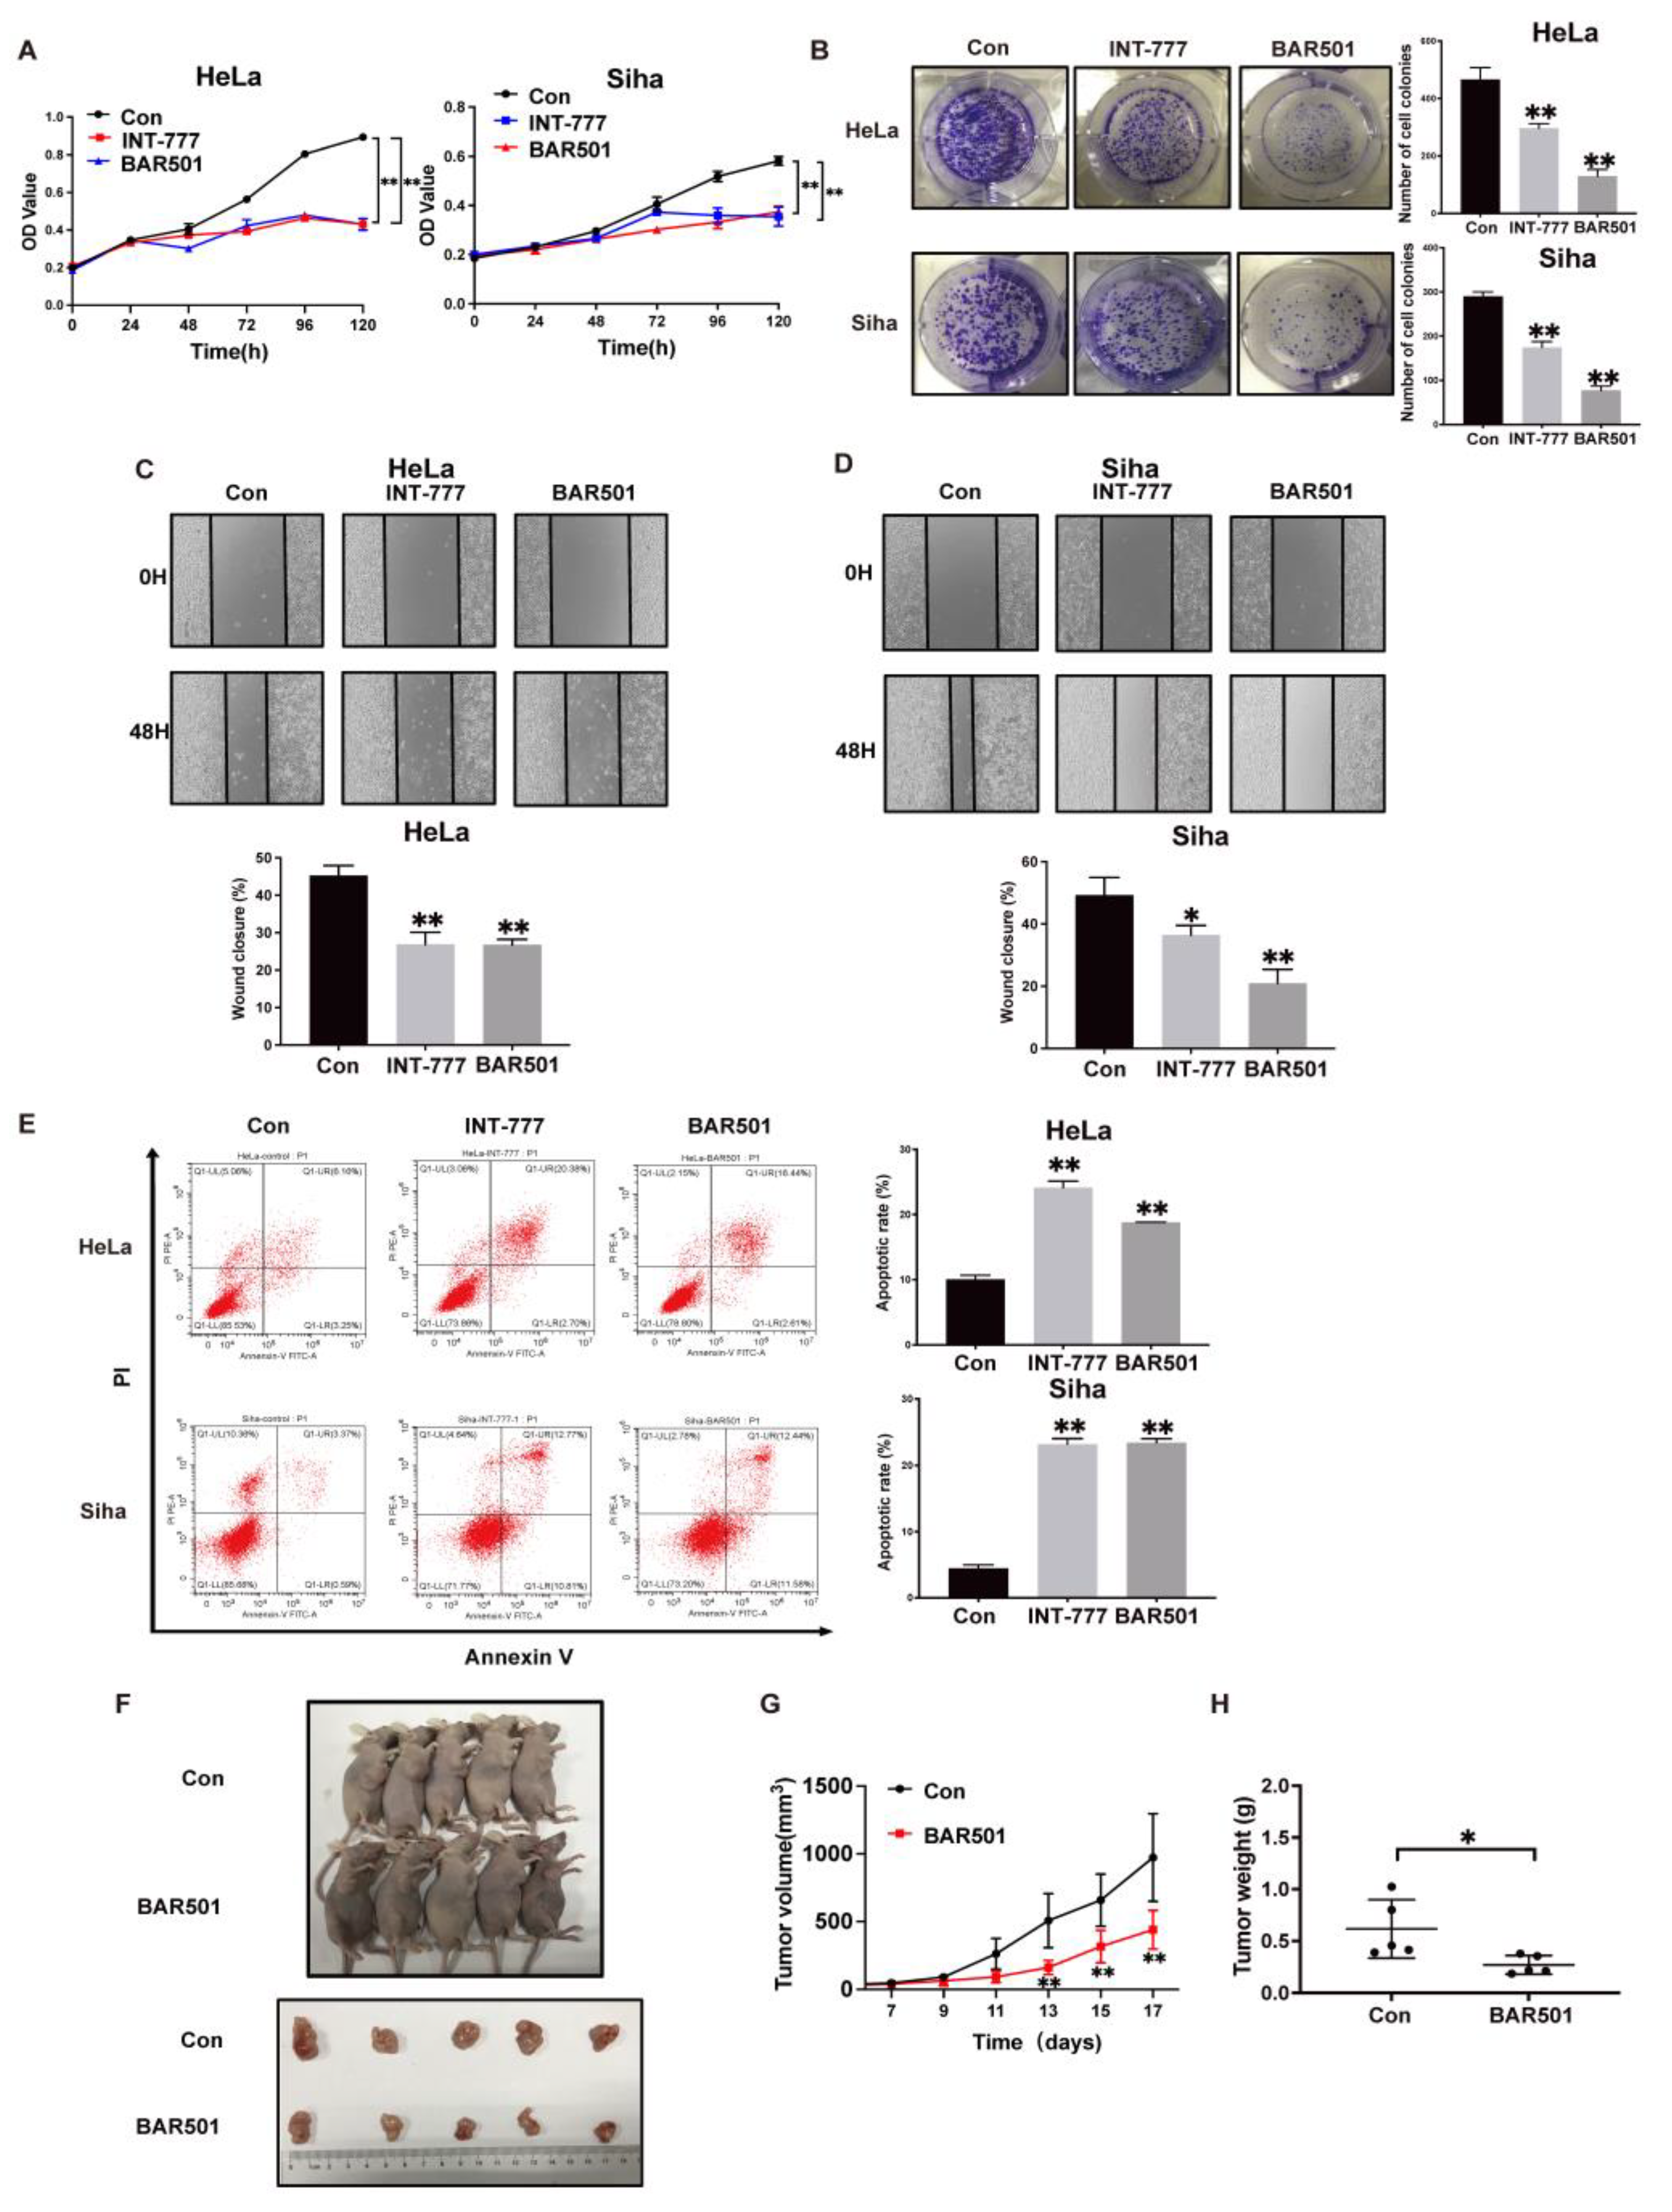
To evaluate the function of TGR5 in cervical cancer, we first activated TGR5 with its ligands, INT-777 and BAR501, to test the effect of TGR5 activation on CC cell growth and migration. As shown in the MTT assay, TGR5 ligand treatment significantly suppressed the cell growth of HeLa and Siha cells (Figure 2A). Similarly, colony-forming assays revealed that TGR5 activation impaired the cell colony growth rate (Figure 2B). A wound-healing assay further demonstrated that cells treated with INT-777 or BAR501 exhibited a lower wound closure rate than the control group (Figure 2C,D). Next, flow cytometry was performed to test whether TGR5 activation could affect CC cell apoptosis. As shown in Figure 2E, the ratio of apoptotic cells was significantly increased after being treated with INT-777 or BAR501 compared with the untreated group. To further determine the antitumor role of TGR5 in vivo, we subcutaneously injected HeLa cells into female nude mice to establish a xenograft model. Once the average tumor volume reached 100 mm3, mice were treated with BAR501 or the vehicle through intraperitoneal injection. During the treatment period, the size and weight of tumors in the BAR501-treated group were significantly smaller and lighter than those in the control mice (Figure 2F–H). Overall, these results suggested that the activation of TGR5 inhibited cervical cancer cell growth and migration in vitro, and impaired tumor growth in vivo.
Next, to elucidate the related lncRNAs involved in the anti-tumor effect mediated by TGR5 activation, we performed the lncRNA microarray to evaluate the dysregulated lncRNAs in response to TGR5 activation in HeLa cells. Among these differentially expressed lncRNAs, lncRNA HCP5 drew our attention (Table S3). The downregulation of HCP5 under TGR5 ligand treatment was first confirmed in HeLa and Siha cells through qRT-PCR (Figure 3A). Subsequently, we analyzed the expression of HCP5 in CC and adjacent tissues in the TCGA database and found that HCP5 was highly expressed in CC tissues (Figure 3B). Consistent with the results in TCGA, the overexpression of HCP5 was further confirmed in another three CC datasets (GSE9750, GSE29570, and GSE27678), providing further evidence of its aberrant upregulation in CC (Figure 3C). According to the result of the Kaplan–Meier survival analyses, high expression of HCP5 was found to be significantly associated with lower overall survival, indicating its prognostic value in CC (Figure 3D). Therefore, we turned our attention to HCP5 for further investigation.
To evaluate the potential function of HCP5 in the TGR5 activation-induced anti-tumor effect, we upregulated the HCP5 expression in CC cells using the HCP5 overexpression plasmid. The MTT assay showed that the cell growth inhibition induced by TGR5 activation was significantly attenuated by overexpressing HCP5 in HeLa and Siha cells (Figure 3E). Furthermore, the increase in apoptotic cell numbers due to the activation of TGR5 was restored by HCP5 in CC cell lines (Figure 3F). These results indicated that TGR5 impaired CC progression through regulating HCP5.
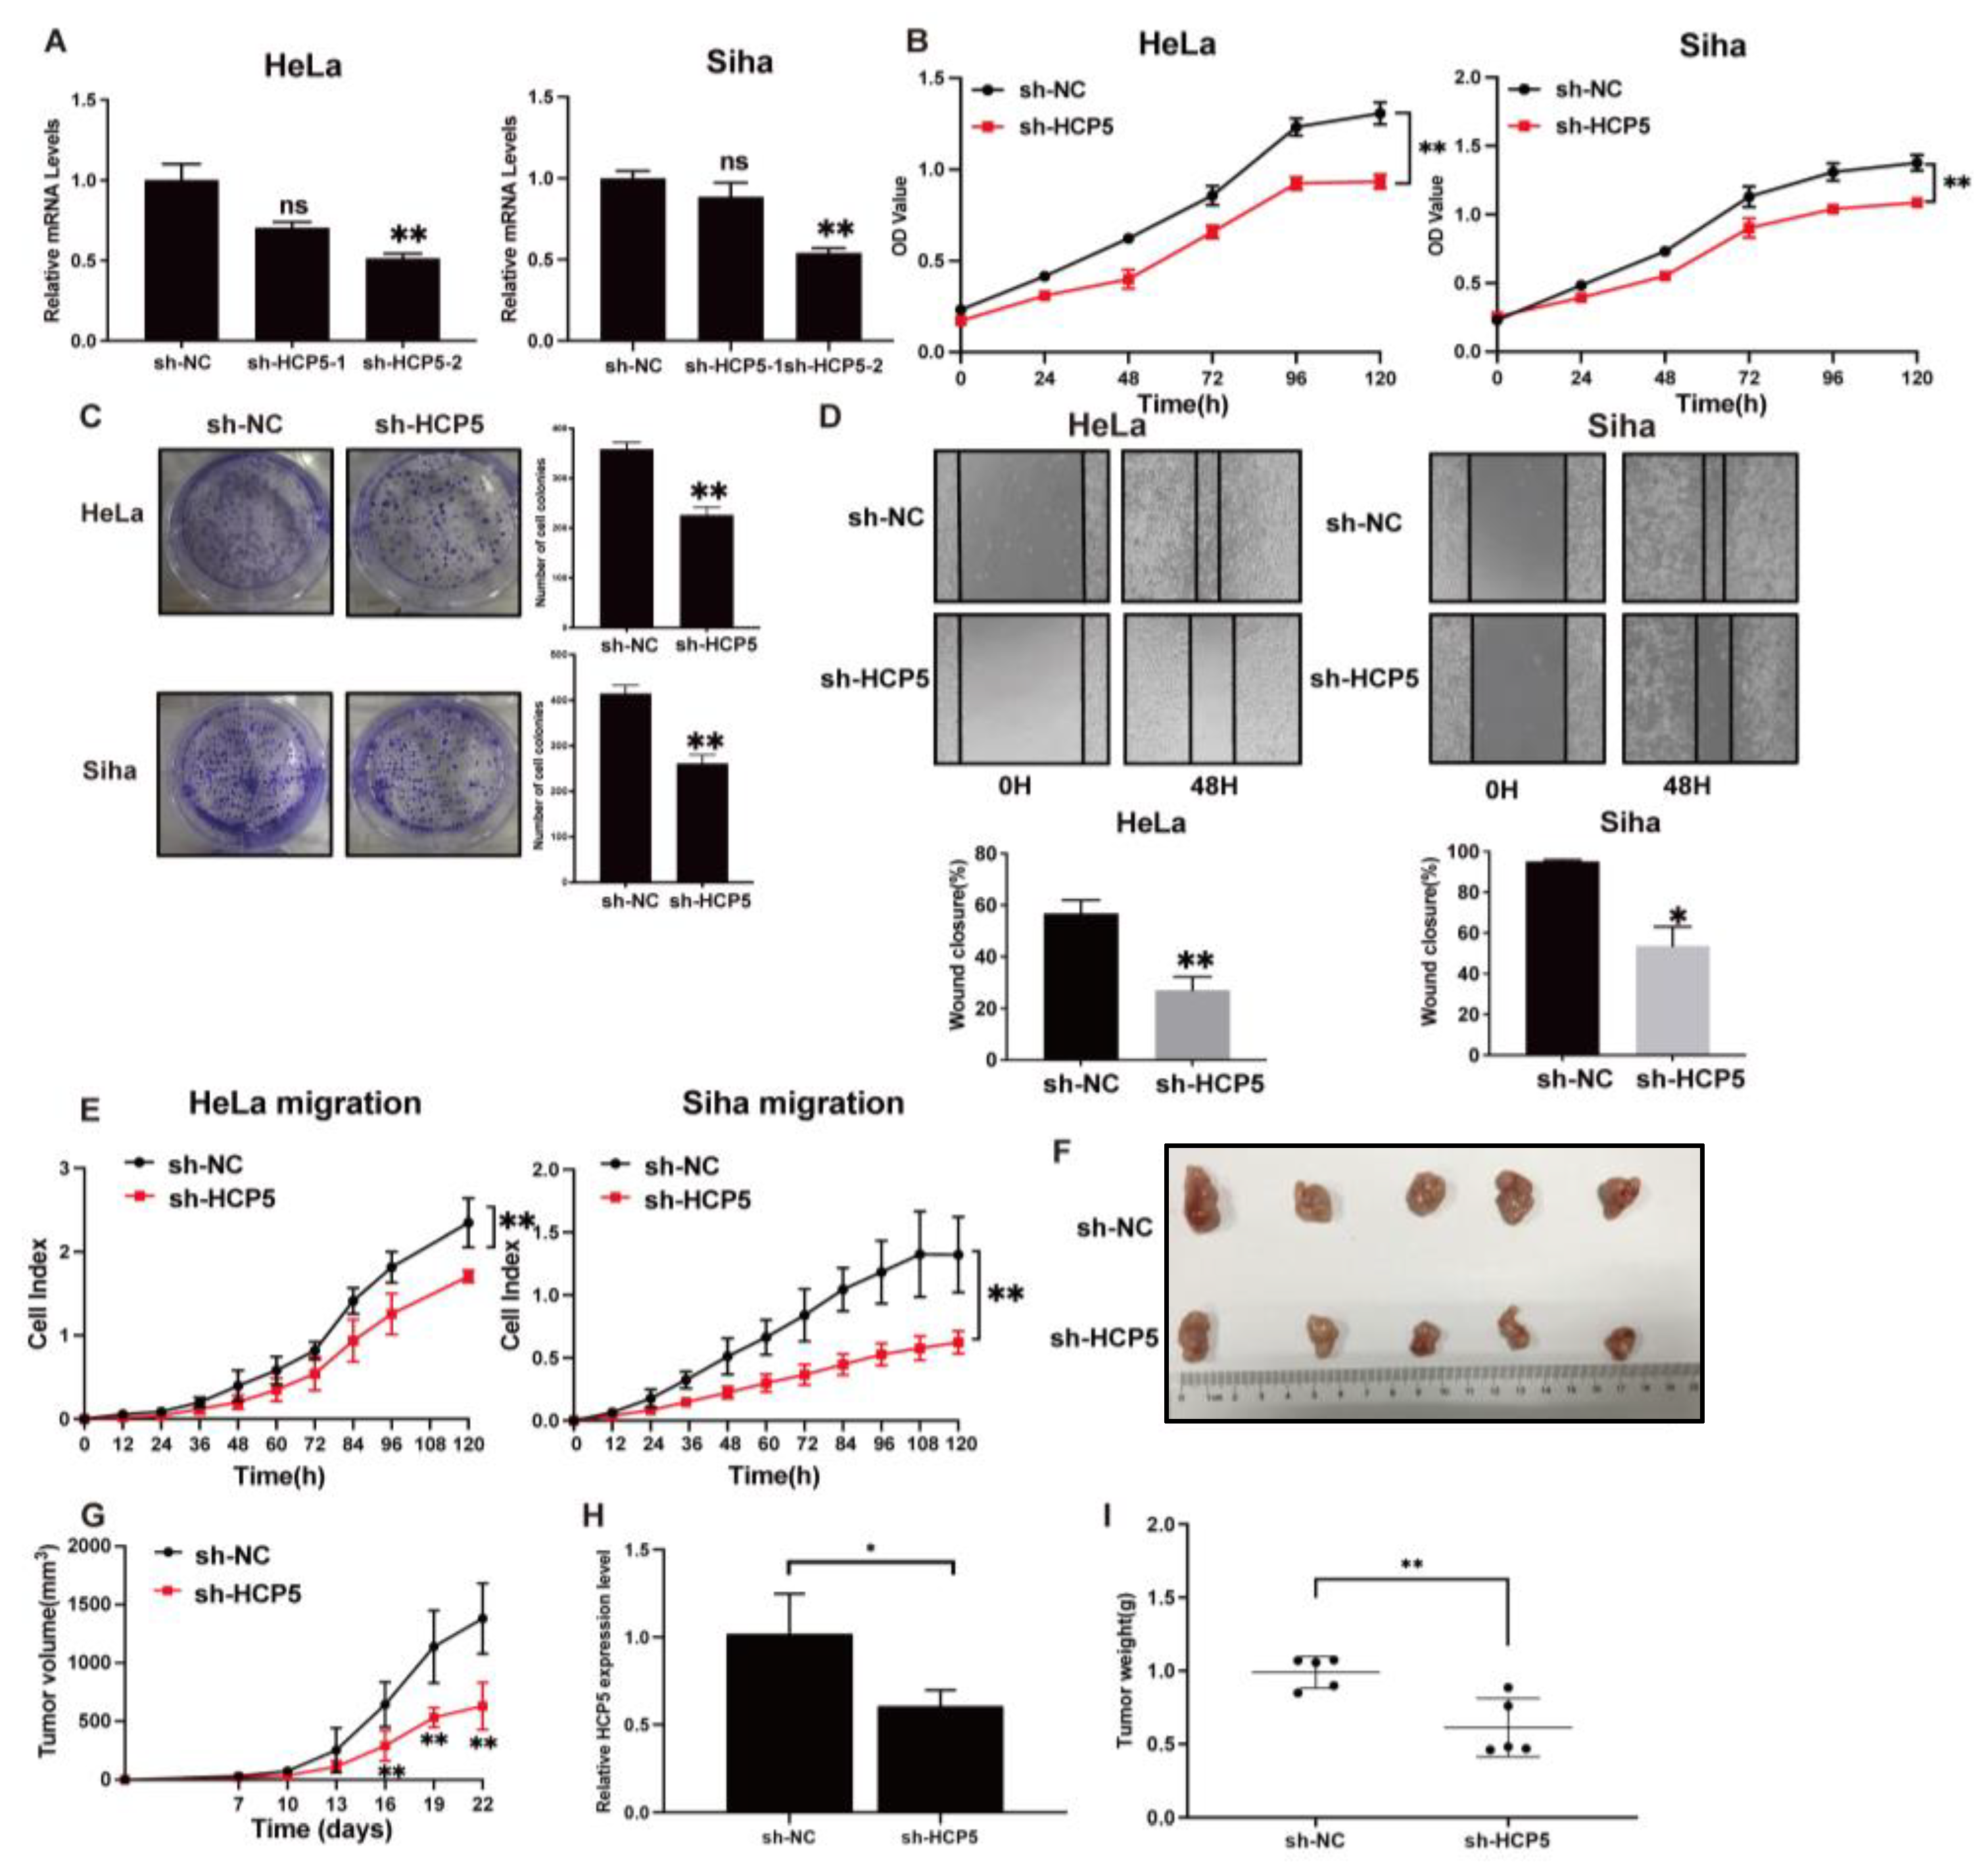
To further elucidate the role of HCP5 in CC, short hairpin RNAs (shRNAs) were used to knock down HCP5 in HeLa and Siha cells specifically. The knocking-down efficiency was determined using qRT-PCR (Figure 4A). MTT and cell colony formation assays indicated that the knockdown of HCP5 significantly inhibited cell growth and the proliferation of HeLa and Siha cells (Figure 4B,C). A wound-healing assay was performed to test the effect of HCP5 on the migration of CC cell lines. The results showed that the knockdown of HCP5 in HeLa and Siha cells significantly impaired the migration distance (Figure 4D). Additionally, we performed the cell migration assay using the xCELLigence® RTCA DP instrument system. As expected, the knockdown of HCP5 by shRNA suppressed cell migration (Figure 4E). To further verify the effect of HCP5 on tumor growth in vivo, HeLa cells transfected with sh-HCP5 or sh-NC were subcutaneously injected into nude mice to establish a xenograft model. As shown in Figure 4F, tumors formed in the sh-HCP5 group were significantly smaller than those in the control group. Compared to the control group, the efficient knockdown of HCP5 resulted in a significant reduction in tumor volume and weight (Figure 4G–I). Collectively, these findings suggested that HCP5 enhances CC cell proliferation and migration, and promotes tumor growth in vivo, thus contributing to CC progression.

2.3. TGR5 Suppressed HCP5 Expression Level through Transcriptional Inactivation

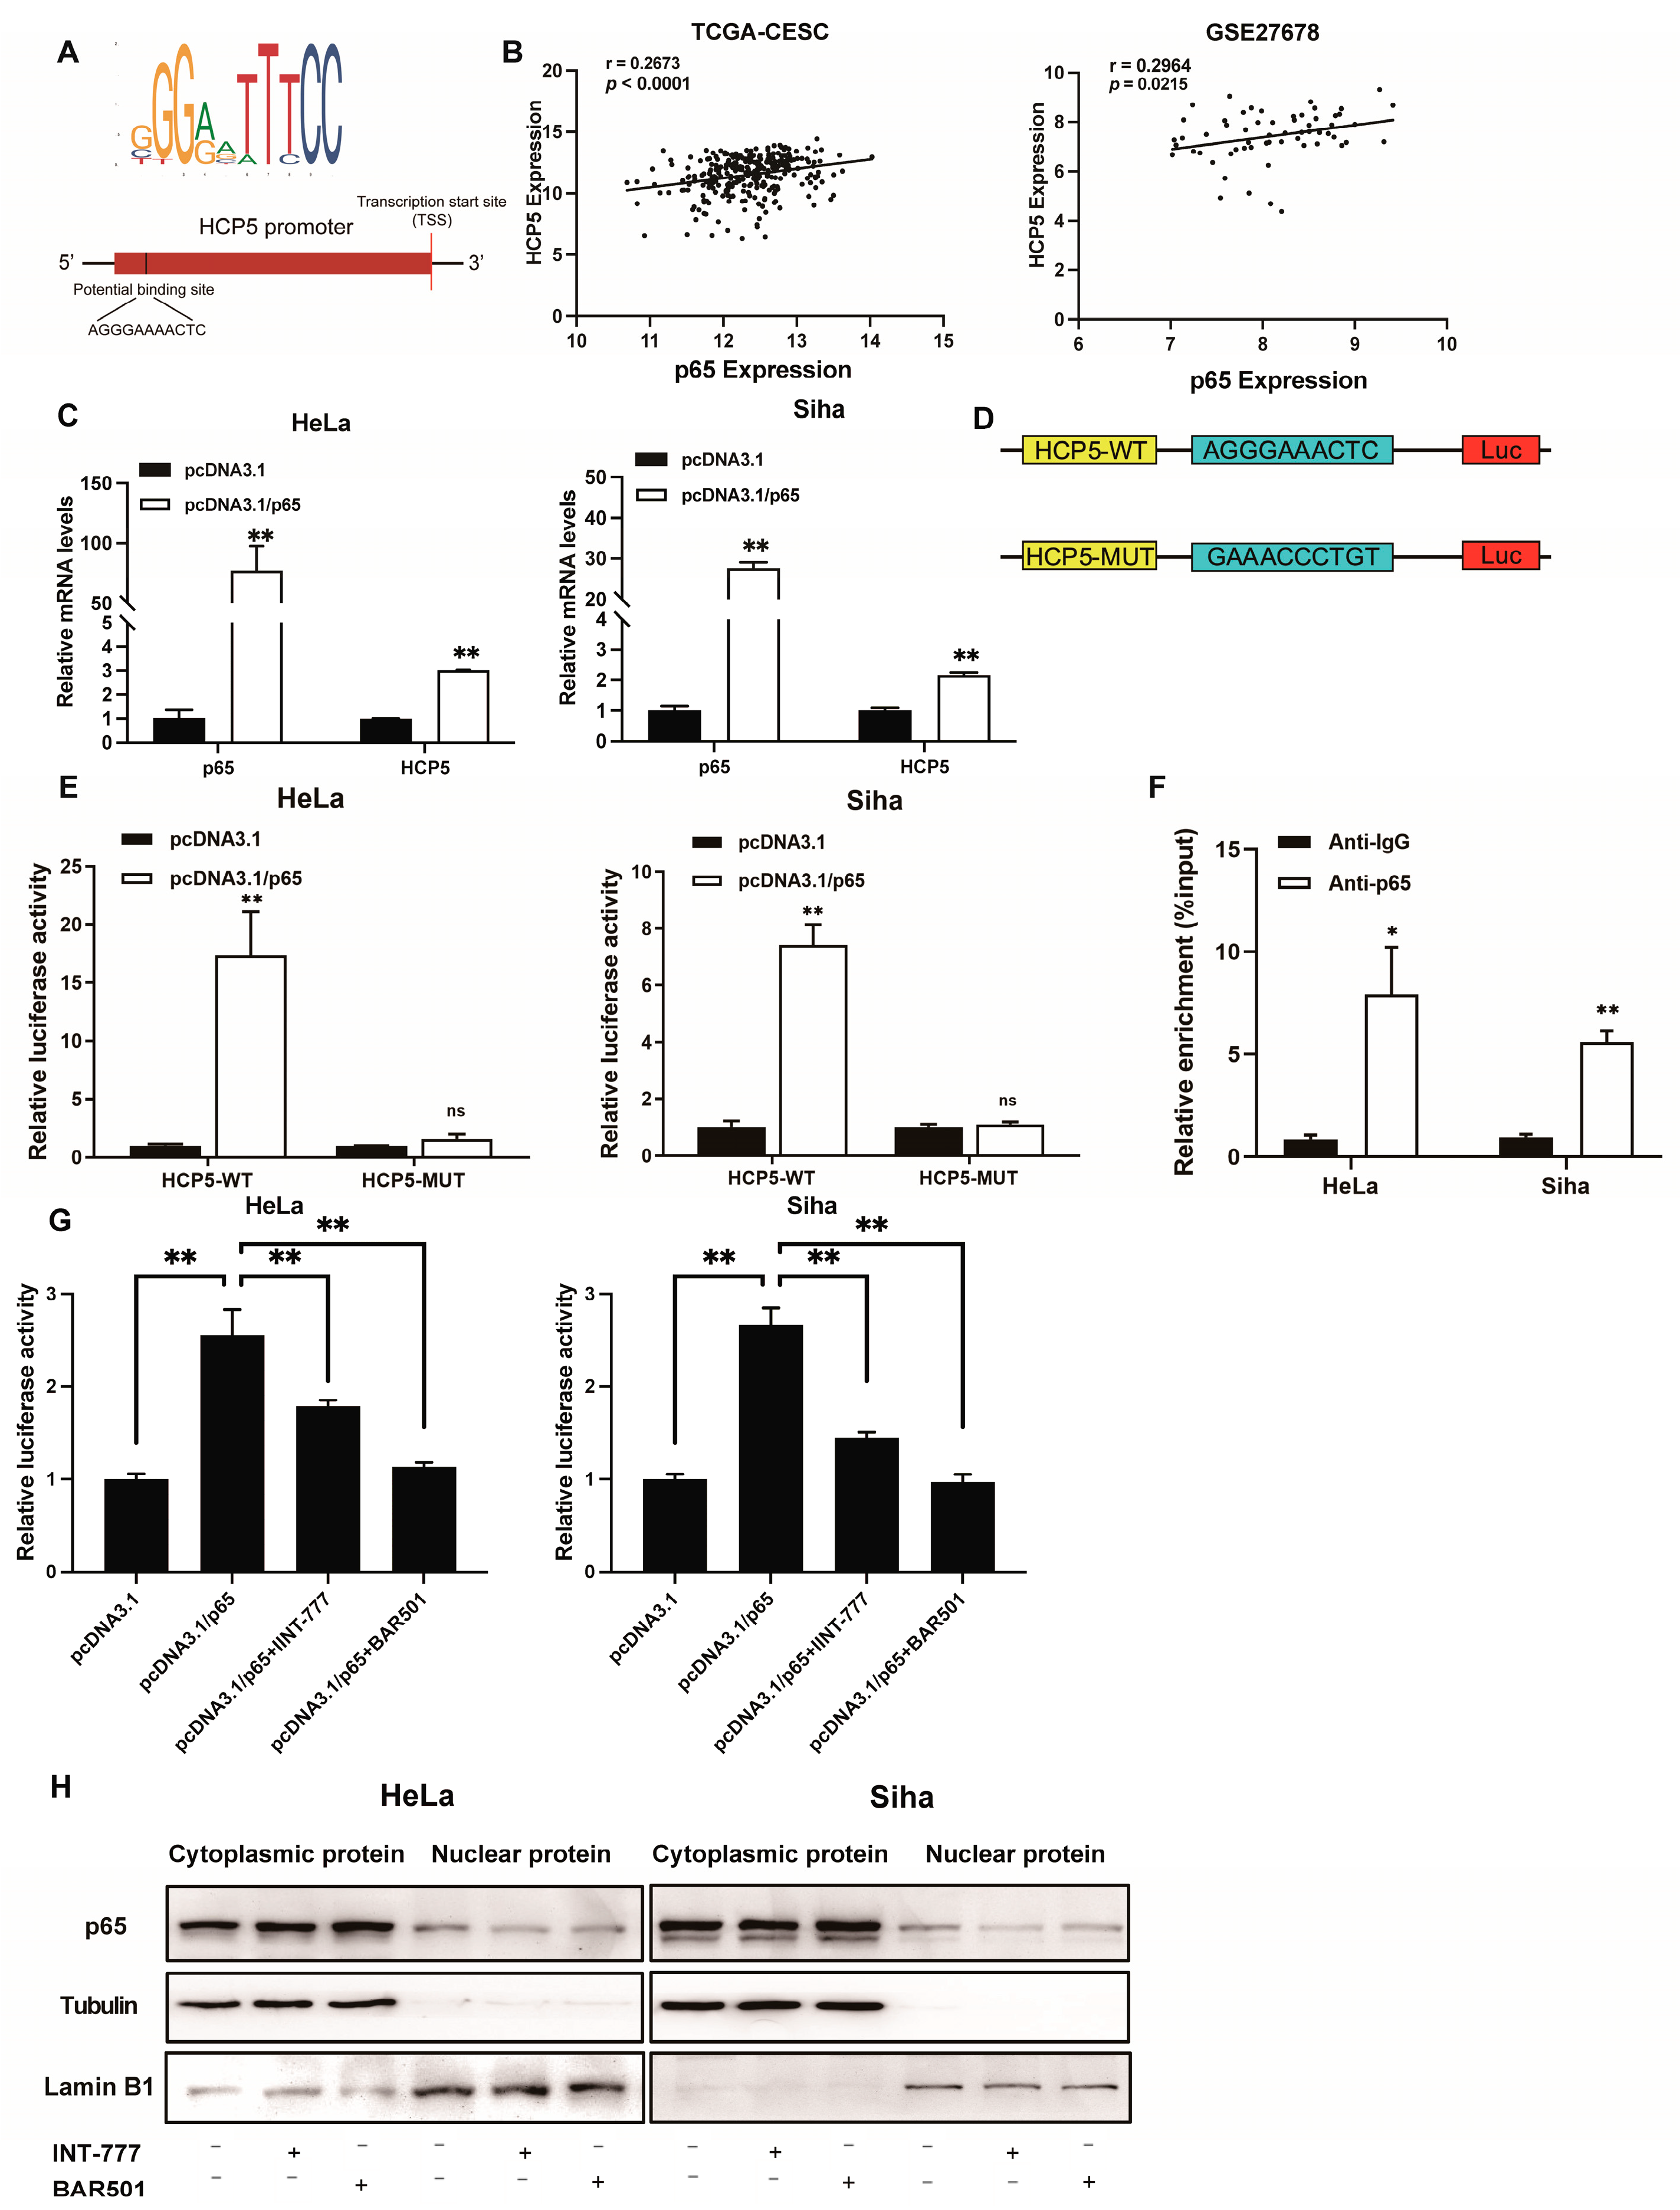
Next, we sought to uncover the mechanisms by which TGR5 modulates HCP5 expression in CC cells. Previous studies have shown that transcriptional factors (TFs) can modulate the expression level of some lncRNAs at the transcriptional level [20,21]. By using the UCSC and JASPR analysis tools, we found a putative p65 binding site in the promoter region of HCP5 (Figure 5A). Furthermore, we conducted the correlation analysis between p65 and HCP5 based on the TCGA and the GSE27268 datasets. As shown in Figure 5B, p65 expression was positively correlated with HCP5 expression in cancer tissues. Thus, we hypothesized that p65 might function as the transcriptional activator of HCP5. To confirm this hypothesis, we detected the HCP5 expression after overexpressing p65 in CC cells, and qRT-PCR results showed that p65 significantly upregulated the expression of HCP5 (Figure 5C), which indicated that p65 was essential for the upregulation of HCP5 in CC. To determine the interaction between p65 and the HCP5 promoter, we performed luciferase reporter experiments to clarify their modulation mechanism. As shown in Figure 5D, promoter–reporter plasmids with or without putative binding sites of p65 were co-transfected with p65 plasmids into CC cells. The luciferase activity of pGL4.1/HCP5-WT was increased upon p65 overexpression, and that of pGL4.1/HCP5-MUT hardly changed under the same treatment (Figure 5E). Furthermore, a Chromatin immunoprecipitation assay (ChIP) was performed to prove the interaction between p65 and the HCP5 promoter. The ChIP assay results showed that the fragment of the HCP5 promoter was significantly enriched by the anti-p65 antibody compared to the negative control, suggesting that p65 binds to the promoter region of HCP5 (Figure 5F). Thus, our findings proved that p65 could enhance the transcription of HCP5 in CC cells. Next, we hypothesized whether TGR5 activation could block the p65 transcriptional induction of HCP5, resulting in HCP5 downregulation. As shown in Figure 5G, the upregulation of pGL4.1/HCP5-WT vector activities induced by p65 was abolished after treatment with TGR5 ligands in HeLa and Siha cells. As we all know, p65 drives its target genes’ transcription level after translocating into the nucleus. Thus, we conducted a western blot to detect the p65 protein in nuclear/cytoplasmic extraction from CC cells after being treated with TGR5 ligands. As shown in Figure 5H, the protein level of p65 in the nucleus was downregulated once TGR5 activated, which indicated that TGR5 could inhibit the translocation of p65 in CC cell lines. Taken together, these findings demonstrate that TGR5 could negatively regulate HCP5 expression through attenuating p65 binding to the promoter region of HCP5, contributing to HCP5 downregulation.

2.4. HCP5 Functions as a Sponge to miR-139-5p to Target DDIT4 in CC Cells

Recently, mounting evidence has proved that lncRNAs may function as competing endogenous RNAs (ceRNAs) to interact with specific miRNAs, which are involved in modulating tumor progression [22,23]. As shown in Figure 6A, HCP5 has been distributed in the cytoplasm and nucleus of CC cells, demonstrating that it may modulate target expression at the posttranscriptional level. By using two different online bioinformatic pieces of software (Starbase, http://starbase.sysu.edu.cn/ and miRcode, http://www.mircode.org/, accessed on 5 January 2021), a potential binding site of miR-139-5p has been found in the HCP5 sequence (Figure 6B). We also found that miR-139-5p was significantly downregulated in CC tissues from the TCGA-CESC dataset (Figure S1A, accessed on 15 January 2021). Thus, miR-139-5p was selected for further investigations. The results of the qRT-PCR indicated that the knockdown of HCP5 in CC cells significantly increased miR-139-5p levels.
In contrast, HCP5 overexpression exerted the opposite effect (Figure 6C). Additionally, HCP5 was significantly repressed after transfecting miR-139-5p mimics into CC cells (Figure 6D). To clarify further whether HCP5 acts as a molecular sponge to miR-139-5p in CC, a dual-luciferase reporter assay was performed, and the results showed that the luciferase activity of HCP5-WT was decreased when it was co-transfected with miR-139-5p mimics, while the inhibitory effect induced by miR-139-5p was abolished in HCP5-MUT plasmids (Figure 6E). To further elucidate the regulatory mechanism between miR-139-5p and HCP5, we performed the RNA-binding protein immunoprecipitation (RIP) assays. We found that both miR-139-5p and HCP5 were significantly enriched in the AGO2 group compared to the IgG group in both HeLa and Siha cells (Figure 6F). To further illuminate the biological role of miR-139-5p in CC, MTT assays and wound-healing assays were performed. The results showed that the proliferation and migration of HeLa and Siha cells were significantly inhibited after they were transfected with miR-139-5p mimics (Figure S1B,C).
Next, to elucidate the target gene of miR-139-5p, we used five online miRNA target-predicting tools (Starbase, miRWalk, DIANA, TargetScan, and miRDIP) to analyze its potential downstream targets. We found 40 candidate genes (Figure 6G). Among them, DDIT4 was found to be elevated in CC tissues from the TCGA-CESC dataset and was positively associated with the poor overall survival of CC patients (Figure S2A,B). In addition, the correlation analysis showed that DDIT4 positively correlated with lncRNA HCP5 in CC tissues (Figure S2C). Therefore, DDIT4 was identified as the target gene of miR-139-5p for further studies. We then cloned a fragment of the DDIT4 3′UTR, which contained the predicted miR-139-5p binding site (DDIT4-WT) or the mutant binding site (DDIT4-MUT), into luciferase reporter plasmids, and subsequently co-transfected these vectors with miR-139-5p mimics into HeLa and Siha cells (Figure 6H). Luciferase assays revealed that miR-139-5p notably reduced the luciferase activity of the DDIT4-WT plasmid but did not affect the DDIT4-MUT plasmid (Figure 6H). Furthermore, both the mRNA and protein levels of DDIT4 were notably decreased in HeLa and Siha cells after they were transfected with miR-139-5p mimics (Figure 6I,J). To further explore the biological function of DDIT4 in CC, we knocked down its expression in CC cells through transfection with siRNA. The knockdown efficiency was confirmed using a qRT-PCR (Figure S2D). The MTT assays and scratch assays revealed that the knockdown of DDIT4 inhibited cell proliferation and migration (Figure S2E,F). In addition, DDIT4 downregulation induced apoptosis in CC cell lines (Figure S2G). Taken together, these data suggest that HCP5 regulates the expression of DDIT4 through competitively sponging miR-139-5p in CC.

2.5. Activation of TGR5 Inhibits CC Progression by HCP5, Which Promotes CC Progression by Modulating the miR-139-5p/DDIT4 Axis In Vivo and In Vitro

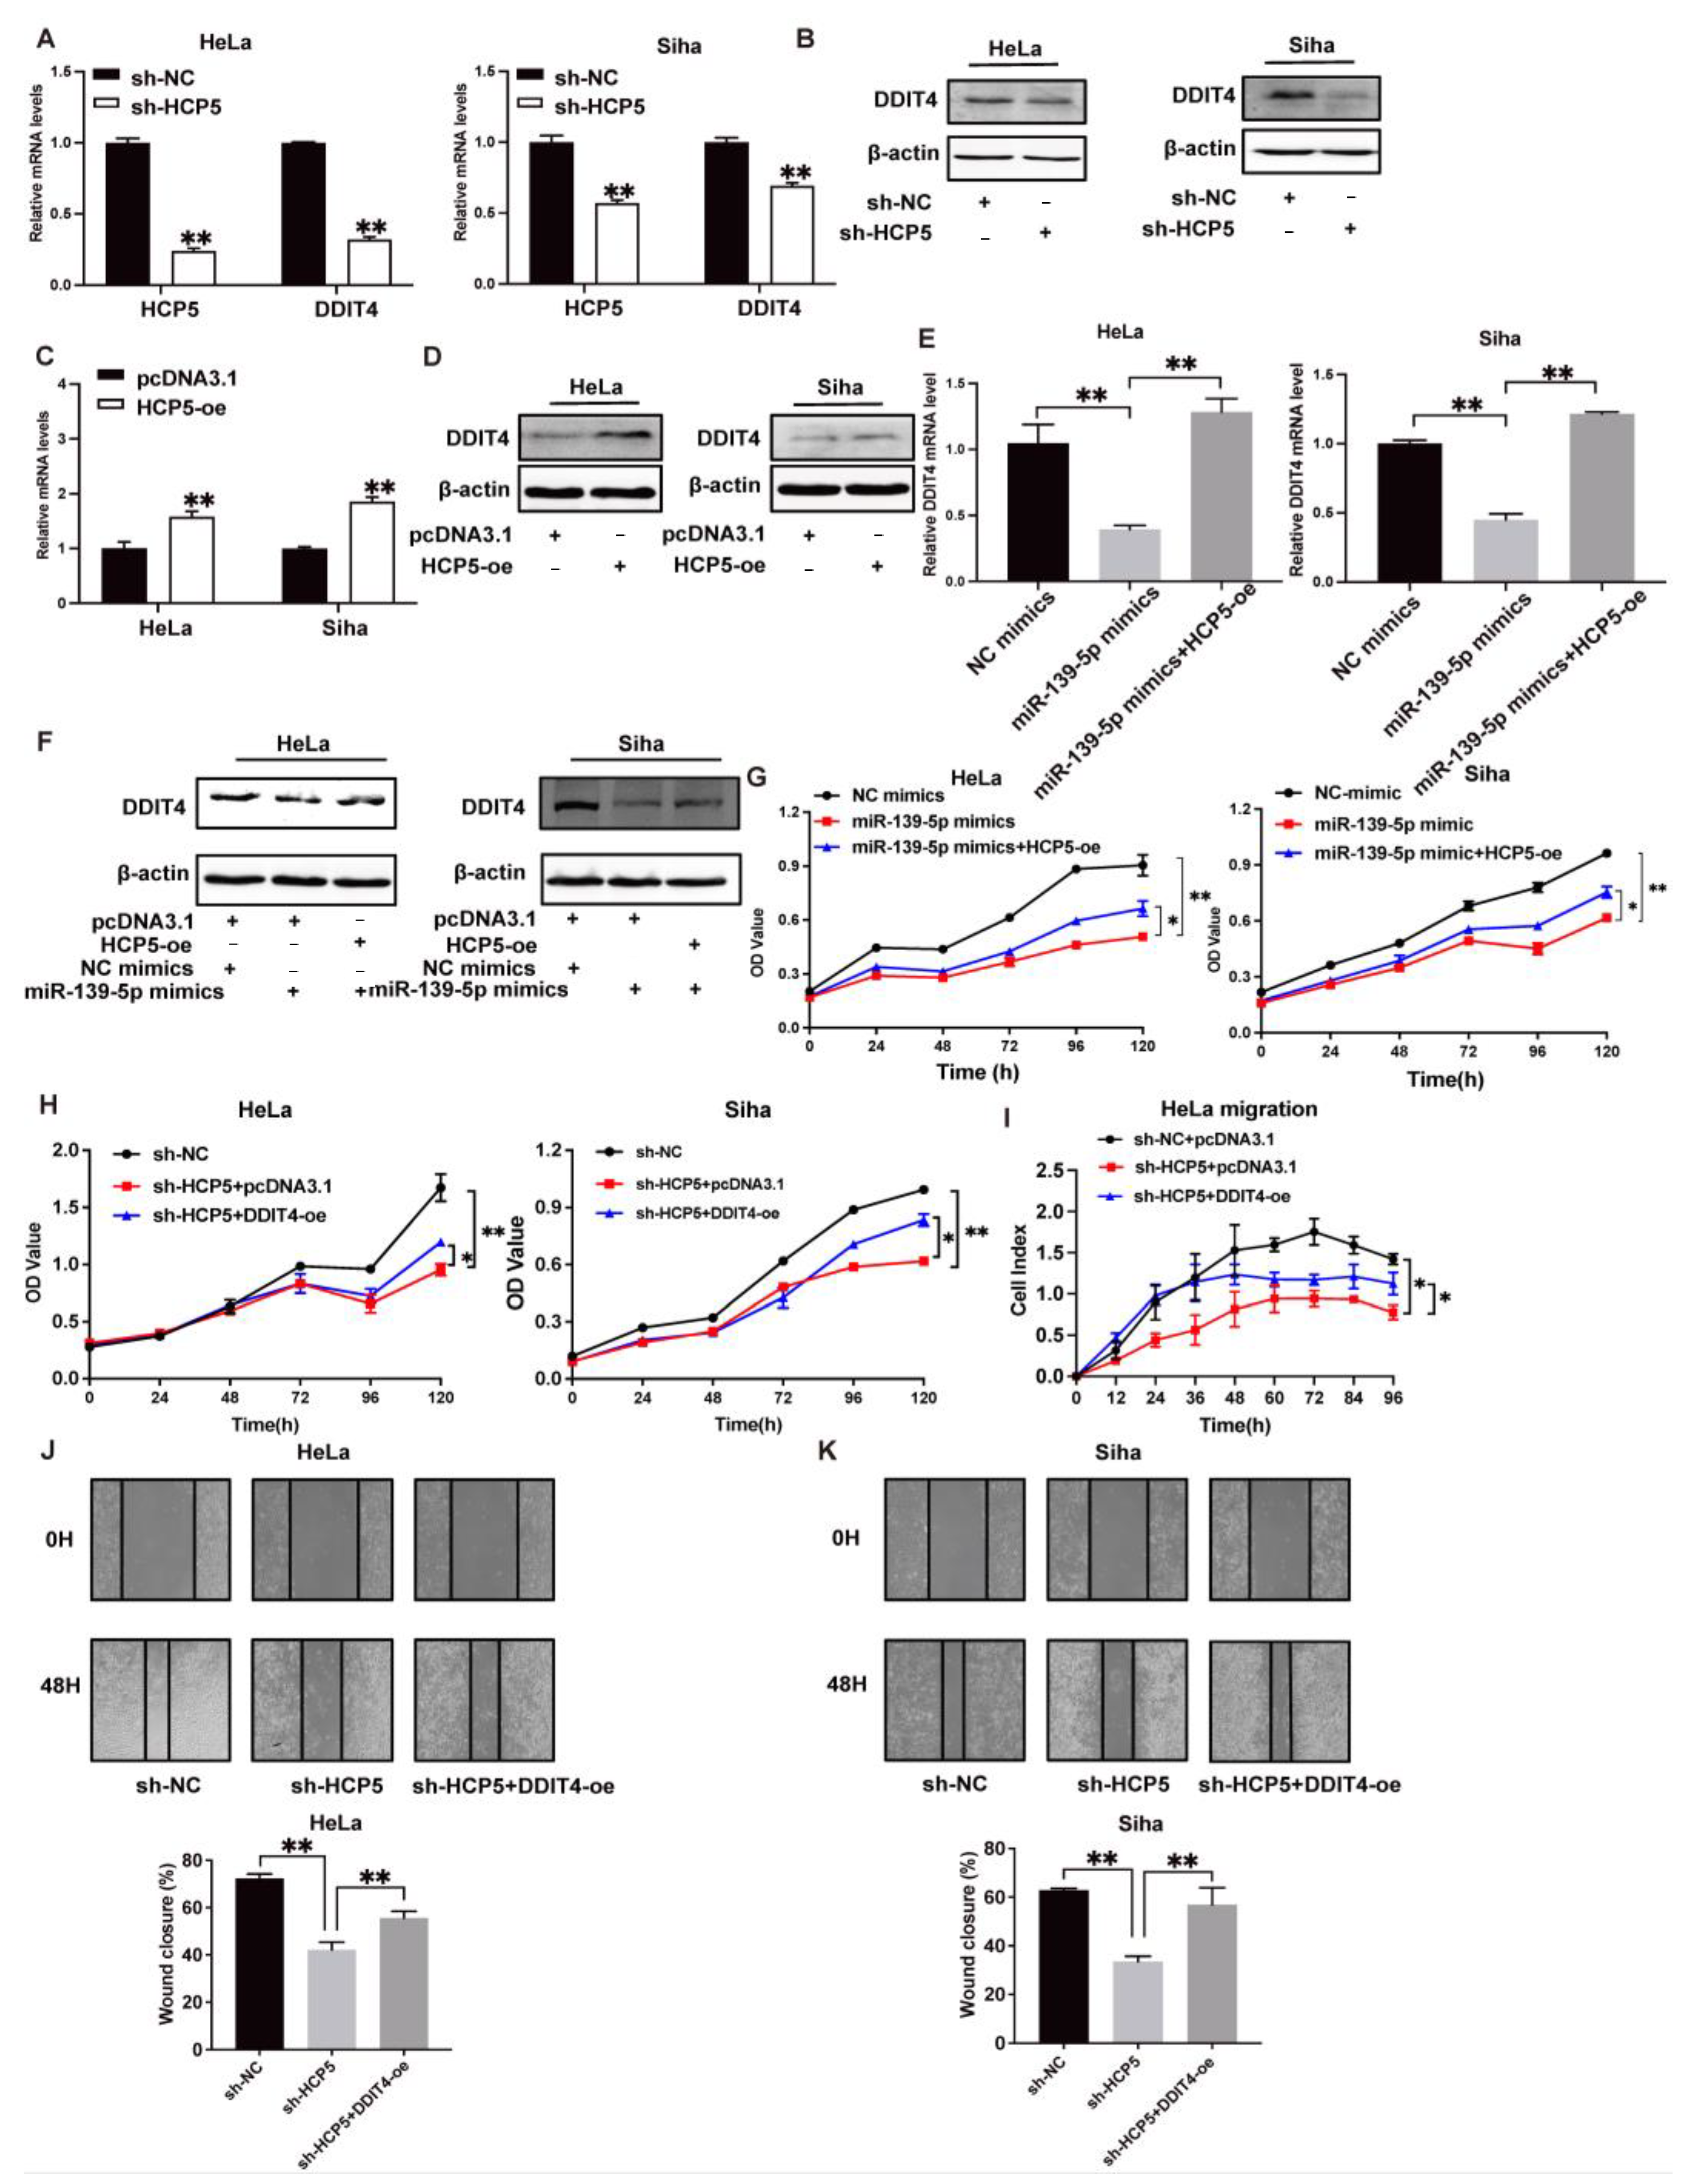
Subsequently, we further explored whether HCP5 exported its role in CC cells by modulating the miR-139-5p/DDIT4 axis. Both the mRNA and protein levels of DDIT4 were significantly reduced in HCP5-silenced CC cell lines (Figure 7A,B), whereas ectopic HCP5 expression displayed the opposite effect (Figure 7C,D). To verify the role of miR-139-5p in the regulatory mechanism between HCP5 and DDIT4, we performed the rescue experiment through co-transfecting it with the HCP5 plasmid and miR-139-5p mimics into HeLa and Siha cells, and subsequently examined mRNA and protein levels using qRT-PCR and immunoblotting, respectively. As shown in Figure 7E,F, both the mRNA and protein levels were significantly suppressed by miR-139-5p, and HCP5 overexpression reversed this inhibitory effect (Figure 7E,F). Furthermore, MTT assays demonstrated that the suppression of cell proliferation induced by miR-139-5p in HeLa and Siha cells was partly restored by HCP5 overexpression (Figure 7G). Additionally, results from the cell proliferation assay indicated that cell growth inhibition caused by HCP5 silencing was effectively reversed by the ectopic DDIT4 expression (Figure 7H). In line with the results from the MTT assay, DDIT4 overexpression partly restored the migration and wound-healing of HeLa and Siha cells impaired by the knockdown of HCP5 (Figure 7I–K). In summary, these findings indicate that HCP5 promotes CC progression via modulating the miR-139-5p/DDIT4 axis.
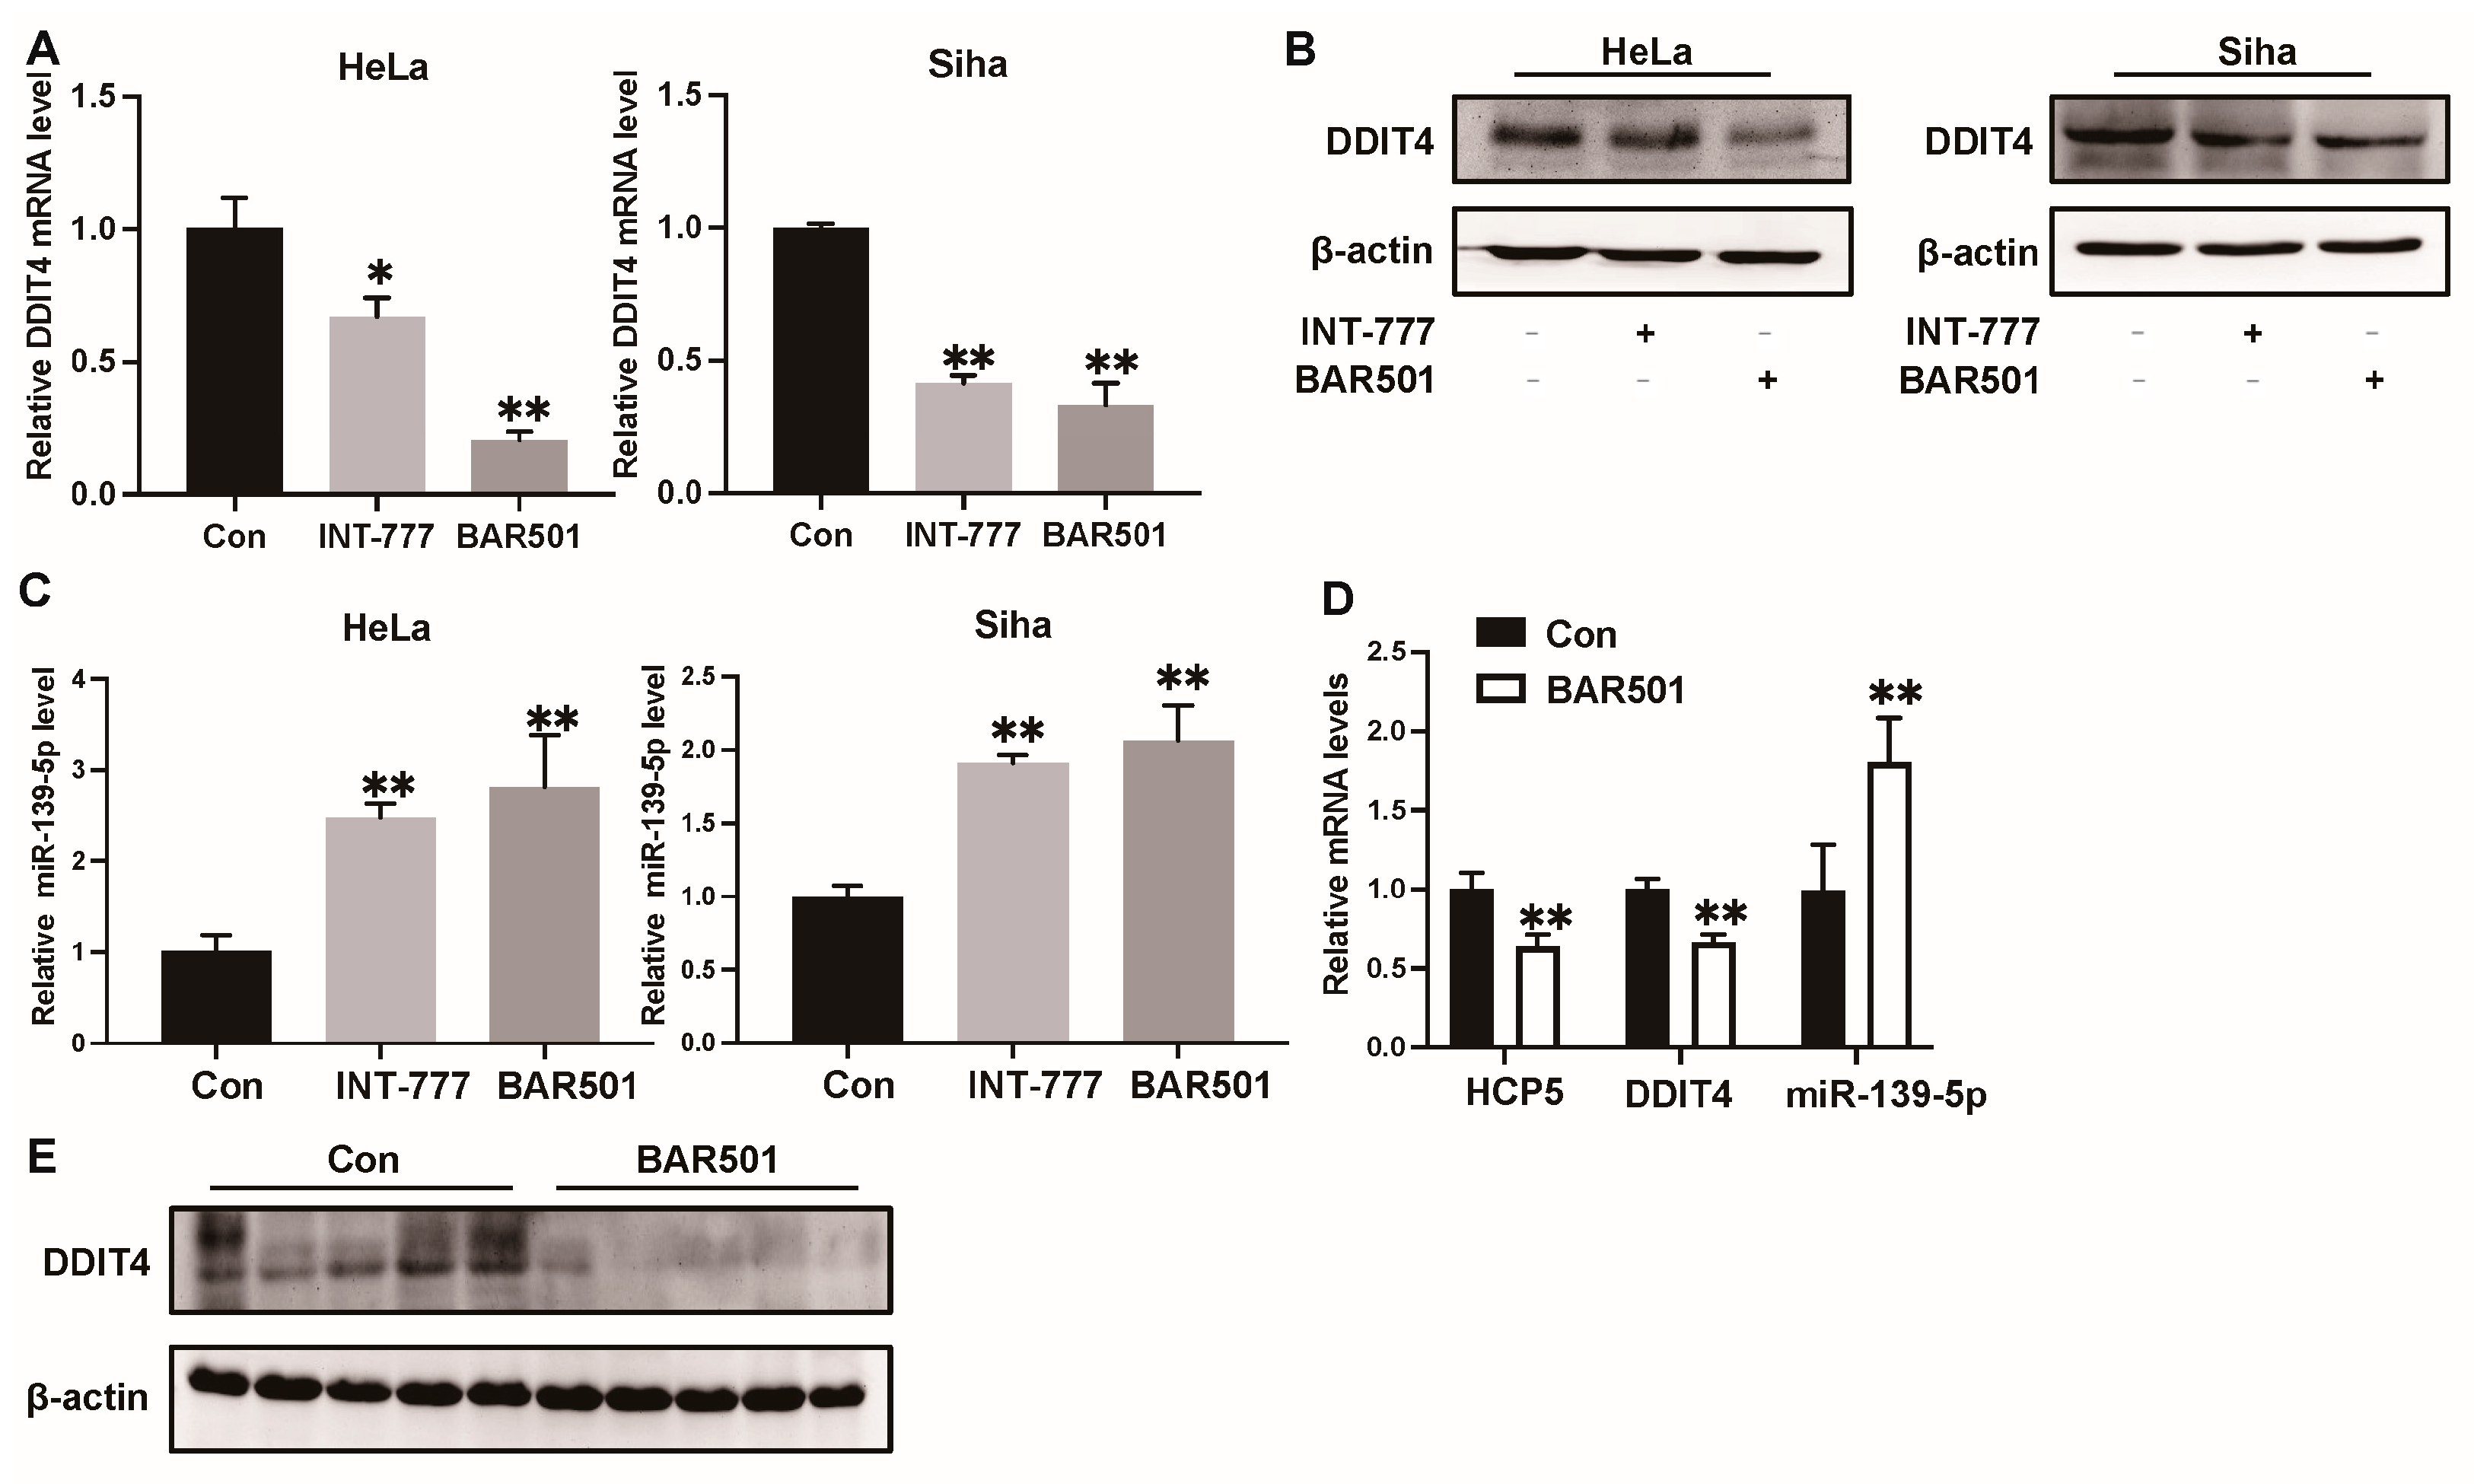
These studies have demonstrated that TGR5 can downregulate the expression of HCP5, while HCP5 can competitively sponge miR-139-5p to increase the DDIT4 level. Therefore, we further investigated the effect of TGR5 in the HCP5/miR-139-5p/DDIT4 axis. According to the results of the qRT-PCR and western blot assays, activation of TGR5 through different specific ligands significantly reduced the mRNA and protein levels of DDIT4 in CC cell lines (Figure 8A,B). At the same time, it increased miR-139-5p expression (Figure 8C). Additionally, we analyzed the expression levels of HCP5, miR-139-5p, and DDIT4 in CC xenografts treated with the TGR5 ligand BAR501. The results of the qRT-PCR indicated that TGR5 activation significantly inhibited HCP5 gene expression and DDIT4 gene and protein expression (Figure 8D,E), while inducing miR-139-5p expression (Figure 8D). Based on these findings, we can conclude that the anti-tumor effect of TGR5 activation in the CC xenograft was partially achieved via modulating the HCP5/miR-139-5p/DDIT4 axis in vivo (Figure 9).

3. Discussion

TGR5, belonging to the G protein-coupled receptor (GPCR) family, has been found to act as a bile acid membrane receptor [24]. Recently, a mounting number of studies have focused on the role of TGR5 in modulating energy, bile acid, and glucose metabolism, while its role and regulatory mechanism in human CC remained uncovered. In this study, we systematically investigated the biological function of TGR5 in CC, as well as the underlying molecular mechanisms in vivo and in vitro. We demonstrated that TGR5 is downregulated in CC tissues, and its expression is significantly related to a better clinical prognosis. Subsequently, TGR5 greatly inhibits cell proliferation and migration, while inducing cell apoptosis in CC cell lines. In addition, in vivo experiments showed that the activation of TGR5 suppresses tumor growth in mice.
In the past decade, an increasing number of studies have revealed the crucial role of lncRNAs in the initiation and development of multiple cancers [25,26,27,28]. In cervical cancer, a mounting number of lncRNAs, such as LINC00511 [29] and UCA1 [30], have been characterized, and their regulatory mechanisms have been well defined. lncRNA HCP5 has been reported to play crucial roles in various types of cancer. Recently, Li et al. reported that HCP5 promotes the proliferation and migration of CC cells through the miR-216a-5p/CDC42 axis [31]. Furthermore, HCP5 can sponge miR-15a to upregulate MACC1, thus promoting the malignant behavior of CC [32]. In this study, we observed that HCP5 was significantly downregulated once TGR5 was activated in CC. In addition, overexpressed HCP5 reversed the anti-tumor effect of TGR5 in CC. Subsequently, we further explored the regulatory mechanism between TGR5 and HCP5. Firstly, we identified that p65 acted as the transcription factor of HCP5 and could drive its transcription level. Our previous study revealed that TGR5 can inhibit I κ B α phosphorylation and then the nuclear translocation of p65 through enhancing β -arrestin2 interaction with I κ B α , resulting in antagonizing the NF- κ B signaling pathway in liver cancer cells [7]. In this work, we showed that TGR5 activation inhibited the nuclear translocation of p65 in ovarian cancer cells. We further confirmed that TGR5 repressed HCP5 expression by reducing the binding of p65 to the HCP5 promoter region. Thus, it is speculated that TGR5 may enhance the interaction of β -arrestin2 and I κ B α to antagonize the nuclear translocation of p65, inhibiting HCP5 expression. It will be interesting to study the mechanism of TGR5 regulating HCP5 in future work. In addition, to the best of our knowledge, our work provides the first evidence demonstrating that TGR5 plays a role in modulating lncRNA expression. Therefore, more efforts should be put into the elucidation of other potential lncRNAs which are regulated by TGR5.
lncRNAs can exert different biological functions to regulate the expression of downstream target genes at transcription, translation, and post-translational modification [33,34]. According to the nucleoplasmic distribution of HCP5 in CC cell lines, we investigated the downstream regulatory mechanism of HCP5 in CC. Previous researchers have reported that HCP5 can act as a molecular sponge to miRNA in different cancers [35,36]. In this study, the luciferase assay and RIP assays indicated that HCP5 acted as a sponge to miR-139-5p. Overexpression of miR-139-5p significantly suppressed the proliferation and migration of CC cells. Furthermore, rescue experiments demonstrated that HCP5 overexpression could reverse the growth-inhibiting effect induced by miR-139-5p, which indicates that HCP5 can sponge miR-139-5p to facilitate CC progression.
We further explored the downstream target genes of HCP5/miR-139-5p and revealed that DDIT4 is a novel target of miR-139-5p. DDIT4 is widely expressed in various tissues and is closely related to cellular stresses, such as hypoxia, ionizing radiation (IR), heat shock, etc. [37]. Previous studies have reported that DDIT4 facilitates the proliferation, migration, and drug resistance of several cancers, including glioma [38], gastric cancer [39], and lung cancer [40]. In this study, DDIT4 was elevated and positively related to HCP5 expression in CC tissues, while higher DDIT4 expression predicted a worse clinical prognosis. The knockdown of DDIT4 inhibited cell proliferation and migration, while inducing apoptosis in CC cell lines. In addition to this, TGR5 downregulated DDIT4 by reducing HCP5 in CC cells, while HCP5 can enhance DDIT4 expression through sponging miR-139-5p. In sum, these four molecules form the TGR5/HCP5/miR-139-5p/DDIT4 signal axis, which turns out to be a novel anti-CC mechanism of TGR5.

4. Materials and Methods

4.1. Cell Lines and Cell Culture

The CC cell lines HeLa and Siha were purchased from the Institute of Basic Medical Sciences of the Chinese Academy of Medical Sciences (Beijing, China). The HeLa and Siha cells were cultured in Roswell Park Memorial Institute (RPMI) 1640 culture medium and the Minimum Essential Medium (MEM) culture medium, respectively. All of the culture mediums were supplemented with 10% fetal bovine serum (FBS) (Santa Cruz, CA, USA) and 1% antibiotics (100 U/mL penicillin and 100 ug /mL streptomycin sulfates) (Caisson Laboratories, Smithfield, UT, USA). These CC cells were all maintained in a humidified atmosphere at 37 °C and with 5% CO2 in the air. To activate TGR5 in CC cells, the specific TGR5 agonist INT-777 (100 μM, MedChemExpress, Monmouth Junction, NJ, USA) or BAR501 (10 μM, MedChemExpress) was used to treat cells for 48 h.

4.2. Plasmid Construction and Cell Transfection

The full-length lncRNA HCP5 was cloned into the pcDNA3.1 vector (Invitrogen, Carlsbad, CA, USA) to generate the HCP5 overexpression plasmid. The p65 and DDIT4 overexpression plasmids were established by inserting the full-length coding sequence (CDS) of p65 and DDIT4 into the pcDNA3.1 vector. The shRNA targeting HCP5 was purchased from GenePharma (Shanghai, China). The negative control, DDIT4 siRNAs, miR-139-5p mimic, and the miR-139-5p inhibitor were all acquired from RiboBio (Guangzhou, China). Overexpression plasmids, shRNA targeting HCP5 (sh-HCP5), siRNAs targeting DDIT4 (si-DDIT4), miR-139-5p mimics, and NC mimics, were transfected into CC cells using Lipofectamine 3000 reagent (Invitrogen, Carlsbad, CA, USA). The following experiments were performed 48 h after transfection. The sequences of shRNA and siRNA, and the primers used to construct the overexpression plasmids are shown in Table S1.

4.3. RNA Isolation, Reverse Transcription and qRT-PCR

Total RNA from CC cells and xenografts was isolated using TRIZOL reagent (Invitrogen, Carlsbad, CA, USA), following the manufacturers’ directions. For mRNA and lncRNA detection, RNA was reverse transcribed into complementary DNA (cDNA) using the Strand cDNA Synthesis kit (Invitrogen, Carlsbad, CA, USA). For miRNA analysis, reverse transcription was performed using the miRNA First-Strand cDNA Kit (TIANGEN, Beijing, China). The qRT-PCR analysis was carried out using the Power SYBR Green PCR Master Mix protocol (Applied Biosystems, Foster, CA, USA). For the internal control, β-actin and U6 were chosen. The comparative CT (2−ΔΔCT) method calculated the relative RNA expression level. The primers for the qRT-PCR are presented in Table S2.

4.4. Subcellular Fractionation

Nuclear and cytoplasmic extractions of CC cells were carried out using the PARIS kit (Life Technologies, Carlsbad, CA, USA), following the directions of the manufacturer. The relative expression of HCP5, GAPDH, and U6 in both extractions was determined using a qRT-PCR.

4.5. Cell Proliferation Assay

To analyze the effect of TGR5 activation on cell viability, CC cells were seeded in 96-well plates. Twenty-four hours later, the cells were treated with or without TGR5 ligands, followed by the addition of 10 μL 3-(4,5)-dimethylthiahiazo (-z-y1)-3,5-di- phenytetrazoliumromide (MTT) (Lablead, Beijing, China) in each well. After 4 h of incubation, the purple crystals were extracted using DMSO, and optical density (OD) was measured at 570 nm with a microplate reader. The proliferation curve was determined by the OD value. As for investigating the role of HCP5 in CC cell proliferation, the cells were seeded in 96-well plates at 48 h after transfection; then, the MTT assay was performed as described above.

4.6. Cell Colony Formation Assay

CC cells were counted and seeded at 2000 cells per well in a six-well plate. Fourteen days after being continuously cultured, cell colonies were washed with PBS twice, fixed in formalin for 30 min, and stained with 0.1% crystal violet for another 20 min. Then, the cell colonies were imaged and counted.

4.7. Wound-Healing Assays

The cells were cultured in a 24-well plate in the wound-healing assay. Post different treatments, the cell monolayer was scratched with a 200 µL pipette tip. The microscope (Olympus, Tokyo, Japan) took representative images of the scratch at 0 h and 48 h. The percentage of wound closure was measured via the ImageJ 1.52p software.

4.8. Real-Time Cellular Analysis (RTCA)

The migratory ability of CC cells was detected using xCELLigence RTCA (ACEA Biosciences, San Diego, CA, USA). Briefly, post-transfected CC cells were resuspended in a serum-free medium, and 10,000 CC cells were added per upper chamber. Meanwhile, the 165 µL medium with 10% FBS was added to the lower section. Then, the cell plate was incubated at 37 °C and 5% CO2, and the cell index was detected uninterrupted using the RTCA software 2020R1 until the end of the experiment.

4.9. Cell Apoptosis Assays

The cell apoptosis detection was performed using the FITC/Annexin V Apoptosis Detection Kit (BD, 556547, Franklin Lakes, NJ, USA). Briefly, the cells were harvested post-treatment, followed by the addition of 5 µL Annexin V-FITC and 5 µL propidum iodide into the cell suspension. Then, the cell apoptosis ratio was analyzed via flow cytometry (Beckman, Brea, CA, USA).

4.10. Western Blot Assays

The whole proteins from CC cells or xenograft tissues were extracted using the RIPA lysis buffer (Lablead, Beijing, China), and then western blotting was conducted as described previously [41]. The following antibodies were used: p-STAT3 (1:1000, CST, Worcester, MA, USA), STAT3 (1:1000, CST, USA), p65 (1:1000, CST, USA), Lamin B1 (1:1000, CST, USA), DDIT4 (1:1000, Proteintech, San Diego, CA, USA), β-Tubblin (1:1000, Transgene Biotech, Shanghai, China), and β-actin (1:1000, Transgen Biotech, China).

4.11. Luciferase Reporter Assay

To explore the transcription regulation of p65 on HCP5, wild-type or mutated HCP5 promoter sequences were cloned into a pGL4.10 promoter reporter vector (Promega, Fitchburg, WI, USA) to generate a pGL4.1/HCP5-WT vector and a pGL4.1/HCP5-MUT vector. Then, the p65 overexpression plasmid and these vectors were co-transfected into CC cells using Lipofectamine 3000.
As for elucidating the ceRNA mechanism among HCP5, miR-139-5p, and DDIT4, the wild-type or mutant HCP5 fragment and the 3′untranslated region (UTR) of DDIT4 were inserted into the pmirREPORTER luciferase reporter vector (Promega, USA). CC cells were individually transfected with HCP5-WT, HCP5-MUT, DDIT4-WT, or DDIT4-MUT vectors, together with miR-139-5p mimics. Forty-eight hours after transfection, the luciferase activities were determined using the Dual-Luciferase Assay Kit (Promega, USA), according to the manufacturer’s instructions. Renilla luciferase activities were set as the standardized control.

4.12. RIP Assay

The RIP assay was conducted using a Magna RIP Kit (Millipore, Burlington, MA, USA), according to the manufacturer’s instructions. Briefly, the lysates of CC cells were incubated overnight with the beads coated with the anti-Ago2 antibody or the control IgG (Proteintech, CA, USA) antibody at 4 °C under rotation. Subsequently, the precipitated RNA was purified and analyzed via qRT-PCR.

4.13. ChIP Assay

The EZ-Magna CHIP kit (Millipore, MA, USA) was used to perform the ChIP assay, followed by the previously published methods [42]. The DNA fragments precipitated by the p65 (CST, Worcester, MA, USA) or IgG (Proteintech, San Diego, CA, USA) antibodies were purified and detected using qRT-PCR.

4.14. Animal Experiments

TGR5 KO female mice (on C57BL/6J background; Merck Research Laboratories, Kenilworth, NJ) were raised in a pathogen-free animal facility. Eight-week-old wild-type (WT) (C57BL/6J), and four-week-old female BALB/c mice were purchased from Beijing Experimental Animal Center. All animal experiments were carried out in compliance with the NIH Guide for the Care and Use of Laboratory Animals.
For LPS-induced cervical inflammation, WT and TGR5 KO mice fasted overnight, then were injected intraperitoneally with LPS (20 mg/kg body weight) or PBS. At 6 h post-treatment, mice were sacrificed, and the cervical tissues were collected for further investigation.
For the study of the roles of TGR5 activation in tumorigenesis in vivo, nude mice were subcutaneously injected with HeLa cells at the right axilla (3 × 10⁶ cells per mouse). Once the average volume of tumors reached about 100 mm3, the mice were randomized into two groups and received intraperitoneal injections of BAR501 (20 mg/kg body weight) or the vehicle every two days. The length and width of the xenograft tumor were measured during treatment. Once treatment was finished, the mice were humanely executed, and the tumors were collected and weighed. Tumor volumes were calculated using the formula: ½ × (length × width2).
For investigating the function of HCP5 in tumor growth in vivo, HeLa cells (3 × 10⁶ cells per mouse) transfected with sh-NC and sh-HCP5 were suspended in 150 µL PBS and subsequently injected into the flank of nude mice. The tumor volume was measured every two days during the experimental period. Three weeks after injection, mice were sacrificed, and the tumors were removed and weighed.

4.15. Quantification and Statistical Analysis

All results are shown as the mean ± standard deviation and include at least three independent experiments unless stated otherwise. A p-value less than 0.05 was significant. The GraphPad Prism 8 software was utilized for all statistical evaluations. For the assessment of differences between two groups, unpaired two-tailed Student’s t-tests were employed, while one-way or two-way ANOVA was applied for the examination of differences across more than two groups, followed by Tukey’s multiple comparison test.

5. Conclusions

In conclusion, this study reveals that TGR5 suppresses the development of CC by regulating the HCP5/miR-139-5p/DDIT4 axis, suggesting that handling the novel TGR5/HCP5/miR-139-5p/DDIT4 pathway could be a potential strategy for CC treatment.

Supplementary Materials

The following supporting information can be downloaded at: https://www.mdpi.com/article/10.3390/ijms25168932/s1.

Author Contributions

J.S. and Y.Z. designed, conducted the experiments, analyzed and discussed the data, and wrote the manuscript draft; W.-D.C. and Y.-D.W. initiated the project, designed the experiments, analyzed and discussed the data, edited and revised the manuscript, and secured funding for the research. All authors have read and agreed to the published version of the manuscript.

Funding

This work was funded by the National Key R&D Program of China (2021YFC2103900), and the National Natural Science Foundation of China (Grant Nos. 81970551, 81970726, and 81472232).

Institutional Review Board Statement

All the animal procedures were conducted according to the protocol approved by Henan University IACUC (Approval Code: HUSOM-2019-113, Approval Date: 10 March 2019) and in compliance with the NIH standards for the care and use of laboratory animals.

Data Availability Statement

The original contributions presented in the study are included in the article and Supplementary Materials. Further inquiries can be directed to the corresponding authors.

Acknowledgments

The authors are grateful to Yitao Ren from RDFZ Xishan School for performing some of the experiments, and James Chen from the International School of Beijing for editing this manuscript’s grammar and language.

Conflicts of Interest

The authors declare no conflicts of interest.

References

  1. Sung, H.; Ferlay, J.; Siegel, R.L.; Laversanne, M.; Soerjomataram, I.; Jemal, A.; Bray, F. Global Cancer Statistics 2020: GLOBOCAN Estimates of Incidence and Mortality Worldwide for 36 Cancers in 185 Countries. CA Cancer J. Clin. 2021, 71, 209–249. [Google Scholar] [CrossRef]
  2. Small, W., Jr.; Bacon, M.A.; Bajaj, A.; Chuang, L.T.; Fisher, B.J.; Harkenrider, M.M.; Jhingran, A.; Kitchener, H.C.; Mileshkin, L.R.; Viswanathan, A.N.; et al. Cervical cancer: A global health crisis. Cancer 2017, 123, 2404–2412. [Google Scholar] [CrossRef]
  3. Miller, K.D.; Nogueira, L.; Devasia, T.; Mariotto, A.B.; Yabroff, K.R.; Jemal, A.; Kramer, J.; Siegel, R.L. Cancer treatment and survivorship statistics, 2022. CA Cancer J. Clin. 2022, 72, 409–436. [Google Scholar] [CrossRef] [PubMed]
  4. Ladurner, A.; Zehl, M.; Grienke, U.; Hofstadler, C.; Faur, N.; Pereira, F.C.; Berry, D.; Dirsch, V.M.; Rollinger, J.M. Allspice and Clove as Source of Triterpene Acids Activating the G Protein-Coupled Bile Acid Receptor TGR5. Front. Pharmacol. 2017, 8, 468. [Google Scholar] [CrossRef]
  5. Guo, C.; Chen, W.D.; Wang, Y.D. TGR5, Not Only a Metabolic Regulator. Front. Physiol. 2016, 7, 646. [Google Scholar] [CrossRef] [PubMed]
  6. Guo, C.; Xie, S.; Chi, Z.; Zhang, J.; Liu, Y.; Zhang, L.; Zheng, M.; Zhang, X.; Xia, D.; Ke, Y.; et al. Bile Acids Control Inflammation and Metabolic Disorder through Inhibition of NLRP3 Inflammasome. Immunity 2016, 45, 802–816. [Google Scholar] [CrossRef]
  7. Wang, Y.D.; Chen, W.D.; Yu, D.; Forman, B.M.; Huang, W. The G-protein-coupled bile acid receptor, Gpbar1 (TGR5), negatively regulates hepatic inflammatory response through antagonizing nuclear factor κ light-chain enhancer of activated B cells (NF-κB) in mice. Hepatology 2011, 54, 1421–1432. [Google Scholar] [CrossRef]
  8. Guo, C.; Qi, H.; Yu, Y.; Zhang, Q.; Su, J.; Yu, D.; Huang, W.; Chen, W.D.; Wang, Y.D. The G-Protein-Coupled Bile Acid Receptor Gpbar1 (TGR5) Inhibits Gastric Inflammation Through Antagonizing NF-κB Signaling Pathway. Front. Pharmacol. 2015, 6, 287. [Google Scholar] [CrossRef] [PubMed]
  9. Qi, Y.; Duan, G.; Wei, D.; Zhao, C.; Ma, Y. The Bile Acid Membrane Receptor TGR5 in Cancer: Friend or Foe? Molecules 2022, 27, 5292. [Google Scholar] [CrossRef]
  10. Su, J.; Zhang, Q.; Qi, H.; Wu, L.; Li, Y.; Yu, D.; Huang, W.; Chen, W.D.; Wang, Y.D. The G-protein-coupled bile acid receptor Gpbar1 (TGR5) protects against renal inflammation and renal cancer cell proliferation and migration through antagonizing NF-κB and STAT3 signaling pathways. Oncotarget 2017, 8, 54378–54387. [Google Scholar] [CrossRef] [PubMed]
  11. Liu, X.; Chen, B.; You, W.; Xue, S.; Qin, H.; Jiang, H. The membrane bile acid receptor TGR5 drives cell growth and migration via activation of the JAK2/STAT3 signaling pathway in non-small cell lung cancer. Cancer Lett. 2018, 412, 194–207. [Google Scholar] [CrossRef]
  12. Sabeena, S. Role of noncoding RNAs with emphasis on long noncoding RNAs as cervical cancer biomarkers. J. Med. Virol. 2023, 95, e28525. [Google Scholar] [CrossRef] [PubMed]
  13. Zhou, M.; Liu, L.; Wang, J.; Liu, W. The role of long noncoding RNAs in therapeutic resistance in cervical cancer. Front. Cell Dev. Biol. 2022, 10, 1060909. [Google Scholar] [CrossRef] [PubMed]
  14. Luo, A.; Lan, X.; Qiu, Q.; Zhou, Q.; Li, J.; Wu, M.; Liu, P.; Zhang, H.; Lu, B.; Lu, Y.; et al. LncRNA SFTA1P promotes cervical cancer progression by interaction with PTBP1 to facilitate TPM4 mRNA degradation. Cell Death Dis. 2022, 13, 936. [Google Scholar] [CrossRef]
  15. Lu, M.; Gao, Q.; Wang, Y.; Ren, J.; Zhang, T. LINC00511 promotes cervical cancer progression by regulating the miR-497-5p/MAPK1 axis. Apoptosis 2022, 27, 800–811. [Google Scholar] [CrossRef]
  16. Liao, Y.; Huang, J.; Liu, P.; Zhang, C.; Liu, J.; Xia, M.; Shang, C.; Ooi, S.; Chen, Y.; Qin, S.; et al. Downregulation of LNMAS orchestrates partial EMT and immune escape from macrophage phagocytosis to promote lymph node metastasis of cervical cancer. Oncogene 2022, 41, 1931–1943. [Google Scholar] [CrossRef] [PubMed]
  17. Walch-Rückheim, B.; Pahne-Zeppenfeld, J.; Fischbach, J.; Wickenhauser, C.; Horn, L.C.; Tharun, L.; Büttner, R.; Mallmann, P.; Stern, P.; Kim, Y.J.; et al. STAT3/IRF1 Pathway Activation Sensitizes Cervical Cancer Cells to Chemotherapeutic Drugs. Cancer Res. 2016, 76, 3872–3883. [Google Scholar] [CrossRef]
  18. Johnson, D.E.; O’Keefe, R.A.; Grandis, J.R. Targeting the IL-6/JAK/STAT3 signalling axis in cancer. Nat. Rev. Clin. Oncol. 2018, 15, 234–248. [Google Scholar] [CrossRef] [PubMed]
  19. Hashimoto, S.; Hashimoto, A.; Muromoto, R.; Kitai, Y.; Oritani, K.; Matsuda, T. Central Roles of STAT3-Mediated Signals in Onset and Development of Cancers: Tumorigenesis and Immunosurveillance. Cells 2022, 11, 2618. [Google Scholar] [CrossRef]
  20. Pu, F.F.; Shi, D.Y.; Chen, T.; Liu, Y.X.; Zhong, B.L.; Zhang, Z.C.; Liu, W.J.; Wu, Q.; Wang, B.C.; Shao, Z.W.; et al. SP1-induced long non-coding RNA SNHG6 facilitates the carcinogenesis of chondrosarcoma through inhibiting KLF6 by recruiting EZH2. Cell Death Dis. 2021, 12, 59. [Google Scholar] [CrossRef] [PubMed]
  21. Wang, H.; Shi, Y.; Chen, C.H.; Wen, Y.; Zhou, Z.; Yang, C.; Sun, J.; Du, G.; Wu, J.; Mao, X.; et al. KLF5-induced lncRNA IGFL2-AS1 promotes basal-like breast cancer cell growth and survival by upregulating the expression of IGFL1. Cancer Lett. 2021, 515, 49–62. [Google Scholar] [CrossRef] [PubMed]
  22. Ji, Z.; Tang, T.; Chen, M.; Dong, B.; Sun, W.; Wu, N.; Chen, H.; Feng, Q.; Yang, X.; Jin, R.; et al. C-Myc-activated long non-coding RNA LINC01050 promotes gastric cancer growth and metastasis by sponging miR-7161-3p to regulate SPZ1 expression. J. Exp. Clin. Cancer Res. 2021, 40, 351. [Google Scholar] [CrossRef]
  23. Sun, Y.; Tian, Y.; He, J.; Tian, Y.; Zhang, G.; Zhao, R.; Zhu, W.J.; Gao, P. Linc01133 contributes to gastric cancer growth by enhancing YES1-dependent YAP1 nuclear translocation via sponging miR-145-5p. Cell Death Dis. 2022, 13, 51. [Google Scholar] [CrossRef] [PubMed]
  24. Wahlström, A.; Aydin, Ö.; Olsson, L.M.; Sjöland, W.; Henricsson, M.; Lundqvist, A.; Marschall, H.U.; Franken, R.; van de Laar, A.; Gerdes, V.; et al. Alterations in bile acid kinetics after bariatric surgery in patients with obesity with or without type 2 diabetes. EBioMedicine 2024, 2, 105265. [Google Scholar] [CrossRef]
  25. Hosseini, S.A.; Haddadi, M.H.; Fathizadeh, H.; Nemati, F.; Aznaveh, H.M.; Taraj, F.; Aghabozorgizadeh, A.; Gandomkar, G.; Bazazzadeh, E. Long non-coding RNAs and gastric cancer: An update of potential biomarkers and therapeutic applications. Biomed. Pharmacother. 2023, 163, 114407. [Google Scholar] [CrossRef] [PubMed]
  26. Ranga, S.; Yadav, R.; Chhabra, R.; Chauhan, M.B.; Tanwar, M.; Yadav, C.; Kadian, L.; Ahuja, P. Long non-coding RNAs as critical regulators and novel targets in cervical cancer: Current status and future perspectives. Apoptosis 2023, 28, 925–942. [Google Scholar] [CrossRef]
  27. Su, J.; Deng, L.; Wang, Y.D. Roles and Mechanisms of Long Non-Coding RNAs in Breast Cancer. Int. J. Mol. Sci. 2022, 24, 89. [Google Scholar] [CrossRef]
  28. Song, P.; Yang, F.; Jin, H.; Wang, X. The regulation of protein translation and its implications for cancer. Signal Transduct. Target. Ther. 2021, 6, 68. [Google Scholar] [CrossRef] [PubMed]
  29. Zhang, X.; Wang, Y.; Zhao, A.; Kong, F.; Jiang, L.; Wang, J. Long Non-Coding RNA LINC00511 Accelerates Proliferation and Invasion in Cervical Cancer Through Targeting miR-324-5p/DRAM1 Axis. Onco Targets Ther. 2020, 13, 10245–10256. [Google Scholar] [CrossRef] [PubMed]
  30. Gao, Z.; Wang, Q.; Ji, M.; Guo, X.; Li, L.; Su, X. Exosomal lncRNA UCA1 modulates cervical cancer stem cell self-renewal and differentiation through microRNA-122-5p/SOX2 axis. J. Transl. Med. 2021, 19, 229. [Google Scholar] [CrossRef] [PubMed]
  31. Li, X.; Chen, B.; Huang, A.; Ren, C.; Wang, L.; Zhu, T.; Xiong, J.; Ding, W.; Wang, H. LncRNA HCP5 enhances the proliferation and migration of cervical cancer via miR-216a-5p/CDC42 axis. J. Cancer 2022, 13, 1882–1894. [Google Scholar] [CrossRef]
  32. Yu, Y.; Shen, H.M.; Fang, D.M.; Meng, Q.J.; Xin, Y.H. LncRNA HCP5 promotes the development of cervical cancer by regulating MACC1 via suppression of microRNA-15a. Eur. Rev. Med. Pharmacol. Sci. 2018, 22, 4812–4819. [Google Scholar] [PubMed]
  33. Srinivas, T.; Mathias, C.; Oliveira-Mateos, C.; Guil, S. Roles of lncRNAs in brain development and pathogenesis: Emerging therapeutic opportunities. Mol. Ther. 2023, 31, 1550–1561. [Google Scholar] [CrossRef]
  34. Statello, L.; Guo, C.J.; Chen, L.L.; Huarte, M. Gene regulation by long non-coding RNAs and its biological functions. Nat. Rev. Mol. Cell Biol. 2021, 22, 96–118. [Google Scholar] [CrossRef]
  35. Jiang, L.; Wang, R.; Fang, L.; Ge, X.; Chen, L.; Zhou, M.; Zhou, Y.; Xiong, W.; Hu, Y.; Tang, X.; et al. HCP5 is a SMAD3-responsive long non-coding RNA that promotes lung adenocarcinoma metastasis via miR-203/SNAI axis. Theranostics 2019, 9, 2460–2474. [Google Scholar] [CrossRef] [PubMed]
  36. Liang, L.; Xu, J.; Wang, M.; Xu, G.; Zhang, N.; Wang, G.; Zhao, Y. LncRNA HCP5 promotes follicular thyroid carcinoma progression via miRNAs sponge. Cell Death Dis. 2018, 9, 372. [Google Scholar] [CrossRef]
  37. Tirado-Hurtado, I.; Fajardo, W.; Pinto, J.A. DNA Damage Inducible Transcript 4 Gene: The Switch of the Metabolism as Potential Target in Cancer. Front. Oncol. 2018, 8, 106. [Google Scholar] [CrossRef]
  38. Ho, K.H.; Chen, P.H.; Chou, C.M.; Shih, C.M.; Lee, Y.T.; Cheng, C.H.; Chen, K.C. A Key Role of DNA Damage-Inducible Transcript 4 (DDIT4) Connects Autophagy and GLUT3-Mediated Stemness to Desensitize Temozolomide Efficacy in Glioblastomas. Neurotherapeutics 2020, 17, 1212–1227. [Google Scholar] [CrossRef]
  39. Du, F.; Sun, L.; Chu, Y.; Li, T.; Lei, C.; Wang, X.; Jiang, M.; Min, Y.; Lu, Y.; Zhao, X.; et al. DDIT4 promotes gastric cancer proliferation and tumorigenesis through the p53 and MAPK pathways. Cancer Commun. 2018, 38, 45. [Google Scholar] [CrossRef] [PubMed]
  40. Song, L.; Chen, Z.; Zhang, M.; Zhang, M.; Lu, X.; Li, C.; Miao, L. DDIT4 overexpression associates with poor prognosis in lung adenocarcinoma. J. Cancer 2021, 12, 6422–6428. [Google Scholar] [CrossRef] [PubMed]
  41. Xue, S.T.; Zheng, B.; Cao, S.Q.; Ding, J.C.; Hu, G.S.; Liu, W.; Chen, C. Long non-coding RNA LINC00680 functions as a ceRNA to promote esophageal squamous cell carcinoma progression through the miR-423-5p/PAK6 axis. Mol. Cancer 2022, 21, 69. [Google Scholar] [CrossRef]
  42. Guan, Y.F.; Huang, Q.L.; Ai, Y.L.; Chen, Q.T.; Zhao, W.X.; Wang, X.M.; Wu, Q.; Chen, H.Z. Nur77-activated lncRNA WFDC21P attenuates hepatocarcinogenesis via modulating glycolysis. Oncogene 2020, 39, 2408–2423. [Google Scholar] [CrossRef]
Figure 1. TGR5 is downregulated in CC and its deficiency promotes a cervical inflammation response. (A,B). TGR5 expression in normal and tumor tissues was analyzed using the TCGA-CESC database and GSE6791 dataset. (C). GEPIA analysis of the overall survival of CC patients with high (n = 143) TGR5 expression and low (n = 144) expression. (D). Relative mRNA levels of pro-inflammatory genes in the cervices of WT and TGR5 KO mice (n = 5). (E). Relative mRNA levels of pro-inflammatory genes in the cervices of WT and TGR5 KO mice after LPS treatment. (F). TGR5 ligand treatment suppressed the mRNA levels of pro-inflammatory genes in the cervices of WT mice. (G). Western blots show phosphorylated STAT3 (p-STAT3) and total STAT3 (STAT3) in whole proteins from TGR5 KO mice cervices after being treated with LPS for 6 h (n = 5). (H). Western blots show p-STAT3 and STAT3 in whole proteins from WT mice cervices after being treated with LPS. Mice were fed with a diet containing 20 mg INT-777/kg or a standard rodent diet for three days. After fasting overnight, mice were injected intraperitoneally with LPS for 6 h (n = 5). WT, wild-type mice; TGR5 KO, TGR5 knockout mice. * p < 0.05, ** p < 0.01, ns means not significant.
Ijms 25 08932 g001
Figure 2. TGR5 activation suppresses cervical cancer progression both in vivo and in vitro. (A). TGR5 activation by its ligand inhibits the proliferation of HeLa and Siha cells. (B). TGR5 ligand treatment suppressed the CC cell colony formation. (C,D). Activation of TGR5 in HeLa and Siha cells exhibited a lower scratch closure rate than the controls. (E). Flow cytometry analysis indicated that TGR5 ligands promoted the cell apoptosis process. (F). Four-week-old female nude mice were subcutaneously inoculated with HeLa cells followed by treatment with the vehicle or BAR501 20 mg/kg through intraperitoneal injection. The mice were sacrificed and photographed (n = 5). (G). The tumor volumes were measured every two days during the treatment. (H) Tumor weights were also recorded. * p < 0.05, ** p < 0.01.
Ijms 25 08932 g002
Figure 3. TGR5 activation antagonizes CC through downregulating HCP5 expression. (A). HCP5 expression levels in HeLa and Siha cells were inhibited after being treated with TGR5 for 48 h using qRT-PCR. (B). The expression levels of HCP5 in CC tissues and normal tissues from the TCGA database. (C). GSE9750, GSE27678, and GSE29570 datasets suggested that HCP5 was highly expressed in CC tissues compared to the non-tumor ones. (D). Survival curve of the analysis of the overall survival of CC patients with high (n = 150) and low (n = 150) HCP5 expression, based on the GSE44001 dataset. (E). The MTT assay showed the effect of HCP5 overexpression, combined with the TGR5 ligand, on cell proliferation. (F). The effect of HCP5 overexpression combined with BAR501 on CC cell apoptosis, determined by flow cytometry analysis. * p < 0.05, ** p < 0.01.
Ijms 25 08932 g003
Figure 4. HCP5 drives CC progression in vitro and in vivo. (A). The qRT-PCR analysis of HCP5 in HeLa and Siha cells post-transfected with sh-NC or sh-HCP5. (B,C). MTT and cell colony formation assays were conducted, respectively, to assess the effect of HCP5 inhibition on cell proliferation. (D,E). The migratory ability of CC cells with HCP5 knockdown was analyzed using a wound-healing assay and RTCA. (FI). Tumor xenograft experiments were done to examine the impact of HCP5 on tumor growth. Tumor images were photographed, and tumor growth curves and weights were also recorded. * p < 0.05, ** p < 0.01, ns means not significant.
Ijms 25 08932 g004
Figure 5. TGR5 suppressed HCP5 expression level through transcriptional inactivation. (A). The potential binding sites of p65 predicted by JASPAR. (B). Correlation analysis between HCP5 expre-ssion and p65 expression in CC tissues based on TCGA data and the GSE27678 dataset. (C). The qRT-PCR was performed to examine the relative expression of HCP5 in CC cells transfected with p65 overexpression vectors. (D). The luciferase vector of the HCP5 promoter region, containing potential p65 binding sites, was simulated. (E). The luciferase vector carrying the HCP5 promoter region was co-transfected with p65 plasmid or control plasmid into HeLa and Siha cells. (F). The binding sites in which p65 binds to the HCP5 promoter were determined using a ChIP assay. (G). The impact of TGR5 activation on the p65-induced upregulation of HCP5 transcriptional activity was confirmed through a luciferase assay. (H). The translocation of p65 in HeLa and Siha cells after TGR5 activation was measured through a western blot assay. * p < 0.05, ** p < 0.01, ns means not significant.
Ijms 25 08932 g005
Figure 6. HCP5 functions as a sponge to miR-139-5p, targeting DDIT4 in CC cells. (A). The subcellular location of HCP5 in CC cells was analyzed through a qRT-PCR, and U6 and GAPDH were set as the cytoplasmic and nuclear control, respectively. (B). The potential miR-139-5p binding sites in HCP5. (C). Relative expression of miR-139-5p in CC cells after HCP5 inhibition and overexpression was examined through a qRT-PCR. (D). The qRT-PCR analysis of miR-139-5p and HCP5 expression in HeLa and Siha cells after overexpression of miR-139-5p. (E). The dual-luciferase assays were performed to verify the binding sites between miR-139-5p and HCP5 in CC cells. (F). Analysis of miR-139-5p and HCP5 via qRT-PCR in anti-AGO2 or IgG immunoprecipitated RNA. (G). Venn diagram of the target gene of miR-139-5p using online tools Starbase, miRWalk, DIANA, TargetScan, and miRDIP. (H). The binding sites between miR-139-5p and DDIT4 were verified by dual-luciferase reporter assay. (I,J). The mRNA levels and protein levels of DDIT4 in HeLa and Siha cells after transfection with negative control (NC) mimics or miR-139-5p mimics were analyzed via qRT-PCR and western blot, respectively. ** p < 0.01, ns means not significant.
Ijms 25 08932 g006
Figure 7. HCP5 promotes CC progression by modulating the miR-139-5p/DDIT4 axis. (A). DDIT4 mRNA levels in CC cells after HCP5 inhibition were examined via qRT-PCR. (B). Western blot was conducted to analyze DDIT4 protein levels in HeLa and Siha cells after transfection with shRNA (sh-NC) or shHCP5. (C,D). The mRNA and protein levels of DDIT4 in CC cells with HCP5 overexpression were analyzed via qRT-PCR or western blot. (E,F). The mRNA and protein levels of DDIT4 in HCP5 overexpression HeLa and Siha cells transfected with negative control (NC) mimics or miR-139-5p mimics were detected via qRT-PCR and western bot. (G,H). The MTT assay in HeLa and Siha with co-transfection of miR-139-5p mimic and pcDNA3.1/HCP5 or shHCP5 and pcDNA3.1/DDIT4. (IK). The migratory ability of HeLa and Siha cells co-transfected with shHCP5 and pcDNA3.1/DDIT4 were examined via RTCA and cell scratch assay. * p < 0.05, ** p < 0.01.
Ijms 25 08932 g007
Figure 8. Activation of TGR5 inhibits CC progression by the HCP5/miR-139-5p/DDIT4 axis in vivo and in vitro. (A,B). HeLa and Siha cells were treated with control DMSO, TGR5 ligands INT-777, and BAR501 for 48 h. Then, the expression level of DDIT4 was quantified through qRT-PCR and western blot. (C). Relative miR-139-5p expression after TGR5 activation. (D). The expression of HCP5, miR-139-5p, and DDIT4 in the xenografts was detected using qRT-PCR. (E). The protein levels of DDIT4 in the xenografts were analyzed via western blot. * p < 0.05, ** p < 0.01.
Ijms 25 08932 g008
Figure 9. Schematic representation of the role of TGR5 as a tumor suppressor in the progression of CC. Red bar means inhibit. Arrows means move.
Ijms 25 08932 g009
Disclaimer/Publisher’s Note: The statements, opinions and data contained in all publications are solely those of the individual author(s) and contributor(s) and not of MDPI and/or the editor(s). MDPI and/or the editor(s) disclaim responsibility for any injury to people or property resulting from any ideas, methods, instructions or products referred to in the content.