Abstract
Resistance biomarkers are needed to identify patients with advanced melanoma obtaining a response to ICI treatment and developing resistance later. We searched a combination of molecular signatures of response to ICIs in patients with metastatic melanoma. In a retrospective study on patients with metastatic melanoma treated with an anti-PD-1 agent carried out at Istituto Nazionale Tumori—IRCCS—Fondazione “G. Pascale”, Naples, Italy. We integrated a whole proteome profiling of metastatic tissue with targeted transcriptomics. To assess the prognosis of patients according to groups of low and high risk, we used PFS and OS as outcomes. To identify the proteins and mRNAs gene signatures associated with the patient’s response groups, the discriminant analysis for sparse data performed via partial least squares procedure was performed. Tissue samples from 22 patients were analyzed. A combined protein and gene signature associated with poorer response to ICI immunotherapy in terms of PFS and OS was identified. The PFS and OS Kaplan–Meier curves were significantly better for patients with high expression of the protein signature compared to patients with low expression of the protein signature and who were high-risk (Protein: HR = 0.023, 95% CI: 0.003–0.213; p < 0.0001. Gene: HR = 0.053, 95% CI: 0.011–0.260; p < 0.0001). The Kaplan–Meier curves showed that patients with low-risk gene signatures had better PFS (HR = 0 0.221, 95% CI: 0.071–0.68; p = 0.007) and OS (HR = 0.186, 95% CI: 0.05–0.695; p = 0.005). The proteomic and transcriptomic combined analysis was significantly associated with the outcomes of the anti-PD-1 treatment with a better predictive value compared to a single signature. All the patients with low expression of protein and gene signatures had progression within 6 months of treatment (median PFS = 3 months, 95% CI: 2–3), with a significant difference vs. the low-risk group (median PFS = not reached; p < 0.0001), and significantly poorer survival (OS = 9 months, 95% CI: 5–9) compared to patients with high expression of protein and gene signatures (median OS = not reached; p < 0.0001). We propose a combined proteomic and transcriptomic signature, including genes involved in pro-tumorigenic pathways, thereby identifying patients with reduced probability of response to immunotherapy with ICIs for metastatic melanoma.
1. Introduction
The prognosis of patients with metastatic melanoma has been improved by the introduction of immune checkpoint inhibitors (ICI), which are now the standard of care. Treatment with ICIs provides a sustained response, still ongoing in more than 90% of patients with a follow-up of 7.9 months [1], with overall survival (OS) of over 50% at 5 years [2], and 57% at 6.5 years [3]. Indeed, immunotherapy targets and activates the memory of the host adaptive immune system, possibly explaining the prolonged activity. Nevertheless, many patients obtaining a response to ICI treatment develop resistance later [4]. Aiming at further improving outcomes, identifying resistance hallmarks may help to detect patients with low probability of benefit from immunotherapy and also to find new targets to overcome the mechanisms of resistance. Circulating biomarkers and tumor molecular signatures are widely investigated in advanced melanoma. They are associated with the response to ICIs, but reliable predictive markers for metastatic melanoma patients are still scant and have little reliabity [5,6]. Specifically, the only tissue markers for melanoma are tumor mutational burden (TMB) and microsatellite instability (MSI), based on results of KEYNOTE-158, but several criticisms have been raised in relation to this [7].
It has been found that the response to anti-PD-1 therapy in advanced melanoma is related to protein processing in the endoplasmic reticulum, and also to genes involved in the immune and inflammatory responses. The OS of patients with high expression of a two-protein based predictor was significantly better than the survival of patients with low expression (hazard ratio: 0.3189, 95% CI 0.0854–0.7382; p = 0.0125), suggesting that a combined proteomic and genetic analysis of tissue samples may be predictive of the response to immunotherapy in patients with advanced melanoma [8].
We decided to integrate a whole proteome profiling of metastatic tissue with targeted transcriptomics to search for a combination molecular signature of response to ICIs in patients with metastatic melanoma.
2. Results
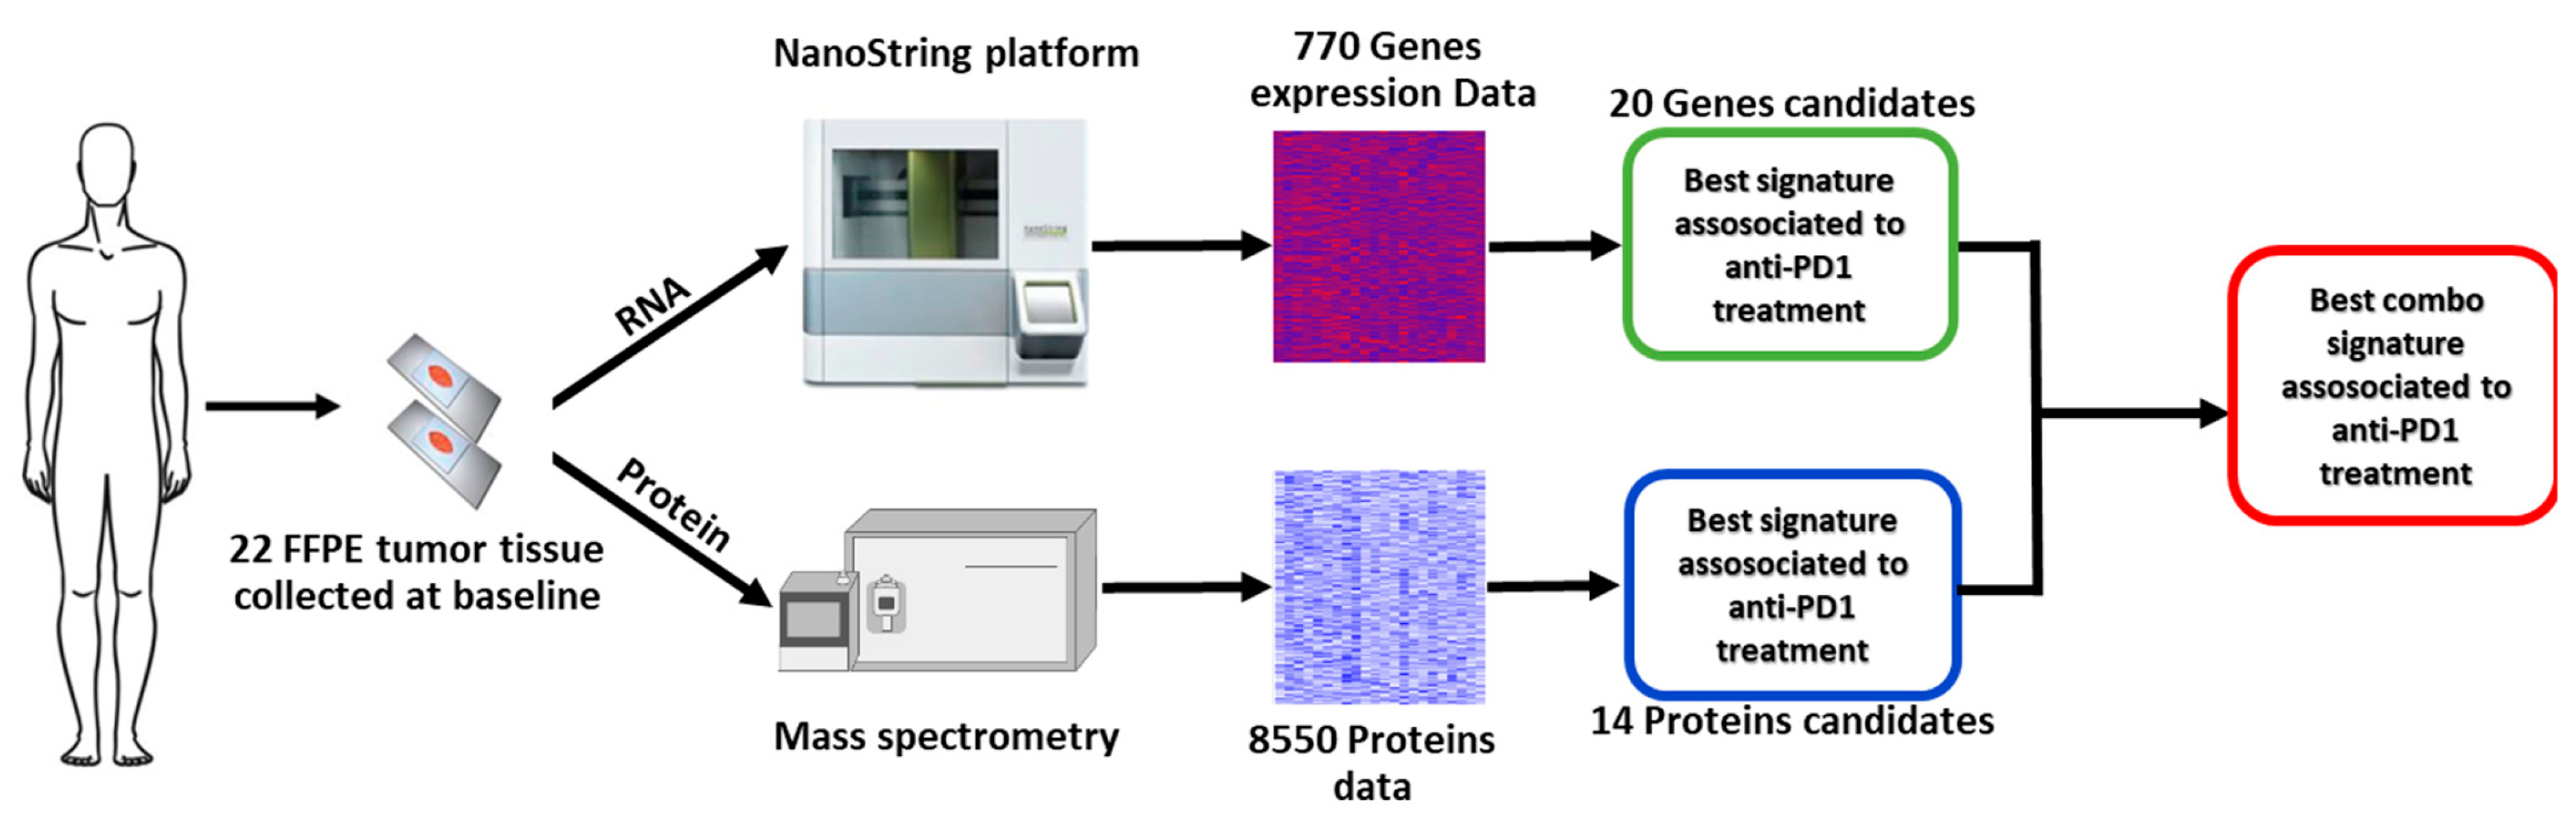
Figure 1 shows the work flow of the study. Overall, tumor tissue samples from 22 patients (11 males and 11 females) were analyzed. The median age of patients was 66 years (IQR, 23.2), and BRAF mutation was detected in seven (31.8%) patients, central nervous system (CNS) metastases were present in five (22.7%) patients, and 16 (72.7%) subjects received nivolumab, while six (27.3%) received pembrolizumab (Table 1). Ten patients were classified as non-responders and 12 as responders. Table 1 shows the characteristics of the whole population and the two subgroups at the baseline.
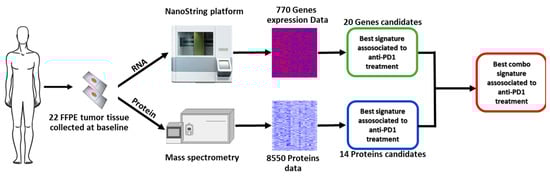
Figure 1.
Study workflow.

Table 1.
Characteristics of patients at baseline.
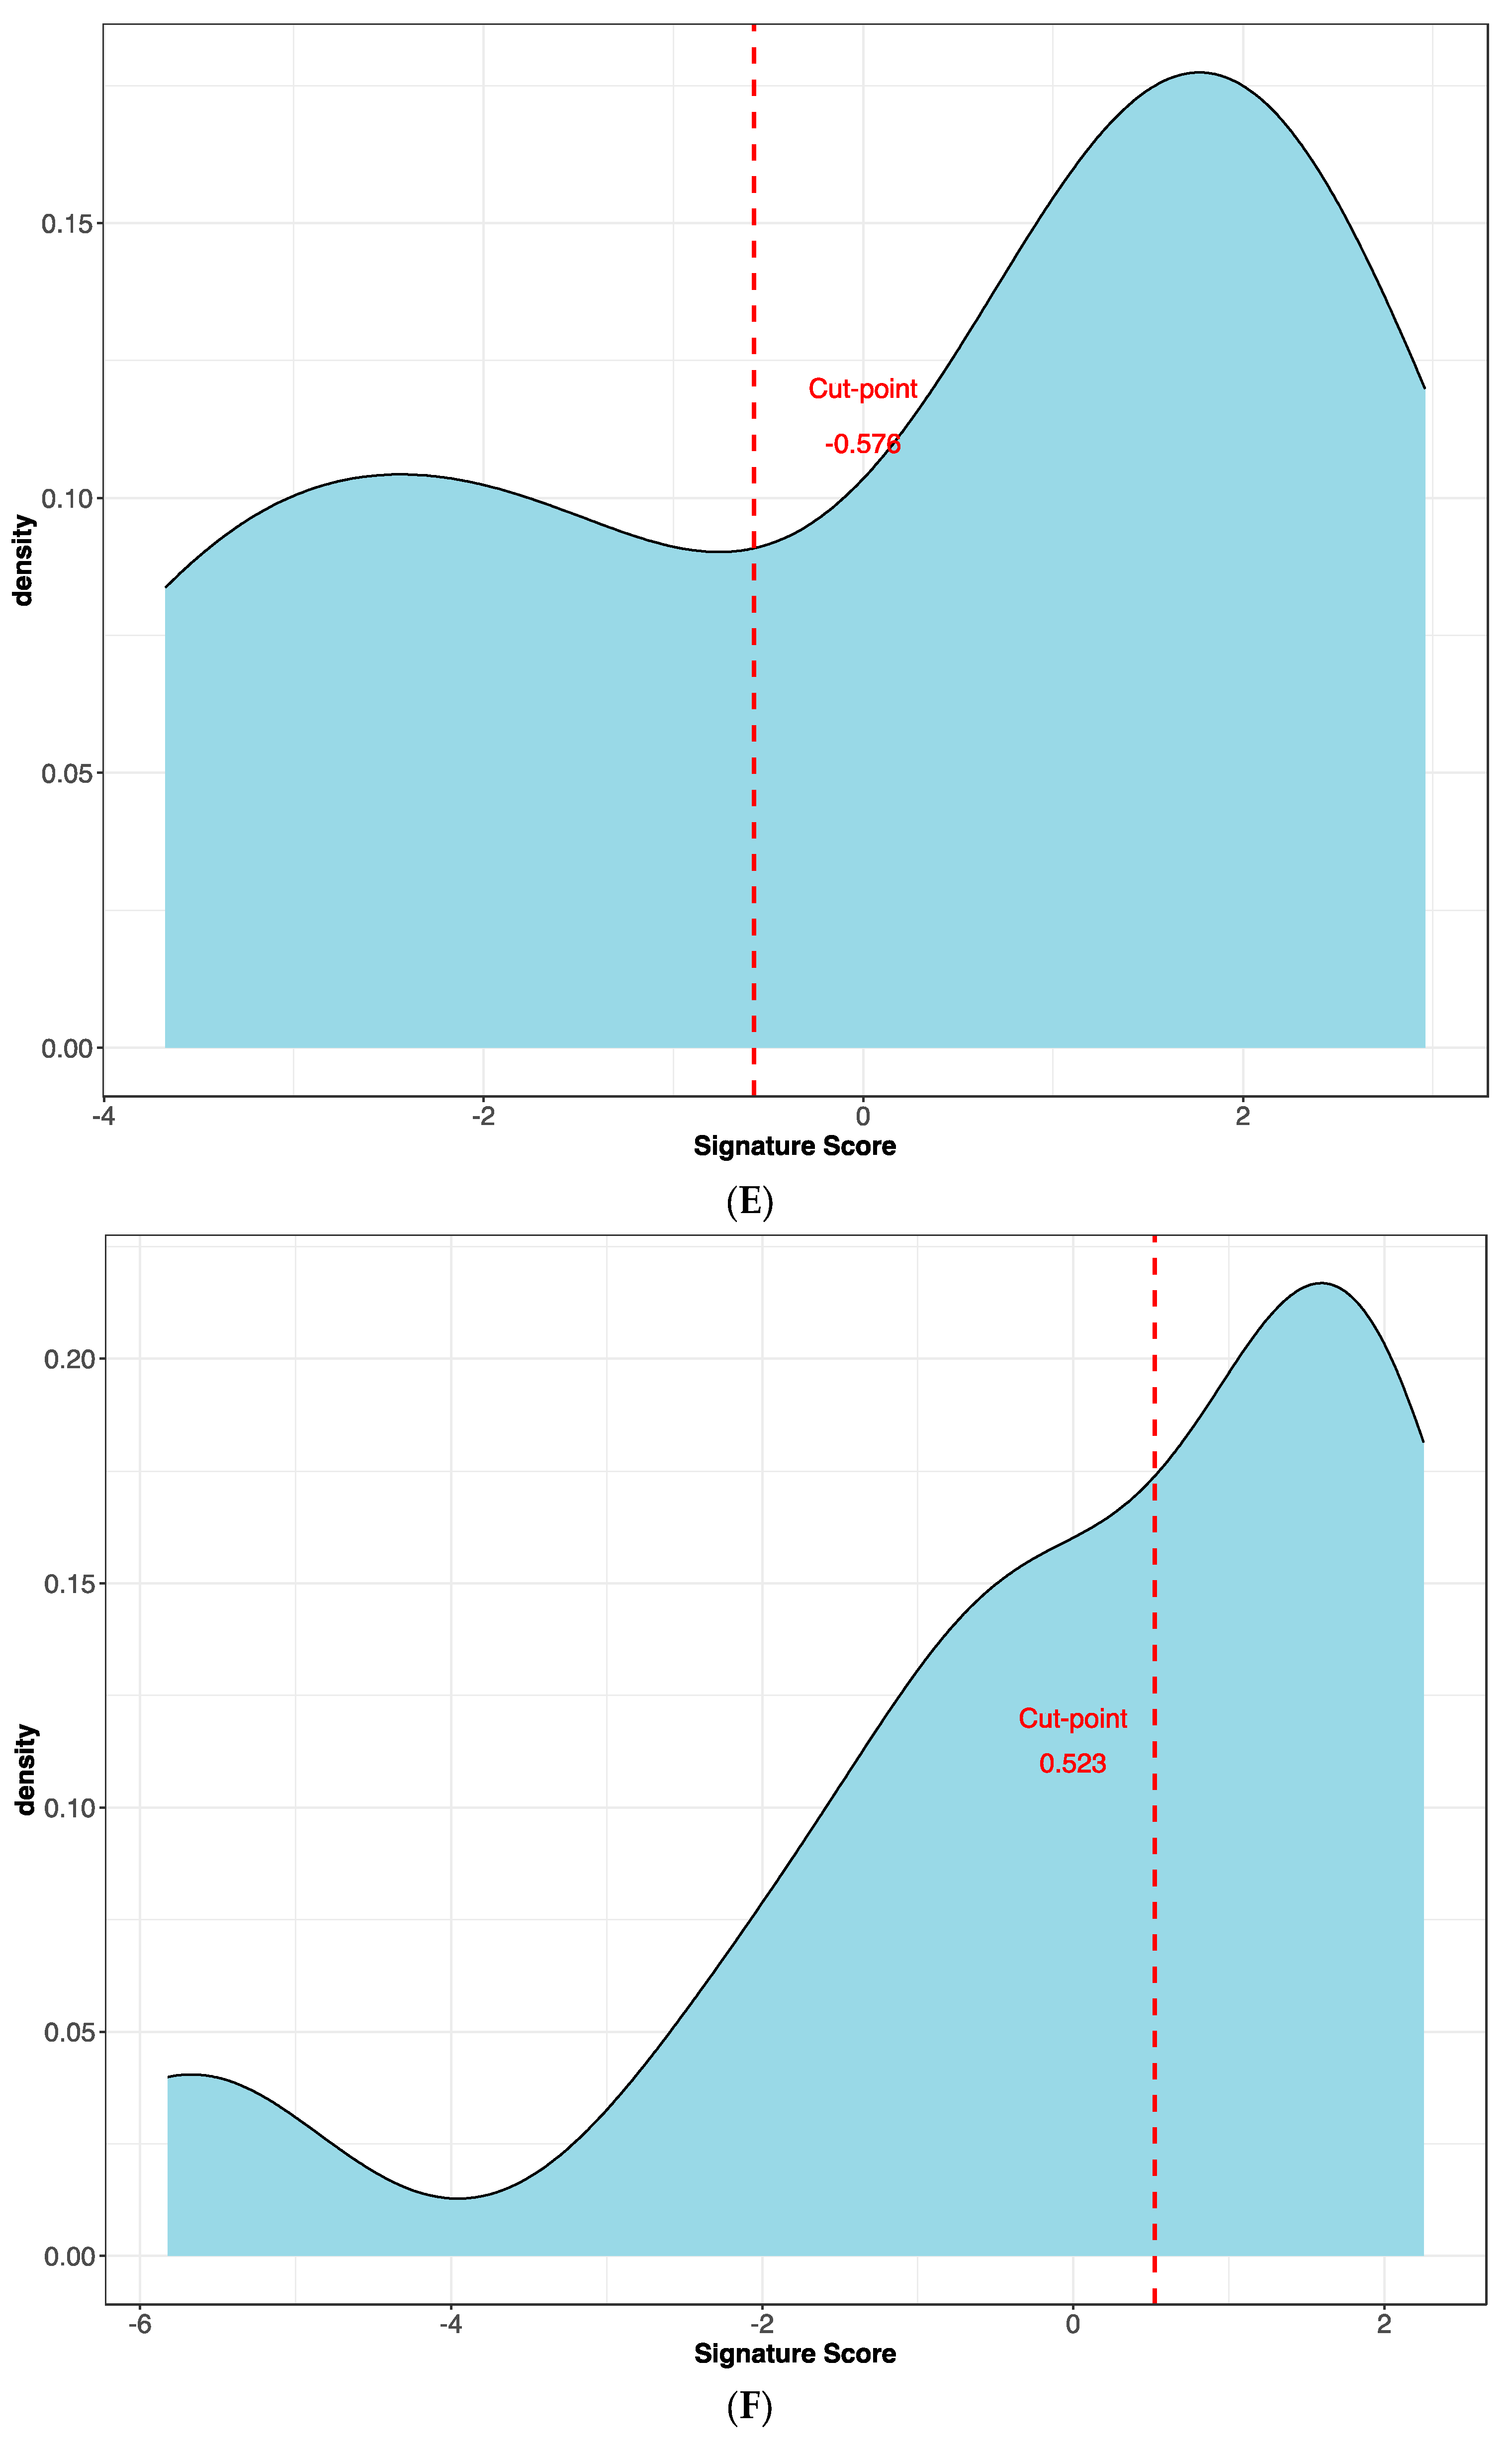
The best protein signature associated with response to anti-PD-1 treatment included 14 proteins (ZNF384, UAP1L1, TRIM32, TLK1, SYTL2, SIRPA, RANBP10, NAGA, MYOIE, LAMTOR4, GM2A, FAM120A, DAPK1, CLN6) and discriminated genes associated with a high risk of disease progression (Supplementary Figure S1A). The optimal cut-off value (−0.578) of signature expression was selected through Lasso regression (Least Absolute Shrinkage and Selection Operator) (Figure 2E,F). The protein signature score was significantly higher in patients classified as responders (low-risk group) to the treatment than in non-responders (high-risk group) (p < 0.0001, Supplementary Figure S2A). Moreover, a different protein pattern was observed from the comparison of two subgroups, high risk vs. low risk (Figure 3).
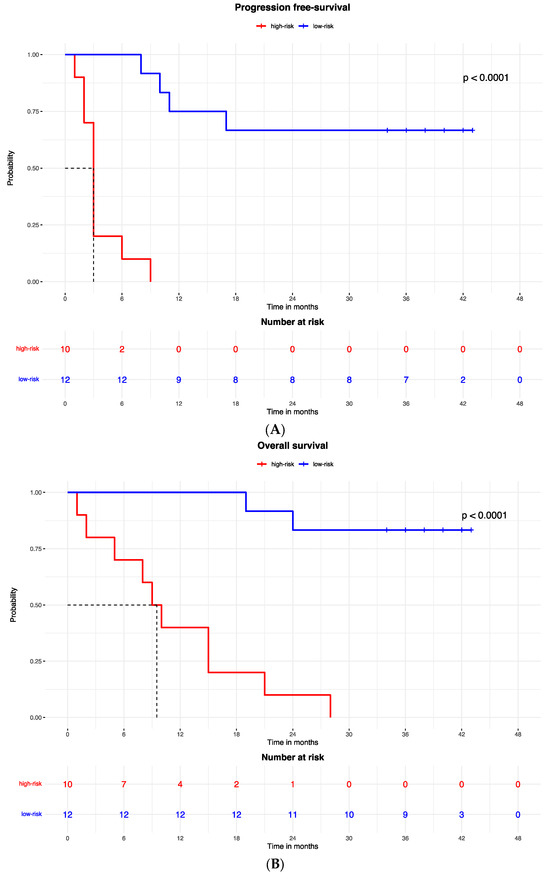
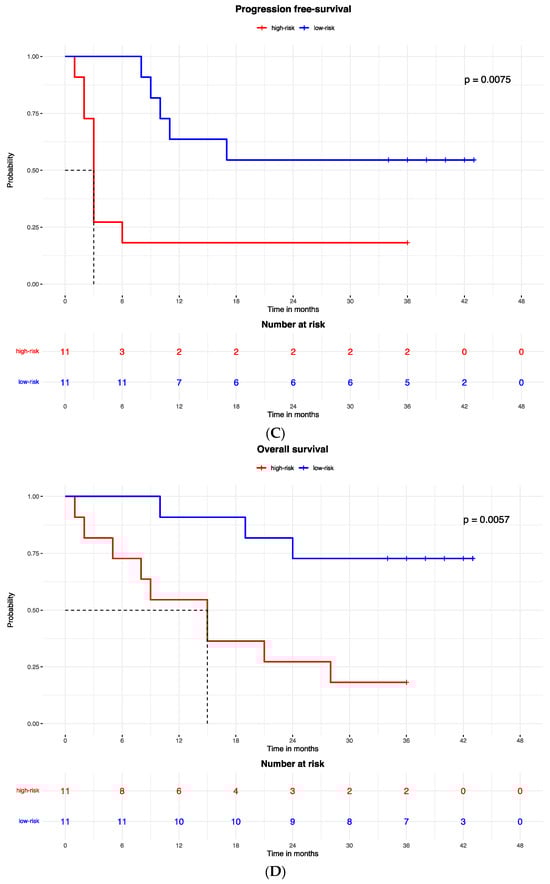

Figure 2.
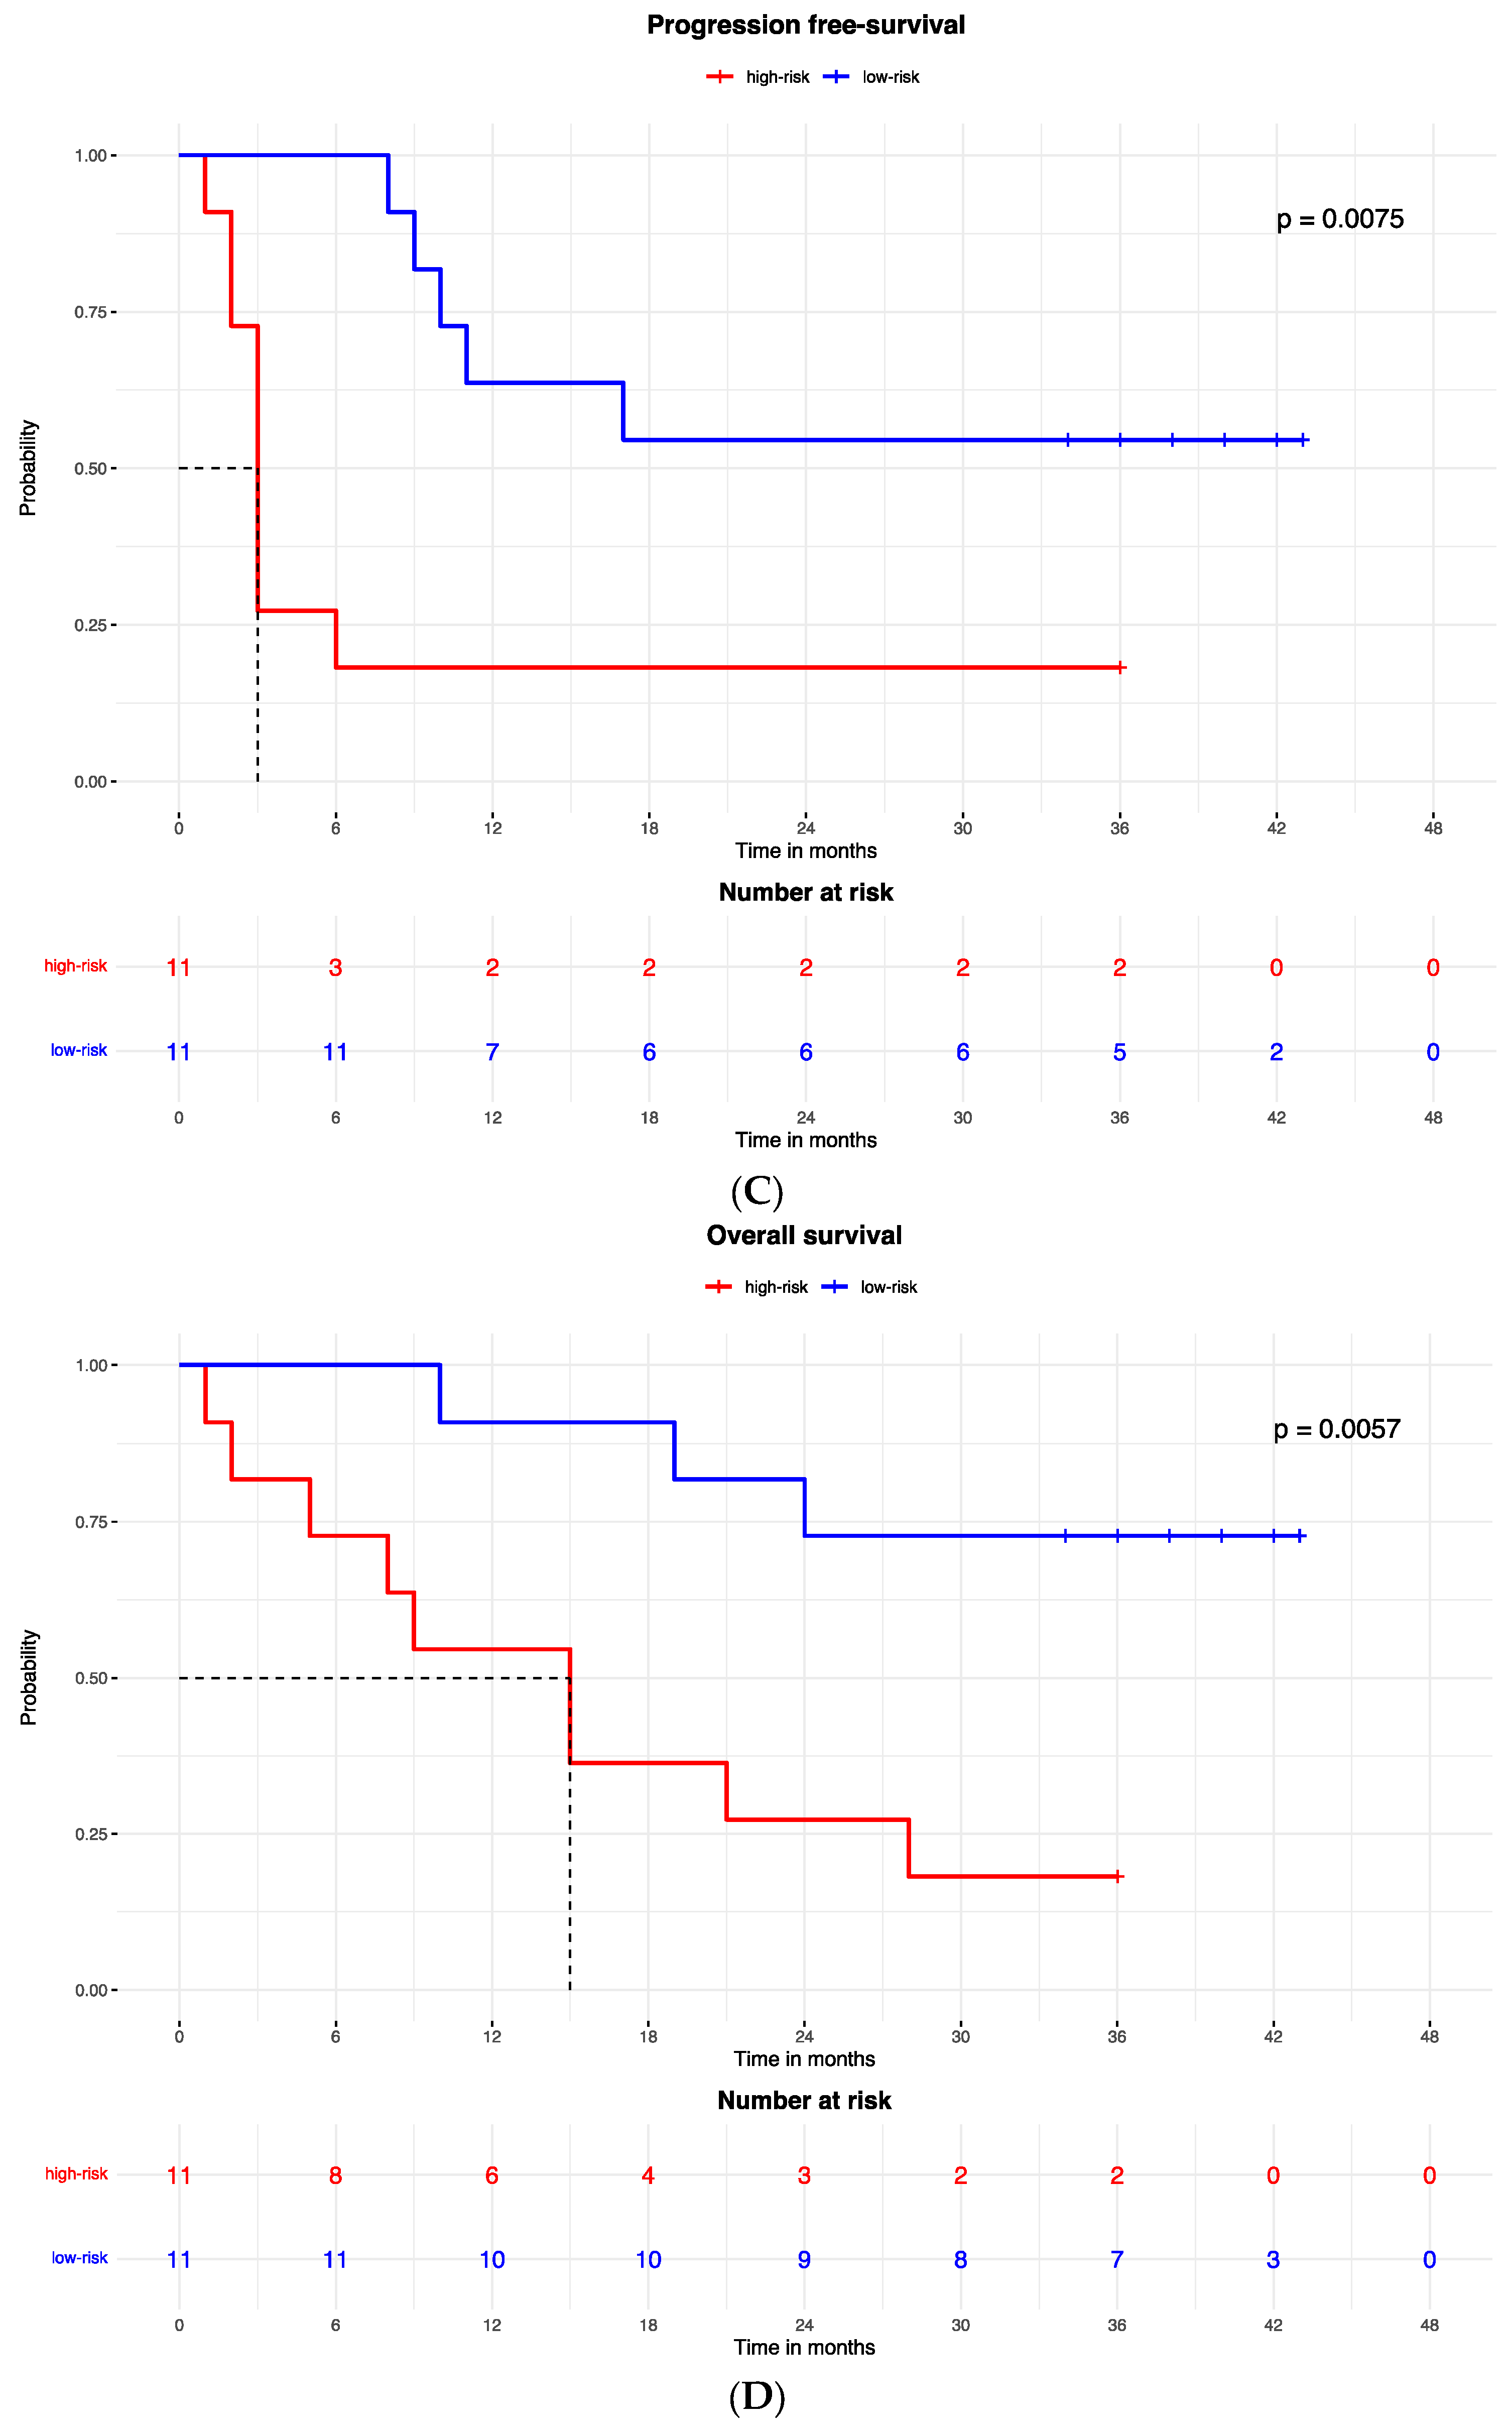
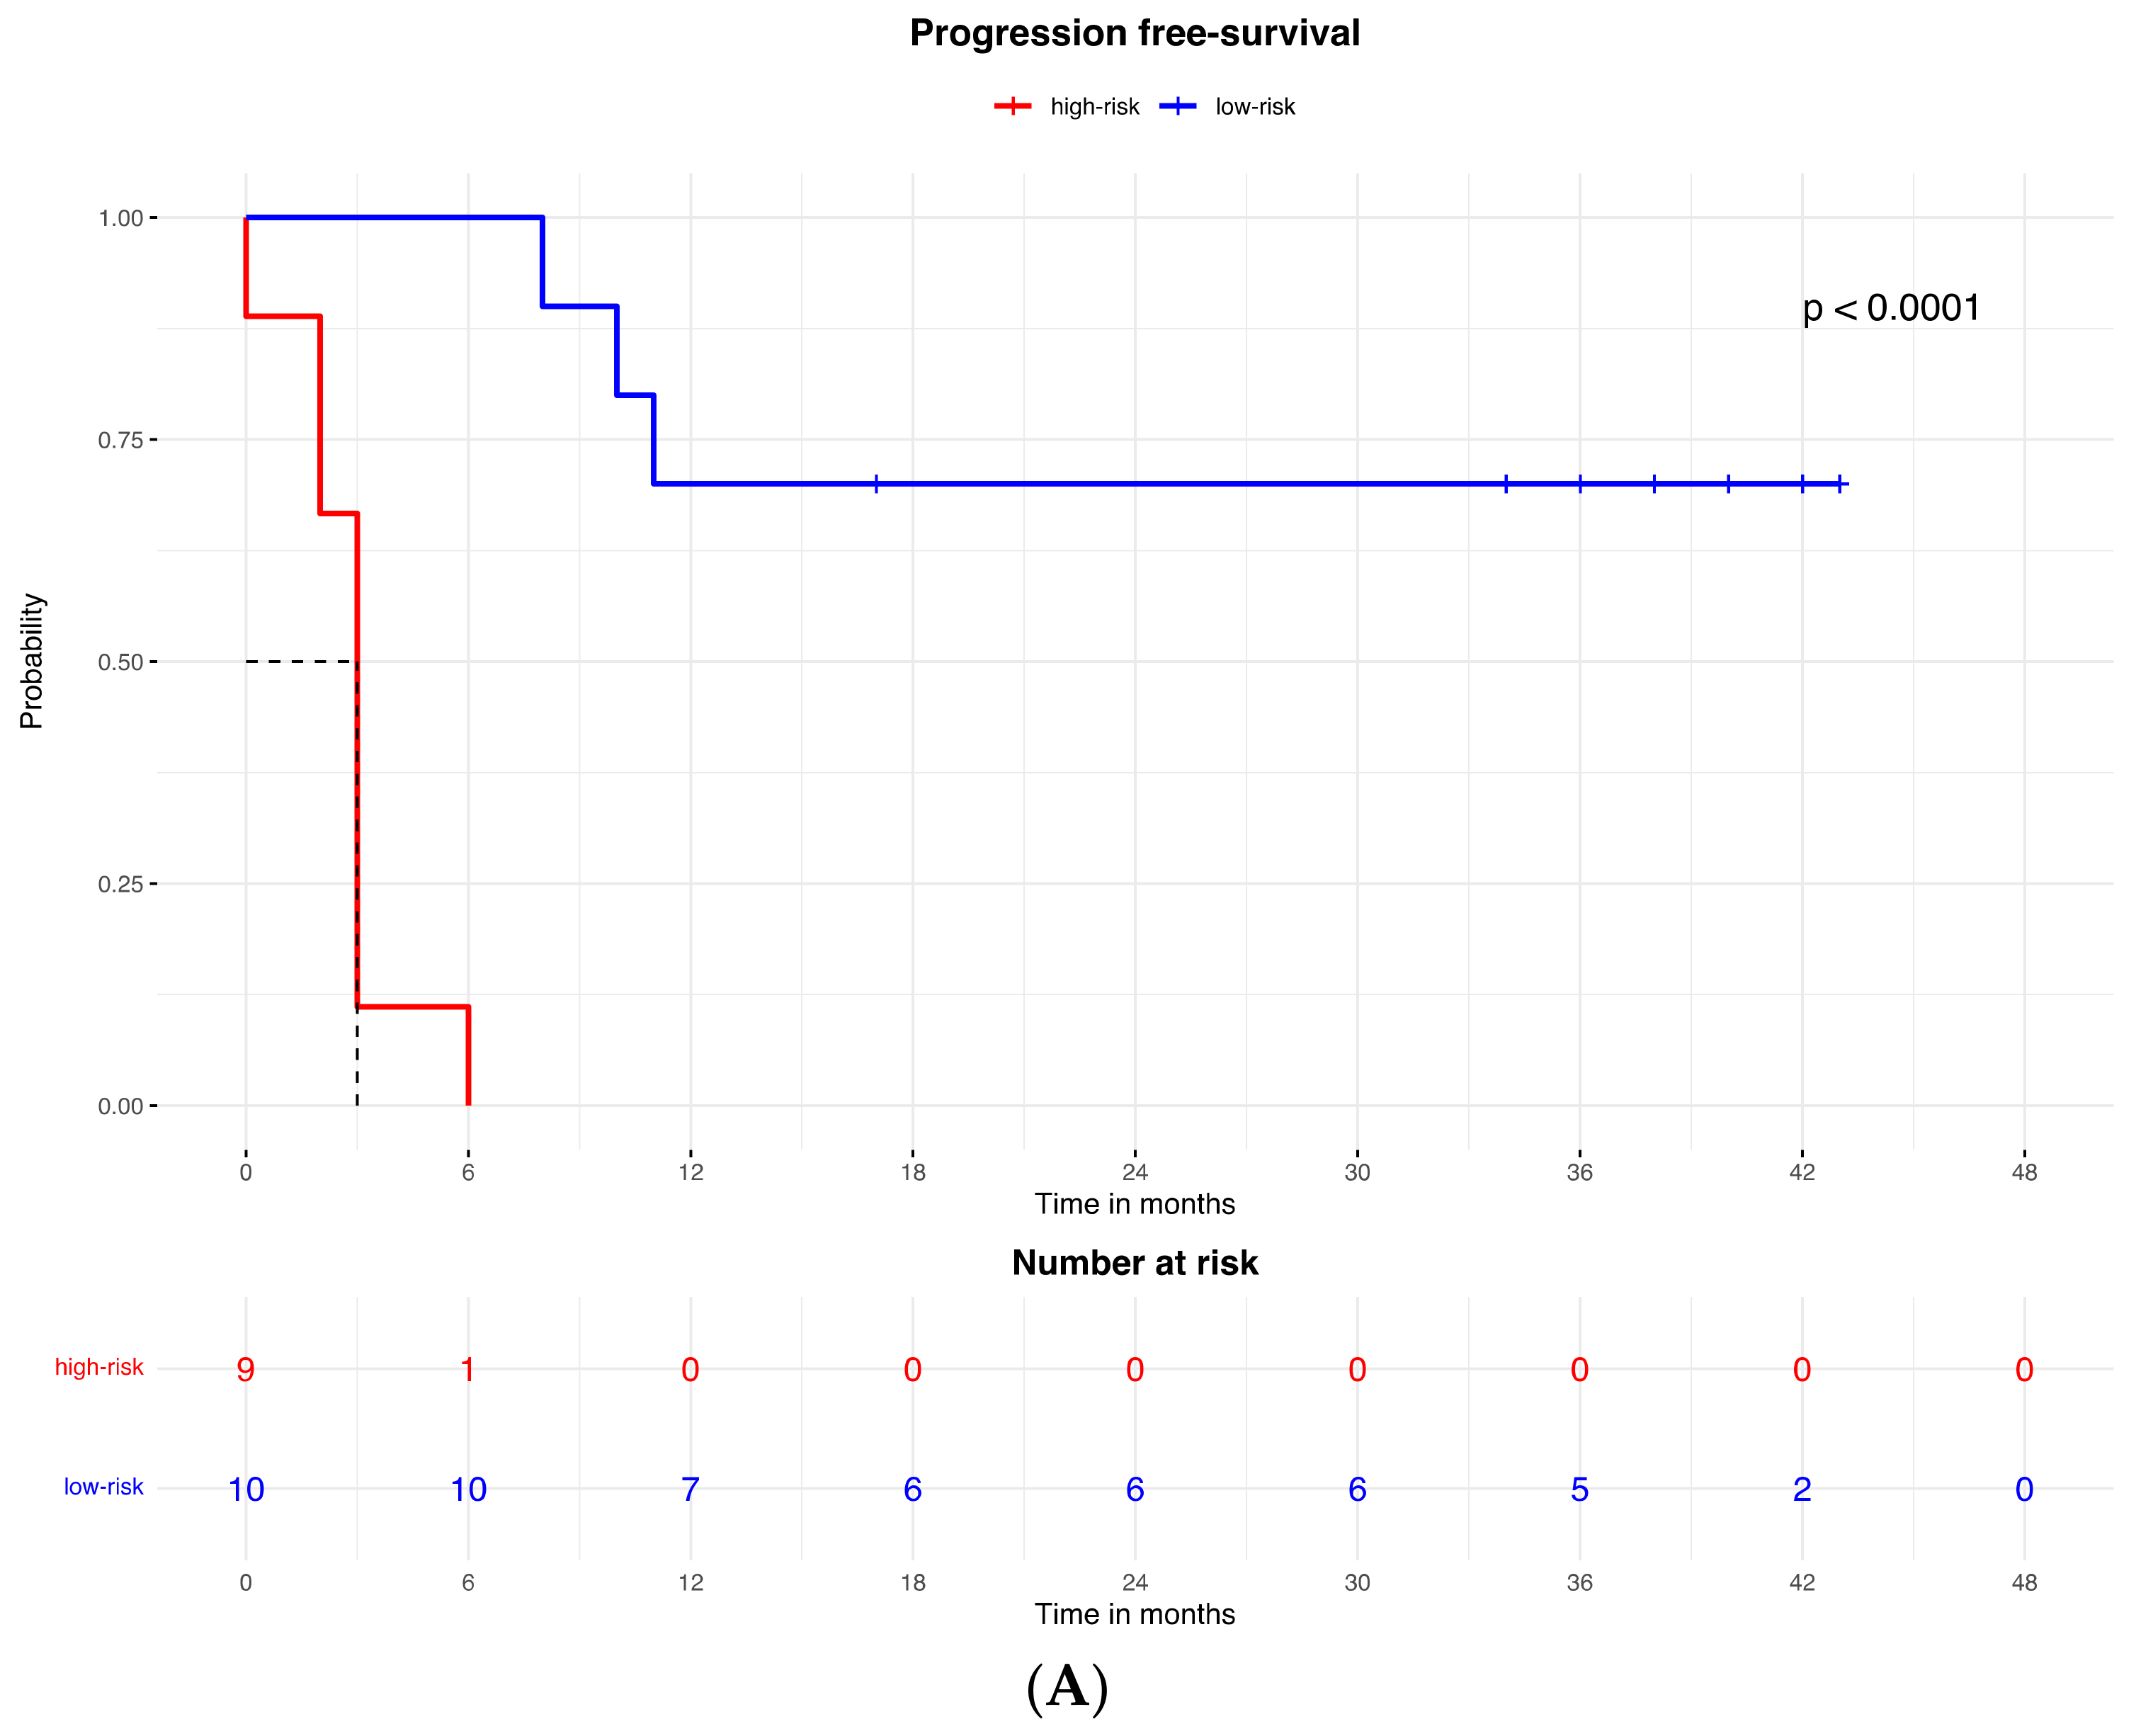
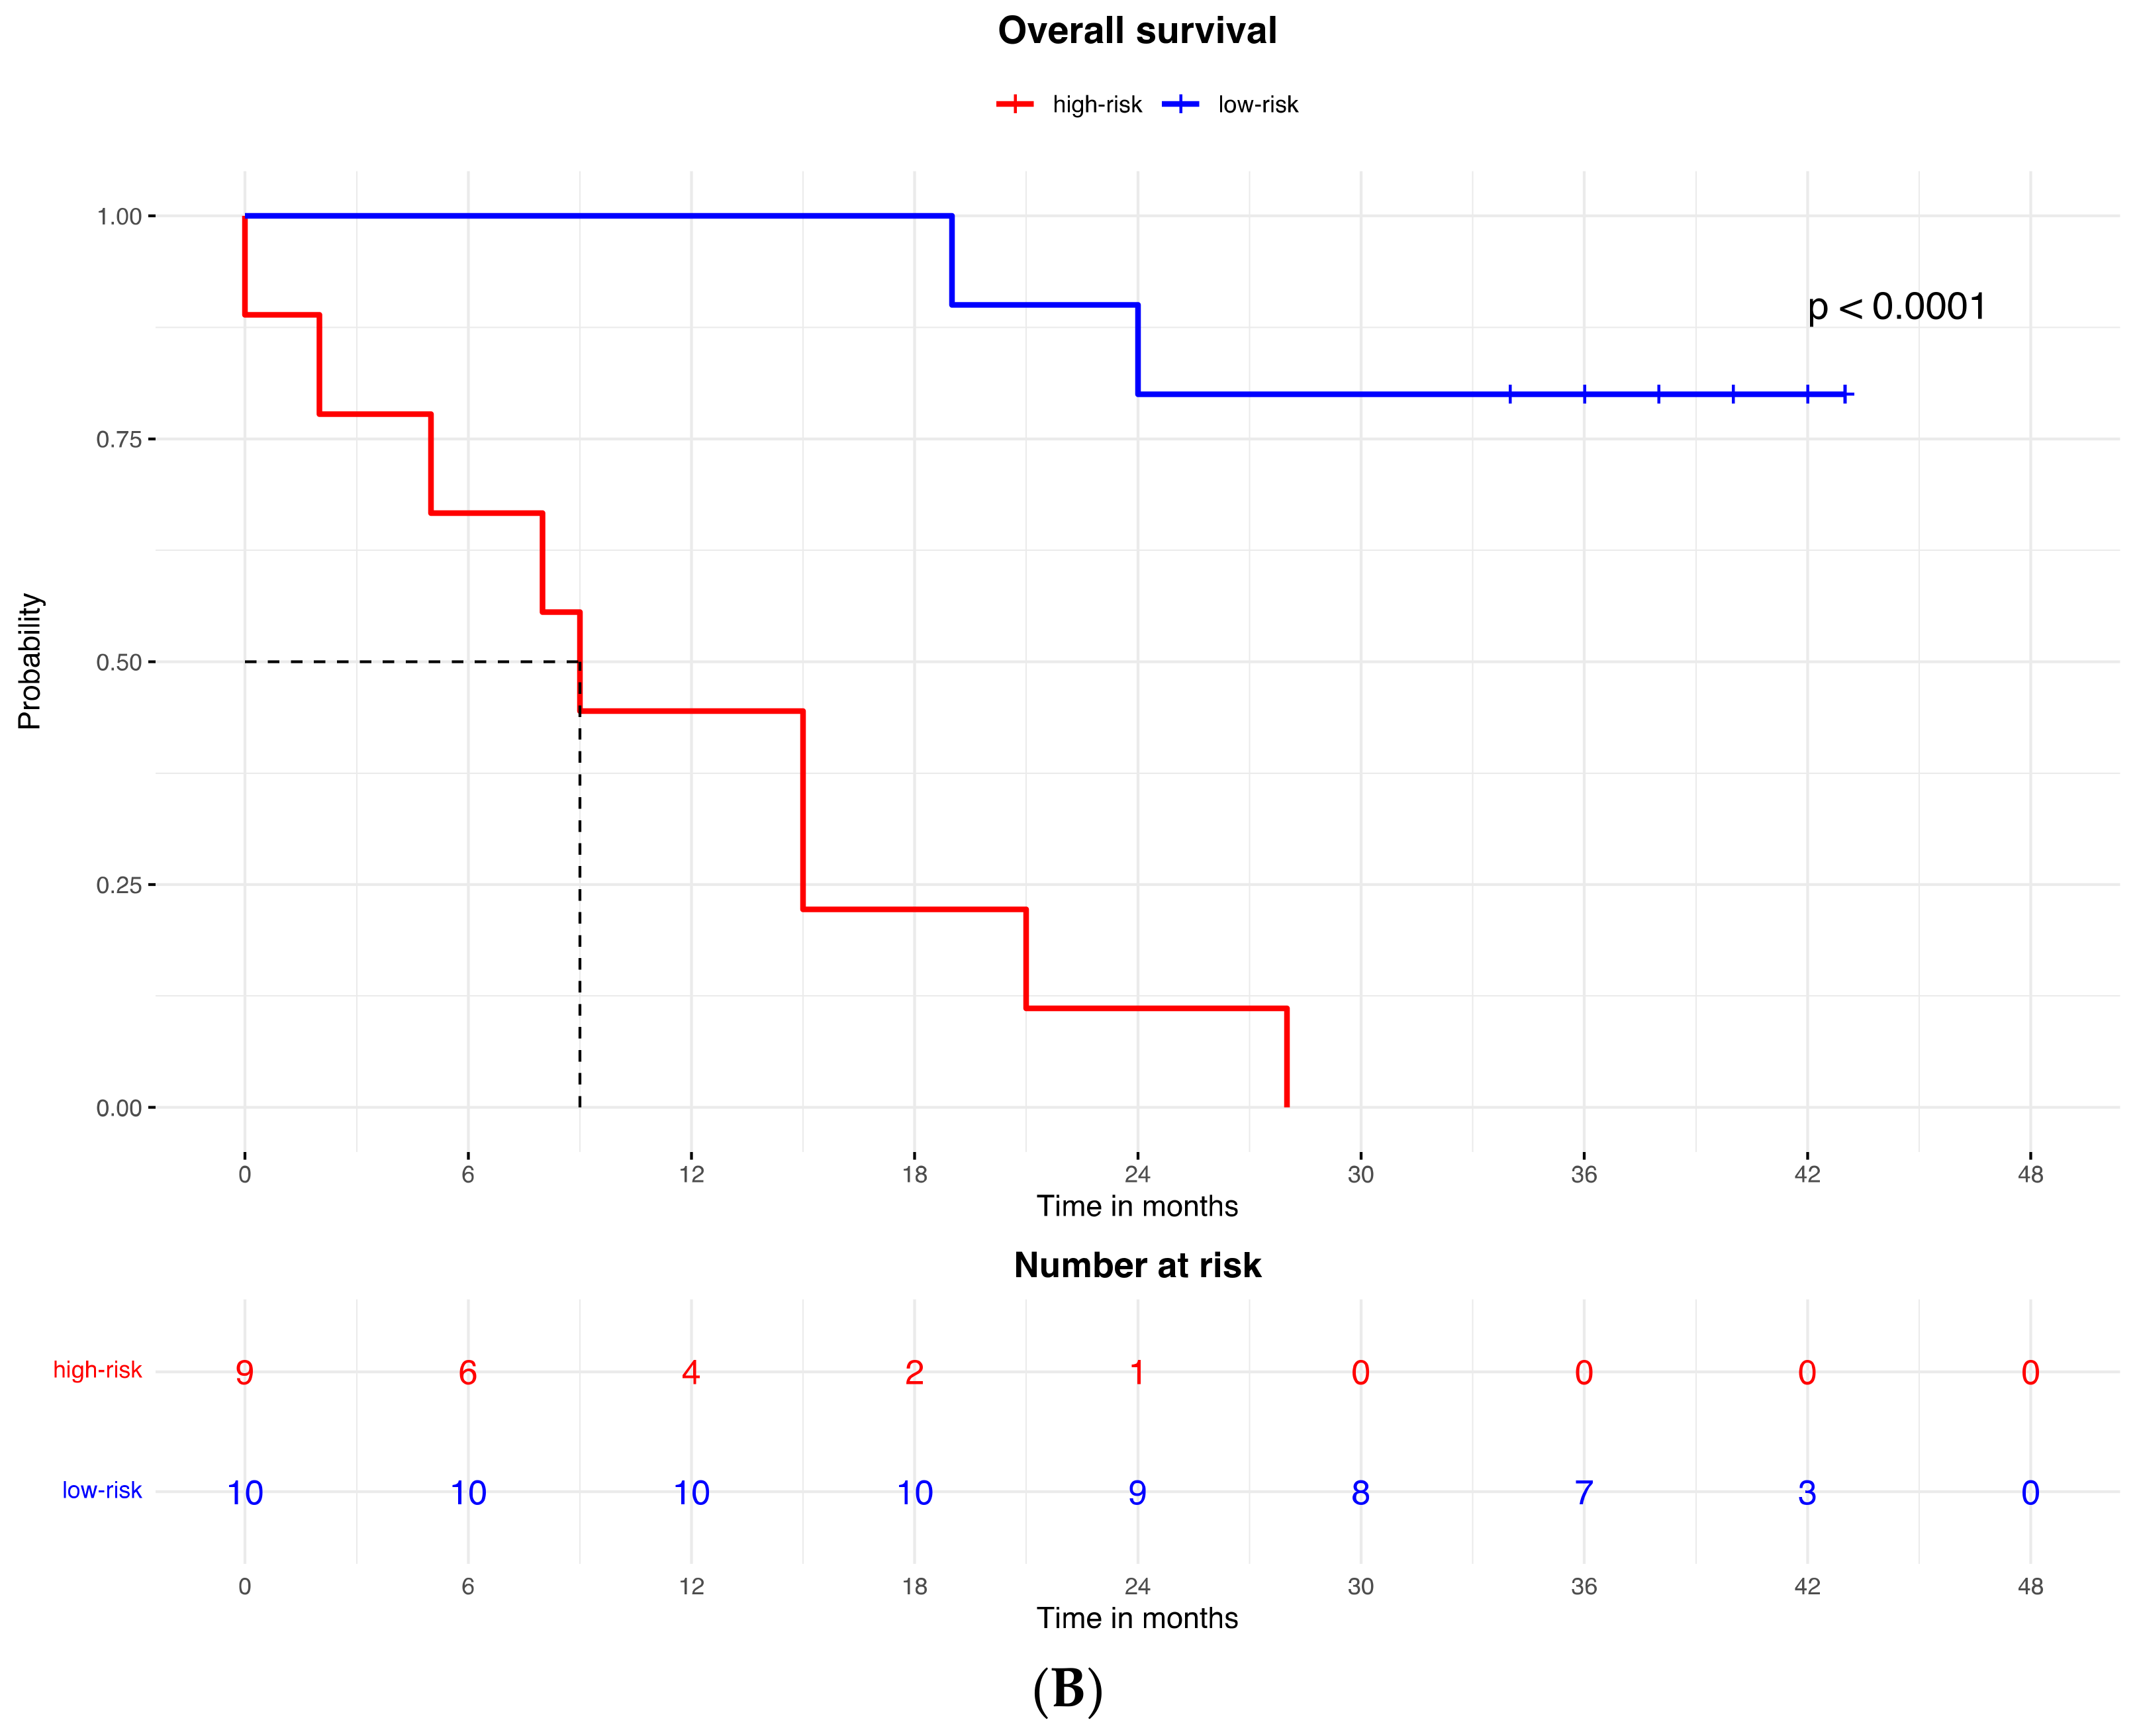
Kaplan–Meier curves for (A) the progression-free survival and (B) the overall survival of patients with high or low expression of the protein signature, (C) progression-free survival and (D) overall survival according to gene signature expression. Lasso regression for determination of best cut-point of protein (E) and gene signature (F).

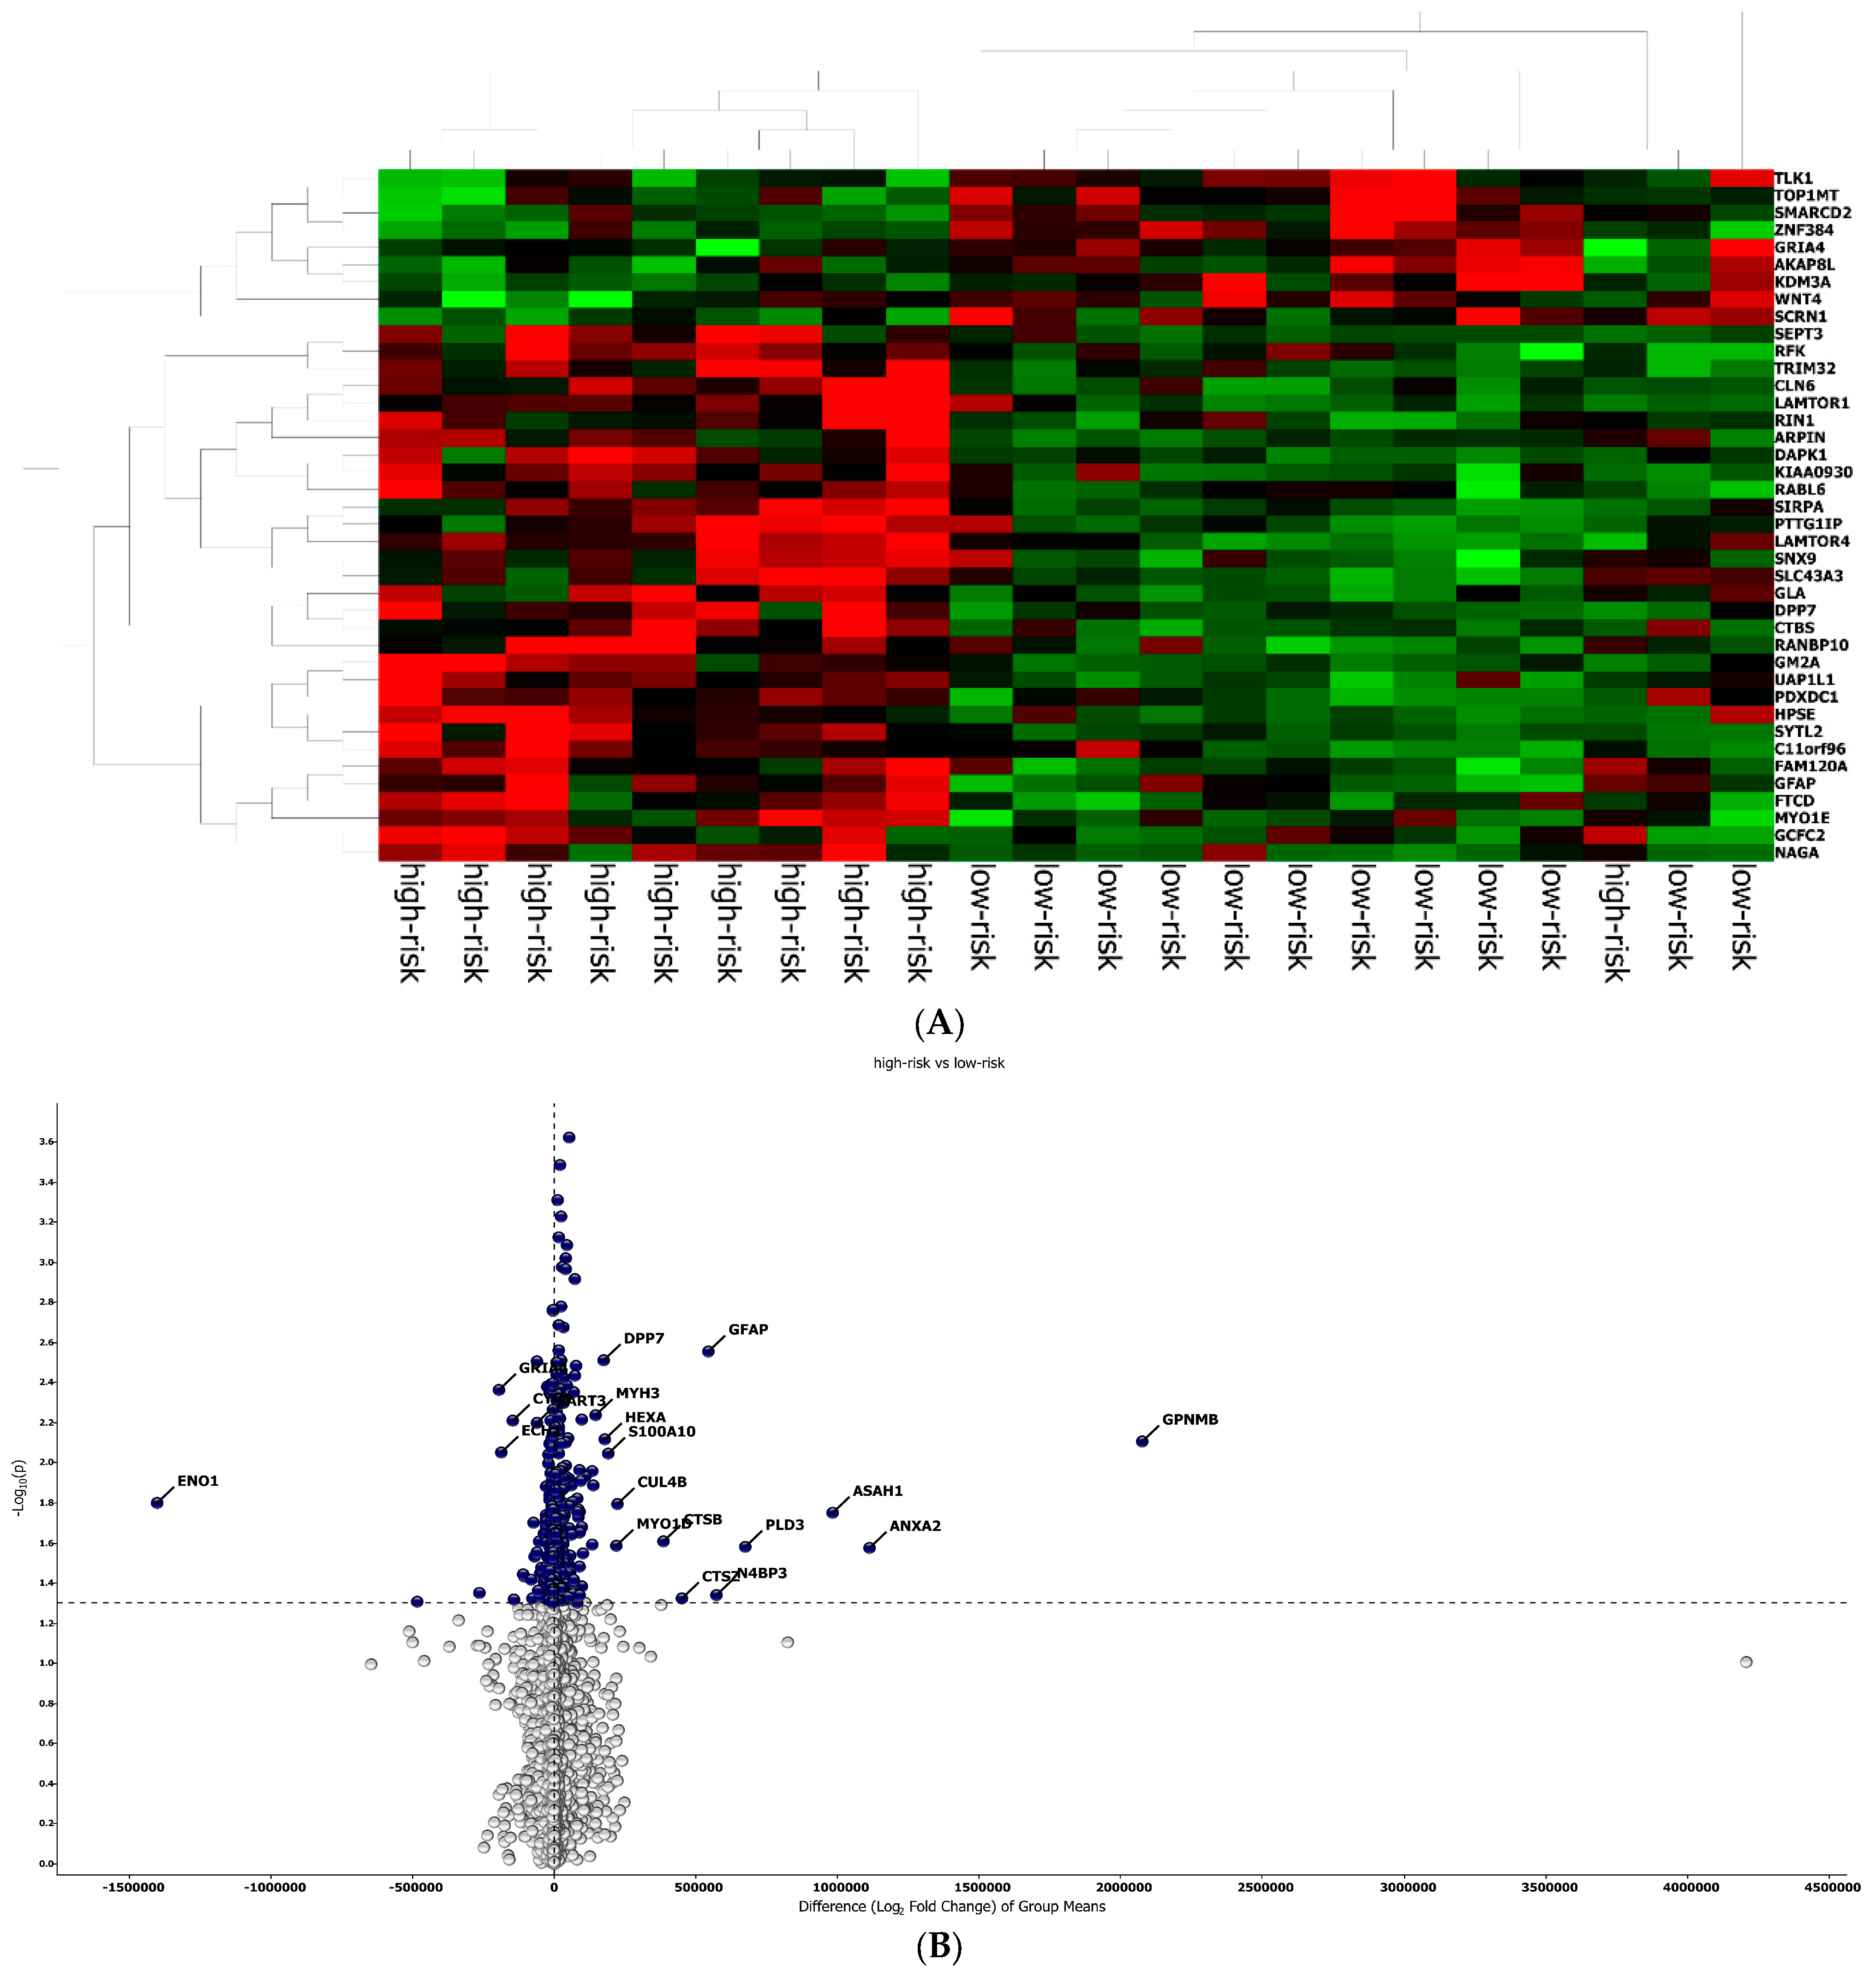
Figure 3.
Protein analysis in high/low-risk patients. (A) Heat map representation. (B) Volcan plot showing gene distribution; p-values are reported on the Y-axis; values reported over the horizontal dotted line are significant, ±1 fold change is defined by vertical dotted.
Accordingly, the PFS Kaplan–Meier curve was significantly better for patients in the low-risk group (with high expression of the protein signature) (HR = 0.023, 95% CI: 0.003–0.213; p < 0.0001; Figure 2A). The median PFS of high-risk patients (with low expression of the protein signature) was 3 months (95% CI: 2–3), while the low-risk group median PFS was not reached.
A similar result was observed for the OS, which was better in patients in the low-risk (high expression of protein signature) group compared to patients with low expression of the protein signature and high-risk group (HR = 0.053, 95% CI: 0.011to 0.260; p < 0.0001; Figure 3B). The median OS was 9.5 months (95% CI: 5 to 9.5) in the high-risk (low protein signature expression) group and was not reached in the low-risk group.
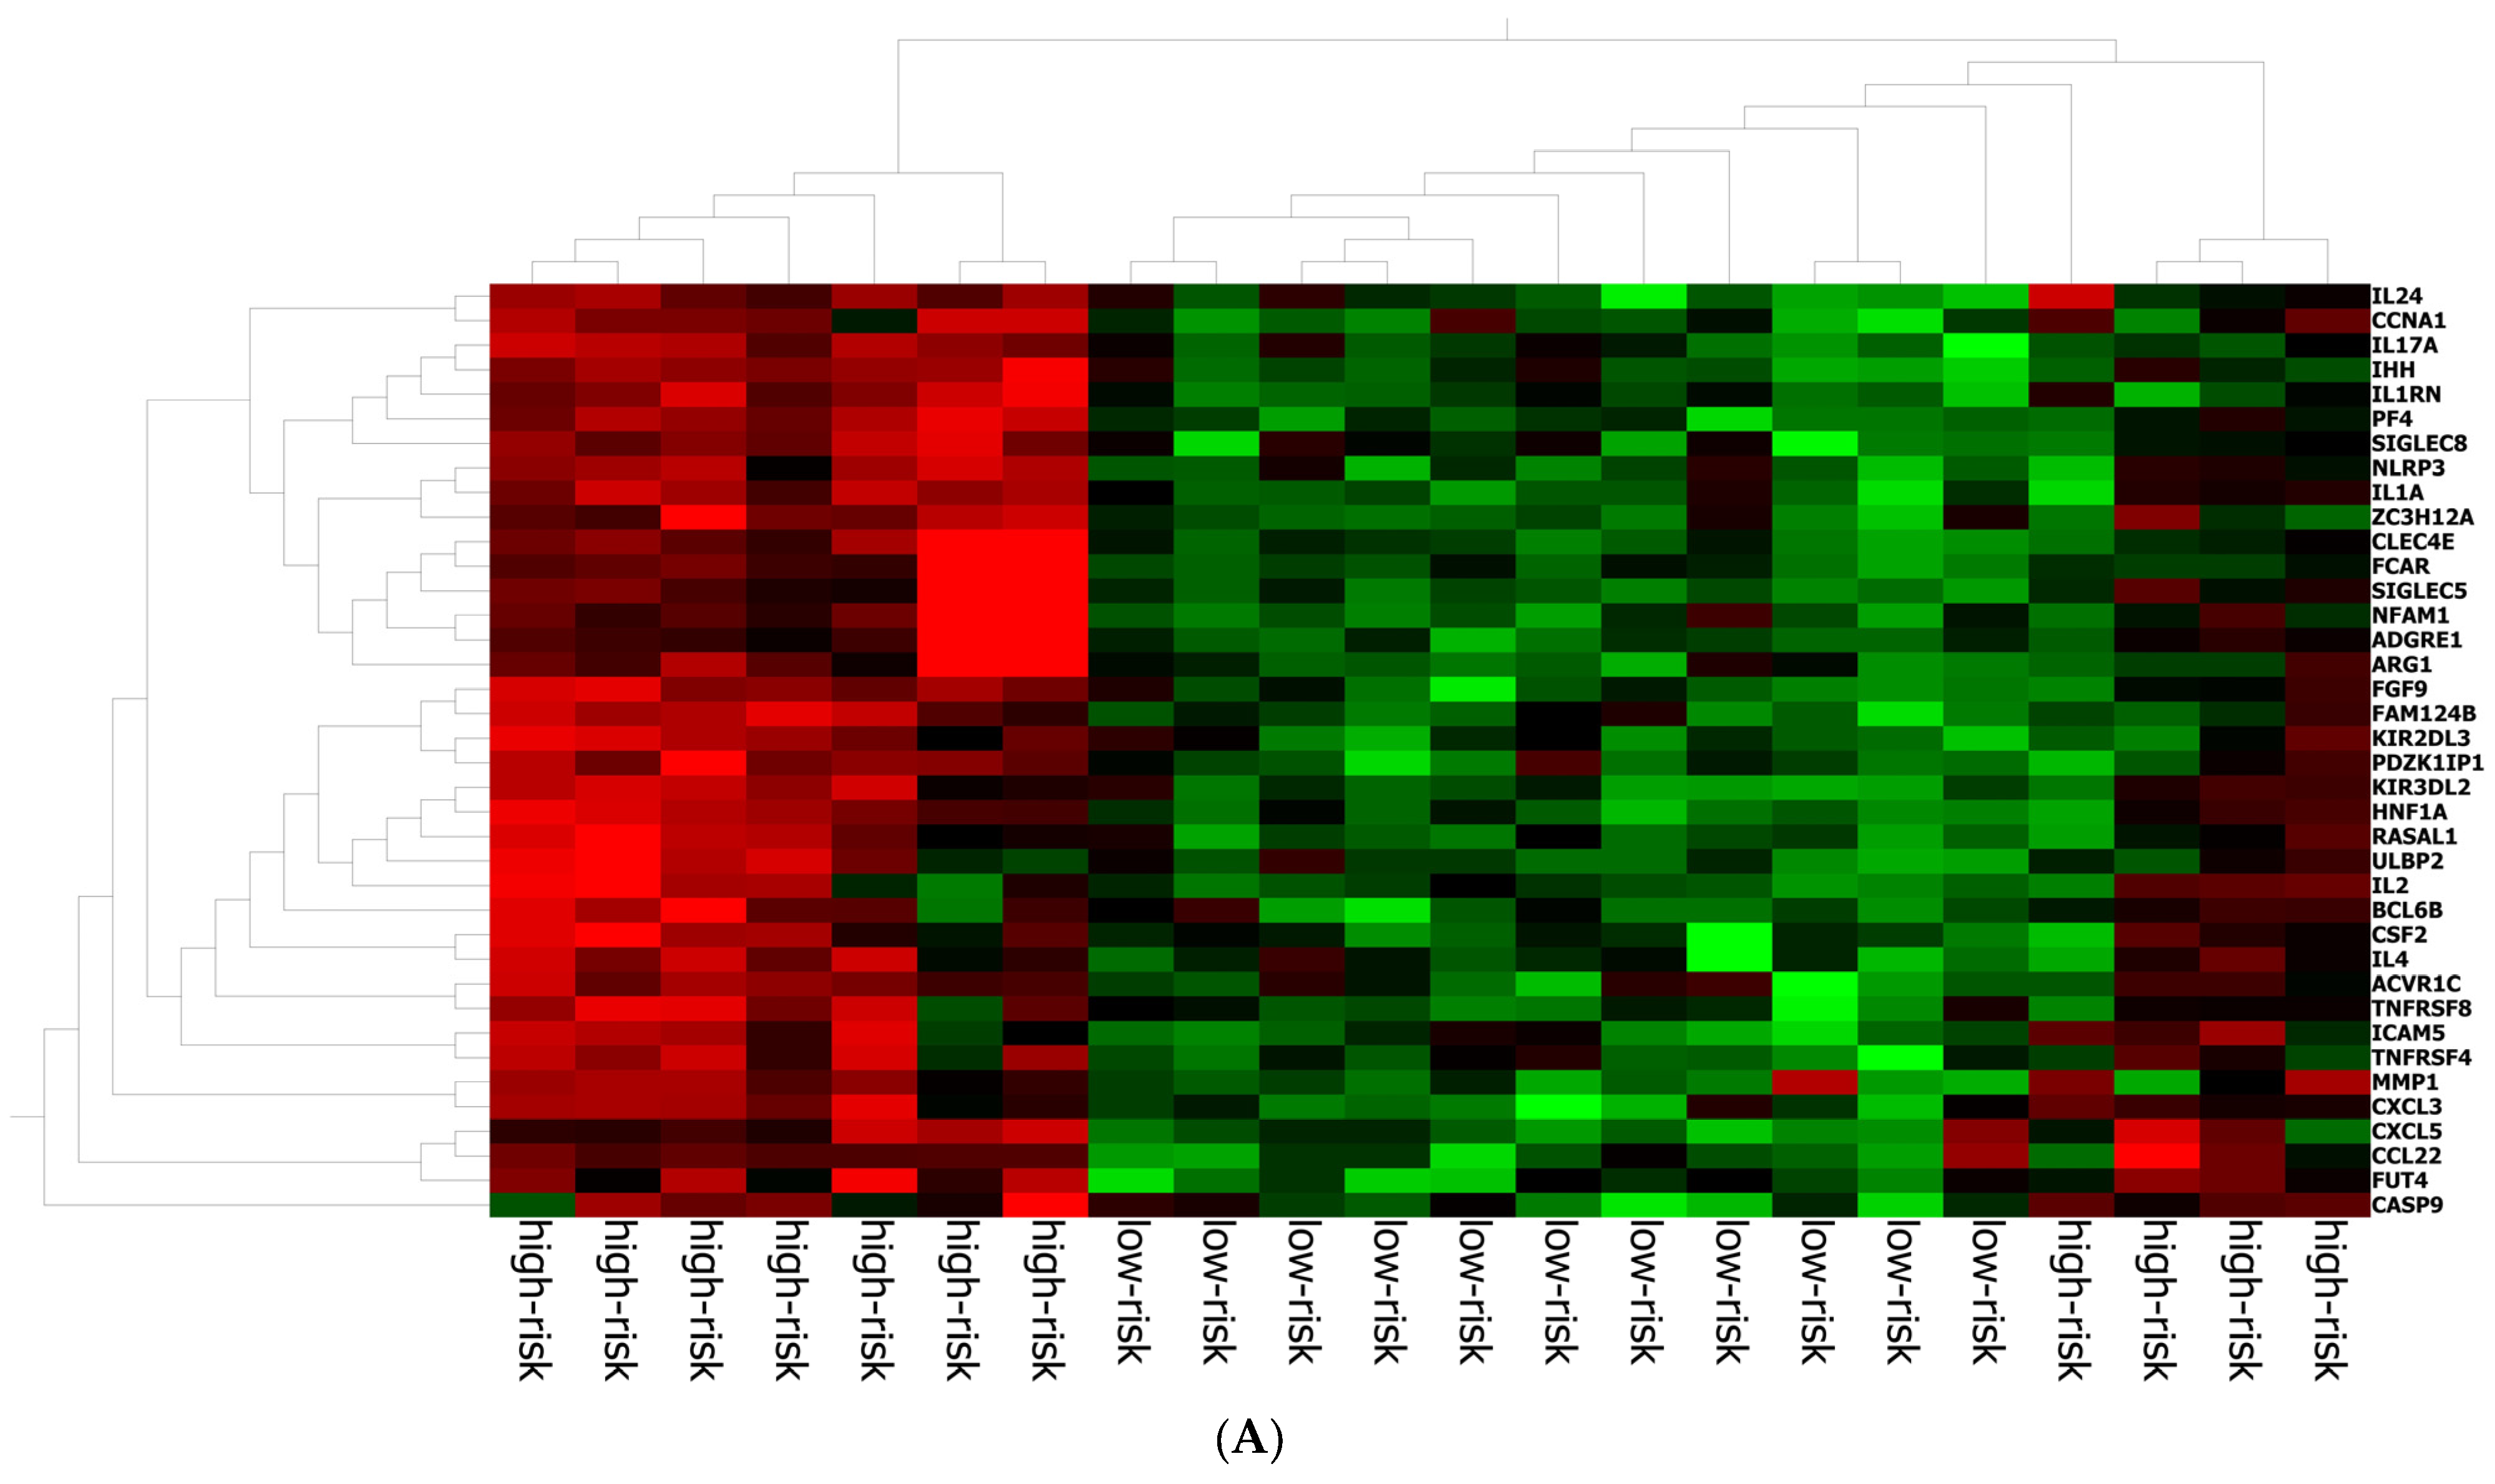
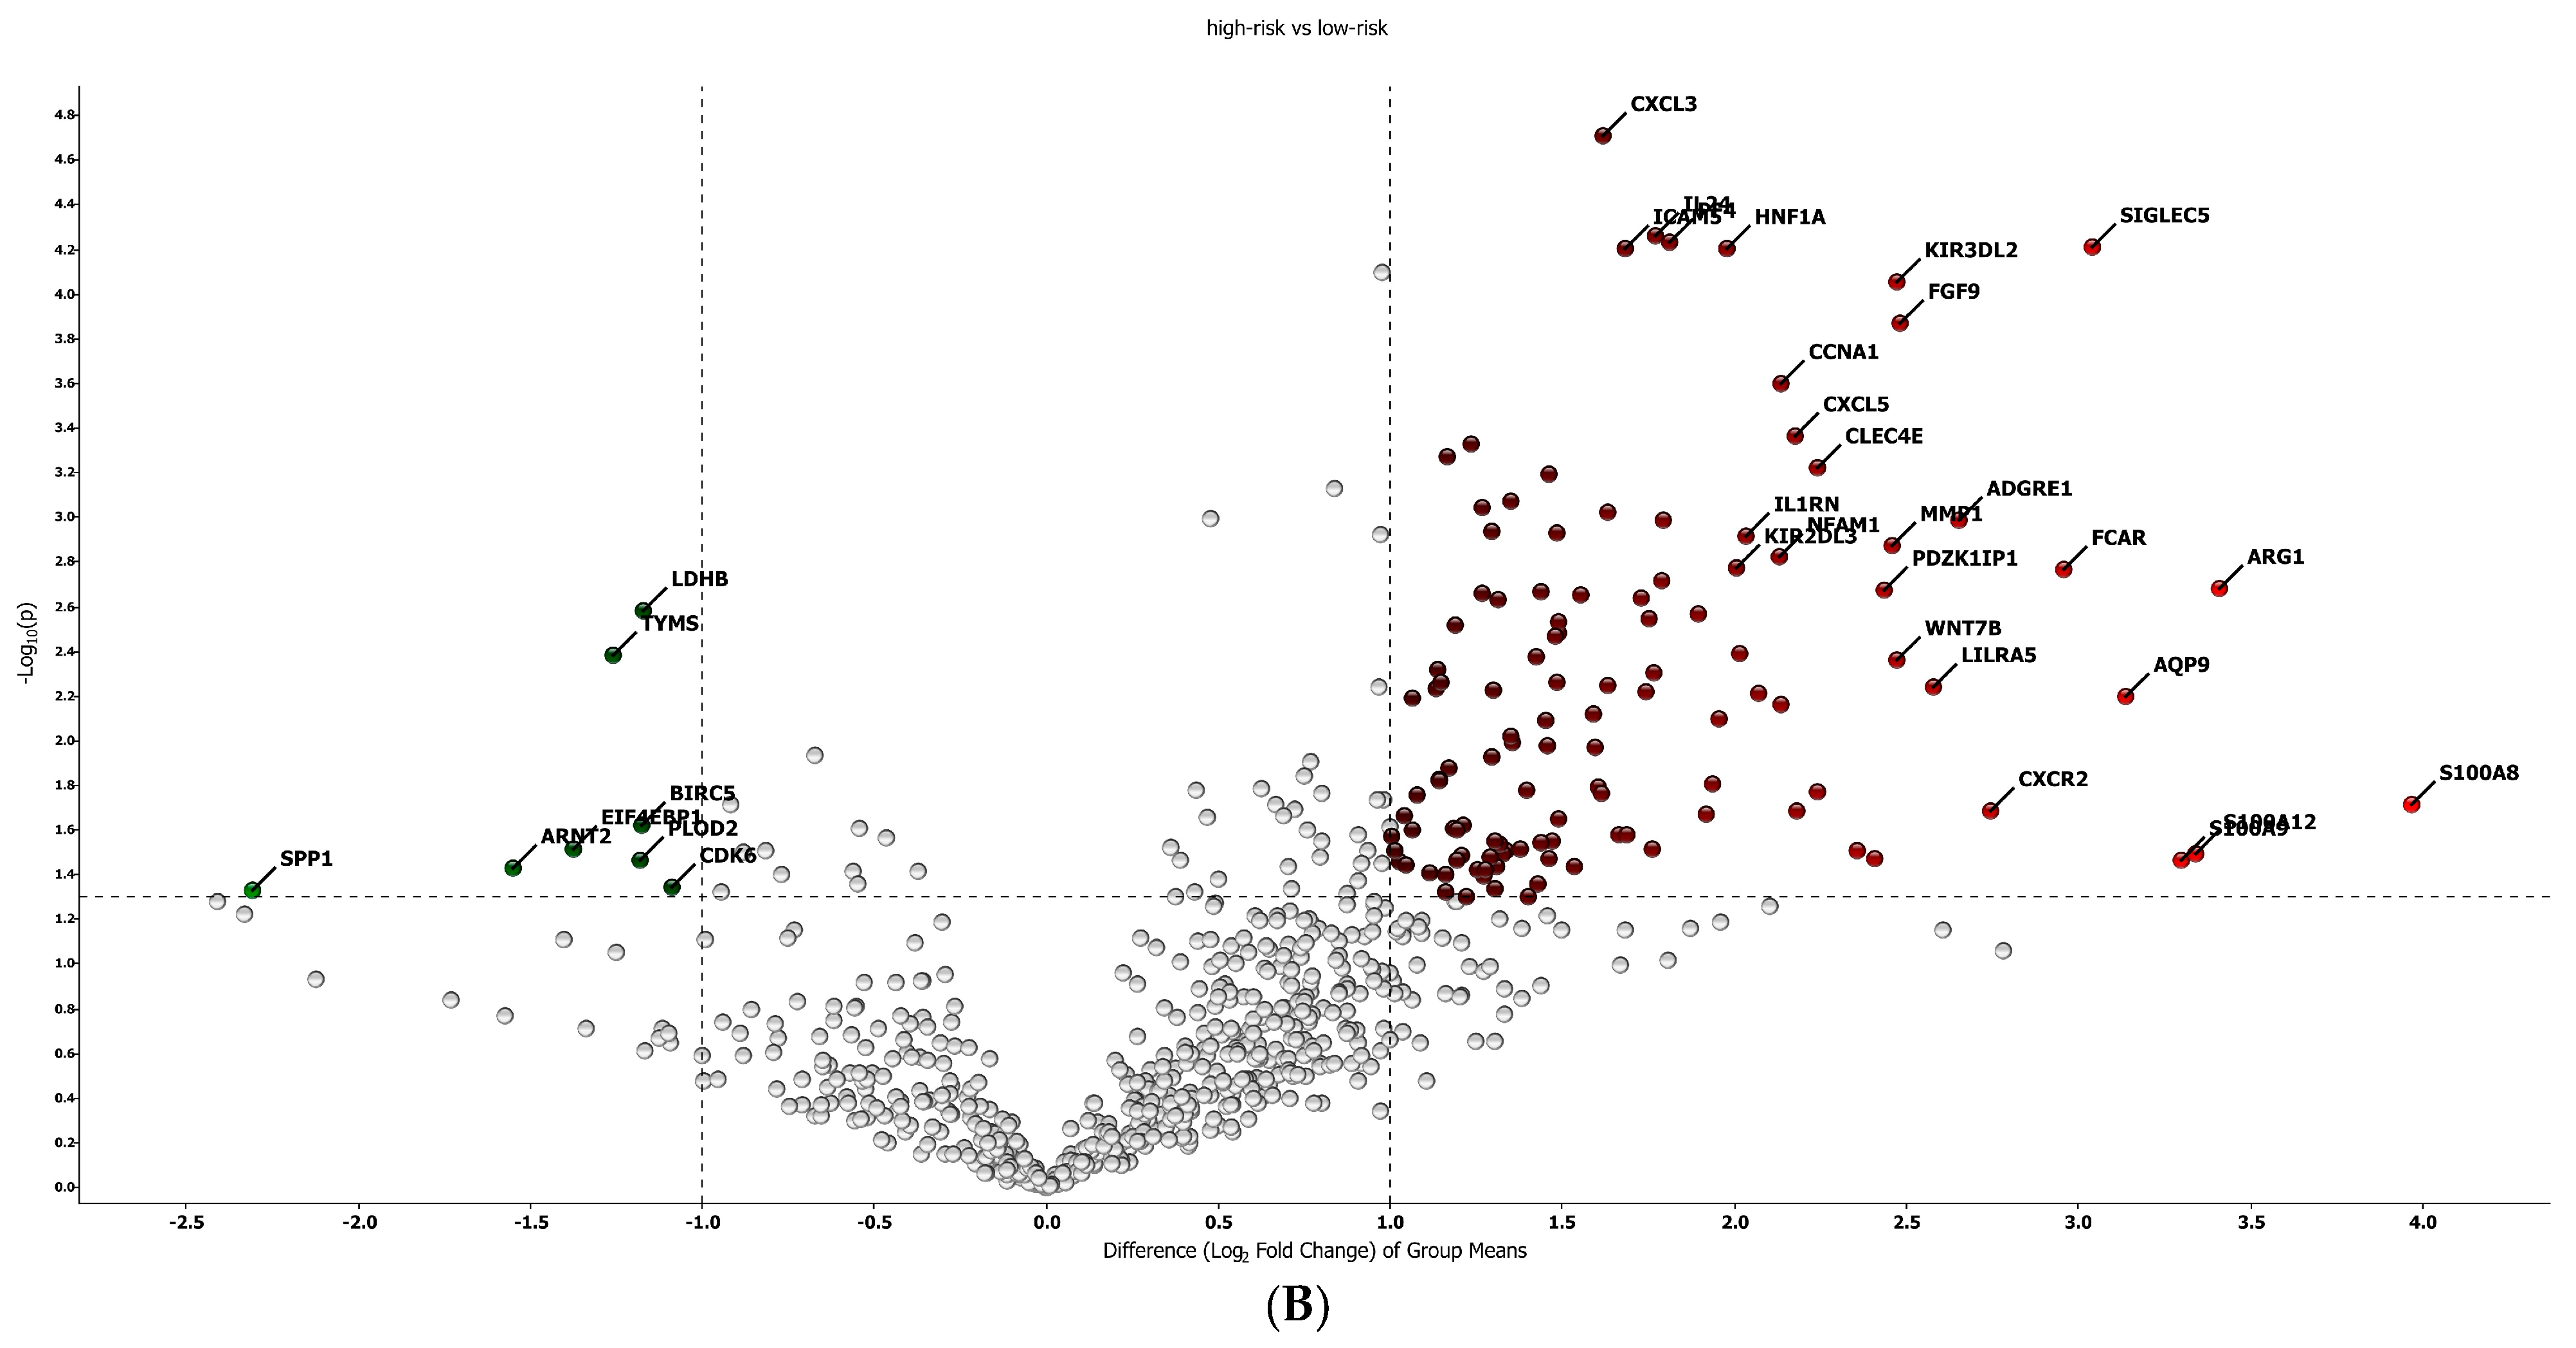
The best gene signature associated with response to anti-PD-1 treatment included 20 genes discriminating a pattern associated with a high risk (low expression of the gene signature) of progression (VEGFA, SIFGLEC5, PF4, MAGEB2, LILRA5, ITGAM, IL24, IL2, IL1B, ICAM5, HNF1A, GOT1, FUT4, FGF9, FADD, CCNA1, CCL2, BIRC5, APH1B and ADGRE1) (Figure 4A), and patients with high signature values had a high expression of genes with inflammatory and pro-tumoral activity, including SIGLEC5, CXCL3, MMP1, ARG1, S100A8, S100A9 and S100A12 (Supplementary Figure S3A). The optimal cut-off value (0.623) of signature expression was selected through Lasso regression (Figure 2F). Patients classified as non-responders (high risk) to anti-PD-1 treatment had a significantly lower gene signature expression (p < 0.0001; Supplementary Figure S2B) than responders (low risk). Moreover, a different genetic pattern was observed from the comparison of two subgroups, high risk vs. low risk (Figure 4).
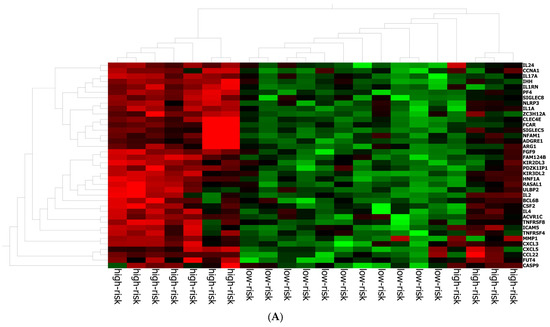
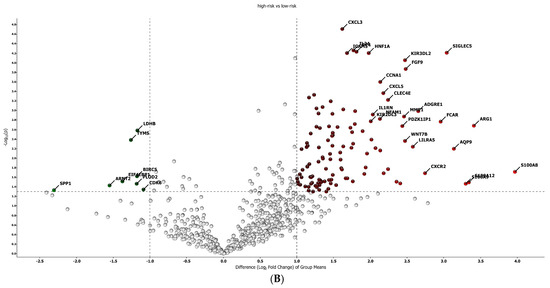
Figure 4.
Gene expression in high/low-risk patients. (A) Heat map representation. (B) Volcan plot showing gene distribution; p-values are reported on the Y-axis; values reported over the horizontal dotted line are significant, ±1 fold change is defined by vertical dotted.
The Kaplan–Meier curves showed that patients with low-risk gene signatures had better PFS (HR = 0 0.221, 95% CI: 0.071–0.68; p = 0.007; Figure 2C) and OS (HR = 0.186, 95% CI: 0.05–0.695; p = 0.005; Figure 2D). The median PFS was 3 months in the high-risk group and was not reached in the low-risk group. The median OS was 15 months in the high-risk group and was not reached in the low-risk group.
The proteomic and transcriptomic analyses were combined, and the top five candidate molecules between responders and non-responders were found among the 418 overlapping sets of genes and proteins (Figure 5). No difference was found between high- and low-risk patients for the expression of both protein and RNA of MARCO, OAS1 and TGFBR1. For STAT2, signal transducer and activator of transcription 2, a gene involved in cell replication and growth, the protein was less expressed in responders than in non-responders (low-risk vs. in high-risk patients) (p = 0.02), while there was no difference in RNA expression between the groups. FADD, Fas-associated via death domain, had a higher expression of RNA in non-responders (p = 0.02) and no difference in the protein expression.
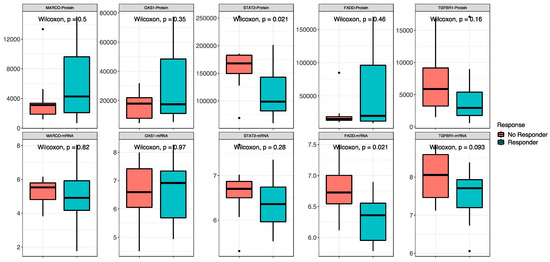
Figure 5.
Combined proteomic and transcriptomic analysis. Non-responder/responder patients are defined by the red and blue boxes, respectively. On the top are the comparisons between proteins, and on the bottom are the comparisons between RNAs of the same molecules.
The proteomic and transcriptomic combined analysis was significantly associated with the outcomes of the anti-PD-1 treatment. All the patients with low expression of protein and gene signatures had progression within 6 months of treatment (median PFS = 3 months, 95% CI: 2–3), with a significant difference vs. the low-risk group (median PFS = not reached; p < 0.0001; Figure 6A), and significantly poorer survival (OS = 9 months, 95% CI: 5–9) compared to patients with high expression of protein and gene signatures (median OS = not reached; p < 0.0001; Figure 6B).
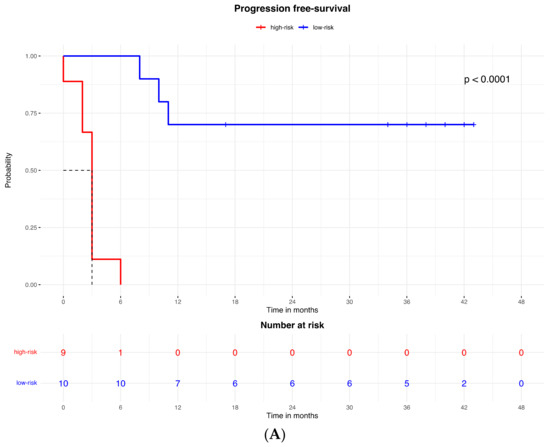
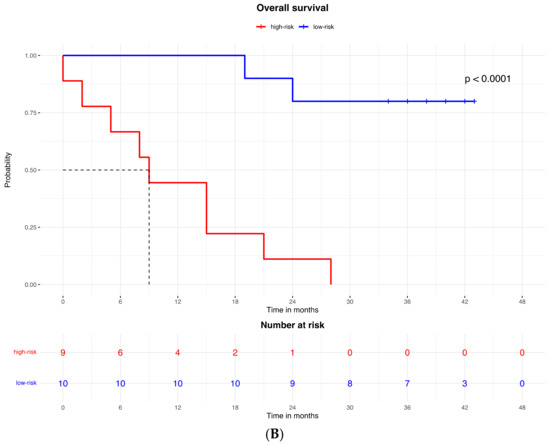
Figure 6.
Kaplan–Meier curves for (A) progression-free survival and (B) overall survival according to the combined proteomic and transcriptomic signature expression.
3. Materials and Methods
3.1. Patients
A retrospective study was carried out at Istituto Nazionale Tumori—IRCCS—Fondazione “G. Pascale”, Naples, Italy. The study was approved by the Ethics Committee of Istituto Nazionale Tumori—IRCCS—Fondazione “G. Pascale”, Naples, Italy, protocol number 32/22 oss. The study was performed in accordance with the revised version of the Declaration of Helsinki (52nd WMA General Assembly, Edinburgh, Scotland, October 2000).
Consecutive adult patients with histologically confirmed metastatic melanoma (stage IV, M category 1A–C, according to the American Joint Committee on Cancer AJCC 7th Edition) treated with an anti-PD-1 agent (either nivolumab or pembrolizumab) in the first line setting between August 2017 and March 2018, were included in the analysis. All patients provided their written informed consent to treatment and publication of anonymous data.
3.2. Methods
3.2.1. Survival Outcomes Measures
RECIST 1.1 criteria were used to radiologically evaluate the tumor response as complete response (CR), partial response (PR), stable disease (SD) or progressive disease (PD). According to clinical benefit, patients were considered responders if they obtained CR, PR or SD > 1 year after anti-PD-1 treatment or non-responders if they had SD ≤ 1 year or PD. The following parameters were recorded and considered in the analysis for this study: progression-free survival (PFS)—calculated from the time of the first dose of anti-PD-1 agent to radiological progression, death or lost–to–follow–up, whichever occurred first; OS calculated from the time of the first dose of anti-PD1 agent to death or lost–to–follow–up, whichever occurred first.
3.2.2. Transcriptomic and Proteomic Analysis
Metastatic tumor tissue samples were collected at the baseline, before the initiation of anti-PD-1 therapy, formalin-fixed and embedded in paraffin (FFPE). Consecutive tissue sample sections were used for proteomic and transcriptomic analyses; by this method, similar cells were present in the sections used for the two analyses.
Whole proteome profiling was obtained with Biognosys’ TrueDiscovery™ platform using advanced data-independent acquisition liquid chromatography–mass spectrometry (LC-MS) workflow adapted from Bruderer et al. [9]. A deep spectral library was generated, and proteins were quantified using the Spectronaut™ v17 software (Biognosys AG, Schlieren, Switzerland).
RNA was extracted from the same tumor samples using QIAmp RNA FFPE Tissue Kit (Qiagen Sciences, Germantown, MD, USA). Purified RNA was used for hybridization and underwent gene profiling analysis on NanoString nCounter through the IO 360 panel (PanCancer IO 360™ Panel, NanoString, Seattle, WA, USA), characterized by human genes associated with immune activation, inflammation and control of the cell cycle. Gene data were normalized using nSolver Version 4.0 Software; NanoString. Counts were normalized to External RNA Controls Consortium technical controls and 30 housekeeping genes. Raw data generated in this study have been deposited in Zenodo: https://doi.org/10.5281/zenodo.11636595, accessed on 1 June 2024.
3.2.3. Statistical Analysis
Continuous variables were reported as either the means and standard deviation or median and interquartile ranges (IQRs) according to their distribution, as assessed by the Shapiro–Wilk normality test. Categorical variables were reported as percentages. Differences in characteristics of patients between the groups of responder and non-responder patients were tested by t-test or Wilcoxon test (according to their distribution) and Pearson’s chi–squared test or Fisher’s exact test for continuous and categorical variables, respectively. To measure the linear association between continuous variables, the Pearson correlation coefficient was used if variables had a normal distribution, otherwise Spearman’s correlation coefficient was calculated.
To identify the proteins and mRNA gene signatures associated with the patient’s response groups, the discriminant analysis for sparse data performed via partial least squares procedure was performed. The sparse variant of Partial Least Squares Discriminant Analysis (PLS-DA) enables the selection of the most predictive or discriminative features in the data to classify the samples [10].
The identified signature scores were used as synthetic risk indices, and to define the subgroups of low and high risk, a Lasso regression (Least Absolute Shrinkage and Selection Operator) was conducted through cross-validation to determine the optimal cut-point, minimizing the risk of overfitting.
To assess the prognosis of patients according to groups of low and high risk, we used PFS and OS as outcomes. The differences in prognosis between the low-risk group and high-risk group were tested by log–rank test and represented by Kaplan–Meier curves. Median follow-up was estimated by the inverse Kaplan–Meier approach. Statistical tests with p-values < 0.05 were considered statistically significant. All the statistical analyses were performed with the R Studio Statistical software, version 4.1.3.
4. Discussion
Our group has widely investigated possible response markers that could guide therapeutic choice in patients with advanced melanoma [11,12,13]. The experience in the methods used in this area of research was applied to this retrospective study that identified a combined protein and gene signature associated with better response to ICI immunotherapy of patients with metastatic melanoma in terms of PFS and OS. The signature discriminates a gene pattern associated with the risk of progression and is related to the expression of genes involved in inflammation and tumor-promoting pathways. So, patients with a high signature expression have higher expression of pro-tumorigenic genes but have a better prognosis than non-responders after immunotherapy. Indeed, checkpoint inhibition seems to have a better efficacy when inflammation and tumor-promoting pathways are excessively represented. Indeed, proteins in the signature identified by Trilla-Fuertes et al. [8] are related to the immune status of several tumors.
Data from the OpACIN-neo trial have previously identified a gene IFN-γ signature predictive for favorable pathologic response and better outcomes in patients with stage III melanoma treated with ICIs [6,14]. In this case, the signature discriminates a subpopulation of patients with pre-activated immunity and better outcomes. The authors demonstrated that a combination of the signature with TMB increased predictivity. A Tumor inflammation signature (TIS) was identified for clinical response in 58 metastatic cancer patients treated with anti-PD-1, and the TIS score was characterized from the expression of 16 genes that were significantly associated with a response to anti-PD-1 treatment (OR = 2.64, 95% CI [1.4–6.0], p = 0.008) and with overall survival (HR = 0.37, 95% CI [0.18–0.76], p = 0.005 [15]. In another retrospective study there was evaluation of a protein signature from 69 melanoma lymph node metastases, in which seven proteins were significantly associated with patient survival [16]. Our study combined two different signatures and obtained a good correlation with prognosis in response to immunotherapy, with better predictivity than with RNA evaluation alone. The IFN-γ signature is composed of 10 genes (IFN-γ, CCR5, CXCL11, IDO1, PRF1, GZMA, HLA-DRA, CXCL10, CXCL9 and STAT1) that play a role in the interplay of tumor cells with the tumor microenvironment and local immune response. It selects patients with a preactivated immune system [14].
The signature presented in our article includes proteins and RNAs related to the main tumor-promoting molecular pathways, and we suggest that it selects patients with a high expression of tumor-promoting mechanisms targeted by ICIs. Indeed, the Kaplan–Meier curves for PFS and OS of our patients receiving immunotherapy showed a significant difference between the group with low protein or gene signature, which had a poorer prognosis, and that with high protein or gene signature expression, respectively. Additionally, we observed a very poor prognosis in all patients with high expression of both signatures.
Combining protein and RNA signature evaluation, we observed that the STAT2 protein was less expressed in responder patients than in non-responders, while STAT2 RNA was not significantly different in responders than in non-responders. Additionally, although FADD RNA was more expressed in non-responders, protein expression was not different in the two groups of response. We can speculate that post-translational mechanisms may impact the maturation of RNA into protein in the metastatic tissue of responder patients, resulting in the modulation of tumor resistance pathways involving FADD and STAT2 [15,17]. FADD is a protein that interacts with the death domain of Fas and initiates apoptosis [18]. Fas, FADD and caspase 8 form a death-inducing signaling complex, triggering apoptosis through caspase 8 activation, which initiates the caspase cascade [10,11,12,13,14,15,16,17,18,19,20,21]. STAT2 is a mediator in the signaling pathway of type I interferons (IFN-α and IFN-β) that is involved in immune reactions regulating tumor cells’ capability to escape, survive and progress [22]. Following type I IFN binding to cell surface receptors, Jak kinases (TYK2 and JAK1) are activated, leading to tyrosine phosphorylation of STAT1 and STAT2. The phosphorylated STATs dimerize and associate with IRF9/ISGF3G to form a complex termed ISGF3 transcription factor that enters the nucleus. ISGF3 binds to the IFN-stimulated response element (ISRE) to activate the transcription of interferon-stimulated genes, which drives the cell to an antiviral state [23]. The monocentric retrospective nature and sample size are limitations of this study.
In conclusion, we propose a combined proteomic and transcriptomic signature, including genes involved in pro-tumorigenic pathways, that identifies patients with reduced probability of response to immunotherapy with ICIs for metastatic melanoma.
Supplementary Materials
The following supporting information can be downloaded at: https://www.mdpi.com/article/10.3390/ijms25179345/s1.
Author Contributions
Study conception and design: D.M. and P.A.A.; collection and interpretation of data: D.M., P.A.A., K.B. and S.W.; statistical analysis: D.M. and M.F.; manuscript drafting: D.M., F.S., B.A.F. and P.A.A.; manuscript editing D.M., M.F., A.W., J.V., M.B., A.S., M.M., R.D.F., G.F., V.V., K.B., P.C., A.C., S.W. and P.A.A.; approval to submit: D.M., M.F., A.W., J.V., M.B., A.S., M.M., R.D.F., G.F., V.V., K.B., P.C., F.S., B.A.F., A.C., S.W. and P.A.A. All authors have read and agreed to the published version of the manuscript.
Funding
This study received a grant from the Italian Ministry of Health (IT-MOH).
Institutional Review Board Statement
All procedures performed were in accordance with the 1964 Helsinki Declaration and its later amendments. The present study was notified to the Ethics Committee of the Instituto Nazionale Tumori—IRCCS—Fondazione Pascale, Napoli, Italy [protocol n. 32/22 oss]. All patients released consent to participate.
Informed Consent Statement
All patients released consent to the publication of anonymous data.
Data Availability Statement
The data presented in this study are openly available in Zenodo, at https://doi.org/10.5281/zenodo.11636595 accessed on 1 June 2024.
Acknowledgments
Editorial assistance was provided by Aashni Shah and Laura Brogelli (Polistudium, Milan, Italy).
Conflicts of Interest
The authors declare the following competing interests: P.A.A.: Stock and Other Ownership Interests: PrimeVax. Consulting or Advisory Role: Bristol Myers Squibb, Roche/Genentech, Merck Sharp & Dohme, Novartis, Array BioPharma, Merck Serono, Pierre Fabre, Incyte, MedImmune, AstraZeneca, Sun Pharma, Sanofi, Idera, Ultimovacs, Sandoz, Immunocore, 4SC, Alkermes, Italfarmaco, Nektar, Boehringer Ingelheim, Eisai, Regeneron, Daiichi Sankyo, Pfizer, OncoSec, Nouscom, Takis Biotech, Lunaphore Technologies, Seattle Genetics, ITeos Therapeutics, Medicenna, Bio-Al Health, ValoTx. Research Funding: Bristol Myers Squibb (Inst), Roche/Genentech (Inst), Array BioPharma (Inst), Sanofi (Inst), Pfizer (Inst). Travel, Accommodations, Expenses: Merck Sharp & Dohme, Pfizer.
Abbreviations
| CR | complete response |
| FFPE | formalin-fixed and embedded in paraffin |
| ICI | immune checkpoint inhibitor |
| IQR | interquartile ranges |
| MSI | microsatellite instability |
| OS | Overall survival |
| PD | progressive disease |
| PFS | progression-free survival |
| PR | partial response |
| ROC | receiver operating characteristic |
| SD | stable disease |
| TMB | tumor mutational burden |
References
- Robert, C.; Schachter, J.; Long, G.V.; Arance, A.; Grob, J.J.; Mortier, L.; Daud, A.; Carlino, M.S.; McNeil, C.; Lotem, M.; et al. KEYNOTE-006 investigators. Pembrolizumab versus ipilimumab in advanced melanoma. N. Engl. J. Med. 2015, 372, 2521–2532. [Google Scholar] [CrossRef] [PubMed]
- Larkin, J.; Chiarion-Sileni, V.; Gonzalez, R.; Grob, J.J.; Rutkowski, P.; Lao, C.D.; Cowey, C.L.; Schadendorf, D.; Wagstaff, J.; Dummer, R.; et al. Five-year survival with combined nivolumab and ipilimumab in advanced melanoma. N. Engl. J. Med. 2019, 381, 1535–1546. [Google Scholar] [CrossRef] [PubMed]
- Wolchok, J.D.; Chiarion-Sileni, V.; Gonzalez, R.; Grob, J.J.; Rutkowski, P.; Lao, C.D.; Cowey, C.L.; Schadendorf, D.; Wagstaff, J.; Dummer, R.; et al. Long-term outcomes with nivolumab plus ipilimumab or nivolumab alone versus ipilimumab in patients with advanced melanoma. J. Clin. Oncol. 2022, 40, 127–137. [Google Scholar] [CrossRef] [PubMed]
- Sharma, P.; Hu-Lieskovan, S.; Wargo, J.A.; Ribas, A. Primary, adaptive, and acquired resistance to cancer immunotherapy. Cell 2017, 168, 707–723. [Google Scholar] [CrossRef]
- Splendiani, E.; Besharat, Z.M.; Covre, A.; Maio, M.; Di Giacomo, A.M.; Ferretti, E. Immunotherapy in melanoma: Can we predict response to treatment with circulating biomarkers? Pharmacol. Ther. 2024, 256, 108613. [Google Scholar] [CrossRef]
- Rozeman, E.A.; Hoefsmit, E.P.; Reijers, I.L.M.; Saw, R.P.M.; Versluis, J.M.; Krijgsman, O.; Dimitriadis, P.; Sikorska, K.; van de Wiel, B.A.; Eriksson, H.; et al. Survival and biomarker analyses from the OpACIN-neo and OpACIN neoadjuvant immunotherapy trials in stage III melanoma. Nat. Med. 2021, 27, 256–263. [Google Scholar] [CrossRef]
- Addeo, A.; Friedlaender, A.; Banna, G.L.; Weiss, G.J. TMB or not TMB as a biomarker: That is the question. Crit. Rev. Oncol. Hematol. 2021, 163, 103374. [Google Scholar] [CrossRef]
- Trilla-Fuertes, L.; Gámez-Pozo, A.; Prado-Vázquez, G.; López-Vacas, R.; Soriano, V.; Garicano, F.; Lecumberri, M.J.; Rodríguez de la Borbolla, M.; Majem, M.; Pérez-Ruiz, E.; et al. Multi-omics Characterization of Response to PD-1 Inhibitors in Advanced Melanoma. Cancers 2023, 15, 4407. [Google Scholar] [CrossRef] [PubMed] [PubMed Central]
- Bruderer, R.; Bernhardt, O.M.; Gandhi, T.; Xuan, Y.; Sondermann, J.; Schmidt, M.; Gomez-Varela, D.; Reiter, L. Optimization of experimental parameters in data-independent mass spectrometry significantly increases depth and reproducibility of results. Mol. Cell. Proteom. 2017, 16, 2296–2309. [Google Scholar] [CrossRef]
- Lê Cao, K.A.; Boitard, S.; Besse, P. Sparse PLS discriminant analysis, biologically relevant feature selection and graphical displays for multiclass problems. BMC Bioinform. 2011, 12, 253. [Google Scholar] [CrossRef]
- Mallardo, D.; Fordellone, M.; White, A.; Ottaviano, M.; Sparano, F.; Bailey, M.; Facchini, A.B.; Ong, S.; Maiolino, P.; Caracò, C.; et al. CD39 and LDHA affects the prognostic role of NLR in metastatic melanoma patients treated with immunotherapy. J. Transl. Med. 2023, 21, 610. [Google Scholar] [CrossRef] [PubMed]
- Mallardo, D.; Giannarelli, D.; Vitale, M.G.; Galati, D.; Trillò, G.; Esposito, A.; Isgrò, M.A.; D’Angelo, G.; Festino, L.; Vanella, V.; et al. Nivolumab serum concentration in metastatic melanoma patients could be related to outcome and enhanced immune activity, a gene profiling retrospective analysis. J. Immunother. Cancer 2022, 10, e005132. [Google Scholar] [CrossRef]
- Mallardo, D.; Simeone, E.; Vanella, V.; Vitale, M.G.; Palla, M.; Scarpato, L.; Paone, M.; De Cristofaro, T.; Borzillo, V.; Cortellini, A.; et al. Concomitant medication of cetirizine in advanced melanoma could enhance anti-PD-1 efficacy by promoting M1 macrophages polarization. J. Transl. Med. 2022, 20, 436. [Google Scholar] [CrossRef] [PubMed]
- Ayers, M.; Lunceford, J.; Nebozhyn, M.; Murphy, E.; Loboda, A.; Kaufman, D.R.; Albright, A.; Cheng, J.D.; Kang, S.P.; Shankaran, V.; et al. IFN-γ-related mRNA profile predicts clinical response to PD-1 blockade. J. Clin. Investig. 2017, 127, 2930–2940. [Google Scholar] [CrossRef] [PubMed]
- Lee, C.J.; An, H.J.; Cho, E.S.; Kang, H.C.; Lee, J.Y.; Lee, H.S.; Cho, Y.Y. Stat2 stability regulation, an intersection between immunity and carcinogenesis. Exp. Mol. Med. 2020, 52, 1526–1536. [Google Scholar] [CrossRef] [PubMed]
- Hardesty, W.M.; Kelley, M.C.; Mi, D.; Low, R.L.; Caprioli, R.M. Protein signatures for survival and recurrence in metastatic melanoma. J. Proteom. 2011, 74, 1002–1014. [Google Scholar] [CrossRef]
- Marín-Rubio, J.L.; Vela-Martín, L.; Fernández-Piqueras, J.; Villa-Morales, M. FADD in cancer, mechanisms of altered expression and function, and clinical implications. Cancers 2019, 11, 1462. [Google Scholar] [CrossRef]
- Chinnaiyan, A.M.; O’Rourke, K.; Tewari, M.; Dixit, V.M. FADD; a novel death domain-containing protein, interacts with the death domain of Fas and initiates apoptosis. Cell 1995, 81, 505–512. [Google Scholar] [CrossRef]
- Scott, F.L.; Stec, B.; Pop, C.; Dobaczewska, M.K.; Lee, J.J.; Monosov, E.; Robinson, H.; Salvesen, G.S.; Schwarzenbacher, R.; Riedl, S.J. The Fas-FADD death domain complex structure unravels signalling by receptor clustering. Nature 2009, 457, 1019–1022. [Google Scholar] [CrossRef]
- Wang, L.; Yang, J.K.; Kabaleeswaran, V.; Rice, A.J.; Cruz, A.C.; Park, A.Y.; Yin, Q.; Damko, E.; Jang, S.B.; Raunser, S.; et al. The Fas-FADD death domain complex structure reveals the basis of DISC assembly and disease mutations. Nat. Struct. Mol. Biol. 2010, 17, 1324–1329. [Google Scholar] [CrossRef]
- Carrington, P.E.; Sandu, C.; Wei, Y.; Hill, J.M.; Morisawa, G.; Huang, T.; Gavathiotis, E.; Wei, Y.; Werner, M.H. The structure of FADD and its mode of interaction with procaspase-8. Mol. Cell 2006, 22, 599–610. [Google Scholar] [CrossRef] [PubMed]
- Ikeda, H.; Old, L.J.; Schreiber, R.D. The roles of IFN gamma in protection against tumor development and cancer immunoediting. Cytokine Growth Factor Rev. 2002, 13, 95–109. [Google Scholar] [CrossRef] [PubMed]
- Periyasamy, T.; Ming-Wei, L.; Velusamy, S.; Ahamed, A.; Khan, J.M.; Pappuswamy, M.; Viswakethu, V. Functional characterization of Malabar grouper (Epinephelus malabaricus) interferon regulatory factor 9 involved in antiviral response. Int. J. Biol. Macromol. 2024, 266, 131282. [Google Scholar] [CrossRef] [PubMed]


Disclaimer/Publisher’s Note: The statements, opinions and data contained in all publications are solely those of the individual author(s) and contributor(s) and not of MDPI and/or the editor(s). MDPI and/or the editor(s) disclaim responsibility for any injury to people or property resulting from any ideas, methods, instructions or products referred to in the content. |
© 2024 by the authors. Licensee MDPI, Basel, Switzerland. This article is an open access article distributed under the terms and conditions of the Creative Commons Attribution (CC BY) license (https://creativecommons.org/licenses/by/4.0/).