Article

Transcriptomic Insights into Salt Stress Response in Two Pepper Species: The Role of MAPK and Plant Hormone Signaling Pathways

1
Key Laboratory for Quality Regulation of Tropical Horticultural Crops of Hainan Province, School of Breeding and Multiplication (Sanya Institute of Breeding and Multiplication), Center of Nanfan and High-Efficiency Tropical Agriculture, Hainan University, Sanya 572025, China
2
Key Laboratory for Quality Regulation of Tropical Horticultural Crops of Hainan Province, School of Tropical Agriculture and Forestry, Hainan University, Haikou 570228, China
*
Author to whom correspondence should be addressed.
Int. J. Mol. Sci. 2024, 25(17), 9355; https://doi.org/10.3390/ijms25179355
Submission received: 29 July 2024 / Revised: 23 August 2024 / Accepted: 28 August 2024 / Published: 29 August 2024
(This article belongs to the Special Issue Genetic Engineering of Plants for Stress Tolerance)

Abstract

:
Salt stress imposes significant plant limitations, altering their molecular, physiological, and biochemical functions. Pepper, a valuable herbaceous plant species of the Solanaceae family, is particularly susceptible to salt stress. This study aimed to elucidate the physiological and molecular mechanisms that contribute to the development of salt tolerance in two pepper species (Capsicum baccatum (moderate salt tolerant) and Capsicum chinense (salt sensitive)) through a transcriptome and weighted gene co-expression network analysis (WGCNA) approach to provide detailed insights. A continuous increase in malondialdehyde (MDA) and hydrogen peroxide (H2O2) levels in C. chinense and higher activities of catalase (CAT), superoxide dismutase (SOD), and peroxidase (POD) in C. baccatum indicated more tissue damage in C. chinense than in C. baccatum. In transcriptome analysis, we identified 39 DEGs related to salt stress. Meanwhile, KEGG pathway analysis revealed enrichment of MAPK and hormone signaling pathways, with six DEGs each. Through WGCNA, the ME.red module was identified as positively correlated. Moreover, 10 genes, A-ARR (CQW23_24856), CHIb (CQW23_04881), ERF1b (CQW23_08898), PP2C (CQW23_15893), ABI5 (CQW23_29948), P450 (CQW23_16085), Aldedh1 (CQW23_06433), GDA (CQW23_12764), Aldedh2 (CQW23_14182), and Aldedh3 (CQW23_11481), were validated by qRT-PCR. This study provides valuable insights into the genetic mechanisms underlying salt stress tolerance in pepper. It offers potential targets for future breeding efforts to enhance salt stress resilience in this crop.

1. Introduction

Abiotic stresses pose significant limitations on crop yield [1]. These stresses, such as salinity, temperature fluctuations, drought, flooding, and heavy metal, profoundly impact the growth and yield of crops [2,3]. Alarmingly, around 90% of arable lands are susceptible to one or more of these stressors [4], resulting in yield losses of up to 70% in major food crops [5]. Abiotic stress triggers molecular, physiological, and biochemical alterations in plants, leading to changes in morphology and disruptions in plant functions [6,7]. Soil salinity significantly reduces crop yield across various global regions [8]. Currently, cultivated and irrigated lands afflicted by salt constitute about 20–30% of the worldwide soil area, with projections indicating a potential doubling of salinized regions by 2050 [9]. This increase is attributed to high evapotranspiration rates, inadequate rainfall, unsustainable agricultural practices, and ineffective irrigation and drainage methods [10]. Consequently, conventional high-yielding crop varieties often struggle to tolerate these elevated salt concentrations [11].
Salinity triggers complex mechanisms within plants, impacting various physiological, biochemical, and molecular pathways [12]. Initially, it diminishes soil osmotic potential, imposing osmotic stress that reduces root water content and nutrient uptake [13]. Furthermore, salinity stress induces the overproduction of reactive oxygen species (ROS), leading to oxidative damage in cellular components such as the plasma membrane, mitochondria, and chloroplasts [14]. This oxidative stress disrupts protein biosynthesis, ion homeostasis, and photosynthesis while downregulating antioxidant activities within the plant cell [15]. To avoid oxidative stress damage, plants activate antioxidant enzymes like superoxide dismutase (SOD), peroxidase (POD), and catalase (CAT) and accumulate nonenzymatic antioxidant compounds, including primary and secondary metabolites like proline, phenolic acids, carotenoids, or alkaloids [16]. Similarly, ROS initiation during salt stress triggers Mitogen-activated protein (MAP) cascades and hormonal and other metabolic pathways aiding ionic balance and osmotic equilibrium [17]. MAPK responds to osmotic stress by elevating osmolyte synthesis [18]. MAPKs are supposed to maintain ROS balance [19]. Phytohormones, like ABA (abscisic acid), also regulate osmotic stress caused by salinity and ROS-mediated pathways [20]. ABA also influences ion balance, elevating K+ and Ca2+ and hindering Na+ and Cl absorption [21]. It controls Na+/K+ ions and H2O2 concentrations during salt stress [22], activating MAPK via H2O2 from ROS scavenging [23].
Pepper is an important member of the Solanaceae family, with a broad diversity in fruit morphology and flavor [24]. It originated from Central/South America and Mexico and later spread globally to Europe, Asia, and Africa. Its production has increased over the last 20 years from 17 to 36 million tons, and the cultivated area has expanded by about 35% worldwide [25]. It is cultivated in most regions of China, particularly in the east, west, and south, with a share of 7.76% of the total national vegetable output [26]. It is a tropical and subtropical annual crop that requires a warm (18–30 °C) and humid climate for optimal growth and fruit production [27]. Still, it can also be cultivated in temperate climates in greenhouses [28]. Several stresses (biotic and abiotic) significantly affect peppers, which decrease yields and fruit quality [29]. In the previous study, salt stress is considered most relevant for pepper plants and has moderately sensitive, sensitive, or highly susceptible effects [30]. A high salt concentration source that affects plants may be soil or irrigation water [31]. In pepper plants, the dry weight and marketable yield diminish by 46% and 25%, respectively, when rinsed with water at 4.4 dS m−1 [32].
Previous research has delved into salt-related genes and pathways in model plants, overlooking pepper [33]. Pepper is particularly susceptible to salt stress, so it is essential to understand the molecular mechanisms governing its response to this environmental challenge. We examined two pepper species, Capsicum baccatum (moderately sensitive) and Capsicum chinense (sensitive), in response to salt stress. This study aims to compare the physiological responses, identify enriched pathways and DEGs, and identify potential genetic targets. These findings will contribute to a deeper understanding of pepper’s intricate molecular mechanisms underlying salt stress tolerance. It offers potential targets for future breeding efforts to enhance salt stress resilience in this economically important crop species.

2. Results

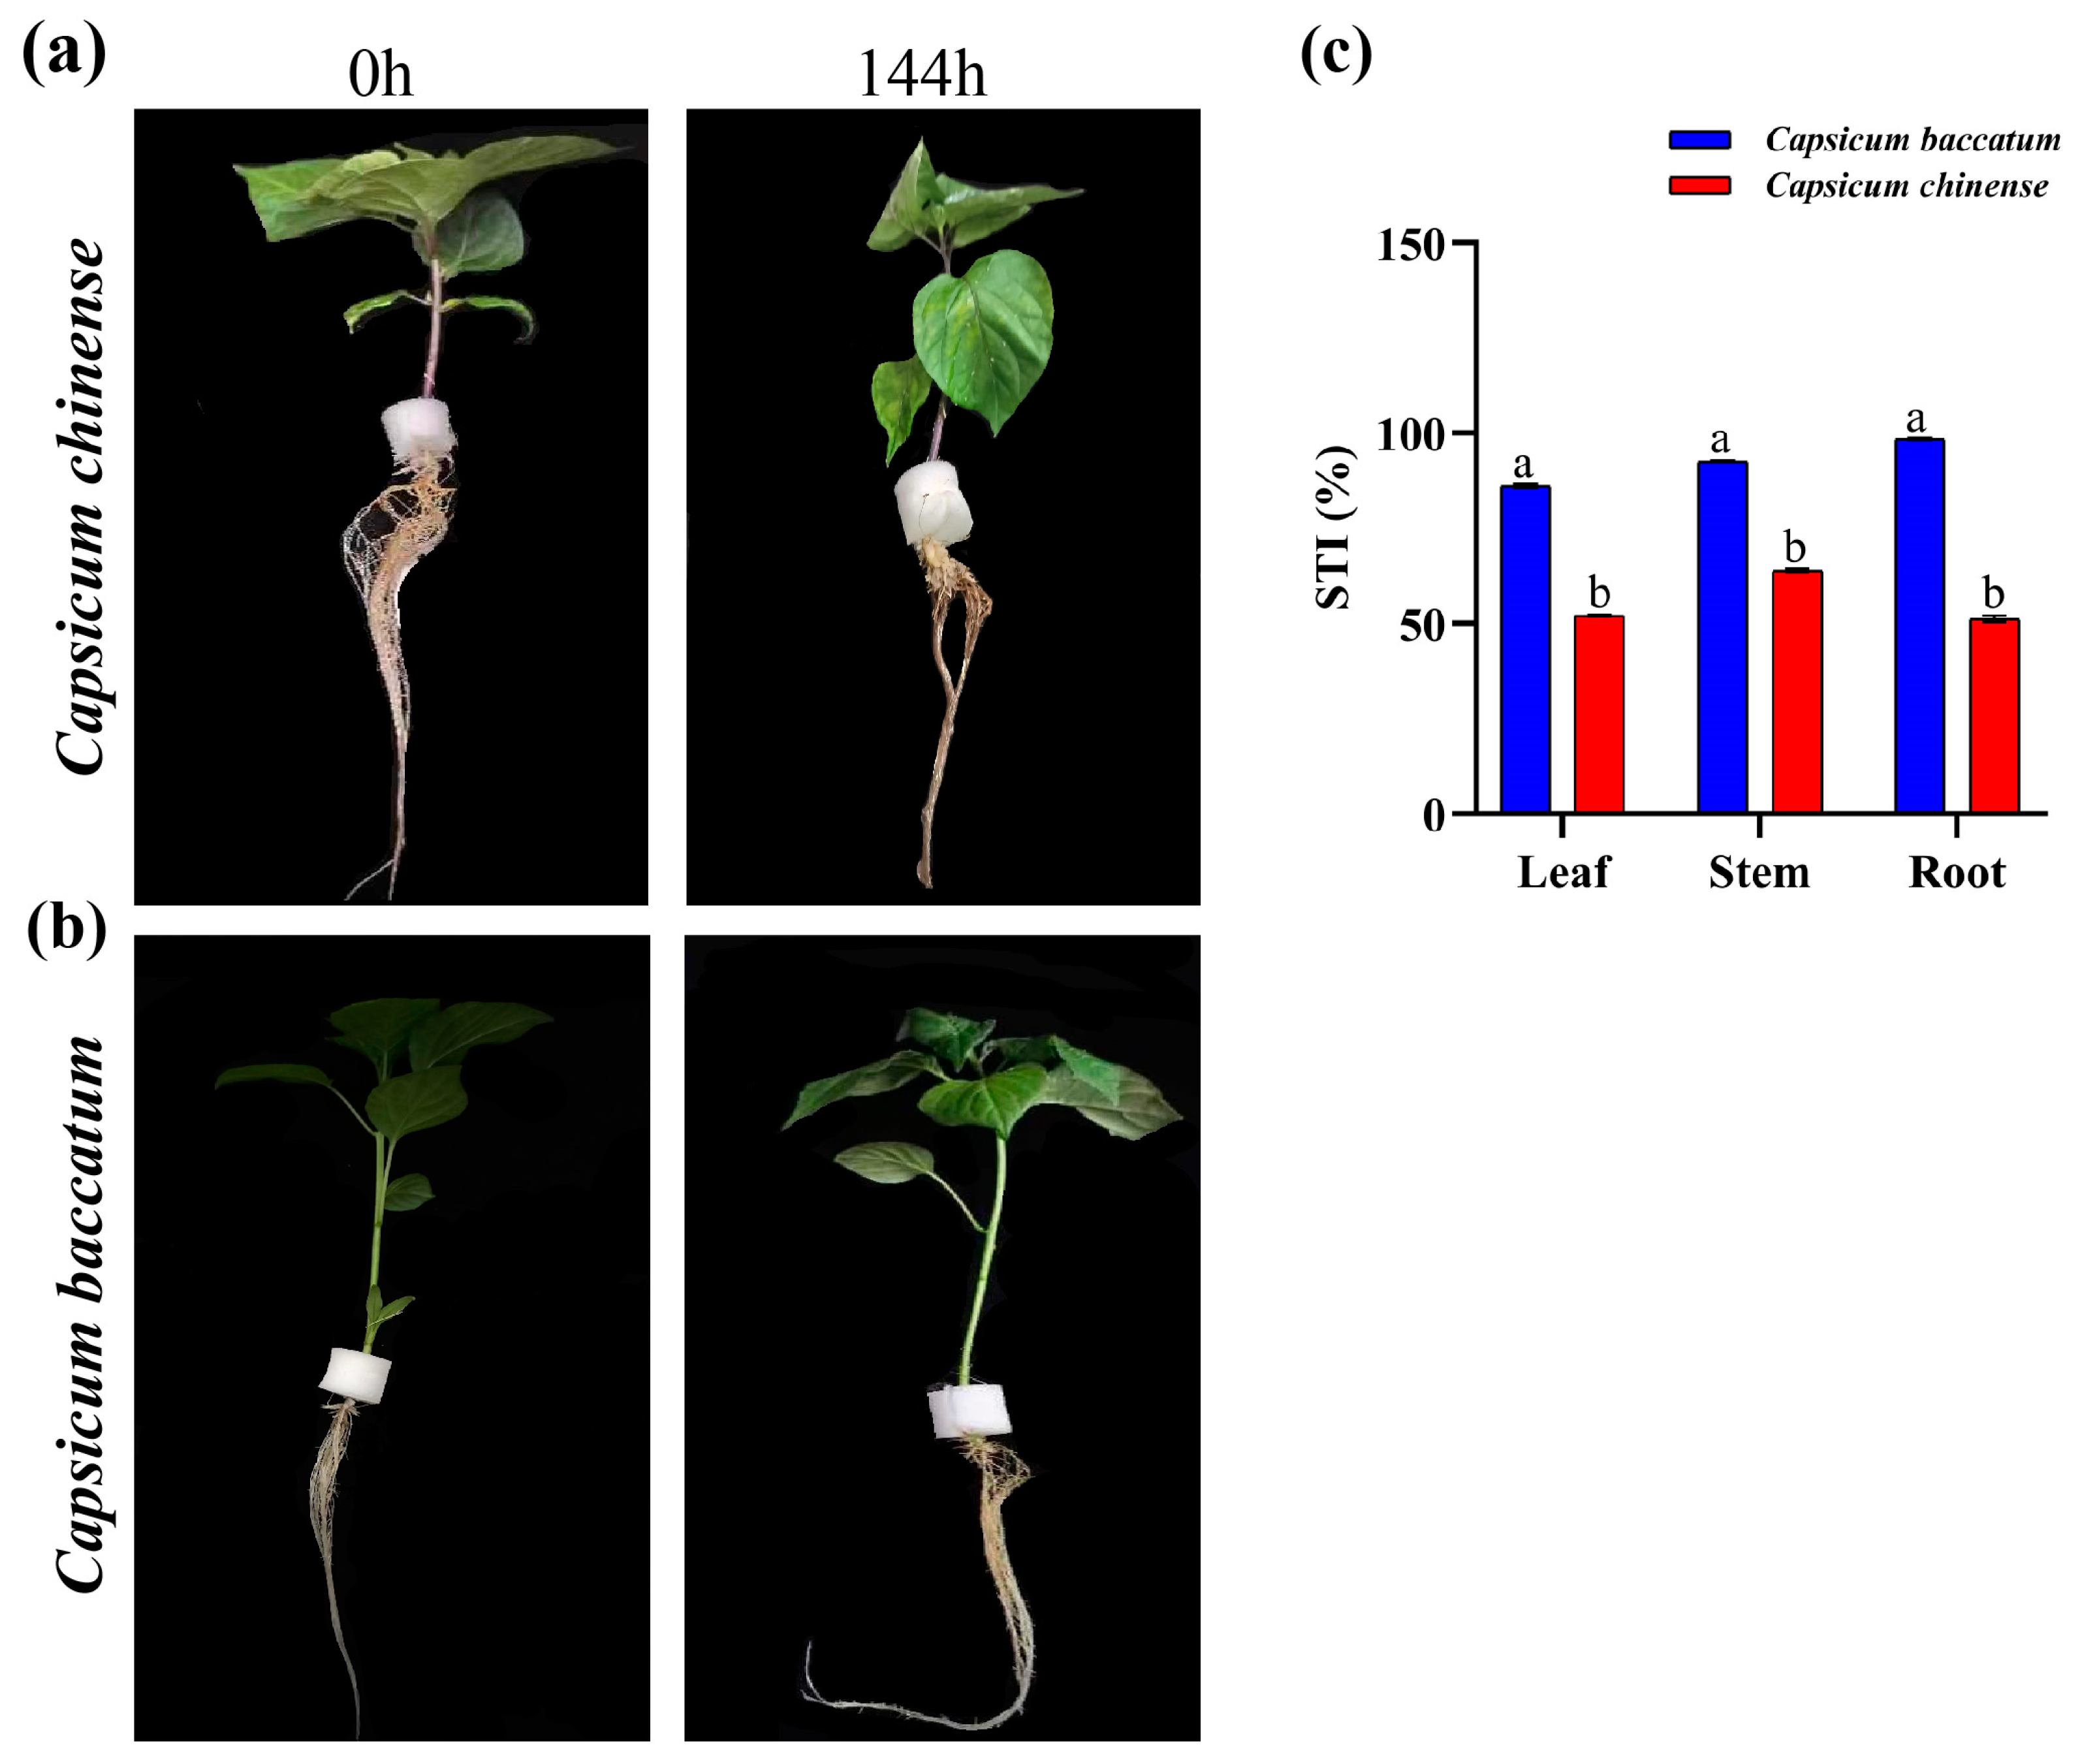
2.1. Physiological and Phenotypical Alterations

Following 24 h of exposure to salt stress, observable alterations began to occur in the C. chinense plants, with the lower leaves exhibiting a gradual yellowing and a decline in turgor pressure compared to the C. baccatum plants, which became more pronounced by the 144 h mark (Figure 1).
Proline levels exhibited a more significant increase in C. chinense compared to C. baccatum at all time points. The highest proline level was observed in C. chinense at 144 h (Figure 2a). In C. chinense, the highest level of SOD was observed at 24 h and 48 h compared to its control (CK; 0 h). However, in C. baccatum, there was an initial decrease in SOD levels at 24 h and 48 h compared to its respective CK. Interestingly, in C. baccatum, the SOD levels peaked at the 144 h time point compared to CK, whereas in C. chinense, a decrease in SOD levels was observed at 144 h when compared to the other time points and CK (Figure 2b). The highest H2O2 level was documented at 144 h in C. chinense in contrast to C. baccatum, which remained consistently higher at all time points and compared to CK. Conversely, the maximum H2O2 activity in C. baccatum was recorded after 24 h of salt stress across all time points and compared to CK (Figure 2c). Similarly, CAT activity peaked after 24 h of stress in C. baccatum and compared to CK, while it displayed a declining trend, particularly pronounced in C. chinense over time and compared to CK (Figure 2d). Nonetheless, the peak level of MDA was documented in C. chinense at 96 h compared to CK, surpassing that of C. baccatum at all time points and CK (Figure 2e). Conversely, POD activity exhibited its highest levels in C. baccatum compared to C. chinense, particularly evident after 48 h of salt stress when compared across all time points and compared to CK (Figure 2f). Furthermore, compared to the CK of each species, it was apparent that total chlorophyll contents, Chl a and Chl b contents, exhibited a more pronounced decrease in C. chinense than in C. baccatum (Figure 2g–i). In contrast, carotenoid levels in C. baccatum showed an increase up to 24 h and 48 h after salt stress, surpassing the levels in C. chinense at these time points, but displayed a more substantial decrease in carotenoids in C. baccatum than in C. chinense at the 144 h mark following salt stress (Figure 2j). Overall, the physiological indicators suggest that C. chinense exhibits a higher sensitivity to salt stress when compared to C. baccatum.

2.2. Stress Tolerance Index Percentage (STI%)

The STI% results showed that the C. baccatum root showed more salt stress tolerance than the stem and roots as compared to the C. chinense root, stem, and leaf (Figure 1c). The STI% showed C. baccatum tolerance against salt stress.

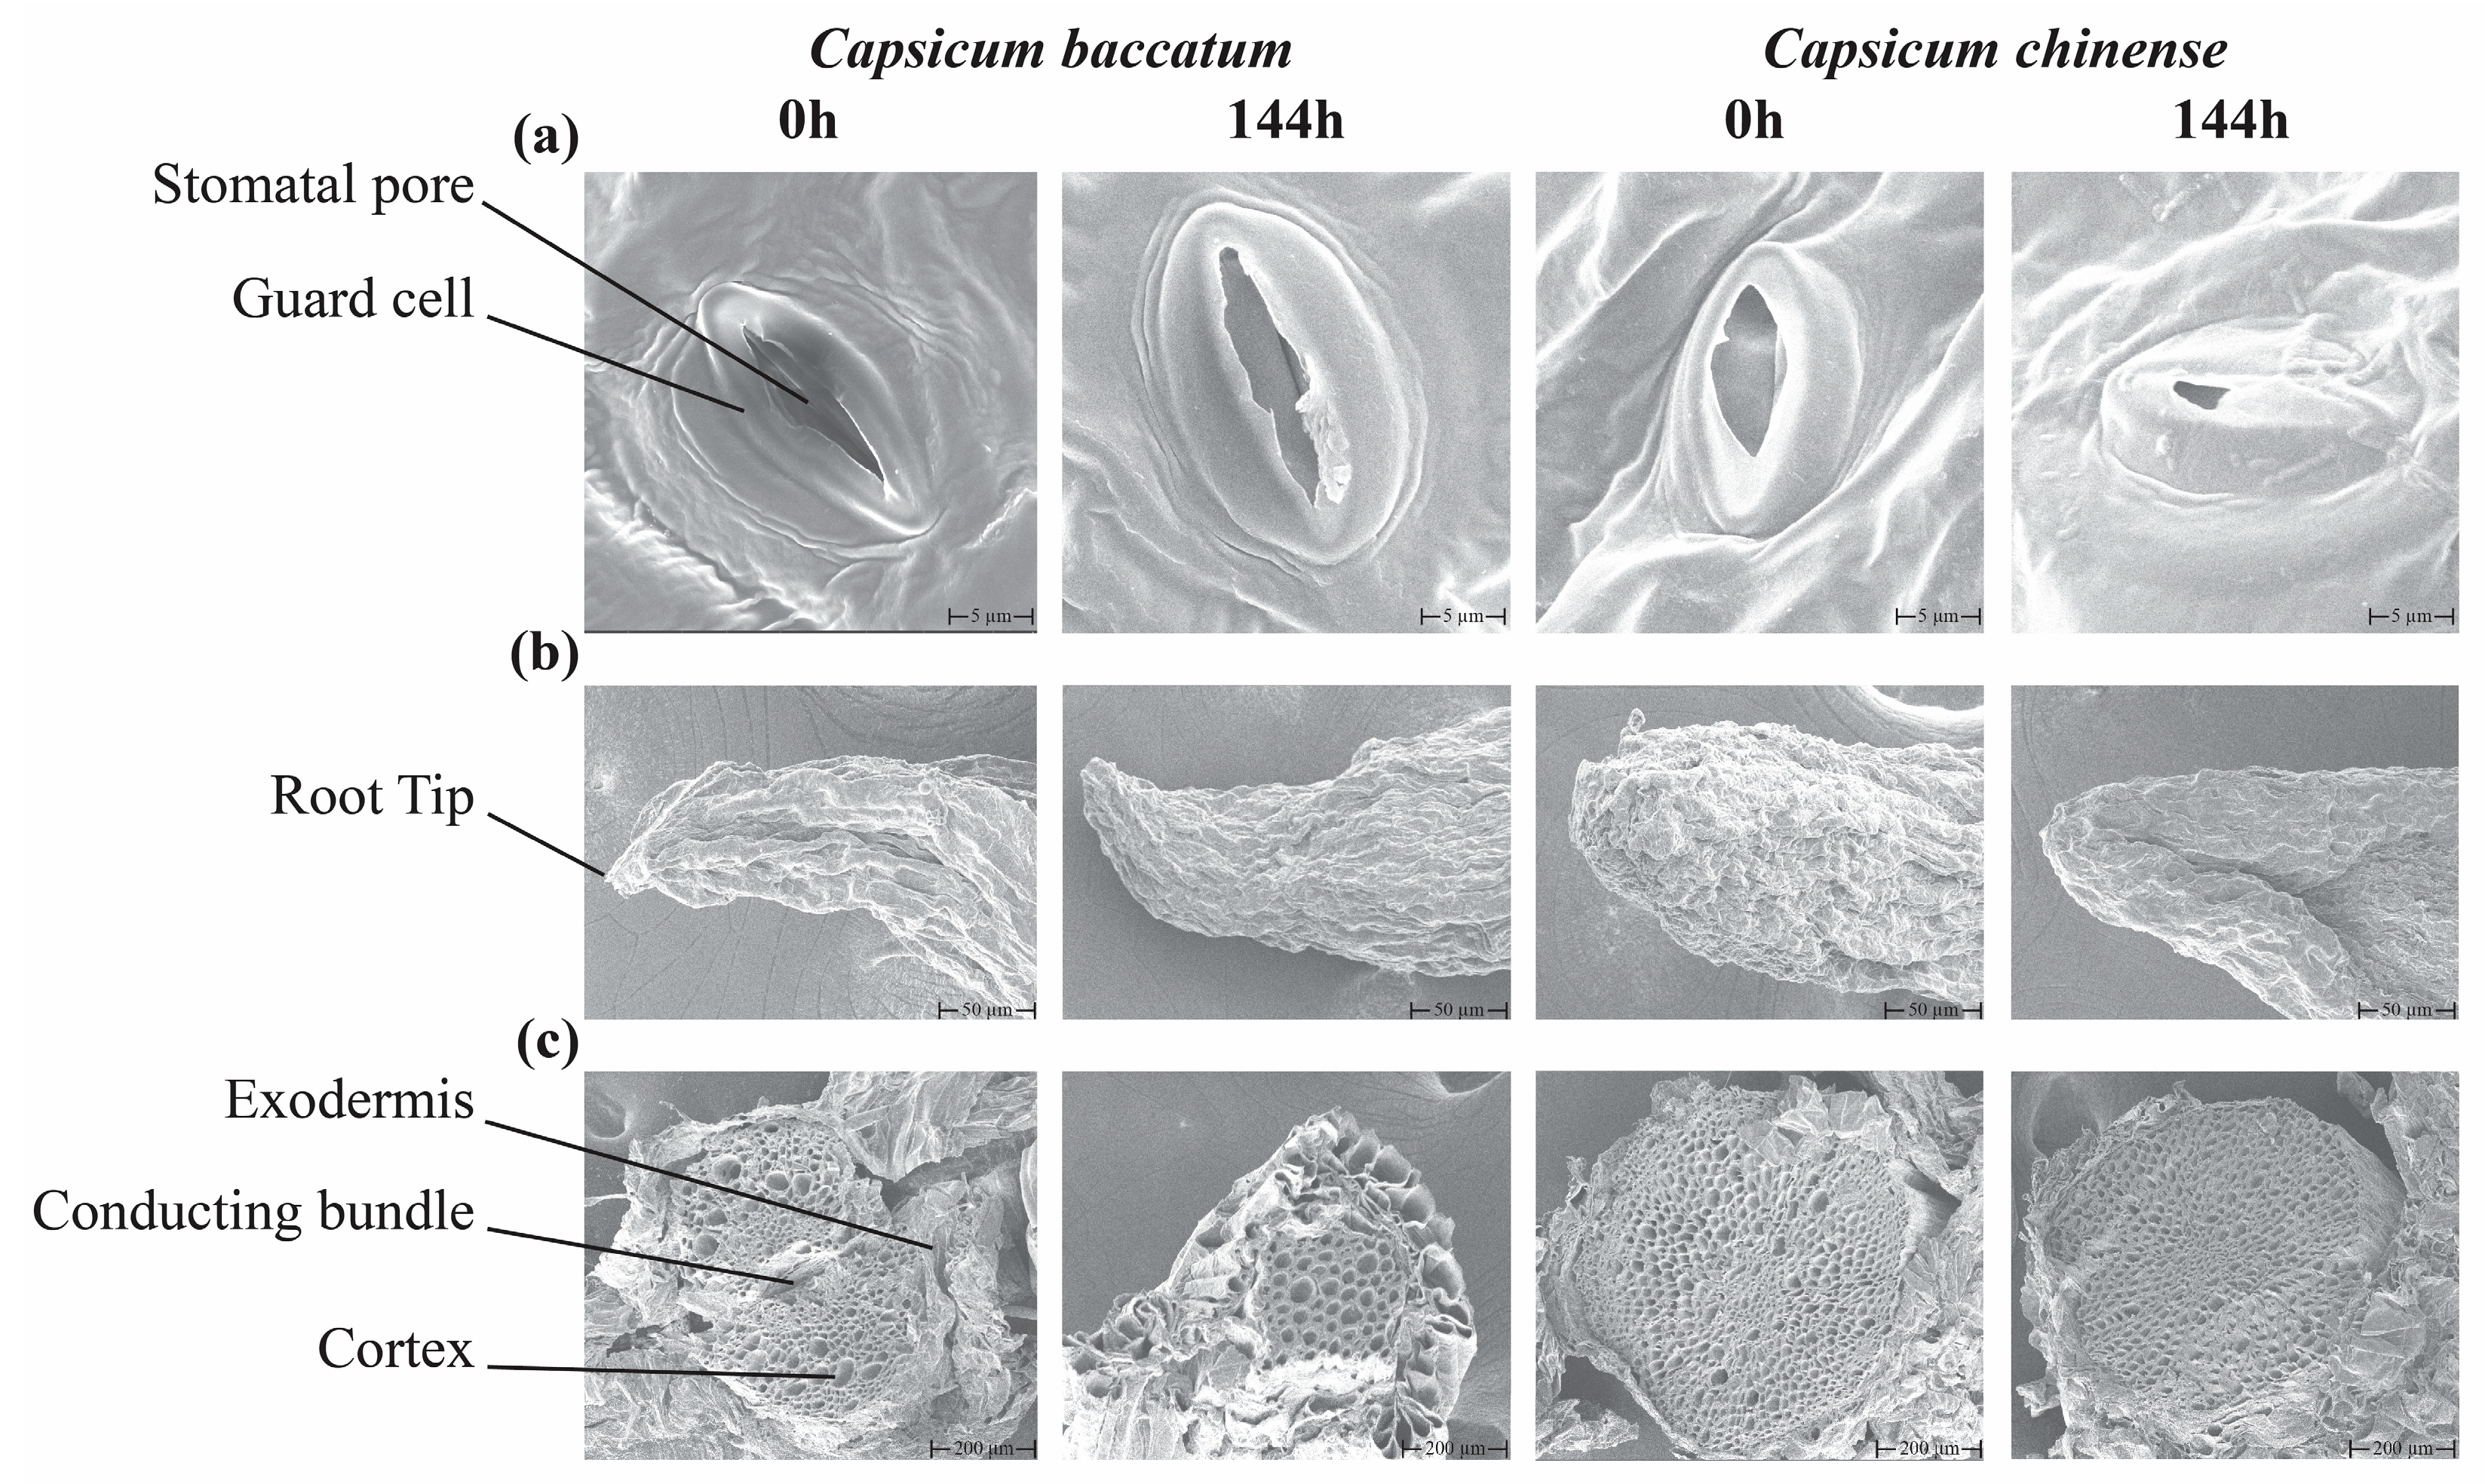
2.3. Microscopic Scanning of Leaf and Root Tissues

We evaluated the leaf stomata, root structure, and cross-section in both species treated with salt stress (Figure 3). SEM results showed that compared to their respective controls, C. chinense salt-treated samples stomata showed more closing as compared to C. baccatum; the root scan and its cross-section analysis also showed weak health due to the change in the root tip appearance, degradation of vascular tissues, and increased cell wall thickening in the cortex region as compared to C. chinense control and C. baccatum control and treated samples (Figure 3a,b). Moreover, a noticeable decline in leaf stomata and cross-section in length, width, pore length, and pore width of C. chinense was recorded compared to its control and C. baccatum control and treatment samples (Supplementary Table S1). These results showed C. chinense sensitivity against salt stress.

2.4. Analysis of RNA Sequencing

Transcriptome sequencing of pepper cultivars C. chinense and C. baccatum yielded valuable and distinct data about their responses under salt stress conditions. The essential RNA-seq characteristics are summarized in Supplementary Table S2. Upon scrutinizing the raw sequencing data, it was determined that C. chinense generated a range of 38–56 million clean reads, while C. baccatum produced 38–45 million clean reads. The data exhibited a consistent overall error rate of 0.03%, with quality scores (Q20 ≤ 95–97% and Q30 ≤ 92–94%) and a GC content ranging from 40% to 43%, as summarized in Supplementary Table S2. Among all the different comparisons, 33,022 genes were detected across and within both species. Moreover, we constructed Venn diagrams based on the control with all-time points within the species and between the species; 675 genes were detected among the controls and all-time points in C. chinense (Figure 4a), 75 in C. baccatum (Figure 4b), and 4866 genes among control groups of both species with all-time points group (Figure 4c), respectively. Moreover, upregulated and downregulated genes were shown among all-time points within and between species (Figure 4d), where maximum upregulated and downregulated genes were detected after 24 h in the salt stress group of both species. Similarly, the heat map of the genes is given in Figure 4e.

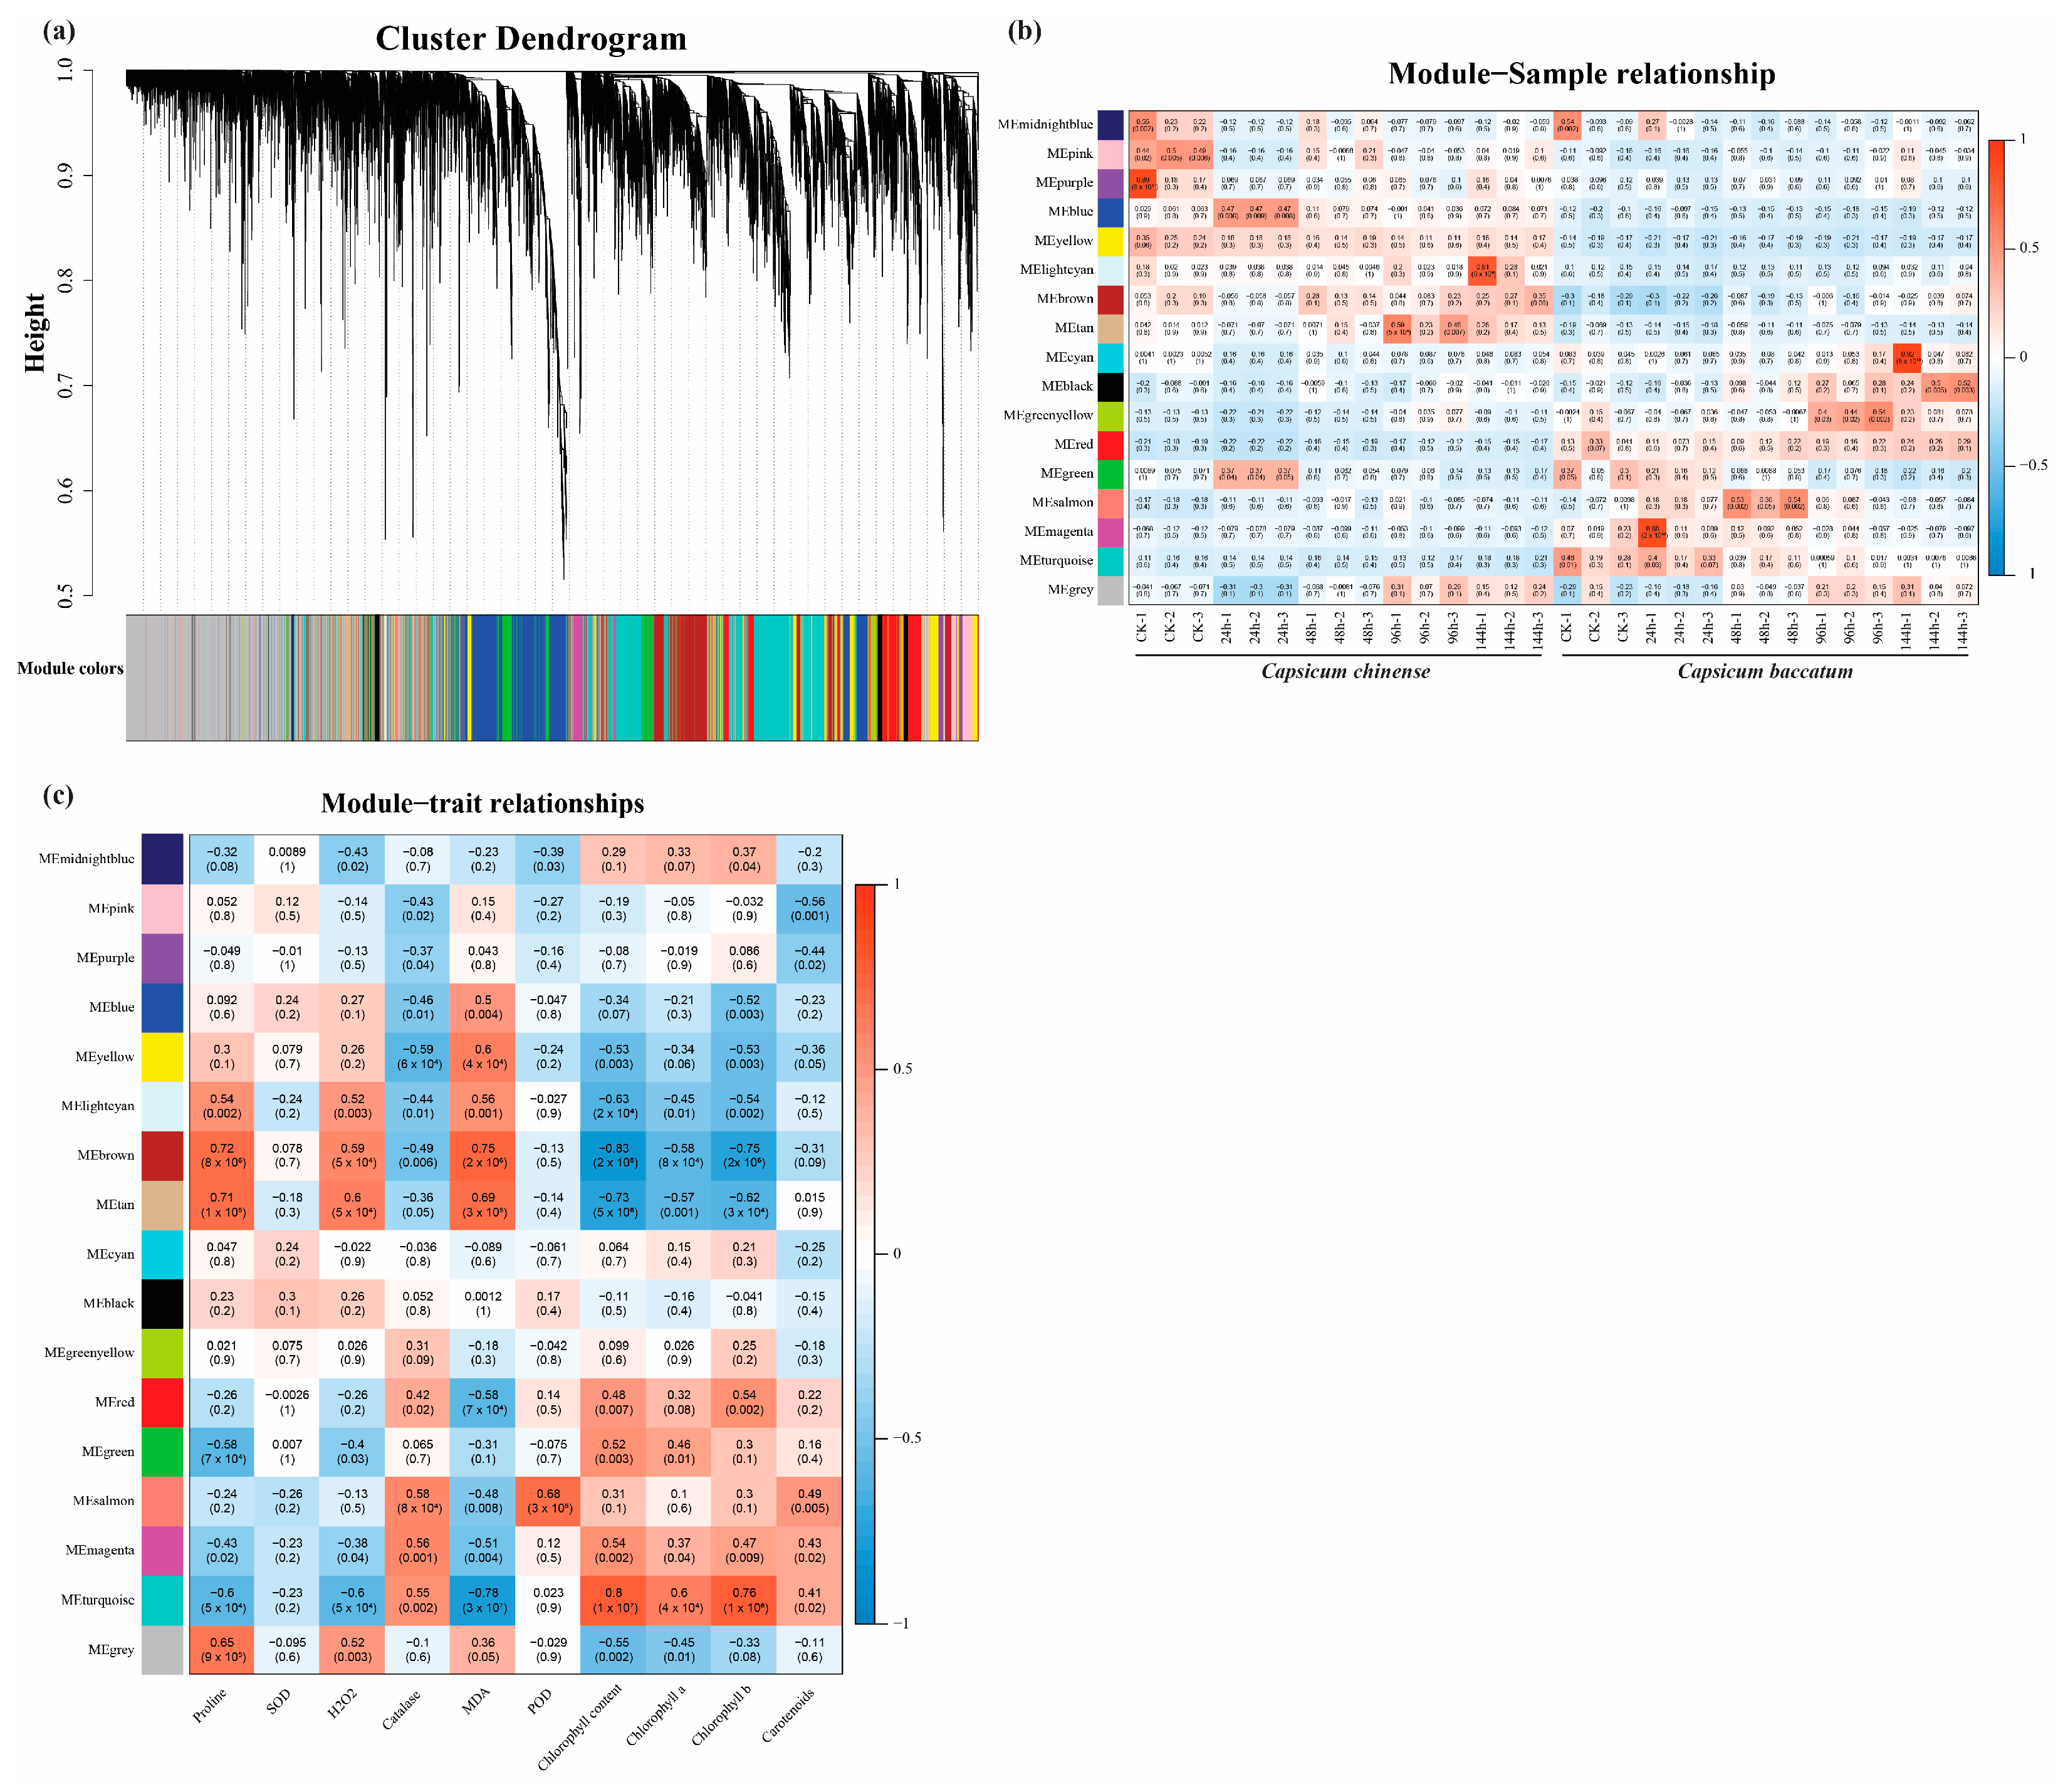
2.5. Identification of the Module Using WGCNA

To evaluate the expression patterns of pepper genes linked to salt stress, we developed a gene co-expression network using the WGCNA method. A comprehensive set of 16,117 genes was classified into 17 co-expression modules, with each module being visually distinguished by a unique shade. These modules were subsequently utilized for further research, as seen in Figure 5a. Significantly, our study revealed the presence of two modules strongly associated with salt resistance, as evidenced by a p-value ≤ 0.05. The ME.red module had a favorable correlation with resistance to salt stress (Figure 5b), including transcription factors like ERF1b2, A-RR9, ABA receptor PYL4/6, P450, pKinase, low kDa HSP, etc. Conversely, the ME.yellow module displayed a favorable association with physicochemical properties (Figure 5c). On initial findings, we identified 1059 genes within the ME.red module, and pathway enrichment analysis of the genes within the ME.red module revealed that the primary enriched pathways were related to plant MAPK and hormone signal transduction.

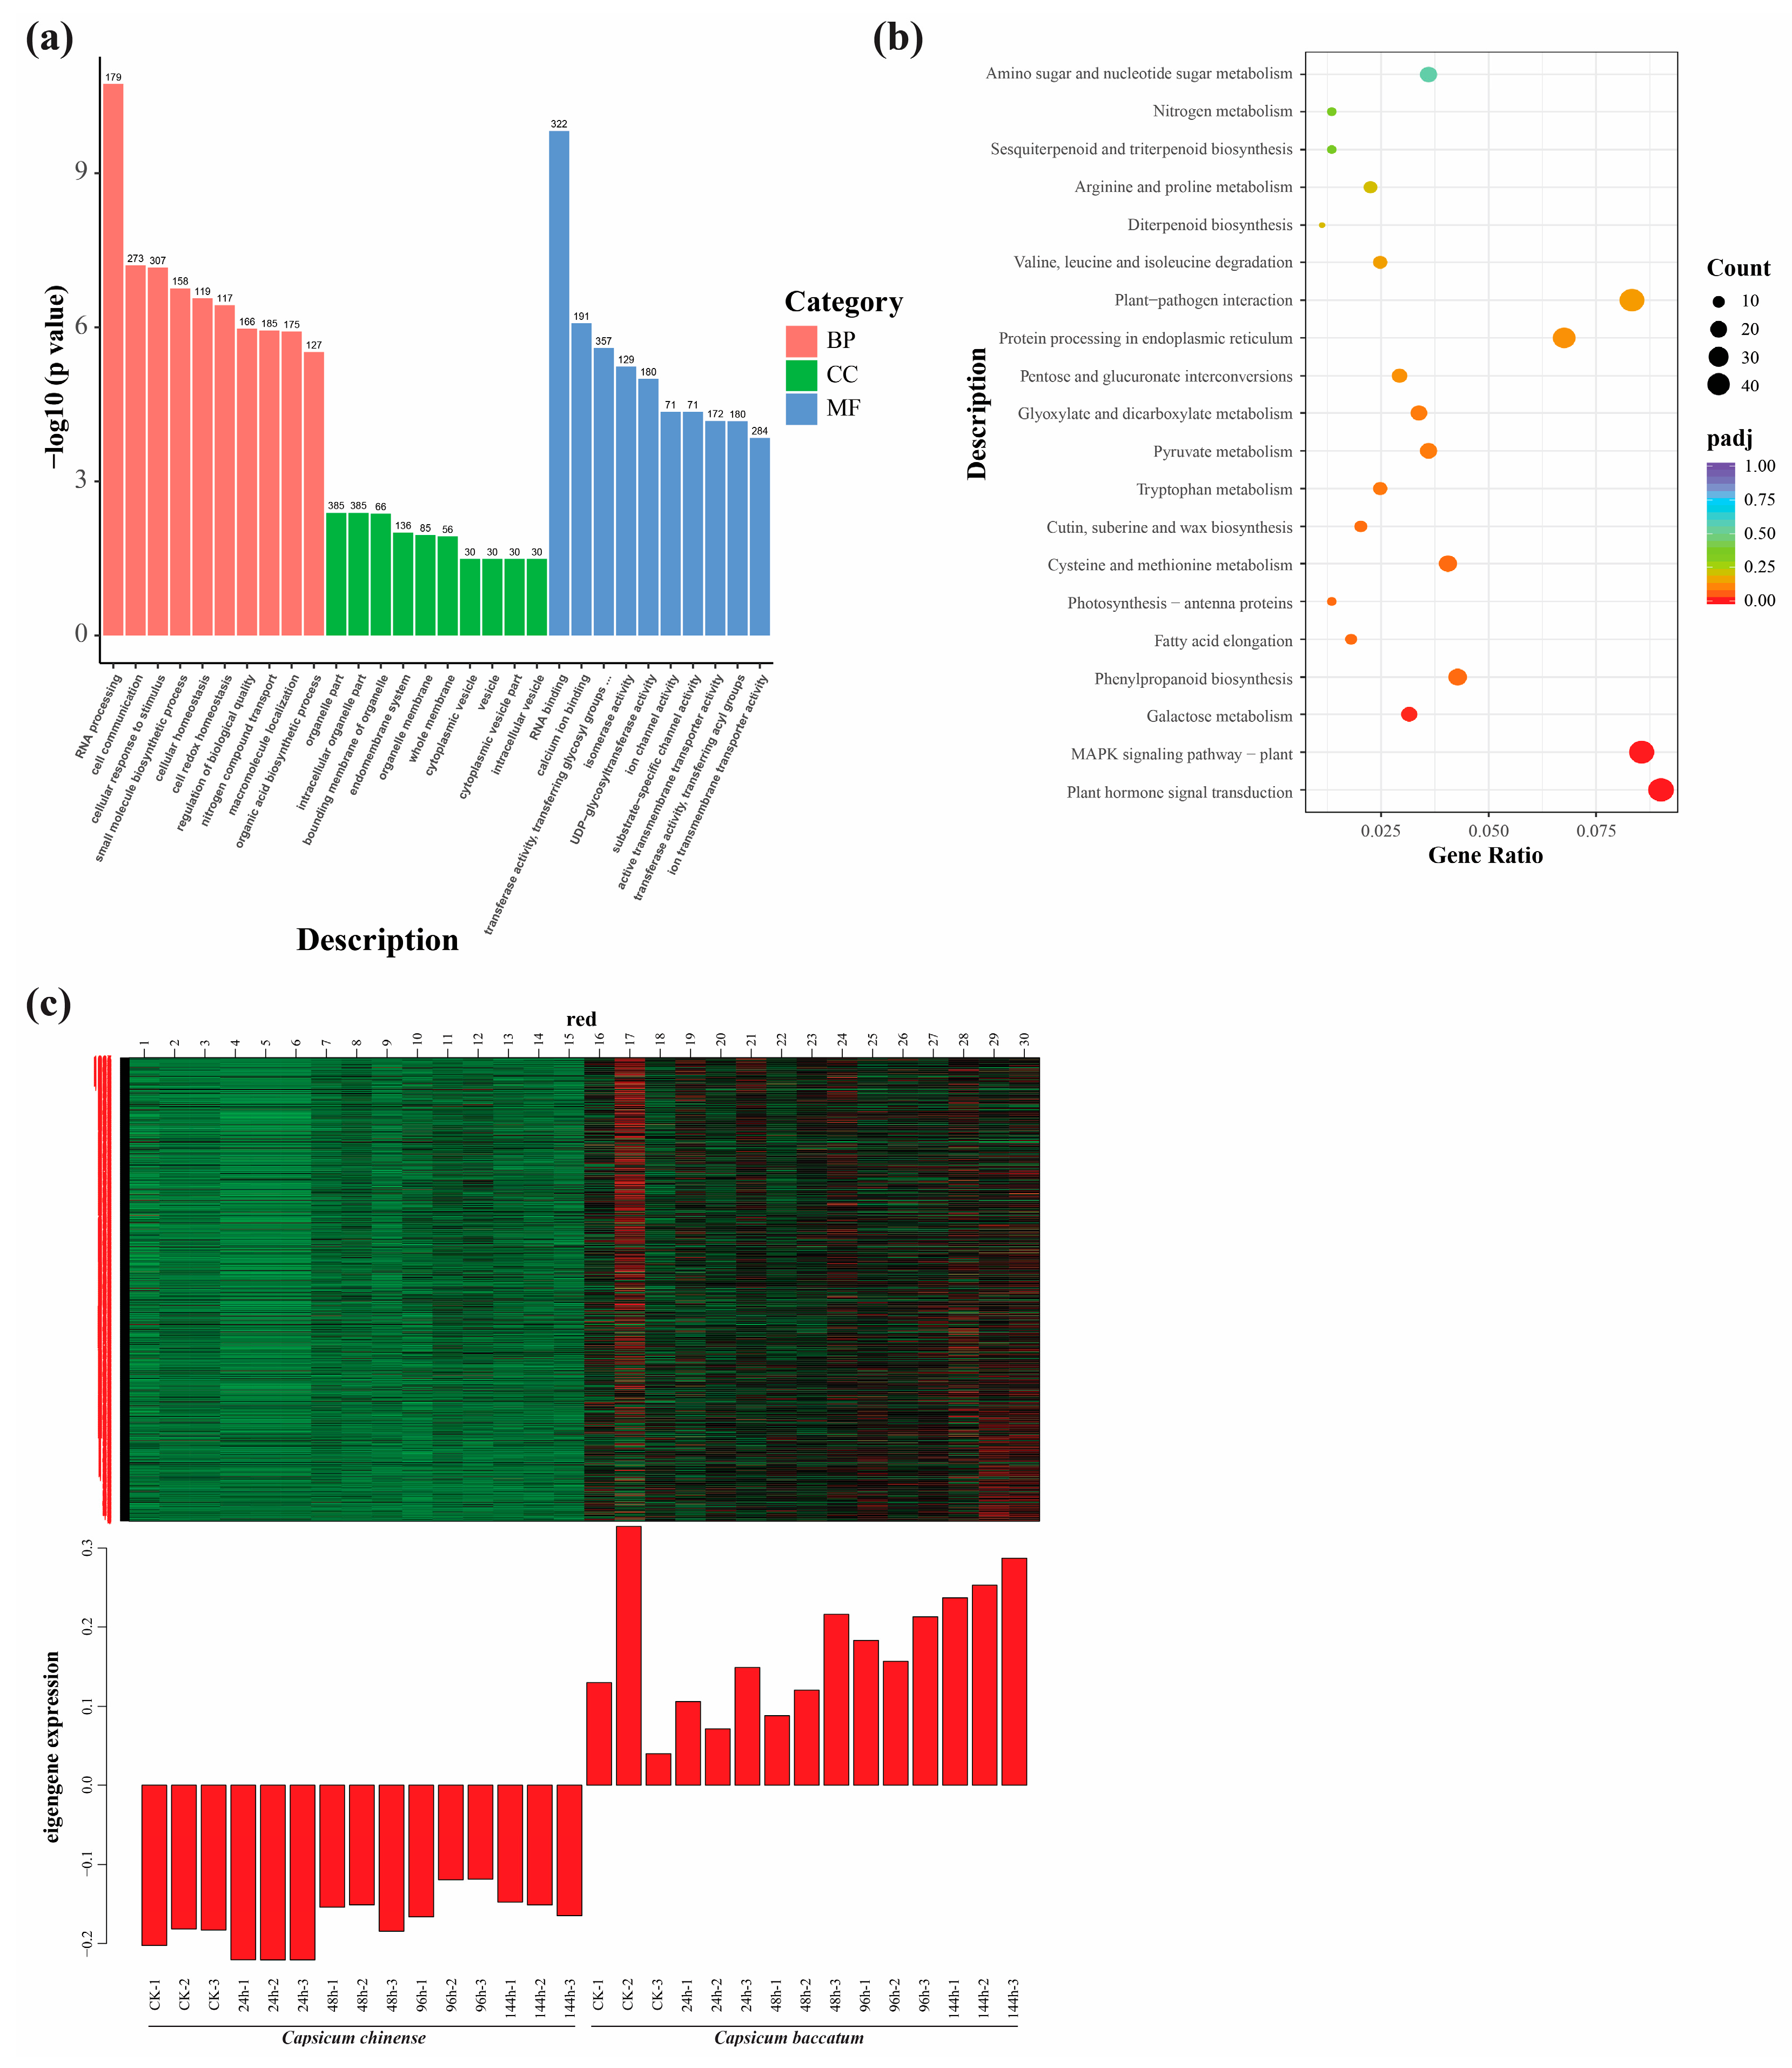
2.6. GO and KEGG Enrichment Analysis

Enrichment analyses like GO and KEGG were applied to find significant pathways under 100 mM salt stress. We employed GO functional enrichment analysis to categorize the functions of the identified DEGs in response to salt stress. For Biological Process (BP), the most prominent processes included RNA processing (GO:0006396), cell communication (GO:0007154), and cellular response to stimulus (GO:0051716) processes, featuring 179, 273, and 307 genes, respectively. Similarly, for Cellular Components (CC), the top three enriched components were the organelle part (GO:0044422), intracellular organelle part (GO:0044446), and bounding membrane of organelle (GO:0098588), with 385, 385, and 66 genes. However, for the Molecular Function (MF), the three most important categories were RNA binding (GO:0003723), calcium ion binding (GO:0005509), and transferase activity, transferring glycosyl groups (GO:0016757) with 322, 191, and 357 genes, respectively (Figure 6a).
KEGG pathway enrichment analysis was performed for both cultivars exposed to salt stress. Among the top 20 pathways, the plants MAPK signaling (cann04016) and plant hormone signal transduction (cann04075) pathways, phenylpropanoid biosynthesis (cann00940), galactose metabolism (cann00052), protein processing in endoplasmic reticulum (cann04141), and cysteine and methionine metabolism (cann00270) pathways were mainly enriched pathways (Figure 6b). Hence, considering the outcomes from the KEGG analysis, the plant MAPK signaling and hormone signal transduction pathways were singled out as the most crucial pathways, with pivotal roles in regulating the salt stress response in pepper. The DEGs of these pathways were also positively associated with the ME.red module in WGCNA. Moreover, the epigene expression heat map of the ME.red module is given below (Figure 6c).

2.7. MAPK Signaling Pathway

This work identified six DEGs highly enriched in the MAPK signaling pathway in pepper. These DEGs are known to have a role in the defensive response and adaptation to various abiotic stimuli, including salt, drought, and cold stress. The dynamic transcriptome analysis showed that ERF1b transcription factor (TF) upregulation in both species interacts with acidic endochitinase CHIb in the defense response of the phytohormone ethylene pathway. However, ERFb showed more expression in C. baccatum than in C. chinense, while acidic CHIb showed more expression in C. chinense, indicating a possible role in the pepper response to salinity (Figure 7). Similarly, in stress adaptation, we found four TFs, where an abscisic acid receptor PYL4 downregulation inhibits two PP2C (protein phosphatase 2C 51 and probable protein phosphatase 2C 24) that interact with the MAPKKK18. However, both PP2C TFs showed upregulation in both species cultivars, but more upregulation was seen in C. chinense than C. baccatum, while MAPKK18 showed more expression in C. baccatum than C. chinense, which shows their probable role in the pepper response to salt stress (Figure 7).

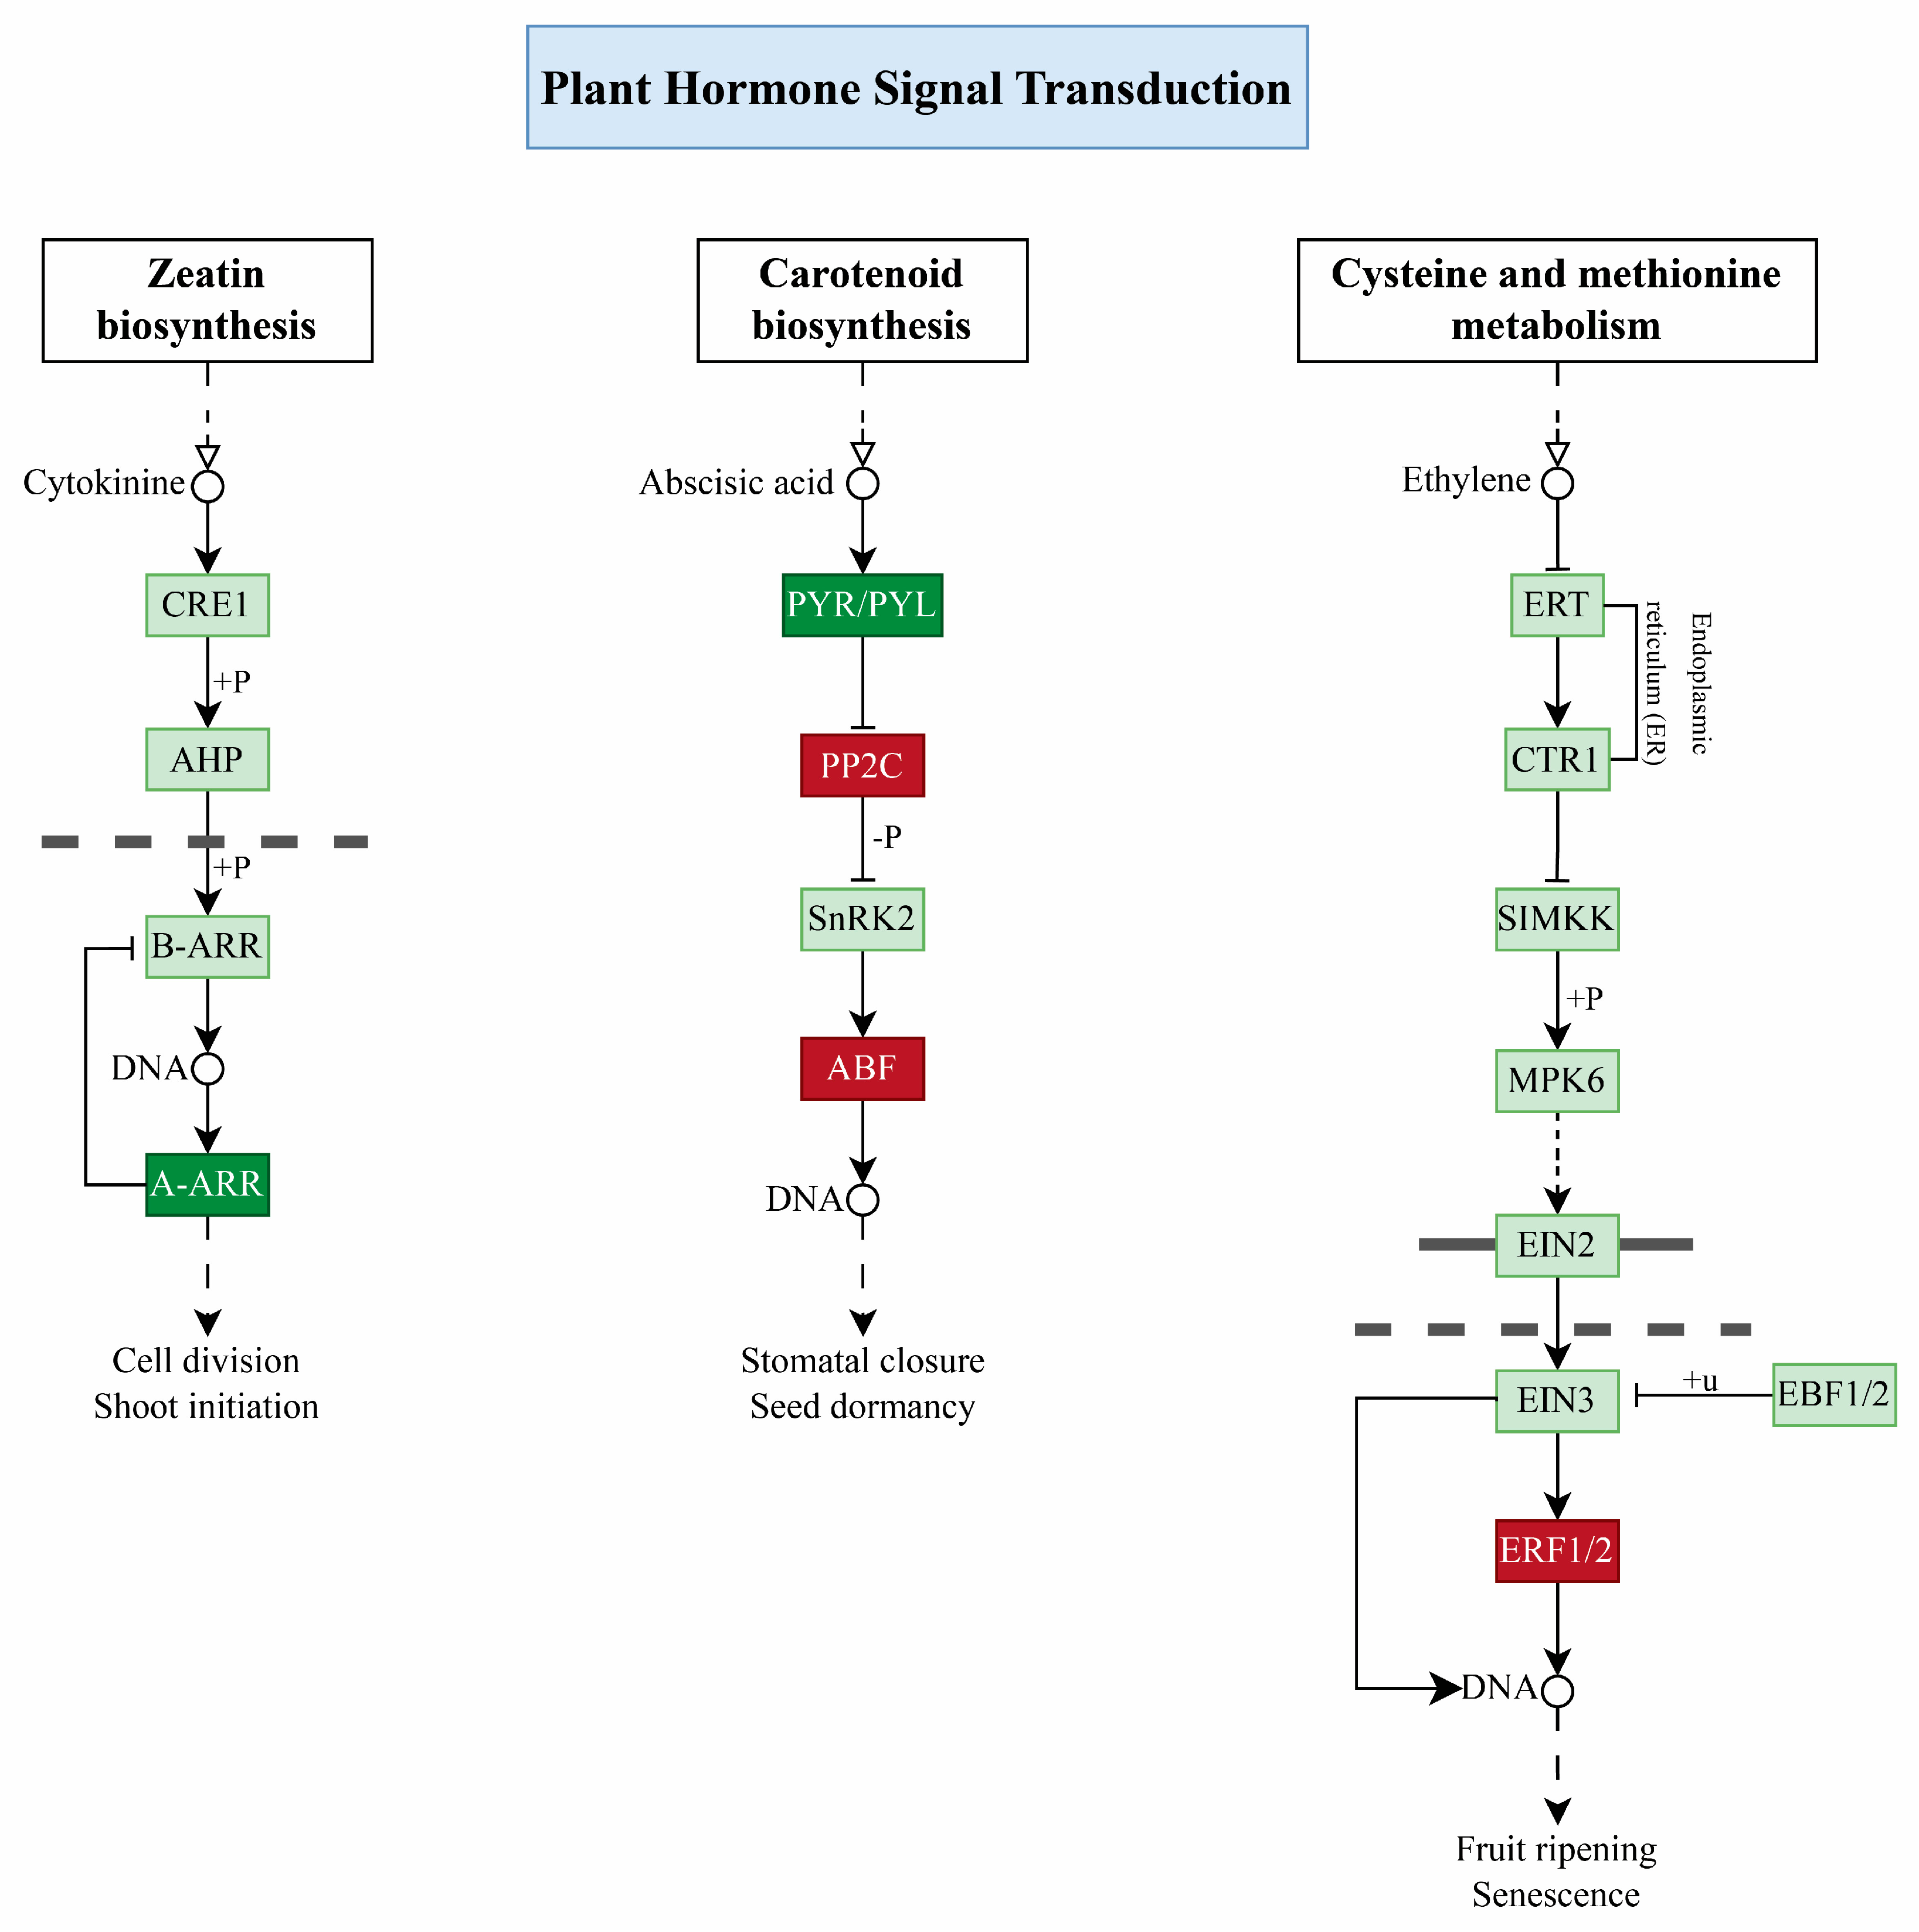
2.8. Plant Hormone Signal Transduction Pathway

Under salt stress, cytokinins (Ck) are involved in cell division and shoot initiation during the zeatin biosynthesis process. In this process, Ck negative regulator A-AAR downregulation irreversibly inhibits B-ARR in C. chinense while it was absent in C. baccatum, which shows it might have a role in sensitivity against salinity. Similarly, in carotenoid synthesis under plant hormonal signal transduction, ABA plays a crucial role in stomatal closure and seed dormancy. In this process, ABA receptor PYL4 downregulation inhibits PP2C (protein phosphatase 2C 51 and probable protein phosphatase 2C 24), which upregulates and interacts with ABF TF, BZIP_1 (Abscisic acid–insensitive 5-like protein 5). Interestingly. ABI5 was found to be downregulated in C. chinense and upregulated in C. baccatum, indicating its possible role in pepper sensitivity against salinity stress (Figure 8). Moreover, in cysteine and methionine metabolism, ethylene, as an important phytohormone, functions as fruit ripening and senescence under stress conditions; in our study, ERF1b was found to be upregulated more in C. baccatum than C. chinense, which predicts it may have a role in pepper response towards salt stress.

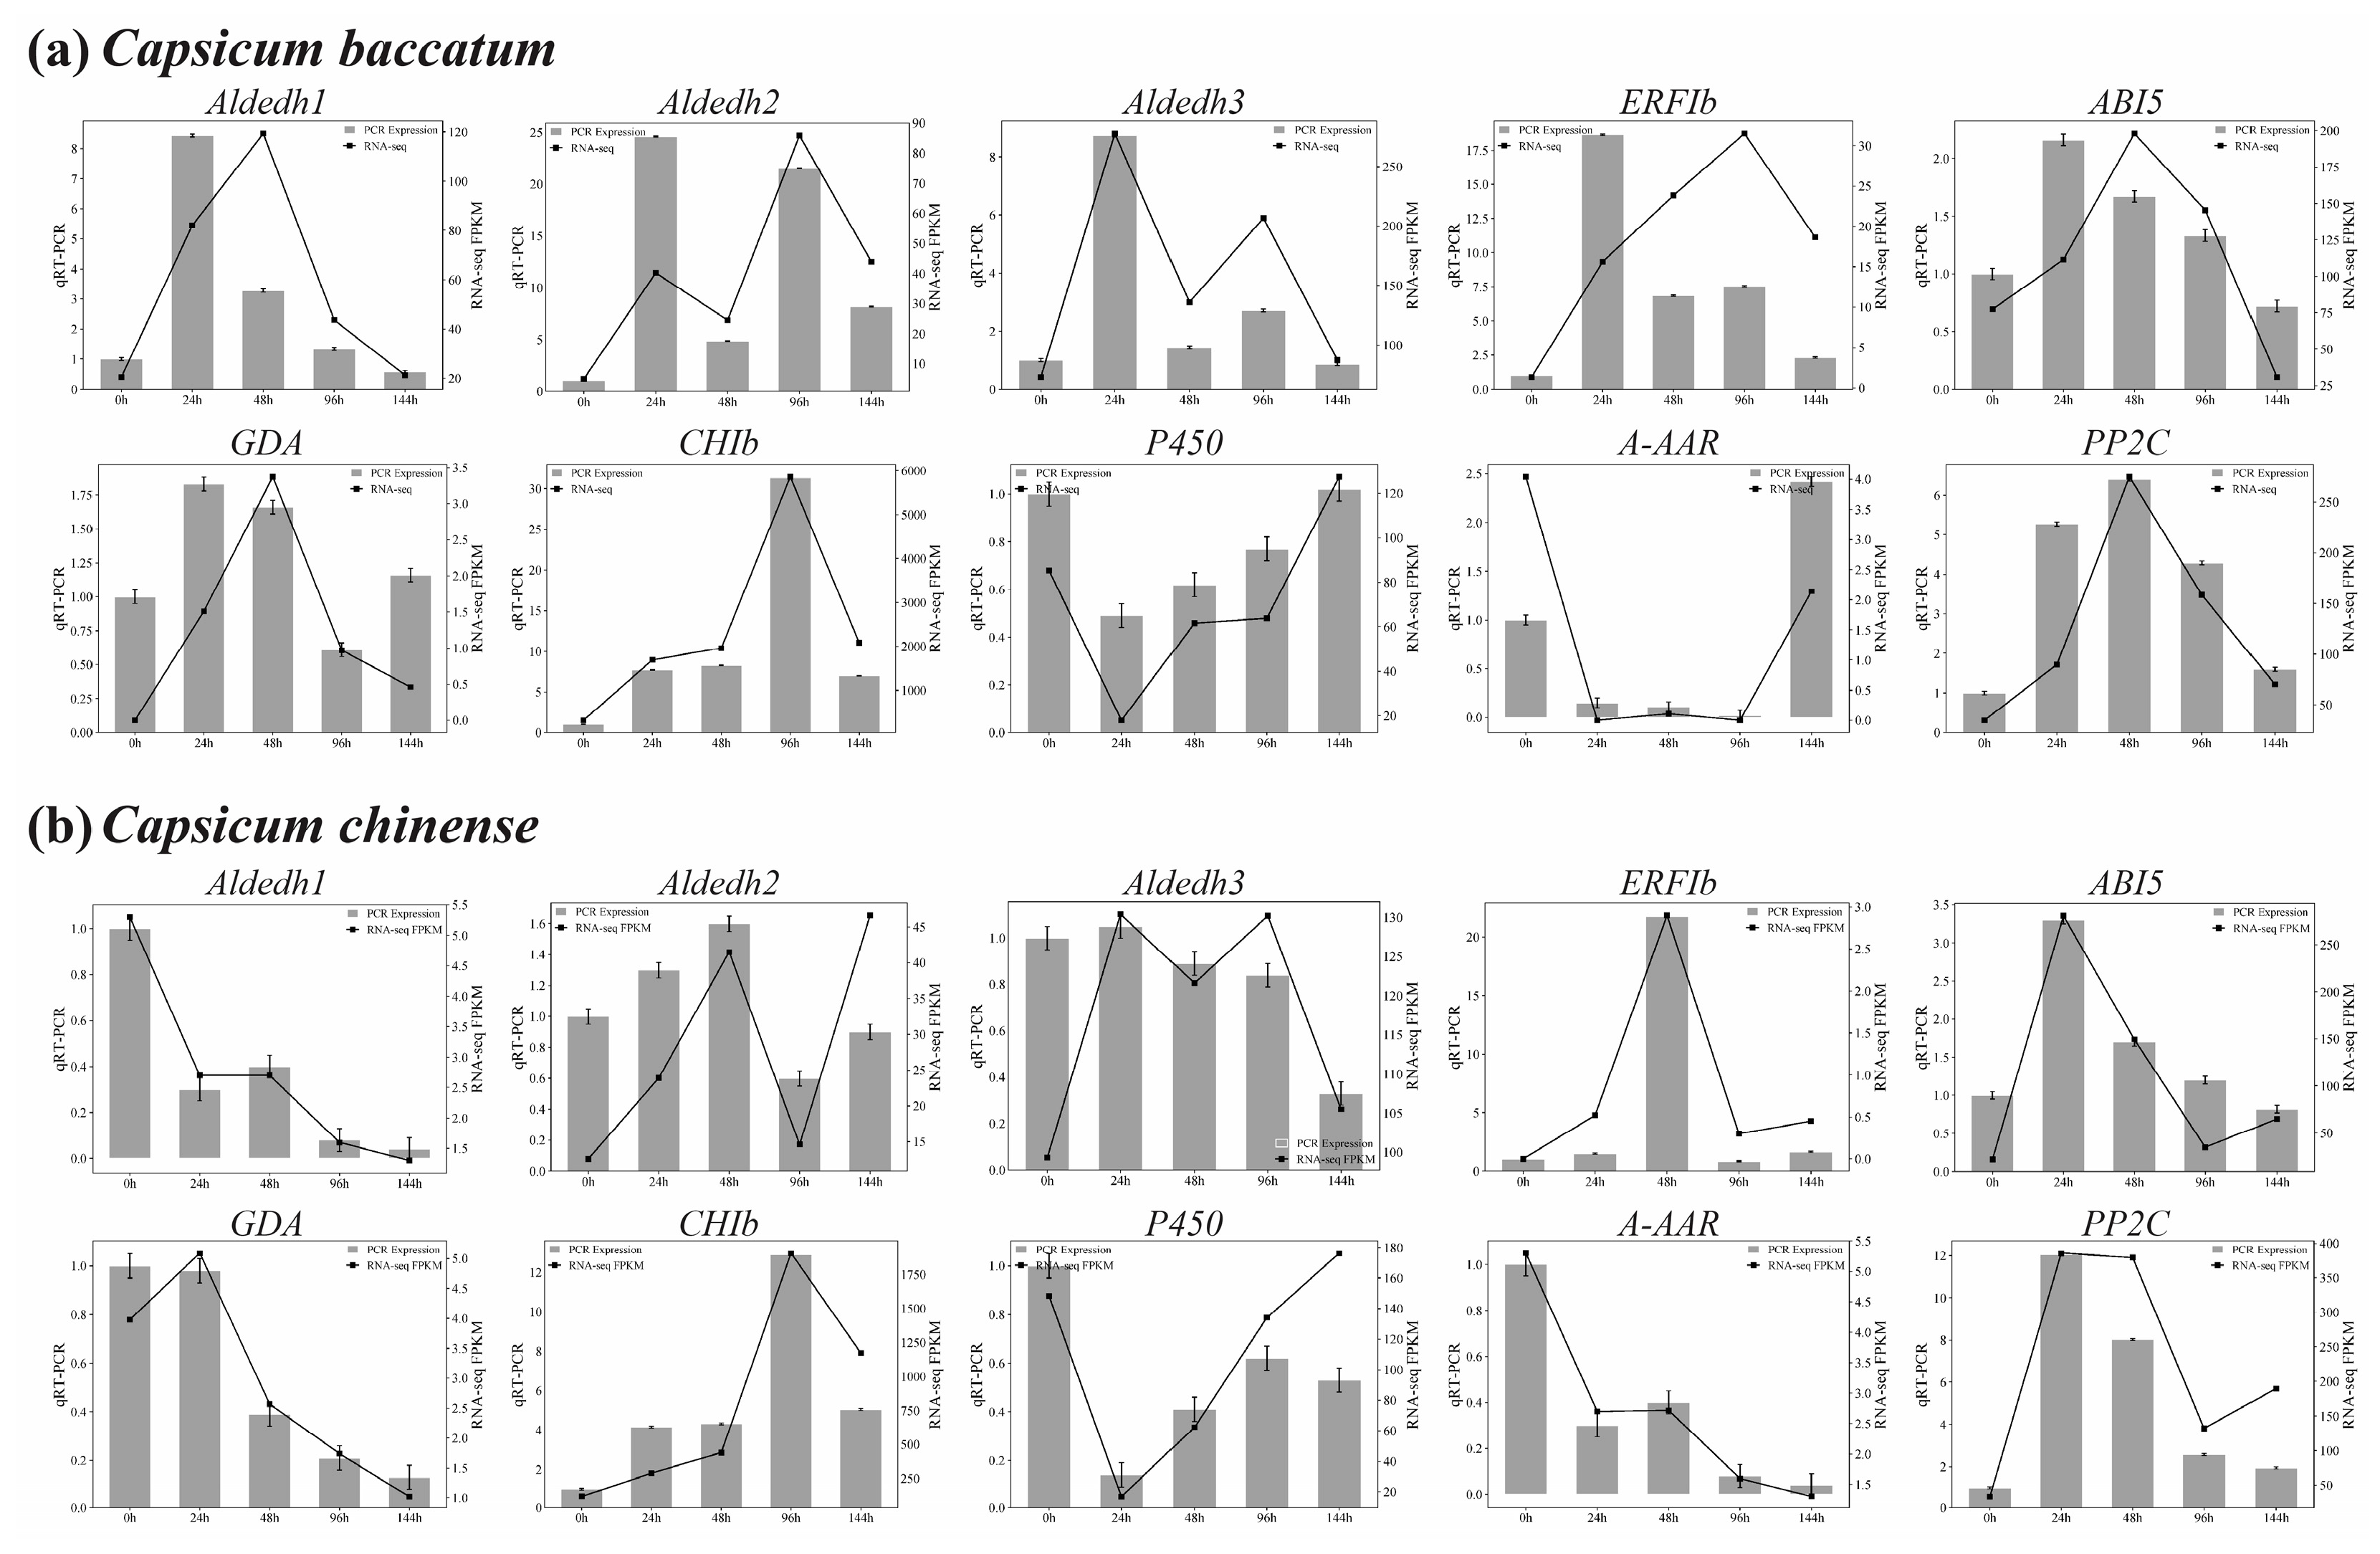
2.9. qRT-PCR Validation

The qRT-PCR analysis validated RNA-seq expression patterns of 10 specifically selected DEGs. This study was performed across five specific time periods when salt stress treatment was applied in both C. baccatum and C. chinense, as depicted in Figure 9. Consistent outcomes were reported across multiple genes, encompassing those implicated in MAPK and plant hormone signal transduction pathways (A-ARR, CHIb, ERF1b, PP2C, and ABI5), stilbenoid, diarylheptanoid, and gingerol biosynthesis (P450), alanine, aspartate, and glutamate metabolism (Aldedh1), phenylpropanoid biosynthesis (GDA), and arginine and proline metabolism (Aldedh2 and Aldedh3) (Figure 9a,b). The expression patterns obtained from RNA-Seq data and quantitative real-time polymerase chain reaction (qRT-PCR) demonstrated a significantly strong positive correlation across various time points.

3. Discussion

3.1. Phenotypical and Physiological Changes

Salinity poses a significant challenge to plant growth and development, affecting crucial processes such as water absorption [34]. This environmental stressor alters plants’ biochemical, physiological, and morphological reactions, ultimately reducing growth, yield, and quality. To cope with salt stress, plants have evolved mechanisms to manage water relations and accumulate ions, thereby developing tolerance to osmotic stress through the accumulation of organic osmolytes or ions [35]. Salt-tolerant plants also regulate their levels of sodium (Na+) and chloride (Cl) ions by transporting or storing them in vacuoles to prevent their toxicity [36]. A high salt level triggers the production of ROS, which can cause damage to proteins, lipids, and DNA [37]. To respond to ROS, plants activate their defense system, which includes POD, SOD, CAT, and other enzymatic antioxidant enzymes and some nonenzymatic compounds like proline, carotenoids, and other such compounds [38]. These enzymatic antioxidants and compounds are crucial for cell growth and survival to scavenge ROS in maintaining the ROS and antioxidant defense balance [39]. In the present study, under salt stress, we investigated the response of two pepper species, C. baccatum and C. chinense. We observed a distinct pattern of enzymatic and no enzymatic activities in both species. At 24 h and 48 h after salt stress treatment, C. chinense showed an early and sustained increase in SOD activity, as compared to C. baccatum with a delayed response initially followed by a peak at 144 h. The CAT activity peaked after 24 h in C. baccatum, whereas it continuously declined over time in C. chinense. Similarly, POD activity was higher in C. baccatum compared to C. chinense in a continuous manner, particularly after 48 h of treatment. These outcomes highlight the importance of enzymatic antioxidant activities in scavenging the ROS to avoid membrane damage [40], which indicates a plant’s response to stress defense and resistance [41].
Moreover, our investigation also revealed the proline, H2O2, and MDA role between both species under salt stress. We noticed a greater increase in proline levels in C. chinense at all time points compared to C. baccatum. Similarly, H2O2 remained consistent in C. baccatum, but it peaked at 144 h in C. chinense, at all-time points showing consistency with earlier findings that high salt stress can cause H2O2 rapid bursts in plant cells, which could be an important signal for salinity response [42]. We recorded a maximum level of MDA in C. chinense at 96 h after salt stress compared to C. baccatum at all time intervals, which suggests greater membrane damage in salt-sensitive species, consistent with the earlier research [43,44]. Additionally, this study also found a more consistent decline in chlorophyll in C. chineses under salt stress as compared to C. baccatum, and these findings are in agreement with studies showing that salt-tolerant plants normally experience less chlorophyll decrease or degradation under abiotic stresses [45,46,47].

3.2. Role of MAPK Signaling Pathway

Salinity adversely affects the crop plants’ biochemical and physiological pathways [48]. We investigated the molecular response of C. baccatum and C. chinense under NaCl stress, focusing on the MAPK signaling pathway. Under salt stress, the ethylene-responsive factor (ERF1b) showed upregulation in both species but with more expression in C. baccatum and more interaction with CHIb, which can activate defense-related genes like PDF1.2, potentially indicating its robust defense response as compared to C. chinense, consistent with the earlier findings [49]. Similarly, we found that PYL4 (abscisic acid receptor) downregulation and inhibition of PP2C genes (protein phosphate 51C and 24C), which interact with mitogen-activated protein kinases (MAPKKK18). For PP2C, both genes showed more expression in C. chinense, whereas MAPKKK18 showed more expression in C. baccatum. These findings are consistent with prior studies suggesting that plants can adapt to stress conditions through ABA signaling, which involves ABA receptors, pyrabactin-resistant regulatory components (PYR1/PYL/RCAR proteins), and PP2C genes [50,51,52]. MAPK cascades are also implicated in ABA signaling processes, which include stomatal regulation and antioxidant defense [53]. For example, in stressful conditions, ABA regulates MAPK signaling components [54].

3.3. Role Hormone Signal Transduction Pathway

Phytohormones are important players and play a key role in plant growth and development by involving various plant defense mechanisms under salt stress [55]. For instance, ABA, gibberellic acid (GA), and jasmonic acid (JA) improve alfalfa’s salt stress response [56]. Similarly, in regulating the effects of salinity-related factors, ethylene works with a range of other phytohormones and stress signaling molecules to finely orchestrate the plant’s responses, whether in the context of salinity or normal growth [57,58]. Our study delves into the key regulatory roles of phytohormones like Cks, ABA, and ethylene in shaping pepper crop transcriptional mechanisms under salt stress. Cks are important indicators of plant sensitivity to salinity, as they influence different physiological processes [52,59]. In our study, we observed the downregulation of ARR 4/9 signaling genes in C. chinense, which might negatively impact the Ck pathway, indicating their potential involvement in salt response; these results are consistent with prior findings [60,61]. Previous research suggests ethylene is a significant regulator of NaCl stress response at various cellular levels and transcription factors [62]. Our findings revealed a higher upregulation of ERF1b expression in C. baccatum than in C. chinense under stress conditions, indicating their importance in pepper’s tolerance response. Moreover, ABA’s vital role in salt stress responses indicates its influence on various physiological mechanisms [63]. In our study, the downregulation of the ABA receptor PYL4 inhibits PP2C genes, leading to the upregulation of bZIP_1 (ABI5), which positively impacts the ABA signaling pathway in pepper under salt stress. ABI5 showed a higher expression in C. baccatum than in C.chinense, which indicates that ABI5 might have a role in tolerance against salt stress. Prior findings support our findings by emphasizing the significance of ABA, its receptors, PP2C phosphatases, and ABF transcription factors in plant responses under salt stress [64,65]. This study underscores the importance of the intricate interplay of phytohormone signaling pathways in regulating pepper’s response to salt stress, providing valuable insights into potential targets for improving salt tolerance in crops. Further research must elucidate the specific mechanisms underlying hormone-mediated responses to salt stress in pepper plants.

4. Materials and Methods

4.1. Plant Material and NaCl Treatments

Two pepper-cultivated species seeds were germinated on MS media and screened against 100 mM salt stress. The C. baccatum germplasm (HNUCB226), moderately salt-sensitive, and C. chinense germplasm (HNUCC275), salt-sensitive (based on screening), were selected for this study [66]. At the 3–4 leaf growth stage (BBCH 13–14), seedlings were transferred into 800 mL boxes filled with Hoagland nutritional solution and grown in a growth chamber (PQX-330B-30HM, Ningbo Life Technology Co. Ltd., Ningbo, China) under conditions of 26 °C temperature, 70% humidity, and a light cycle of 16 h followed by 8 h of darkness. After 4–5 weeks of growth, the plants were treated with 100 mM NaCl for 144 h [67]. A total of 72 plants were selected, with 36 plants in each species; each species contained 3 replicates, and each replicate contained 12 plants. After stress treatment, samples were collected at 0 h, 24 h, 48 h, 96 h, and 144 h, respectively, with three biological repeats. Subsequently, the collected samples were stored at −80 °C for future analysis.

4.2. Response of Biochemical Indexes

To assess the enzyme (SOD, POD, and CAT) activities, 0.1 g of leaf samples were homogenized in 900 µL of phosphate buffer (pH 7.8). Samples were centrifuged (TGL-1850 Micro refrigerated centrifuge, Sichuan Shuke Instrument Co., Ltd., Chengdu, China) at 10,000× g for 10 min, and the supernatants were used to determine the antioxidant enzyme activities according to their respective kits (A001-1-2, A084-3-1, and A007-1-1) from Nanjing Jiancheng Biotechnology. Additionally, proline and MDA content and H2O2 concentration content in pepper leaves were quantified using assay kits (G0111F96, G0110F, and A064-1-1) from Suzhou Geruisi Biotechnology Co. Ltd., (Suzhou, China) and Nanjing Jiancheng Biotechnology (Nanjing, China), adhering to the instructions provided by the manufacturers, respectively. Moreover, for the determination of the total chlorophyll contents, chlorophyll a, chlorophyll b, and carotenoids, 0.1 g of fresh leaf samples were ground with 10 mL of extraction solution. Samples were centrifuged at 10,000× g for 10 min, and the supernatant was used to observe the values of Chl a, Chl b, and carotenoid according to the commercially available kit (G0163F) from Suzhou Geruisi Biotechnology Co. Ltd., Suzhou, China.

4.3. Stress Tolerance Index Percentage (STI%)

The leaf, stem, and root samples from the control and treatment of both species were dried in an oven (DGG-9053A, Shanghai Enxin Instrument Co., Ltd., Shanghai, China) at 65 ℃ for 72 h. Samples were weighed via a weighing apparatus, and stress tolerance index percentage (STI%) was calculated using the following formula previously described [68].
STI (%) = (Dry weight of leaf/stem/root of treated samples/Dry weight of leaf/stem/root of control samples) × 100.

4.4. Scanning of Leaf and Root

Root and leaf samples were washed with 75% ethanol and were subsequently dried. After drying, samples were attached to metallic stubs with scotch tape and sputter coated with gold and aluminum in a J20 Ion Sputter Coater for 90 s before scanning. Finally, images were taken using a scanning electron microscope (Thermoscientific Verios G4 UC) [69].

4.5. RNA Extraction, Library Construction, and RNA Sequencing

RNA extraction was performed on all obtained samples using the NEB extraction kit. In a subsequent step, the cDNA library was constructed using the RNA Library Prep kit for Illumina® (NEB, Ipswich, Massachusetts, USA). Clusters were generated, and sequencing was performed using the Illumina Novaseq platform, producing paired-end reads with a length of 150 base pairs. The HISAT2 alignment tool mapped paired-end clean reads of both species with the reference genome C. baccatum (https://ftp.ncbi.nlm.nih.gov/genomes/all/GCA/002/271/885/GCA_002271885.2_ASM227188v2/GCA_002271885.2_ASM227188v2_genomic.gtf.gz: accessed on 15 May 2023). FeatureCounts (v1.5.0-p3) was used to count the reads numbers mapped to each gene, then the FPKM of each gene was calculated based on the length of the gene and read counts mapped to this gene. Differential expression analysis (DEA) was conducted with DESeq2 software (version 1.20.0). DESeq2 provides statistical routines for determining differential expression in digital gene expression data using a model based on the negative binomial distribution. The resulting p-values were adjusted using Benjamini and Hochberg’s approach to control the false discovery rate. Genes with an adjusted p ≤ 0.05 found by DESeq2 were assigned as differentially expressed [70]. The clusterProfiler R package (3.8.1) was used to analyze the Gene Ontology (GO) of differentially expressed genes and the statistical enrichment of DEGs in the KEGG pathway [71,72].

4.6. Co-Expression Modules Identification

The R WGCNA package (a set of functions used to calculate various weighted association analyses, which can be used for network construction, gene screening, gene cluster identification, topological feature calculation, data simulation, and visualization) was employed to establish a gene co-expression network. The networks were visualized using Cytoscape version 3.6.048. Using the heat map function in the R package, high-throughput heat maps were generated and visually displayed to showcase the gene expression levels for specific DEGs [73].

4.7. qRT-PCR Validation

The RNA-seq samples created the quantitative real-time PCR analysis library. Ten randomly selected DEG expression patterns were validated via qRT-PCR. Primers for these genes were designed using PRIMER5 software ((v5.0) Supplementary Table S3). The HiScript III (+gDNA wiper) kit was used for reverse transcription. SYBR qPCR-Mix was used for qPCR analysis, and QuantStudio™ Design and Analysis Software 1.3 calculated the expression levels of each sample. Moreover, the 2-ΔΔCT method was then used to determine the relative expression levels of the chosen DEGs.

4.8. Statistics

Data were analyzed using the statistical software SAS 9.4 (SAS Institute Inc., Cary, NC, USA). A two-way ANOVA was employed to analyze the salt stress changes at different intervals. The graphs were generated using GraphPad Prism 8.0.1, and the significant differences were examined using Tukey’s HSD tests following p ≤ 0.05.

5. Conclusions

This study investigated the physiological and transcriptomic responses of two pepper species (C. chinense and C. baccatum) to salt stress. Our findings illuminate the complex mechanisms, particularly emphasizing the roles of MAPK and hormone signal transduction pathways. Physiologically, significant differences between the two species were observed, with C. chinense exhibiting higher sensitivity, as evidenced by pronounced alterations such as enzymatic antioxidants and nonenzymatic compounds, whereas C. baccatum responded more resilient to salt stress. The DEGs involved in plant signaling pathways, including ethylene-responsive factors (ERFs), ABA receptors (PYL), protein phosphatases (PP2C), and basic leucine zipper protein (BZIP_1), further highlighted the species-specific responses to salt stress. Overall, this study provides valuable insights into salt stress tolerance’s molecular and physiological mechanisms in pepper plants, identifying key genes and pathways for potential use in breeding salt-tolerant cultivars. These findings also enhance the understanding of plant stress responses, with implications for improving crop resilience to environmental challenges.

Supplementary Materials

The following supporting information can be downloaded at: https://www.mdpi.com/article/10.3390/ijms25179355/s1.

Author Contributions

Conceptualization, Z.W. and M.A.F.; methodology, M.A.F., Z.W. and L.Z.; software, M.A.F., M.Z.U.H., H.T., S.W. and Z.W.; validation, M.A.F., N.M., S.W. and M.Z.U.H.; formal analysis, M.A.F., H.T., L.Z. and M.Z.U.H.; investigation, M.A.F. and Z.W.; resources, M.A.F., Z.W., H.T., S.W., M.Z.U.H. and L.Z.; data curation, M.A.F., H.T., M.Z.U.H. and N.M.; writing—original draft preparation, M.A.F., Z.W. and M.Z.U.H.; writing—review and editing, M.A.F., N.M., L.Z., S.W., H.T., M.Z.U.H. and Z.W.; visualization, M.A.F. and Z.W.; supervision, Z.W.; project administration, Z.W.; funding acquisition, Z.W. All authors have read and agreed to the published version of the manuscript.

Funding

This research was funded by the Hainan Province Science and Technology Special Fund (ZDYF2023XDNY028) and the Collaborative Innovation Center of Nanfan and High-Efficiency Tropical Agriculture (XTCX2022NYB03), Hainan University.

Institutional Review Board Statement

Not applicable.

Informed Consent Statement

Not applicable.

Data Availability Statement

The original data can be found in NCBI BioProject: PRJNA1056267 (https://dataview.ncbi.nlm.nih.gov/object/PRJNA1056267?reviewer=4jvkg624h1schnmnovkjinudoq: accessed on 25 December 2023).

Conflicts of Interest

The authors declare no conflicts of interest.

References

  1. Islam, M.R.; Mia, M.B.; Islam, T. Role of abiotic stresses on photosynthesis and yield of crop plants, with special reference to wheat. In Abiotic Stresses in Wheat; Elsevier: Amsterdam, The Netherlands, 2023; pp. 179–193. [Google Scholar]
  2. Rathod, A.; Verma, N.S. Impact of Abiotic Stress on Agronomical Crops. In Frontiers of Agronomy; Elite Publishing House: Rohini, ND, USA, 2023; p. 27. [Google Scholar]
  3. Gosai, H.G.; Sharma, A.; Mankodi, P. Climate Change’s Impact on Agricultural Food Production. In Food Security in a Developing World: Status, Challenges, and Opportunities; Springer: Berlin/Heidelberg, Germany, 2024; pp. 117–132. [Google Scholar]
  4. Datta, D.; Ghosh, S.; Das, K.; Singh, S.V.; Mazumdar, S.P.; Mandal, S.; Singh, Y. Biochar imparting abiotic stress resilience. In Biochar Production for Green Economy; Elsevier: Amsterdam, The Netherlands, 2024; pp. 227–248. [Google Scholar]
  5. Mantri, N.; Patade, V.; Penna, S.; Ford, R.; Pang, E. Abiotic stress responses in plants: Present and future. In Abiotic Stress Responses in Plants: Metabolism, Productivity and Sustainability; Springer: New York, NY, USA, 2012; pp. 1–19. [Google Scholar]
  6. Abd El-Mageed, T.A.; Rady, M.O.; Semida, W.M.; Shaaban, A.; Mekdad, A.A. Exogenous micronutrients modulate morpho-physiological attributes, yield, and sugar quality in two salt-stressed sugar beet cultivars. J. Soil Sci. Plant Nutr. 2021, 21, 1421–1436. [Google Scholar] [CrossRef]
  7. Semida, W.M.; Abd El-Mageed, T.A.; Abdelkhalik, A.; Hemida, K.A.; Abdurrahman, H.A.; Howladar, S.M.; Leilah, A.A.; Rady, M.O. Selenium modulates antioxidant activity, osmoprotectants, and photosynthetic efficiency of onion under saline soil conditions. Agronomy 2021, 11, 855. [Google Scholar] [CrossRef]
  8. Devkota, K.P.; Devkota, M.; Rezaei, M.; Oosterbaan, R. Managing salinity for sustainable agricultural production in salt-affected soils of irrigated drylands. Agric. Syst. 2022, 198, 103390. [Google Scholar] [CrossRef]
  9. Machado, R.M.A.; Serralheiro, R.P. Soil salinity: Effect on vegetable crop growth. Management practices to prevent and mitigate soil salinization. Horticulturae 2017, 3, 30. [Google Scholar] [CrossRef]
  10. Kaya, C.; Ashraf, M. The endogenous L-cysteine desulfhydrase and hydrogen sulfide participate in supplemented phosphorus-induced tolerance to salinity stress in maize (Zea mays) plants. Turk. J. Bot. 2020, 44, 36–46. [Google Scholar] [CrossRef]
  11. Kamran, M.; Parveen, A.; Ahmar, S.; Malik, Z.; Hussain, S.; Chattha, M.S.; Saleem, M.H.; Adil, M.; Heidari, P.; Chen, J.-T. An overview of hazardous impacts of soil salinity in crops, tolerance mechanisms, and amelioration through selenium supplementation. Int. J. Mol. Sci. 2019, 21, 148. [Google Scholar] [CrossRef]
  12. Zhonghua, T.; Yanju, L.; Xiaorui, G.; Yuangang, Z. The combined effects of salinity and nitrogen forms on Catharanthus roseus: The role of internal ammonium and free amino acids during salt stress. J. Plant Nutr. Soil Sci. 2011, 174, 135–144. [Google Scholar] [CrossRef]
  13. Gupta, B.; Huang, B. Mechanism of salinity tolerance in plants: Physiological, biochemical, and molecular characterization. Int. J. Gen. 2014, 2014, 701596. [Google Scholar] [CrossRef]
  14. Shelke, D.B.; Nikalje, G.C.; Chambhare, M.R.; Zaware, B.N.; Penna, S.; Nikam, T.D. Na+ and Cl induce differential physiological, biochemical responses and metabolite modulations in vitro in contrasting salt-tolerant soybean genotypes. 3 Biotech 2019, 9, 91. [Google Scholar] [CrossRef]
  15. Tahir, H.; Sajjad, M.; Qian, M.; Zeeshan Ul Haq, M.; Tahir, A.; Chen, T.; Shaopu, S.; Farooq, M.A.; Ling, W.; Zhou, K. Transcriptomic Analysis Reveals Dynamic Changes in Glutathione and Ascorbic Acid Content in Mango Pulp across Growth and Development Stages. Horticulturae 2024, 10, 694. [Google Scholar] [CrossRef]
  16. Hasanuzzaman, M.; Raihan, M.R.H.; Masud, A.A.C.; Rahman, K.; Nowroz, F.; Rahman, M.; Nahar, K.; Fujita, M. Regulation of reactive oxygen species and antioxidant defense in plants under salinity. Int. J. Mol. Sci. 2021, 22, 9326. [Google Scholar] [CrossRef]
  17. Mansoor, S.; Ali, A.; Kour, N.; Bornhorst, J.; AlHarbi, K.; Rinklebe, J.; Abd El Moneim, D.; Ahmad, P.; Chung, Y.S. Heavy metal induced oxidative stress mitigation and ROS scavenging in plants. Plants 2023, 12, 3003. [Google Scholar] [CrossRef] [PubMed]
  18. Zhou, X.; Naguro, I.; Ichijo, H.; Watanabe, K. Mitogen-activated protein kinases as key players in osmotic stress signaling. Biochim. Biophys. Acta (BBA)—Gen. Subj. 2016, 1860, 2037–2052. [Google Scholar] [CrossRef]
  19. Singh, A.; Kumar, A.; Yadav, S.; Singh, I.K. Reactive oxygen species-mediated signaling during abiotic stress. Plant Gene 2019, 18, 100173. [Google Scholar] [CrossRef]
  20. Liu, Y.; Wang, L.; Liu, C.; Yin, H.; Liu, H.; Luo, H.; He, M.; Zhou, Y. Cgbzip1: A bzip transcription factor from chrysanthemum grandiflora confers plant tolerance to salinity and drought stress. Agronomy 2022, 12, 556. [Google Scholar] [CrossRef]
  21. Gurmani, A.; Bano, A.; Khan, S.; Din, J.; Zhang, J. Alleviation of salt stress by seed treatment with abscisic acid (ABA), 6-benzylaminopurine (BA) and chlormequat chloride (CCC) optimizes ion and organic matter accumulation and increases yield of rice (Oryza sativa L.). Aust. J. Crop Sci. 2011, 5, 1278–1285. [Google Scholar]
  22. Ma, L.; Zhang, H.; Sun, L.; Jiao, Y.; Zhang, G.; Miao, C.; Hao, F. NADPH oxidase AtrbohD and AtrbohF function in ROS-dependent regulation of Na+/K+ homeostasis in Arabidopsis under salt stress. J. Exp. Bot. 2012, 63, 305–317. [Google Scholar] [CrossRef]
  23. Yang, Y.; Guo, Y. Unraveling salt stress signaling in plants. J. Integr. Plant Biol. 2018, 60, 796–804. [Google Scholar] [CrossRef]
  24. Khoury, C.K.; Carver, D.; Barchenger, D.W.; Barboza, G.E.; van Zonneveld, M.; Jarret, R.; Bohs, L.; Kantar, M.; Uchanski, M.; Mercer, K. Modelled distributions and conservation status of the wild relatives of chile peppers (Capsicum L.). Divers. Distrib. 2020, 26, 209–225. [Google Scholar] [CrossRef]
  25. Tripodi, P.; Kumar, S. The Capsicum Genome; Springer International Publishing: Cham, Switzerland, 2019; pp. 1–8. [Google Scholar]
  26. Zou, Z.; Zou, X. Geographical and ecological differences in pepper cultivation and consumption in China. Front. Nutri. 2021, 8, 718517. [Google Scholar] [CrossRef]
  27. Olatunji, T.L.; Afolayan, A.J. The suitability of chili pepper (Capsicum annuum L.) for alleviating human micronutrient dietary deficiencies: A review. Food Sci. Nutri. 2018, 6, 2239–2251. [Google Scholar] [CrossRef]
  28. Wahyuni, Y.; Ballester, A.-R.; Sudarmonowati, E.; Bino, R.J.; Bovy, A.G. Secondary metabolites of Capsicum species and their importance in the human diet. J. Nat. Prod. 2013, 76, 783–793. [Google Scholar] [CrossRef] [PubMed]
  29. Bacelar, E.; Pinto, T.; Anjos, R.; Morais, M.C.; Oliveira, I.; Vilela, A.; Cosme, F. Impacts of climate change and mitigation strategies for some abiotic and biotic constraints influencing fruit growth and quality. Plants 2024, 13, 1942. [Google Scholar] [CrossRef] [PubMed]
  30. Bojórquez-Quintal, E.; Velarde-Buendía, A.; Ku-González, Á.; Carillo-Pech, M.; Ortega-Camacho, D.; Echevarría-Machado, I.; Pottosin, I.; Martínez-Estévez, M. Mechanisms of salt tolerance in habanero pepper plants (Capsicum chinense Jacq.): Proline accumulation, ions dynamics and sodium root-shoot partition and compartmentation. Front. Plant Sci. 2014, 5, 605. [Google Scholar]
  31. Zaman, M.; Shahid, S.A.; Heng, L. Guideline for Salinity Assessment, Mitigation and Adaptation Using Nuclear and Related Techniques; Springer Nature: Berlin, Germany, 2018. [Google Scholar]
  32. De Pascale, S.; Ruggiero, C.; Barbieri, G.; Maggio, A. Physiological responses of pepper to salinity and drought. J. Am. Soc. Hortic. Ssc. 2003, 128, 48–54. [Google Scholar] [CrossRef]
  33. Rolly, N.K.; Imran, Q.M.; Shahid, M.; Imran, M.; Khan, M.; Lee, S.-U.; Hussain, A.; Lee, I.-J.; Yun, B.-W. Drought-induced AtbZIP62 transcription factor regulates drought stress response in Arabidopsis. Plant Physiol. Biochem. 2020, 156, 384–395. [Google Scholar] [CrossRef]
  34. Khan, M.A.H.; Baset Mia, M.A.; Quddus, M.A.; Sarker, K.K.; Rahman, M.; Skalicky, M.; Brestic, M.; Gaber, A.; Alsuhaibani, A.M.; Hossain, A. Salinity-induced physiological changes in pea (Pisum sativum L.): Germination rate, biomass accumulation, relative water content, seedling vigor and salt tolerance index. Plants 2022, 11, 3493. [Google Scholar] [CrossRef]
  35. Mansour, M.M.F.; Salama, K.H.A. Cellular mechanisms of plant salt tolerance. In Microorganisms in Saline Environments: Strategies and Functions; Springer International Publishing: Cham, Switzerland, 2019; pp. 169–210. [Google Scholar]
  36. Rady, M.M.; Taha, S.S.; Kusvuran, S. Integrative application of cyanobacteria and antioxidants improves common bean performance under saline conditions. Sci. Hortic. 2018, 233, 61–69. [Google Scholar] [CrossRef]
  37. Parihar, P.; Singh, S.; Singh, R.; Singh, V.P.; Prasad, S.M. Effect of salinity stress on plants and its tolerance strategies: A review. Environ. Sci. Pollut. Res. 2015, 22, 4056–4075. [Google Scholar] [CrossRef]
  38. Kesawat, M.S.; Satheesh, N.; Kherawat, B.S.; Kumar, A.; Kim, H.-U.; Chung, S.-M.; Kumar, M. Regulation of reactive oxygen species during salt stress in plants and their crosstalk with other signaling molecules—Current perspectives and future directions. Plants 2023, 12, 864. [Google Scholar] [CrossRef]
  39. Jomova, K.; Raptova, R.; Alomar, S.Y.; Alwasel, S.H.; Nepovimova, E.; Kuca, K.; Valko, M. Reactive oxygen species, toxicity, oxidative stress, and antioxidants: Chronic diseases and aging. Arch. Toxicol. 2023, 97, 2499–2574. [Google Scholar] [PubMed]
  40. Guan, Q.; Wang, Z.; Wang, X.; Takano, T.; Liu, S. A peroxisomal APX from Puccinellia tenuiflora improves the abiotic stress tolerance of transgenic Arabidopsis thaliana through decreasing of H2O2 accumulation. J. Plant Physiol. 2015, 175, 183–191. [Google Scholar] [CrossRef] [PubMed]
  41. Meng, F.; Duan, Y.; Yang, Y.; Liu, G.; Liu, H. Effects of mixed saline stress on photosynthetic characteristics and antioxidant enzymes activity of cassava seedlings. Chin. Agric. Sci. Bull. 2019, 35, 34–39. [Google Scholar]
  42. Wang, Y.; Diao, P.; Kong, L.; Yu, R.; Zhang, M.; Zuo, T.; Fan, Y.; Niu, Y.; Yan, F.; Wuriyanghan, H. Ethylene enhances seed germination and seedling growth under salinity by reducing oxidative stress and promoting chlorophyll content via ETR2 pathway. Front. Plant Sci. 2020, 11, 1066. [Google Scholar] [CrossRef] [PubMed]
  43. Ashraf, M.; Harris, P.J. Potential biochemical indicators of salinity tolerance in plants. Plant Sci. 2004, 166, 3–16. [Google Scholar] [CrossRef]
  44. Szabados, L.; Savouré, A. Proline: A multifunctional amino acid. Trends Plant Sci. 2010, 15, 89–97. [Google Scholar] [CrossRef]
  45. Rao, A.; Ahmad, S.D.; Sabir, S.M.; Awan, S.I.; Shah, A.H.; Abbas, S.R.; Shafique, S.; Khan, F.; Chaudhary, A. Potential antioxidant activities improve salt tolerance in ten varieties of wheat (Triticum aestivum L.). Am. J. Plant Sci. 2013, 4, 69–76. [Google Scholar] [CrossRef]
  46. Santos, C.V. Regulation of chlorophyll biosynthesis and degradation by salt stress in sunflower leaves. Sci. Hortic. 2004, 103, 93–99. [Google Scholar] [CrossRef]
  47. Tania, S.S.; Rhaman, M.S.; Rauf, F.; Rahaman, M.M.; Kabir, M.H.; Hoque, M.A.; Murata, Y. Alleviation of Salt-Inhibited germination and seedling growth of kidney bean by seed priming and exogenous application of salicylic acid (SA) and hydrogen peroxide (H2O2). Seeds 2022, 1, 87–98. [Google Scholar] [CrossRef]
  48. Arzani, A.; Kumar, S.; Mansour, M.M.F. Salt tolerance in plants: Molecular and functional adaptations. Front. Plant Sci. 2023, 14, 1280788. [Google Scholar] [CrossRef]
  49. Solano, R.; Stepanova, A.; Chao, Q.; Ecker, J.R. Nuclear events in ethylene signaling: A transcriptional cascade mediated by ETHYLENE-INSENSITIVE3 and ETHYLENE-RESPONSE-FACTOR1. Genes Dev. 1998, 12, 3703–3714. [Google Scholar] [CrossRef] [PubMed]
  50. Lee, S.C.; Luan, S. ABA signal transduction at the crossroad of biotic and abiotic stress responses. Plant Cell Environ. 2012, 35, 53–60. [Google Scholar] [CrossRef]
  51. Nakashima, K.; Fujita, Y.; Kanamori, N.; Katagiri, T.; Umezawa, T.; Kidokoro, S.; Maruyama, K.; Yoshida, T.; Ishiyama, K.; Kobayashi, M. Three Arabidopsis SnRK2 protein kinases, SRK2D/SnRK2.2, SRK2E/SnRK2.6/OST1 and SRK2I/SnRK2.3, involved in ABA signaling are essential for the control of seed development and dormancy. Plant Cell Physiol. 2009, 50, 1345–1363. [Google Scholar] [CrossRef]
  52. Umezawa, T.; Sugiyama, N.; Takahashi, F.; Anderson, J.C.; Ishihama, Y.; Peck, S.C.; Shinozaki, K. Genetics and phosphoproteomics reveal a protein phosphorylation network in the abscisic acid signaling pathway in Arabidopsis thaliana. Sci. Signal. 2013, 6, rs8. [Google Scholar] [CrossRef]
  53. Danquah, A.; De Zélicourt, A.; Colcombet, J.; Hirt, H. The role of ABA and MAPK signaling pathways in plant abiotic stress responses. Biotechnol. Adv. 2014, 32, 40–52. [Google Scholar] [CrossRef]
  54. Liu, Y. Roles of mitogen-activated protein kinase cascades in ABA signaling. Plant Cell Rep. 2012, 31, 1–12. [Google Scholar] [CrossRef]
  55. Mangal, V.; Lal, M.K.; Tiwari, R.K.; Altaf, M.A.; Sood, S.; Kumar, D.; Bharadwaj, V.; Singh, B.; Singh, R.K.; Aftab, T. Molecular insights into the role of reactive oxygen, nitrogen and sulphur species in conferring salinity stress tolerance in plants. J. Plant Growth Regul. 2023, 42, 554–574. [Google Scholar] [CrossRef]
  56. Wang, X.; Yin, J.; Wang, J.; Li, J. Integrative analysis of transcriptome and metabolome revealed the mechanisms by which flavonoids and phytohormones regulated the adaptation of alfalfa roots to NaCl stress. Front. Plant Sci. 2023, 14, 1117868. [Google Scholar] [CrossRef] [PubMed]
  57. Atkinson, N.J.; Urwin, P.E. The interaction of plant biotic and abiotic stresses: From genes to the field. J. Exp. Bot. 2012, 63, 3523–3543. [Google Scholar] [CrossRef] [PubMed]
  58. Kissoudis, C.; van de Wiel, C.; Visser, R.G.; van der Linden, G. Enhancing crop resilience to combined abiotic and biotic stress through the dissection of physiological and molecular crosstalk. Front. Plant Sci. 2014, 5, 207. [Google Scholar] [CrossRef]
  59. Pavlů, J.; Novák, J.; Koukalová, V.; Luklová, M.; Brzobohatý, B.; Černý, M. Cytokinin at the crossroads of abiotic stress signalling pathways. Int. J. Mol. Sci. 2018, 19, 2450. [Google Scholar] [CrossRef]
  60. Waidmann, S.; Ruiz Rosquete, M.; Schöller, M.; Sarkel, E.; Lindner, H.; LaRue, T.; Petřík, I.; Dünser, K.; Martopawiro, S.; Sasidharan, R. Cytokinin functions as an asymmetric and anti-gravitropic signal in lateral roots. Nat. Commun. 2019, 10, 3540. [Google Scholar] [CrossRef]
  61. Zubo, Y.O.; Schaller, G.E. Role of the cytokinin-activated type-B response regulators in hormone crosstalk. Plants 2020, 9, 166. [Google Scholar] [CrossRef] [PubMed]
  62. Wang, J.; An, C.; Guo, H.; Yang, X.; Chen, J.; Zong, J.; Li, J.; Liu, J. Physiological and transcriptomic analyses reveal the mechanisms underlying the salt tolerance of Zoysia japonica Steud. BMC Plant Biol. 2020, 20, 114. [Google Scholar] [CrossRef]
  63. Ruggiero, A.; Landi, S.; Punzo, P.; Possenti, M.; Van Oosten, M.J.; Costa, A.; Morelli, G.; Maggio, A.; Grillo, S.; Batelli, G. Salinity and ABA seed responses in pepper: Expression and interaction of ABA core signaling components. Front. Plant Sci. 2019, 10, 304. [Google Scholar] [CrossRef] [PubMed]
  64. Zhao, B.-Y.; Hu, Y.-F.; Li, J.-J.; Yao, X.; Liu, K.-D. BnaABF2, a bZIP transcription factor from rapeseed (Brassica napus L.), enhances drought and salt tolerance in transgenic Arabidopsis. Bot. Stud. 2016, 57, 12. [Google Scholar] [CrossRef] [PubMed]
  65. Di, F.; Jian, H.; Wang, T.; Chen, X.; Ding, Y.; Du, H.; Lu, K.; Li, J.; Liu, L. Genome-wide analysis of the PYL gene family and identification of PYL genes that respond to abiotic stress in Brassica napus. Genes 2018, 9, 156. [Google Scholar] [CrossRef]
  66. Niu, M.; Wei, L.; Peng, Y.; Huang, Y.; Bie, Z. Mechanisms of increasing salt resistance of vegetables by grafting. Veg. Res. 2022, 2, 8. [Google Scholar] [CrossRef]
  67. Ma, J.; Wang, Y.; Wang, L.-Y.; Lin, D.; Yang, Y. Transcriptomic analysis reveals the mechanism of the alleviation of salt stress by salicylic acid in pepper (Capsicum annuum L.). Mol. Biol. Rep. 2023, 50, 3593–3606. [Google Scholar] [CrossRef]
  68. Kotaś, J.; Stasicka, Z. Chromium occurrence in the environment and methods of its speciation. Environ. Pollut. 2000, 107, 263–283. [Google Scholar] [CrossRef]
  69. Shu, H.; Altaf, M.A.; Mushtaq, N.; Fu, H.; Lu, X.; Zhu, G.; Cheng, S.; Wang, Z. Physiological and transcriptome analysis of the effects of exogenous strigolactones on drought responses of pepper seedlings. Antioxidants 2023, 12, 2019. [Google Scholar] [CrossRef] [PubMed]
  70. Anders, S.; Huber, W. Differential expression analysis for sequence count data. J. Genome Boil. 2010, 11, R106. [Google Scholar] [CrossRef] [PubMed]
  71. Young, M.D.; Wakefield, M.J.; Smyth, G.K.; Oshlack, A. Gene ontology analysis for RNA-seq: Accounting for selection bias. Genome Biol. 2010, 11, R14. [Google Scholar] [CrossRef]
  72. Kanehisa, M.; Goto, S. KEGG: Kyoto encyclopedia of genes and genomes. Nucleic Acids Res. 2000, 28, 27–30. [Google Scholar] [CrossRef] [PubMed]
  73. Mumtaz, M.A.; Zhou, Y.; Gao, C.; Kamran, H.M.; Altaf, M.A.; Hao, Y.; Shu, H.; Zhang, Y.; Lu, X.; Abbas, H.M.K.; et al. Interaction between transcriptional activator BRI1-EMS-SUPPRESSOR 1 and HSPs regulates heat stress tolerance in pepper. Environ. Exp. Bot. 2023, 211, 105341. [Google Scholar] [CrossRef]
Figure 1. (a) The external appearance of the leaves and roots from C. chinense exposed to salt (NaCl) stress was observed at various time intervals (0 h and 144 h). (b) The external appearance of the leaves and roots from C. baccatum exposed to NaCl stress was observed at various time intervals (0 h and 144 h); (c) stress tolerance index percentage (STI %) of leaf, stem, and root dried samples of C. baccatum and C. chinense at 100 mM NaCl stress. The lowercase alphabets indicating significant differences at p < 0.05.
Ijms 25 09355 g001
Figure 2. The biochemical parameters are (a) Proline, (b) SOD, (c) H2O2, (d) Catalase, (e) MDA, (f) POD, (g) Chlorophyll contents, (h) Chl. a and (i) Chl. b, and (j) Carotenoids of C. chinense and C. baccatum leaves under salt stress at various intervals. The presented data is the average ± standard deviation of three replicates, with lowercase alphabets indicating significant differences at p < 0.05.
Ijms 25 09355 g002
Figure 3. The SEM images of the leaf stomata (a), root tips (b), and root cross-section (c) of C. baccatum and C. chinense exposed to salt stress were observed at 0 h and 144 h.
Ijms 25 09355 g003
Figure 4. Venn diagrams were constructed to represent commonly expressed genes in different comparisons: (a) all treatments paired with control in C. chinensis, (b) all treatments paired with control in C. baccatum, and (c) amongst and between control pairs and treatment pairs of both C. chinensis and C. baccatum, under salt stress. Meanwhile, (d) shows the overall number of upregulated and downregulated genes within and between the species at all-time points in salt stress response; moreover, the gene heat map (e) shows their respective pattern under salt stress.
Ijms 25 09355 g004
Figure 5. (a) The genes have been classified into 17 discrete modules, as seen in the sequence diagram in the figure’s uppermost section. The lower portion of the diagram depicts the gene modules using a range of colors, along with the corresponding count of bases (b,c). The abscissa is the sample, the ordinate is the module, and the number of each grid represents the correlation between the module and the sample. The closer the value is to 1, the stronger the positive correlation between the module and the sample. The closer it is to −1, the stronger the negative correlation between the module and the sample. The number in parentheses represents the p-value of significance, and the lower the number, the stronger the significance (denoted as b,c). However, Figure (c) depicts the physiological traits of the abscissa. The presented heat map visually represents the eigengene adjacency for each module, indicating the degree of correlation between these modules. The coefficient correlation between the gene module and the sample/trait is determined within each cell, and subsequently, the corresponding p-value is presented directly below.
Ijms 25 09355 g005
Figure 6. GO (a) and KEGG (b) enriched DEGs functional analyses; (c) expression pattern of genes in the ME.red module selecting using the log10 FPKM values.
Ijms 25 09355 g006
Figure 7. Plant MAPK signaling pathway; upregulated genes are represented in dark red, while the downregulated gene is expressed in dark green color.
Ijms 25 09355 g007
Figure 8. In the Plant hormone signal transduction pathway; upregulated genes are represented in dark red, while the downregulated genes are expressed in dark green.
Ijms 25 09355 g008
Figure 9. RNA-Seq transcriptional data validation of randomly selected DEGs through qRT-PCR between C. baccatum (a) and C. chinense (b) against salt stress; represents the same DEGs comparison between these two species.
Ijms 25 09355 g009
Disclaimer/Publisher’s Note: The statements, opinions and data contained in all publications are solely those of the individual author(s) and contributor(s) and not of MDPI and/or the editor(s). MDPI and/or the editor(s) disclaim responsibility for any injury to people or property resulting from any ideas, methods, instructions or products referred to in the content.

