Article

Using Transcriptomics to Determine the Mechanism for the Resistance to Fusarium Head Blight of a Wheat-Th. elongatum Translocation Line

1
Jiangsu Key Laboratory of Crop Genomics and Molecular Breeding/Key Laboratory of Plant Functional Genomics of the Ministry of Education/Jiangsu Key Laboratory of Crop Genetics and Physiology, Yangzhou University, Yangzhou 225009, China
2
Joint International Research Laboratory of Agriculture and Agri-Product Safety, The Ministry of Education of China, Yangzhou University, Yangzhou 225009, China
3
Jiangsu Co-Innovation Center for Modern Production Technology of Grain Crops, Yangzhou University, Yangzhou 225009, China
4
Institute of Agricultural Sciences for Lixiahe Region in Jiangsu, Yangzhou 225009, China
5
College of Bioscience and Biotechnology, Yangzhou University, Yangzhou 225009, China
6
Institute of Crops and Nuclear Technology Utilization, Zhejiang Academy of Agricultural Sciences, Hangzhou 310021, China
*
Authors to whom correspondence should be addressed.
Int. J. Mol. Sci. 2024, 25(17), 9452; https://doi.org/10.3390/ijms25179452
Submission received: 22 July 2024 / Revised: 26 August 2024 / Accepted: 28 August 2024 / Published: 30 August 2024
(This article belongs to the Special Issue Omics Study to Uncover Signalling and Gene Regulation in Plants 2.0)

Abstract

:
Fusarium head blight (FHB), caused by the Fusarium graminearum species complex, is a destructive disease in wheat worldwide. The lack of FHB-resistant germplasm is a barrier in wheat breeding for resistance to FHB. Thinopyrum elongatum is an important relative that has been successfully used for the genetic improvement of wheat. In this study, a translocation line, YNM158, with the YM158 genetic background carrying a fragment of diploid Th. elongatum 7EL chromosome created using 60Co-γ radiation, showed high resistance to FHB under both field and greenhouse conditions. Transcriptome analysis confirmed that the horizontal transfer gene, encoding glutathione S-transferase (GST), is an important contributor to FHB resistance in the pathogen infection stage, whereas the 7EL chromosome fragment carries other genes regulated by F. graminearum during the colonization stage. Introgression of the 7EL fragment affected the expression of wheat genes that were enriched in resistance pathways, including the phosphatidylinositol signaling system, protein processing in the endoplasmic reticulum, plant–pathogen interaction, and the mitogen-activated protein kinase (MAPK) signaling pathway at different stages after F. graminearium infection. This study provides a novel germplasm for wheat resistance to FHB and new insights into the molecular mechanisms of wheat resistance to FHB.

1. Introduction

Fusarium head blight (FHB) is a primary disease caused by pathogens such as F. asiaticum and F. graminearium, which seriously affects the yield and quality of wheat worldwide. In addition to causing a substantial reduction in yield, FHB leads to the accumulation of the toxin, deoxynivalenol (DON), in the seeds of infected wheat, which poses a risk to food safety. With global warming and changes in farming systems and practices, there is a tendency to expand the occurrence of wheat FHB; the cultivation of FHB-resistant varieties is a fundamental way to reduce this damage. However, the sources of resistance to wheat FHB are relatively limited. There are only eight quantitative trait loci (QTLs) (Fhb1 to Fhb8) related to FHB resistance, including Fhb1 from chromosome 3BS and Fhb2 from chromosome 6BS of Sumai3 [1,2], Fhb4 from chromosome 4B, Fhb5 from chromosome 5A, and Fhb8 from chromosome 7D of Wangshuibai [3,4,5]. Fhb1 is recognized as the most stable master-effect QTL for FHB-resistance expansion and is widely used in wheat breeding for FHB resistance. Furthermore, QTLs are also found in wheat relatives, such as Fhb3 from Leymus racemosus [6], Fhb6 from Elymus tsukushiensi [7], and Fhb7 from Thinopyrum ponticum [8,9].
As a close relative of wheat, tall wheatgrass has many important favorable traits that represent a valuable source of alien gene resources for wheat. There are three tall wheatgrass species in nature: Th. elongatum (diploid, 2n = 2x = 14; EeEe), Th. scirpeum (tetraploid, 2n = 4x = 28; EeEeEbEb), and Th. ponticum (decaploid, 2n = 10x = 70; EeEeEbEbExExStStStSt). There is no scientific conclusion on the evolutionary process of polyploidy in the family of Thinopyrum, but it is believed that many interspecific hybridizations and natural doubling of chromosomes occur during the evolutionary process of tall wheatgrass, which is similar to the situation in common wheat [10]. As tall wheatgrass has strong resistance to wheat FHB, breeders have constructed wheatgrass chromosome addition, and substitution lines and other genetic materials by distant hybridization using Th. elongatum and Th. ponticum, and obtained the results related to FHB resistance. For example, Jauhar et al. created 1E addition lines, 1E(1A) and 1E(1B) diploid substitution lines by crossing durum wheat with diploid Th. elongatum, and found that the 1E chromosome of the diploid Th. elongatum may carry FHB-resistant genes [11,12]. Liu et al. [13] obtained a disomic alien addition line by using a pair of 7E Th. scirpeum chromosomes by hybridization of durum cultivar, “Langdon”, with the amphiploid 8801 (2n = 6x = 42, AABBEE) and found this addition line showed high resistance to FHB. Shen et al. [14] identified strong FHB resistance in the Chinese Spring Th. elongatum substitution lines, 7E(7A), 7E(7B), 7E(7D), and the Thatcher-Th. ponticum substitution line, 7el2(7D).
The FHB resistance locus, FhbLoP, was mapped to the distal region of the long arm of chromosome 7E in Th. ponticum within a 3.71 cm interval flanked by Xcfa2240 and Xswes19, accounting for 30.46% of the phenotypic variance [15]. This locus was designated as Fhb7 and fine-mapped at a 1.7 cm interval [8]. Subsequently, the Fhb7 gene was successfully cloned from Th. ponticum 7el2 by assembling the genome of diploid Th. elongatum [9]. The authors demonstrated this gene encoded a glutathione S-transferase (GST), which can open the epoxy group of the DON toxin and catalyze the formation of glutathione adduct (DON-GSH), resulting in detoxification and anti-FHB effects. However, Guo et al. [16] discovered that some wheat-Thinopyrum derivatives carrying Fhb7 homologs reacted differently in FHB resistance. Similar results have been observed in transgenic plants overexpressing GST-encoding Fhb7 [17]. Regardless of the species (Th. elongatum, Th. scirpeum or Th. ponticum), FHB-resistance sites have been reported on homologous group seven of the E genome, which can be used in wheat FHB resistance breeding [13,18]. For example, Zhang et al. [19] incorporated a novel Fhb7 allele, Fhb7The2, into the wheat B genome through a small 7B–7E translocation (7BS·7BL–7EL) involving the terminal regions of the long arms, making this novel FHB resistance allele usable for breeding in both common and durum wheat.
It is well known that the introduction of chromosomes from wild species into wheat usually results in linkage drag of undesirable genes, which limits their application. In wheat genetic improvement, breeding translocation lines carrying alien beneficial genes, especially small fragment translocation lines, can reduce the linkage caused by alien chromosomes and provide high genetic stability under a common wheat genetic background. Therefore, in this study, we aim to obtain translocation lines with different sizes of 7EL chromosome fragment, develop a stable inherited translocation line with FHB resistance, evaluate the application of translocation lines in wheat breeding for FHB resistance, explore potential disease resistance genes, and analyze the disease resistance pathways in translocation lines using transcriptome analysis. The results not only provide a new germplasm for wheat FHB resistance breeding but also a theoretical basis for studying the resistance mechanism of wheat FHB.

2. Results

2.1. Establishment of a Wheat-Th. elongatum 7EL Chromosome Translocation Line YNM158 with FHB Resistance

In order to reduce the negative effects of linkage drag by the alien chromosomes, the male gamete irradiation of T7BS·7EL was used to produce chromosomal aberrations. A total of 94 F1 plants derived from the cross between common wheat, YM158, and male gamete-irradiated T7BS·7EL were obtained. By genomic in situ hybridization (GISH), 12 F1 plants were found to have chromosomal aberrations involving 7EL and were selected for backcrossing with YM158. Finally, a line with stable agronomic characteristics was obtained from the BC1F6 generation, which was named YNM158 (Figure 1A). The root-tip cells of YNM158 at mitotic metaphase were analyzed using GISH and fluorescence in situ hybridization (FISH). First, the presence of the translocated chromosome pair was confirmed in YNM158 using GISH (Figure 1B). Chromosomal structural variation was observed at the end of the 4BS chromosome according to the standard karyotype of the CS (Figure 1C). Finally, the translocation chromosome was represented as T7EL–4BS·4BL.
The FHB resistance of YNM158 over two consecutive years showed that YNM158 had high resistance to FHB in both field and greenhouse studies and there was no marked difference in the percentage of diseased spikelets between YNM158 and Sumai3 (SU3) (Figure 1D and Table 1). Moreover, almost no differences in the tested agronomic traits, including spike length, number of grains per spike, number of spikelets, and grain width, were observed over two consecutive years (Figure 1E). Plant height, thousand kernel weight, and grain length of YNM158 were substantially different from those of YM158 at one year (Figure 1E). However, the flag leaf area of YNM158 was smaller than that of YM158 over two consecutive years (Figure 1E).

2.2. RNA-Sequencing (RNA-Seq) Data Quality, Assembly, and Annotation of YNM158 and YM158

To analyze the genes associated with FHB resistance on chromosome 7EL in YNM158, RNA-seq-based transcriptome profiling was performed on spikes inoculated with F0609. After filtering out the rRNAs and low-quality reads, a total of 193.57 GB of high-quality clean data were obtained from 24 libraries (BioProject ID: PRJNA1011388), with an average of 80.65 GB of clean data per library. The Q20 and Q30 values were >97% and >93%, respectively. In addition, the GC content was 48.86–52.53% in all samples.
After assembly, the clean reads were mapped to wheat and Th. elongatum reference genomes (Chinese Spring v2.1 and Th. elongatum v1.0). On average, 91.17% of reads were successfully aligned to the reference genome (Table S1). Therefore, these analyses indicated that the quality of the RNA-seq data was high and the sequencing depth was sufficient for further analysis.
To investigate the impact of chromosomal translocations on gene expression, RNA-seq-based transcriptome profiling was performed on the wheat variety, YM158, which is one of the parents of YNM158. In this study, cDNA libraries (24 cDNA libraries) of YM158 were constructed at different times after F. graminearum infection. After filtering out the rRNAs and low-quality reads, a total of 188.56 GB of high-quality clean data were obtained from 24 libraries (BioProject ID: PRJNA1011388), with an average of 78.57 GB clean data per library. The Q20 and Q30 values were >97% and >94%, respectively. After assembly, clean reads were mapped to the wheat reference genome (Chinese Spring v2.1). On average, 89.31% of the reads were successfully aligned to the reference genome (Table S1). Therefore, these analyses indicated that the quality of the RNA-seq data was high and the sequencing depth was sufficient for further analysis.

2.3. Identification of the Differentially Expressed Genes (DEGs) on Chromosome 7EL Post Inoculation with F. graminearum

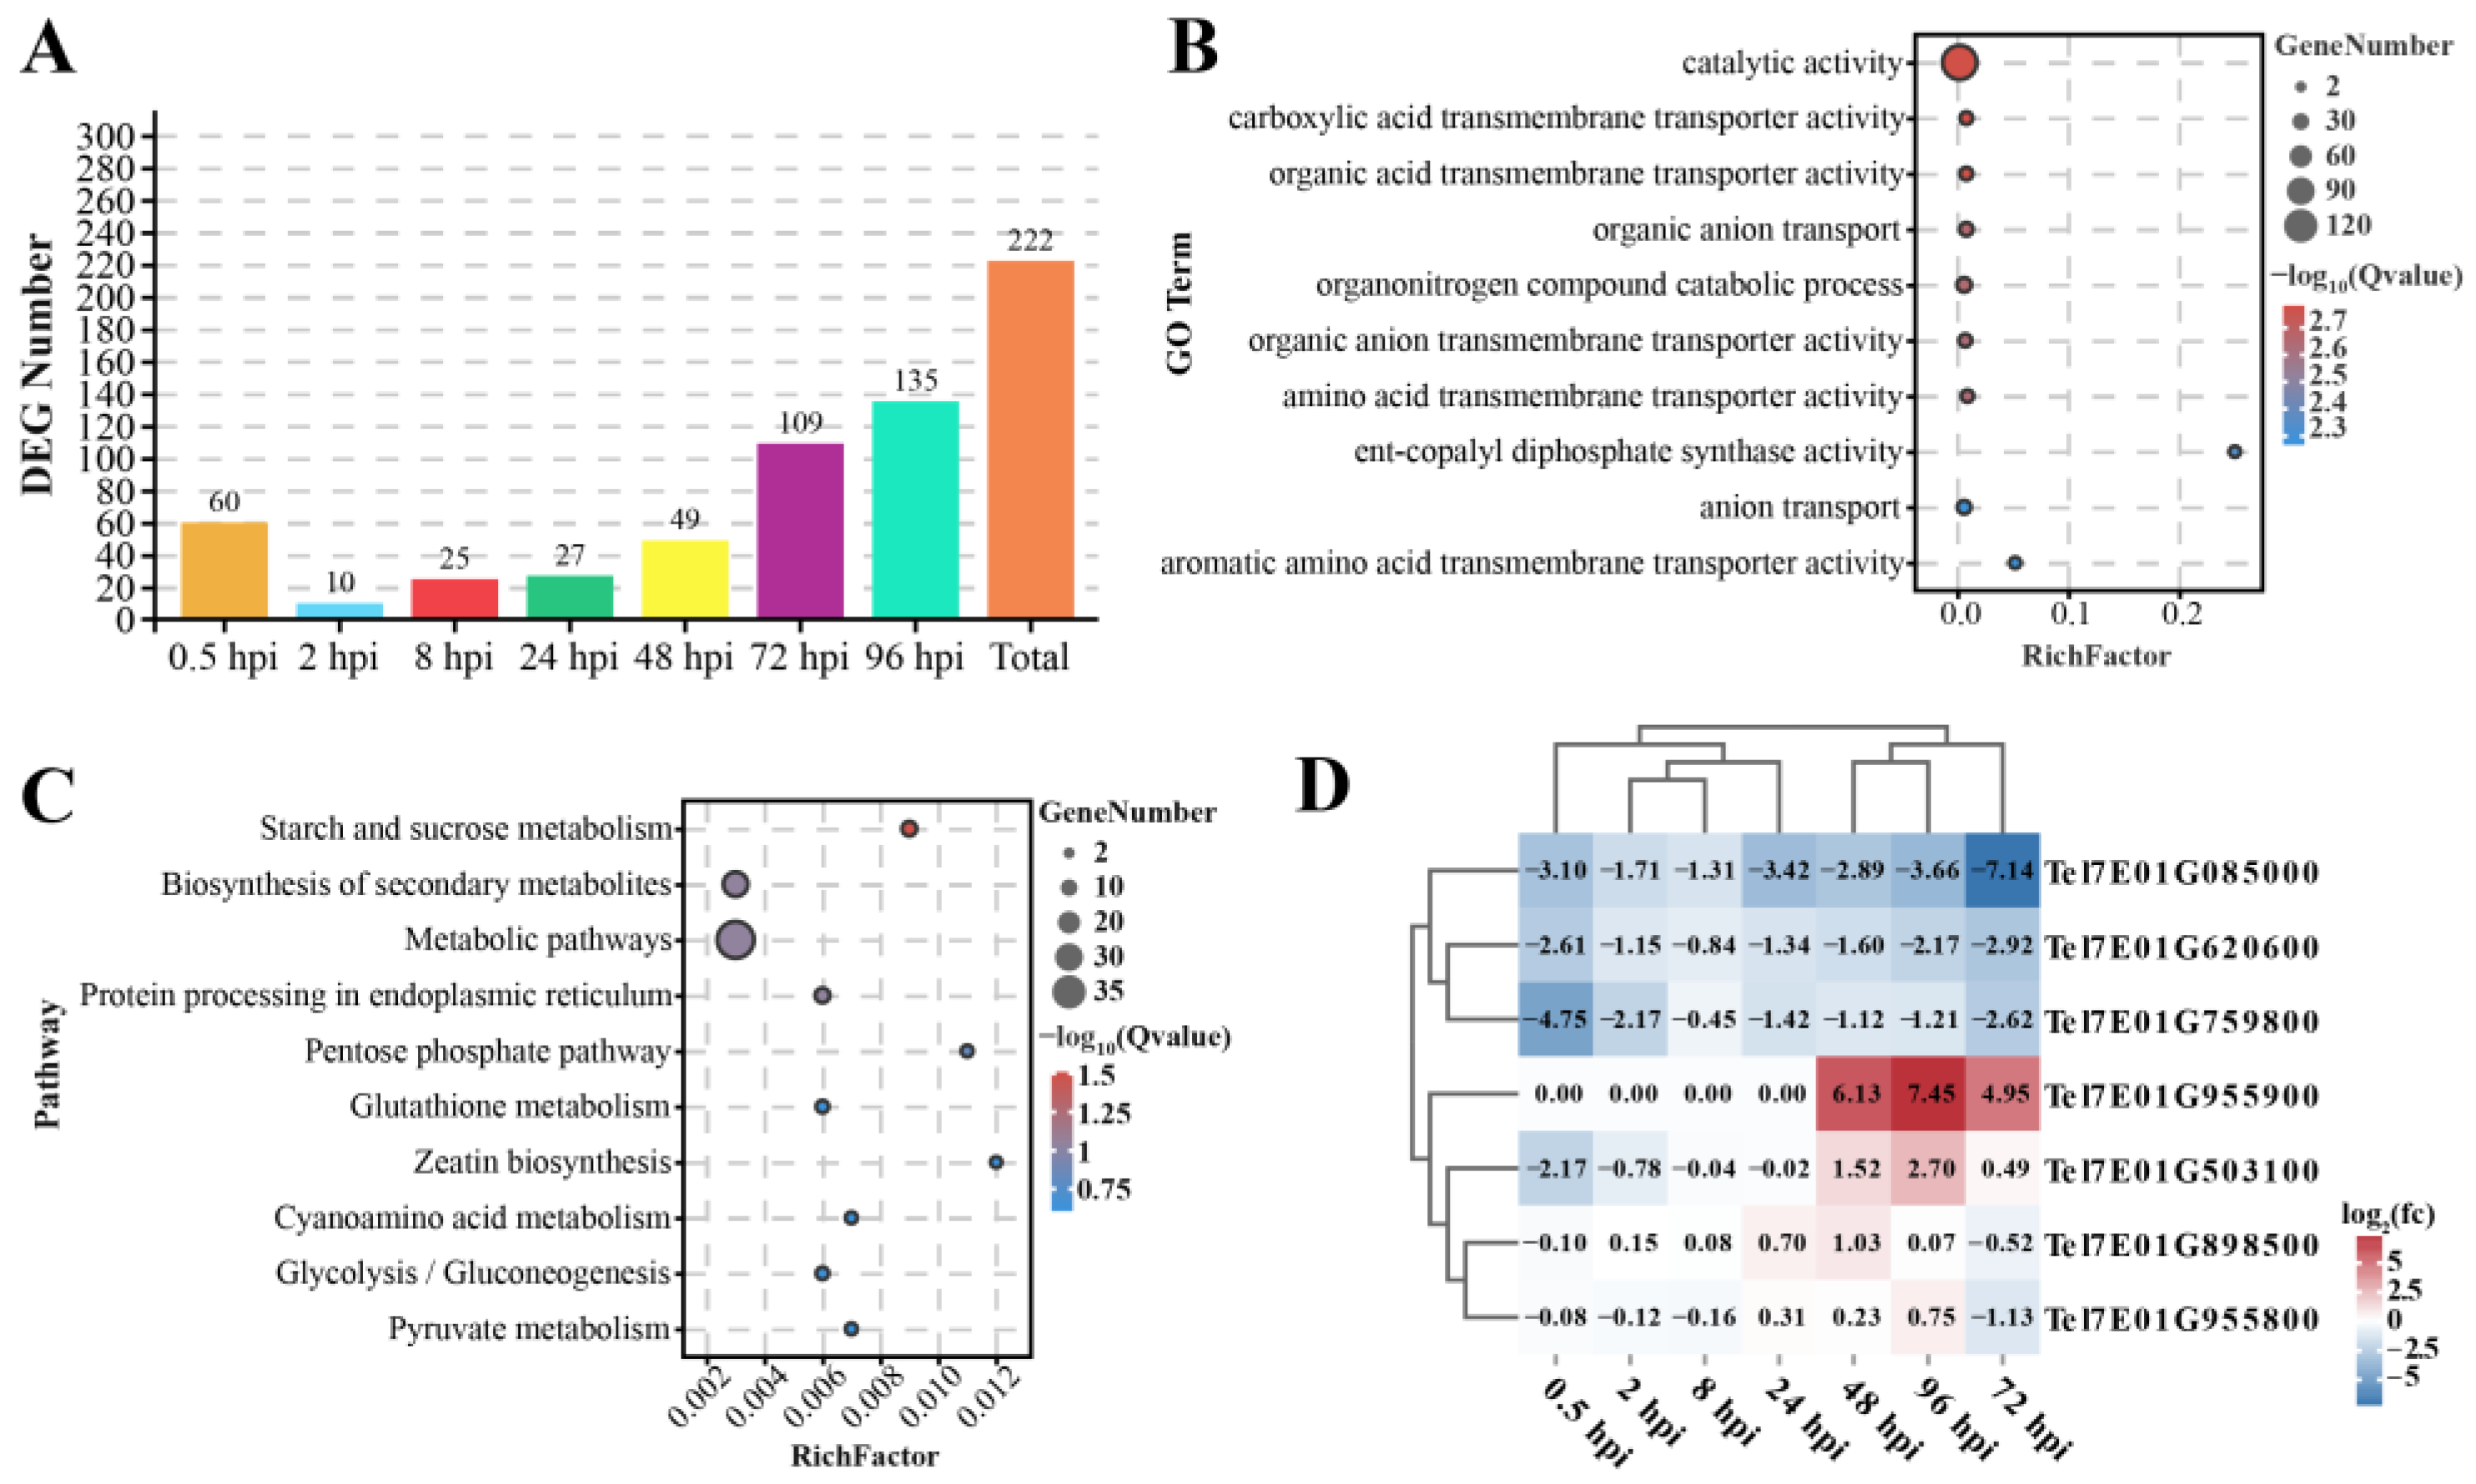
Using the criteria of false discovery rate (FDR) < 0.05 and |log2 (fold change)| > 1, a total of 32,102 DEGs that substantially responded to F. graminearum infection at different times in YNM158 were detected, of which 222 DEGs were located on the 7EL chromosome (Table S2). A total of 222 DEGs were analyzed. And a total of, 60, 10, 25, 27, 49, 109, and 135 DEGs at 0.5, 2, 8, 24, 48, 72, and 96 hpi, respectively, were identified (Figure 2A). Gene Ontology (GO) function enrichment analysis indicated that these DEGs were enriched in catalytic, carboxylic acid transmembrane transporter, and organic acid transmembrane transporter activity in terms of molecular function. In total, 124 DEGs were enriched in catalytic activity (Figure 2B and Table S3). In terms of biological processes, organic anion transport, organonitrogen compound catabolic processes, and anion transport were the main roles of the enriched genes. Of these, the organonitrogen compound catabolic process had the most enriched DEGs, with a total of 18 (Figure 2B and Table S3). The top 10 GO terms with the lowest Q values were selected to draw a scatter diagram of the enrichment items (Figure 2B).
Kyoto Encyclopedia of Genes and Genomes (KEGG) pathway analysis revealed that the starch and sucrose metabolism pathway is the only one with the Q value less than 0.05 (Figure 2C, Table S4). Moreover, the heatmap of the DEGs enriched in this pathway showed the expression levels of these genes were down-regulated after infection with F. graminearum, especially in the first 8 h after infection (Figure 2D). The top 10 pathways with the lowest Q value were selected to draw the scatter diagram of enrichment items in Figure 2C.

2.4. Gene Expression Patterns Analysis of DGEs on Chromosome 7EL at Different Infection Time Points

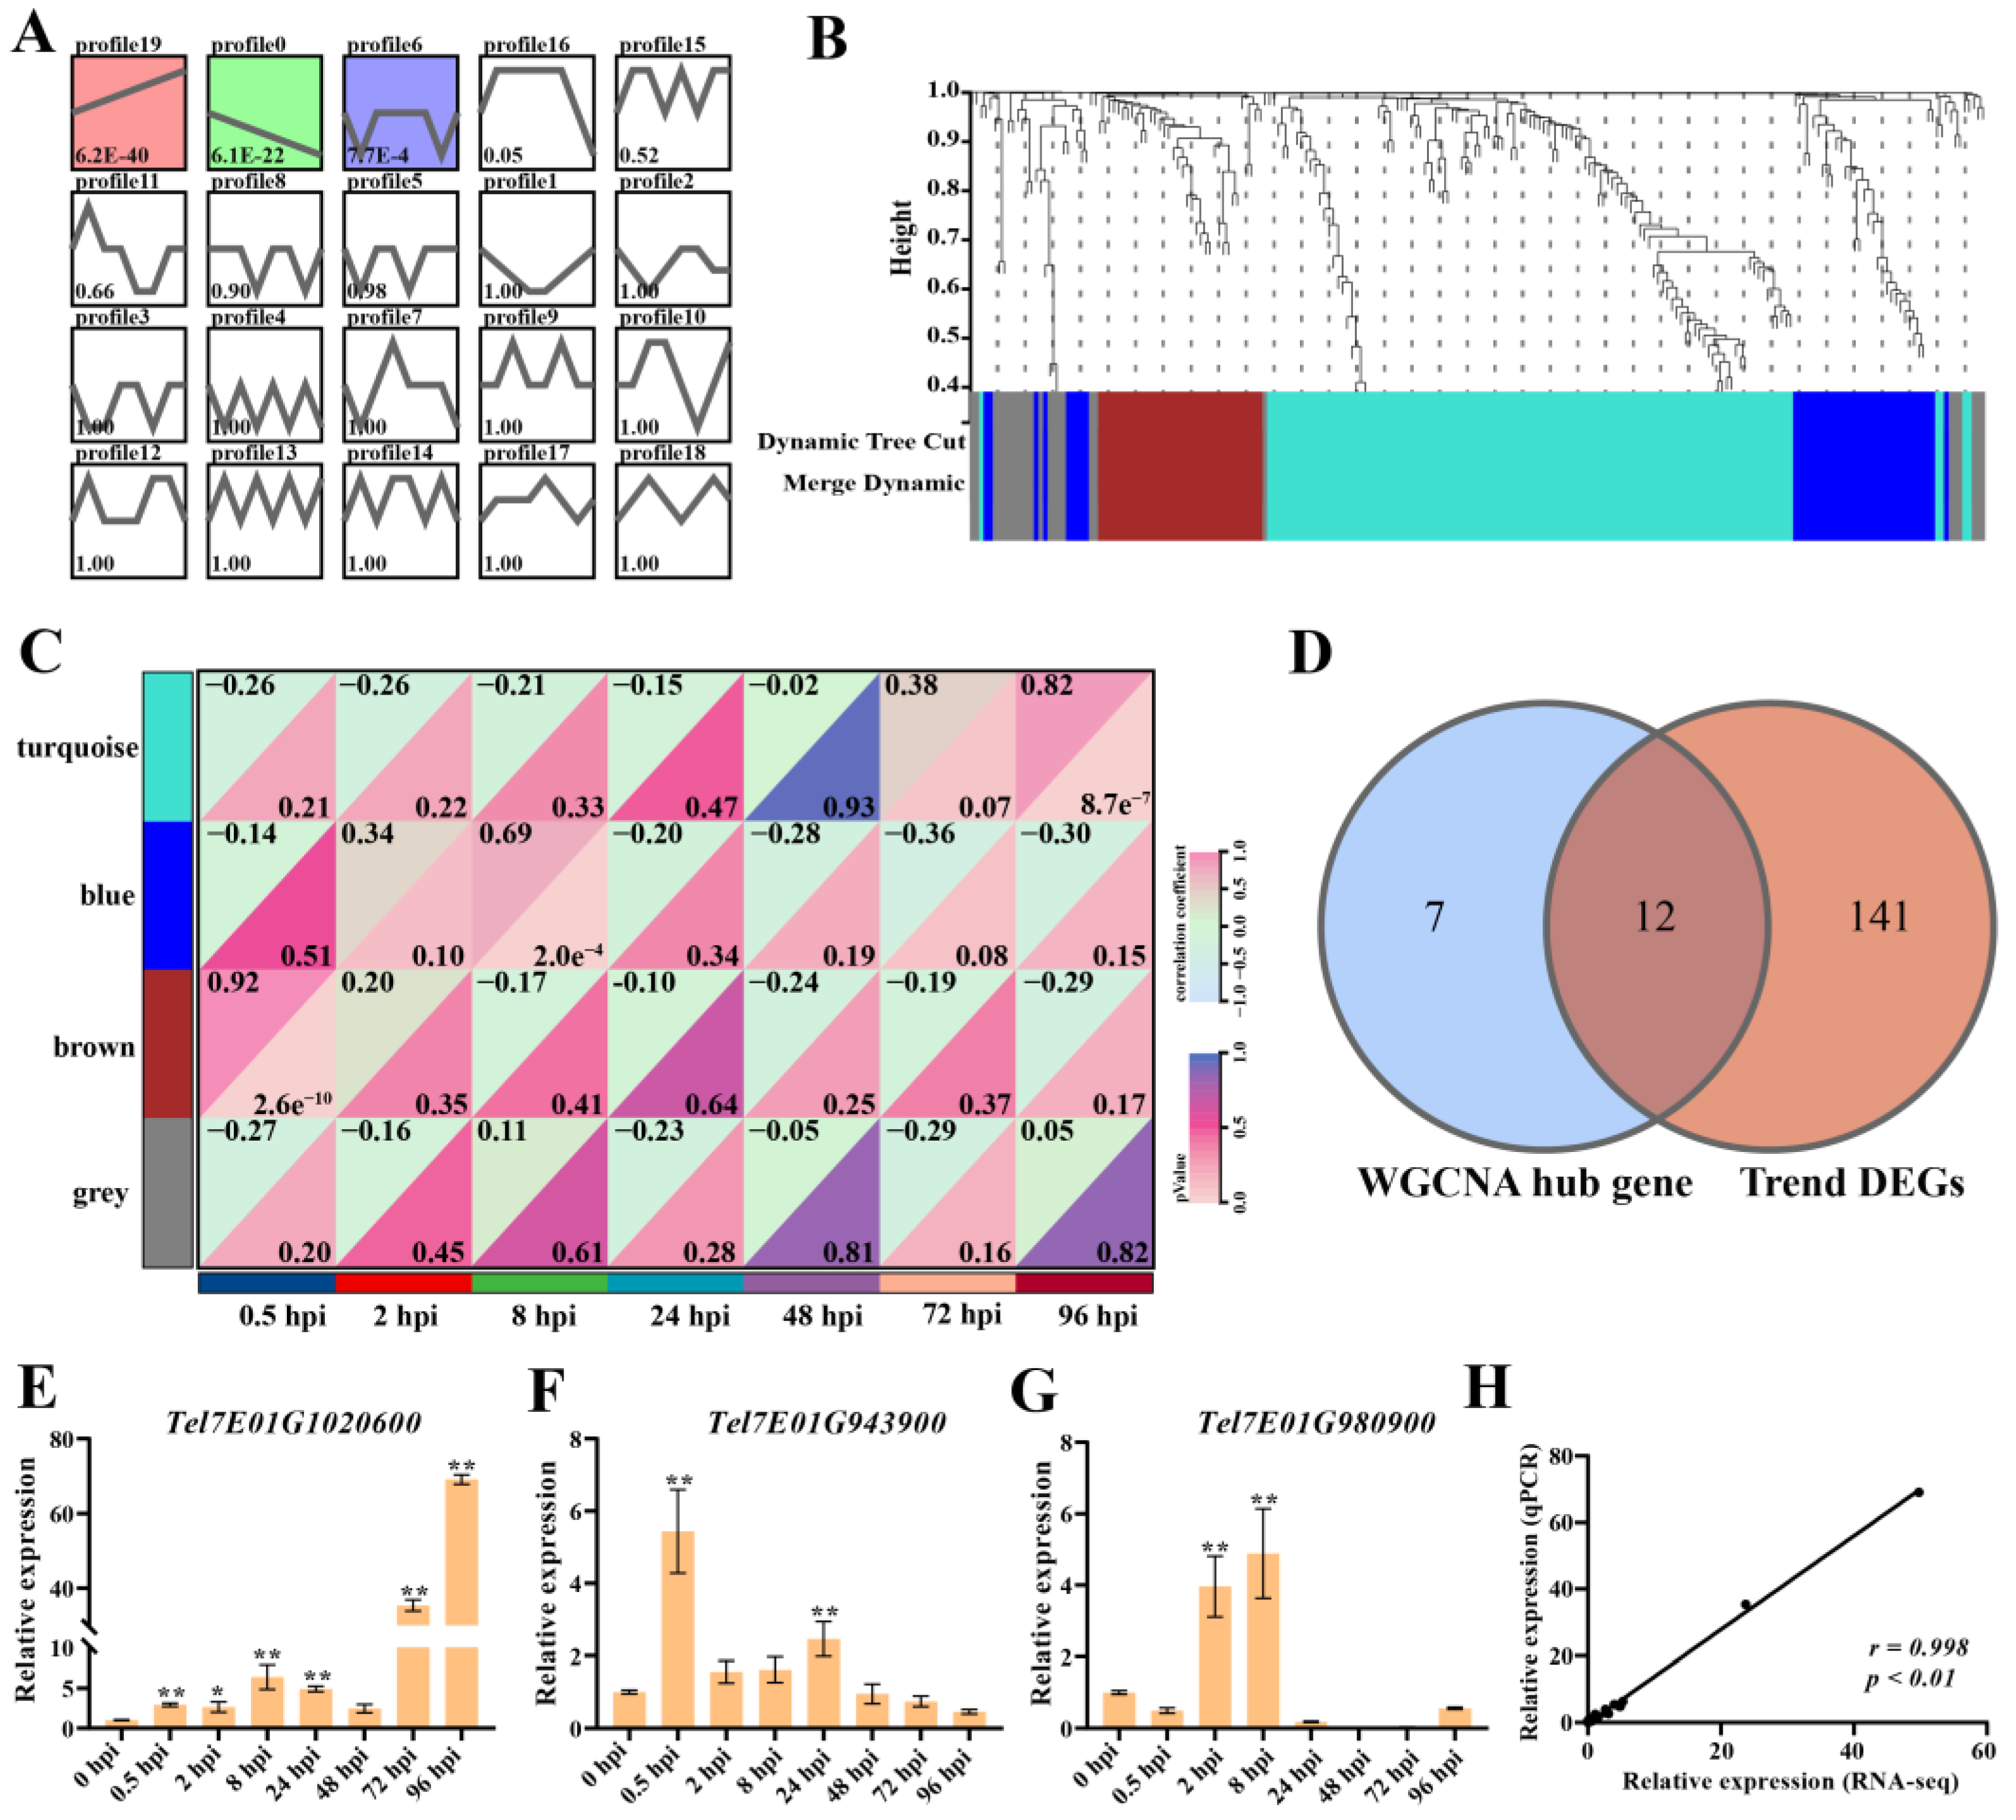
The analysis of the 222 DEGs on chromosome 7EL showed that the DEGs were clustered into 20 profiles, of which 153 DEGs were clustered to three profiles (profile 19, 0, and 6) on the basis of (p-value ˂ 0.05, Figure 3A and Table S5). Of these, 77 genes tended to increase with infection time (profile 19), and 56 genes decreased (profile 0).
In addition, 222 DEGs were analyzed using weighted gene co-expression network analysis (WGCNA) modules associated with infection time. The selection of a soft threshold (power) is a key step in network construction. When the soft threshold was set to 10 with a scale-free network-fitting index of R2 > 0.80, the average connectivity was close to zero (Figure S1A). A hierarchical cluster tree was drawn based on the optimal soft threshold, and genes clustered in the same branch were divided into the same module. Finally, four modules (turquoise, blue, brown, and gray) were obtained (Figure S1B). Of them, the brown module was correlated with infection at 0.5 hpi (R = 0.92, p ≤ 0.05), the turquoise module was correlated with infection at 8 hpi (R = 0.82, p ≤ 0.05), and the blue module was correlated with infection at 96 hpi (R = 0.69, p ≤ 0.05). Based on the cut-off criteria, |module membership| (|MM|) > 0.8, and |gene significance| (|GS|) > 0.8, 19 genes with high connectivity in the clinically significant module were identified as hub genes (Figure 3B,C and Table S6).
DEGs and hub genes obtained from trend analysis and WGCNA, respectively, were used to draw Venn diagrams, and 12 genes were identified in both analyses (Figure 3D and Table 2). The quantitative real-time polymerase chain reaction (qPCR) verification of 12 DEGs showed that the relative expression levels of several genes were induced by F. graminearium, such as Tel7E01G1020600, Tel7E01G943900, and Tel7E01G980900. Among them, Tel7E01G1020600 encoded glutathione S-transferase (GST), whose expression was induced by F. graminearum and strongly upregulated from 72 hpi (Figure 3E).
Tel7E01G943900 and Tel7E01G1980900 showed similar expression patterns and were up-regulated at an early stage of infection. Tel7E01G943900 encodes a receptor-like kinase, and the expression of this gene was up-regulated by approximately five-fold at 0.5 hpi but then began to be downregulated (Figure 3F). Similarly, Tel7E01G1980900 encodes a monosaccharide-sensing protein, and the expression of this gene reached its highest level at 2 hpi, which was approximately four times higher than that at 0 hpi but then was downregulated and showed almost no expression after 24 h of infection (Figure 3G). To verify the accuracy of the results, the correlations between the relative expressions obtained using qPCR and RNA-Seq were compared. The expression profiles of these three genes showed similar patterns in qPCR and RNA-seq (r = 0.998, p < 0.01) (Figure 3H). These results suggest that there may be multiple resistance genes on the chromosome 7EL fragment that provide resistance to FHB at different stages of F. graminearium infection.

2.5. Extraction of Wheat DEGs between YM158 and YNM158 after F. graminearum Infection

As wheat FHB is a compatible disease, Stephens et al. [20] divided the infection process into initial colonization, infection, and late infection stages. In the current study, the introduction of chromosome 7EL fragments on FHB resistance were analyzed using 8 hpi as the cut-off point. We defined the initial colonization stage as before 8 hpi and the infection stage as after 8 hpi. A total of 12,761 and 15,719 DEGs were identified in the initial colonization and infection stages, respectively (Table S7 and Table S8). The DEGs at 0 hpi between YM158 and YNM158 were removed (Table S9). Finally, 4734 DEGs were obtained at the initial stage of colonization (Figure 4A), and 10,489 DEGs were obtained at the stage of infection (Figure 4B). After alignment with the reference genome, 4060 and 9808 wheat DEGs were screened for subsequent analysis at the initial colonization and infection stages, respectively (Figure 4C and Table S10).

2.6. KEGG Pathway Enrichment Analysis of Wheat DEGs at Different Stages

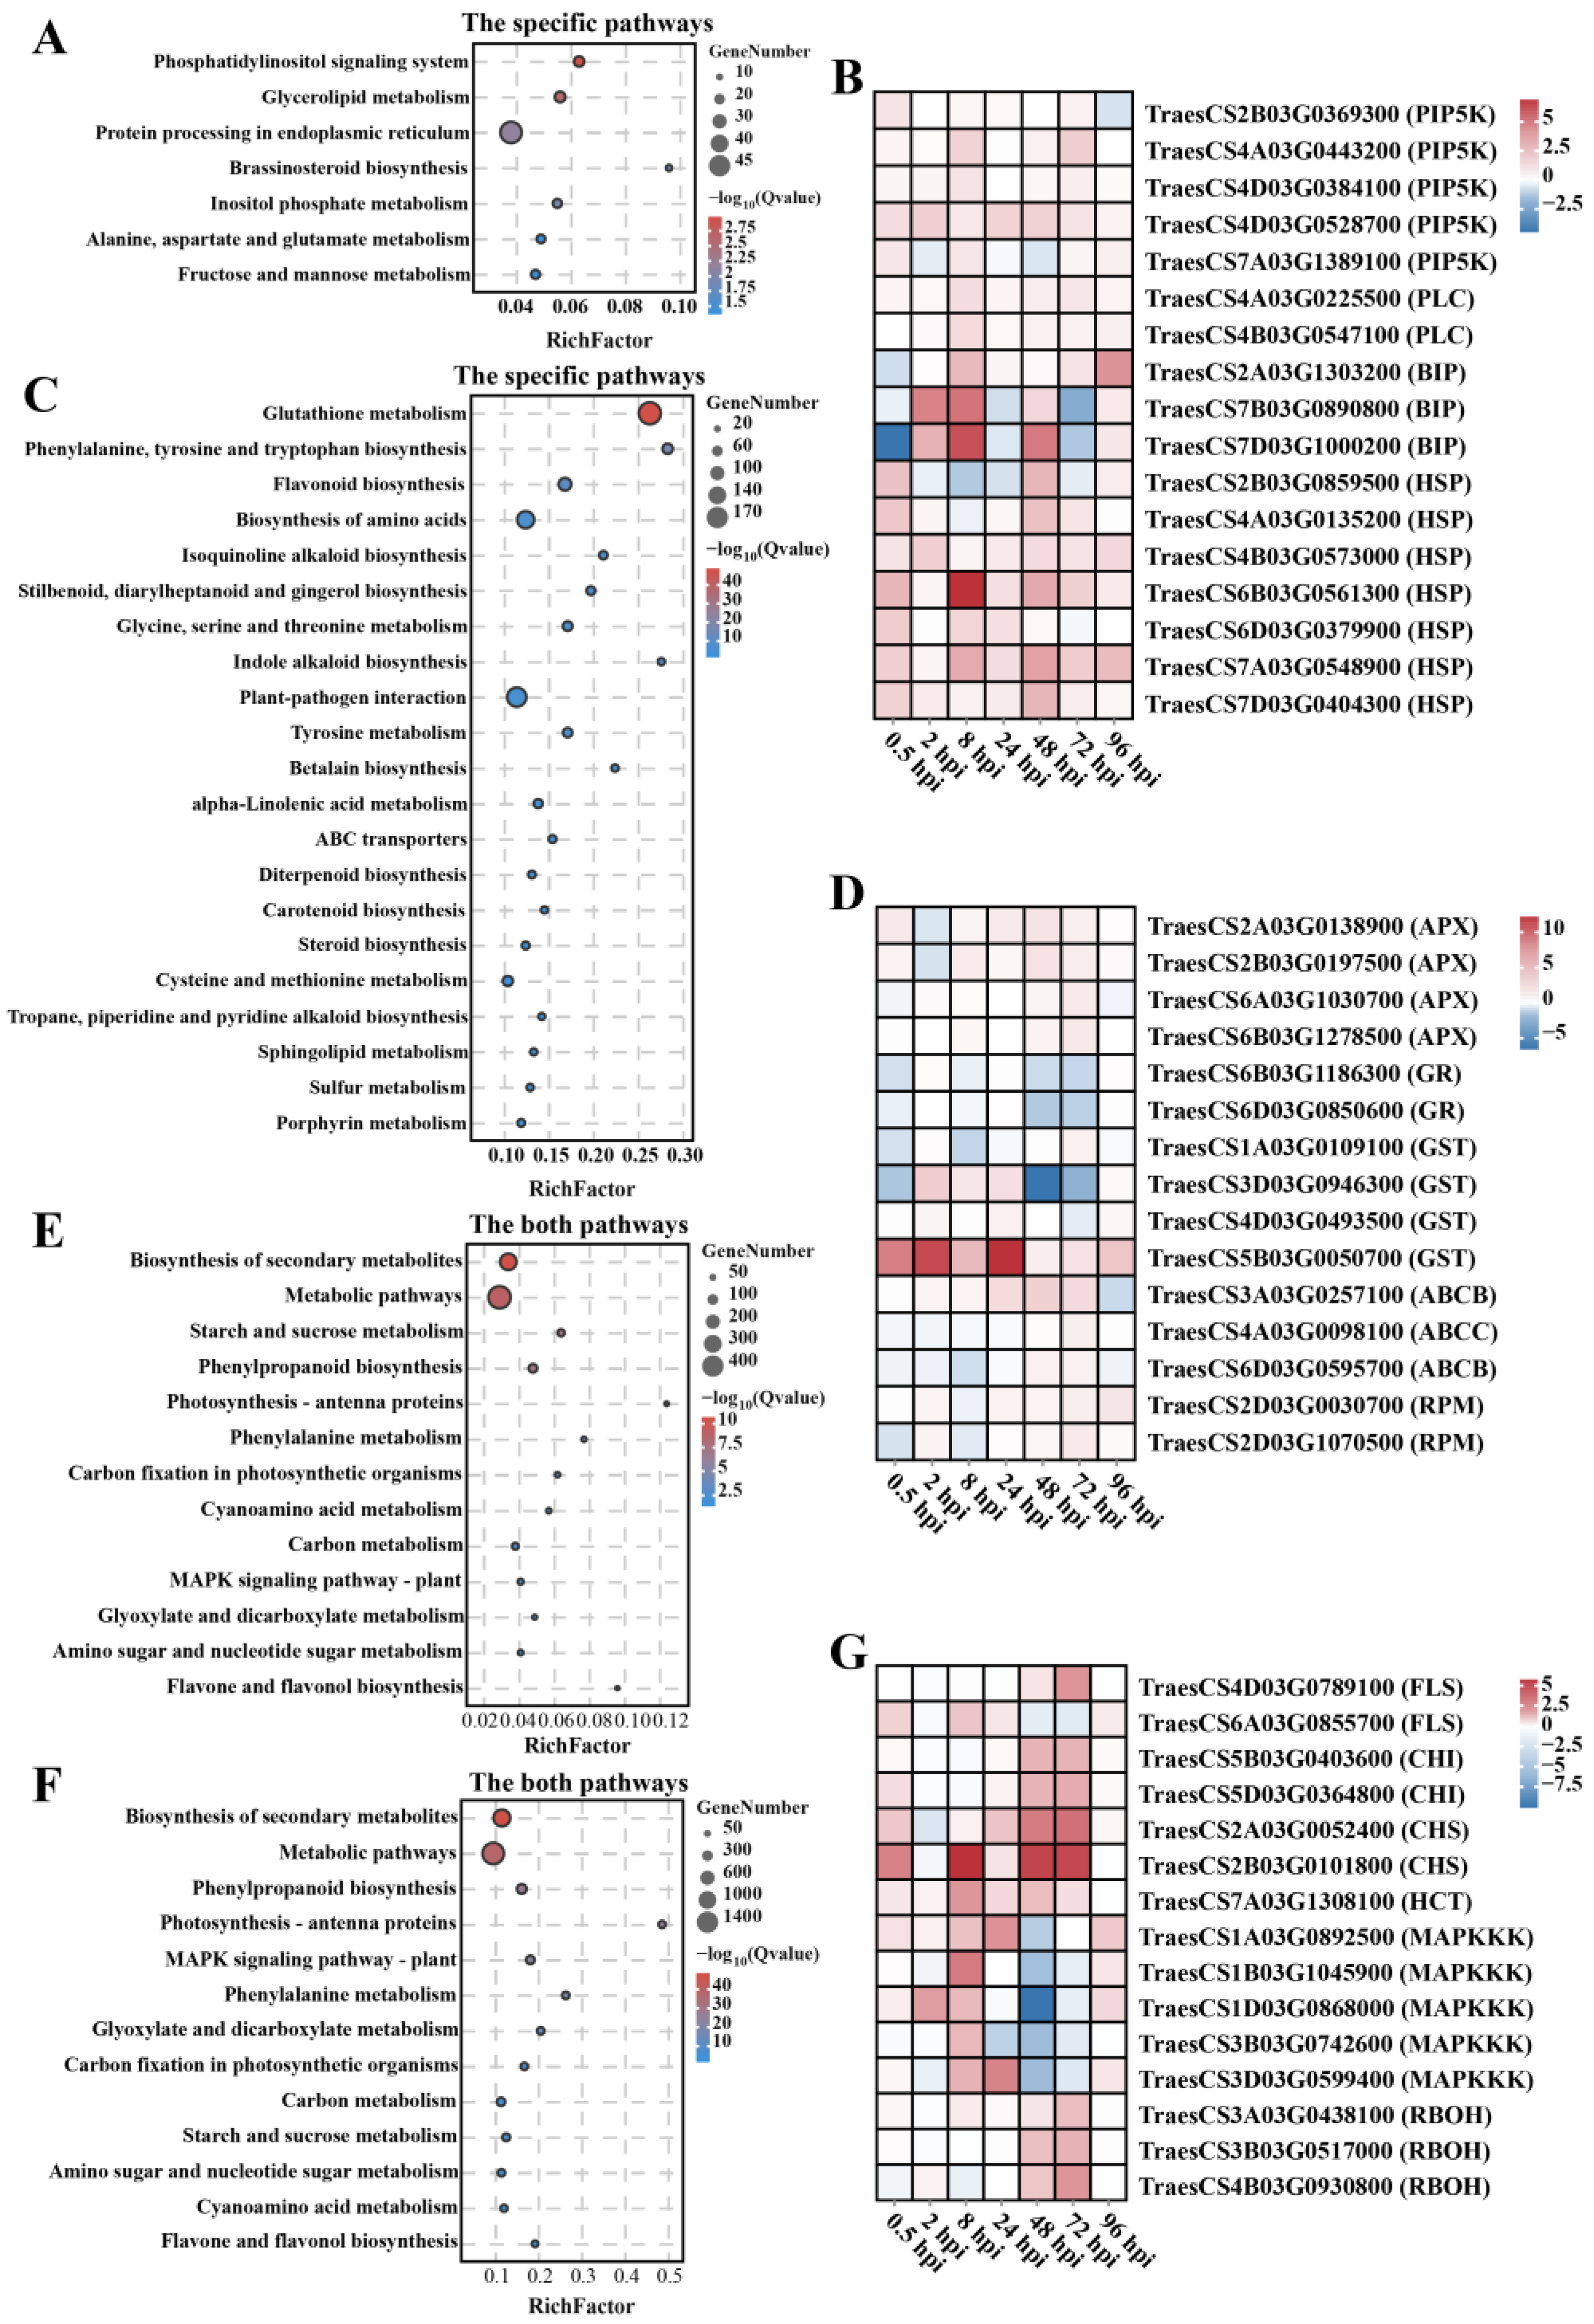
To analyze the effect of chromosome 7EL on the resistance pathway of wheat at different stages of F. graminearum infection, the wheat DEGs were subjected to KEGG pathway enrichment analysis. Seven pathways were identified that were substantially enriched (Q value < 0.05) during the initial colonization stage, of which the phosphatidylinositol-signaling system was the most enriched pathway with the lowest Q value; protein processing in the endoplasmic reticulum pathway was the most enriched pathway with the highest number of DEGs (Figure 5A and Table S11). Further analysis of the genes involved in these pathways revealed that the expression of genes related to phosphatidylinositol 4-phosphate 5-kinase (PIP5K), immunoglobulin-binding protein (BIP4), and heat-shock protein (Hsp) in YNM158 was higher than that in YM158 after F. graminearum infection (Figure 5B).
At the infection stage, 21 specific pathways were substantially enriched (Q value < 0.05). Of them, glutathione metabolism was the pathway with the lowest Q value and the largest number of DEGs (Figure 5C and Table S11). Moreover, genes related to ascorbate peroxidase (APX), glutathione reductase (GR), glutathione-S-transferase (GST) were up-regulated in YNM158 (Figure 5D). The genes related to the ABC transporter (ATP-binding cassette, ABC) were up-regulated in YNM158 (Figure 5D). The plant–pathogen interaction pathway was the second most enriched pathway, with 152 enriched DEGs (Figure 5C). Using a heat map of gene expression, the expression levels of some genes related to hypersensitive response (HR), such as TraesCS2D03G0030700 and TraesCS2D03G1070500, were found to be upregulated at 24 hpi with F. graminearum in YNM158 (Figure 5D).
Secondary metabolites play an important role in plant–pathogen resistance. In this study, 13 pathways were identified in both the initial colonization and infection stages (Q value < 0.05). Of these, the biosynthesis of secondary metabolites was the pathway with the lowest Q value (Figure 5E,F and Table S12). Analysis of gene expression in this pathway revealed that some genes related to flavonol synthase (FLS), chalcone isomerase (CHI), chalcone synthase (CHS), and hydroxycinnamoyl–CoA shikimate (HCT) were up-regulated with increasing F. graminearum infection time in YNM158 (Figure 5G). In the mitogen-activated protein kinase (MAPK) pathway, the expression of some genes related to respiratory burst oxidase (RBOH) was substantially up-regulated after F. graminearum infection, and the expression was the highest at 72 hpi, whereas the expression of some genes related to MAPK were up-regulated at the initial colonization stage and then down-regulated at the infection stage in YNM158 after F. graminearum infection (Figure 5G).

2.7. WGCNA of Wheat DEGs

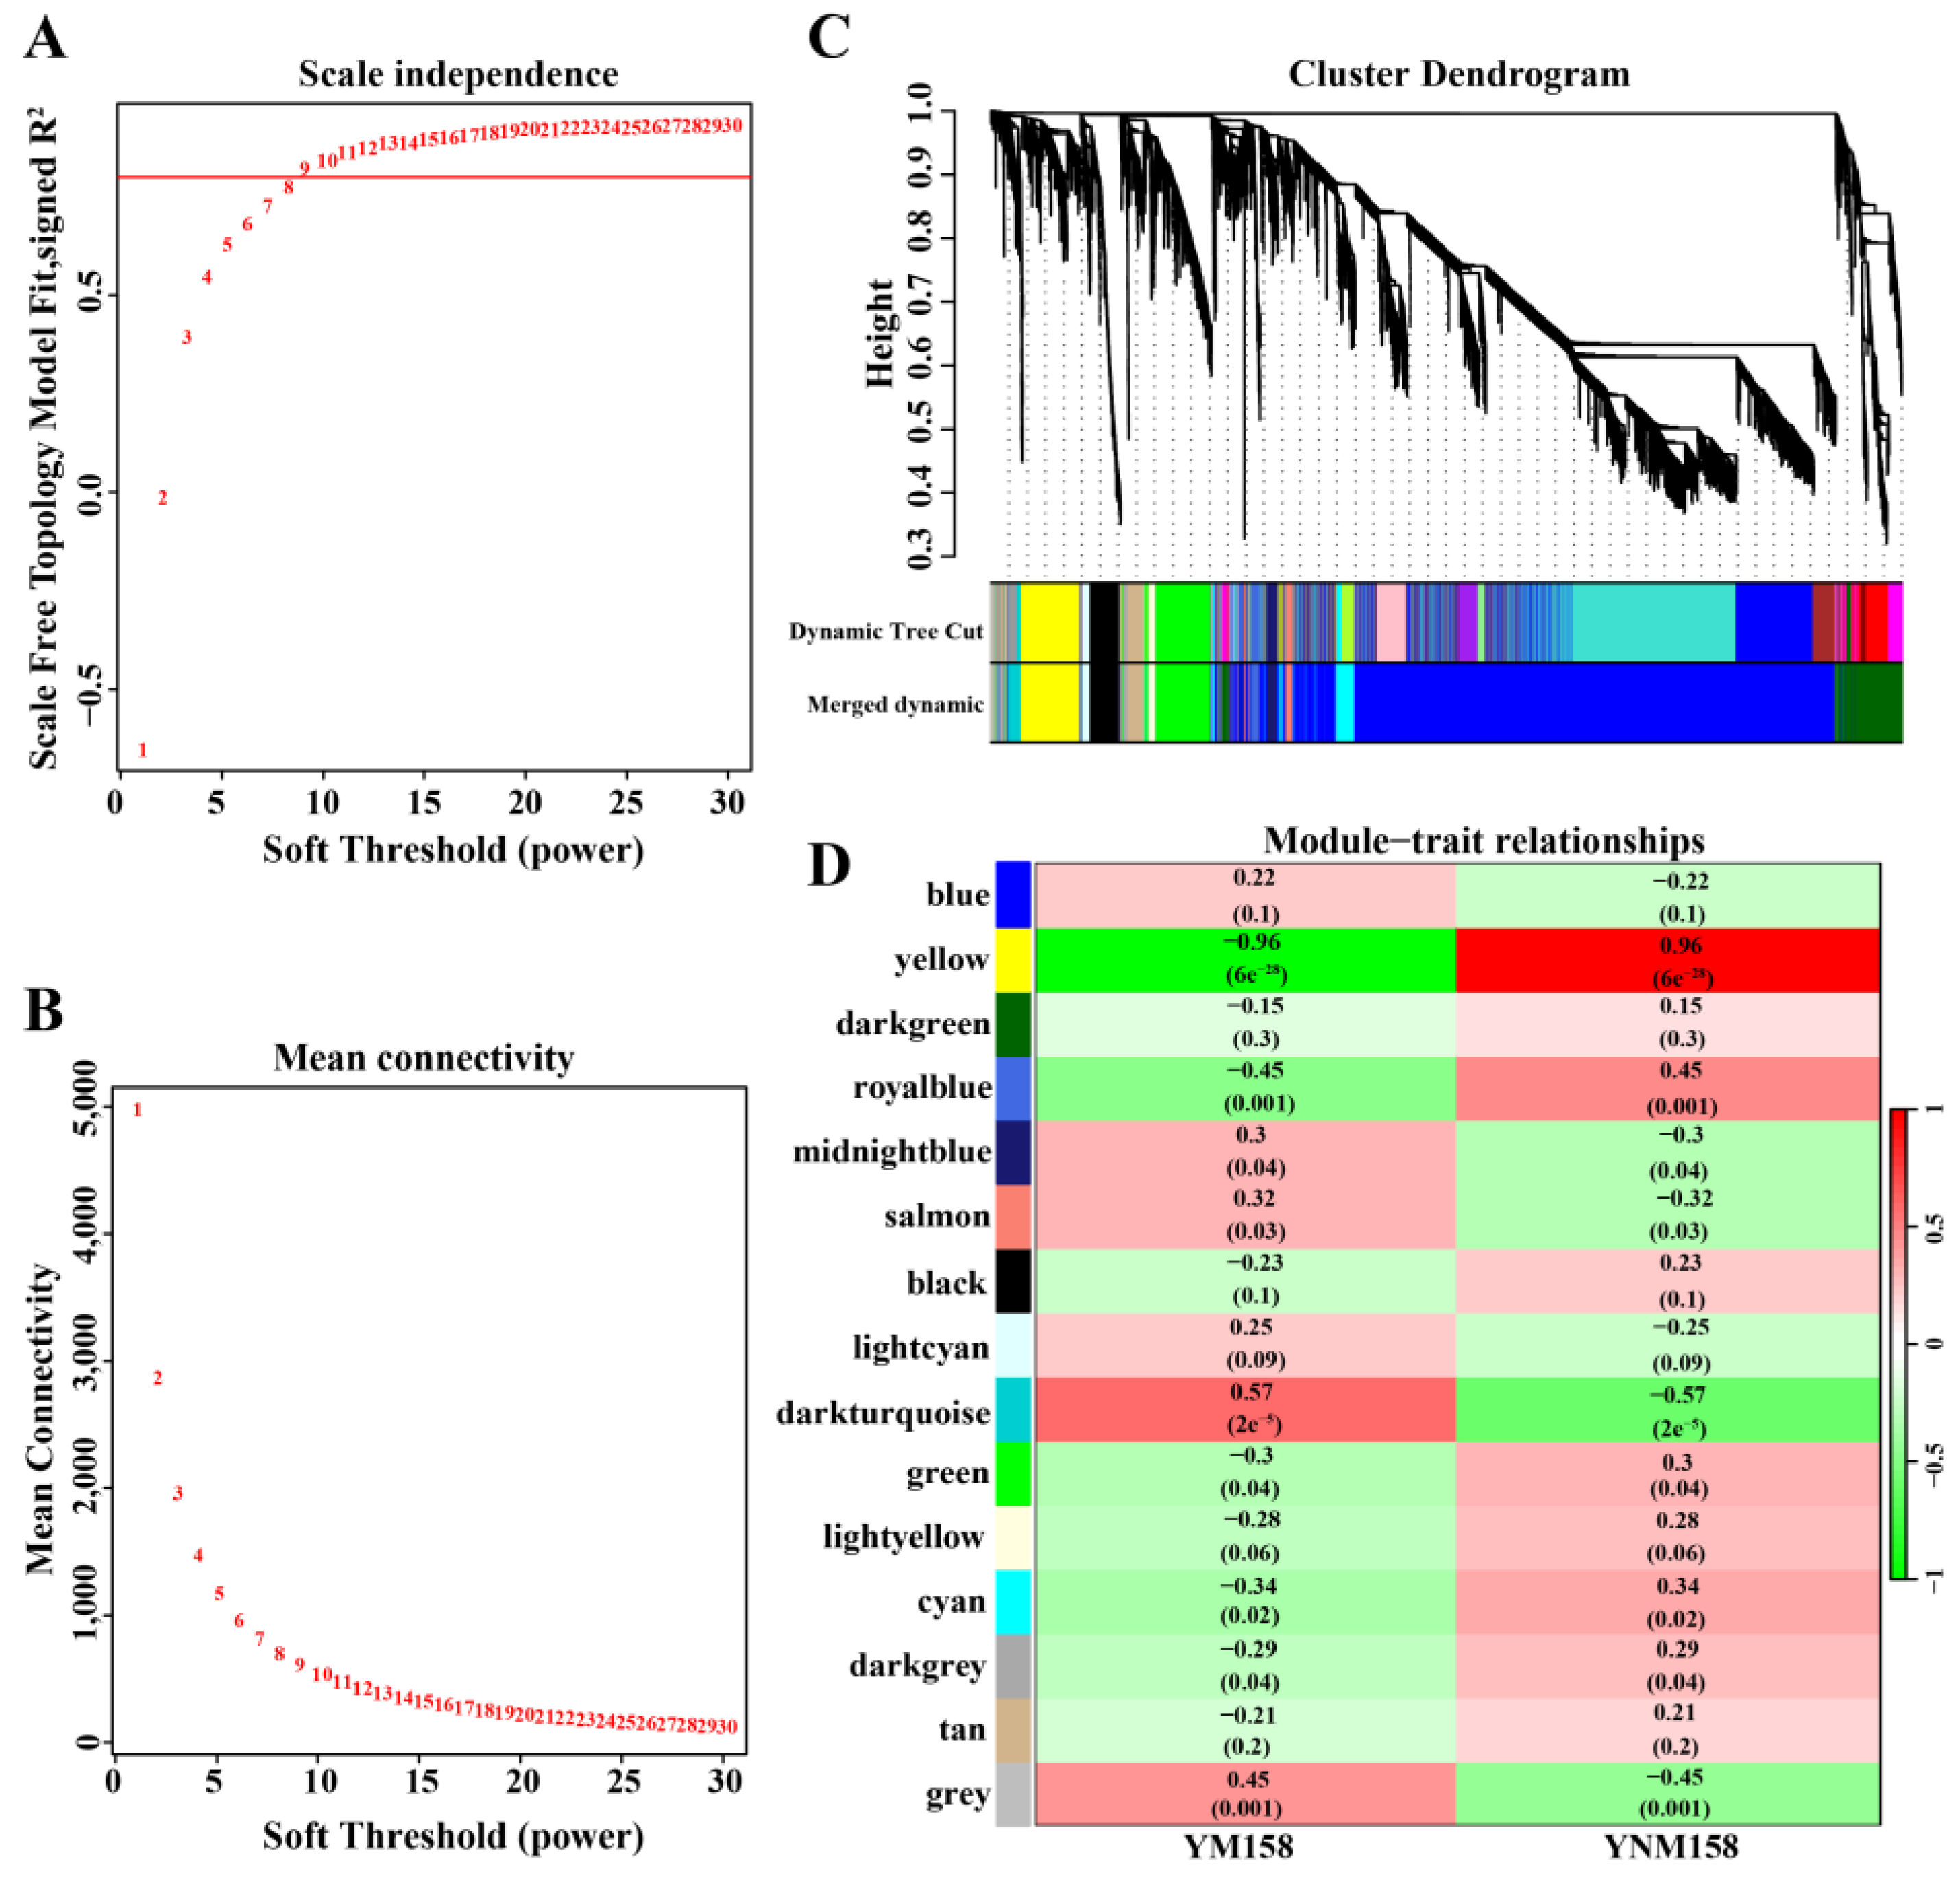
The 12,661 wheat DEGs were analyzed in the WGCNA modules (Table S13). The selection of the soft threshold (power) is a key step in network construction. When the soft threshold was set to nine with a scale-free network-fitting index of R2 > 0.80, the average connectivity was close to zero (Figure 6A,B). A hierarchical cluster tree was drawn based on the optimal soft threshold, and genes clustered in the same branch were divided into the same module (Figure 6C). Finally, 14 modules that were correlated with the varieties were obtained. Of these, the yellow module was positively associated with YNM158 (R = 0.96, p < 0.05), and 847 DEGs were identified in this module (Figure 6D and Table S14).

2.8. Core-Gene Screening at Different Infection Stages

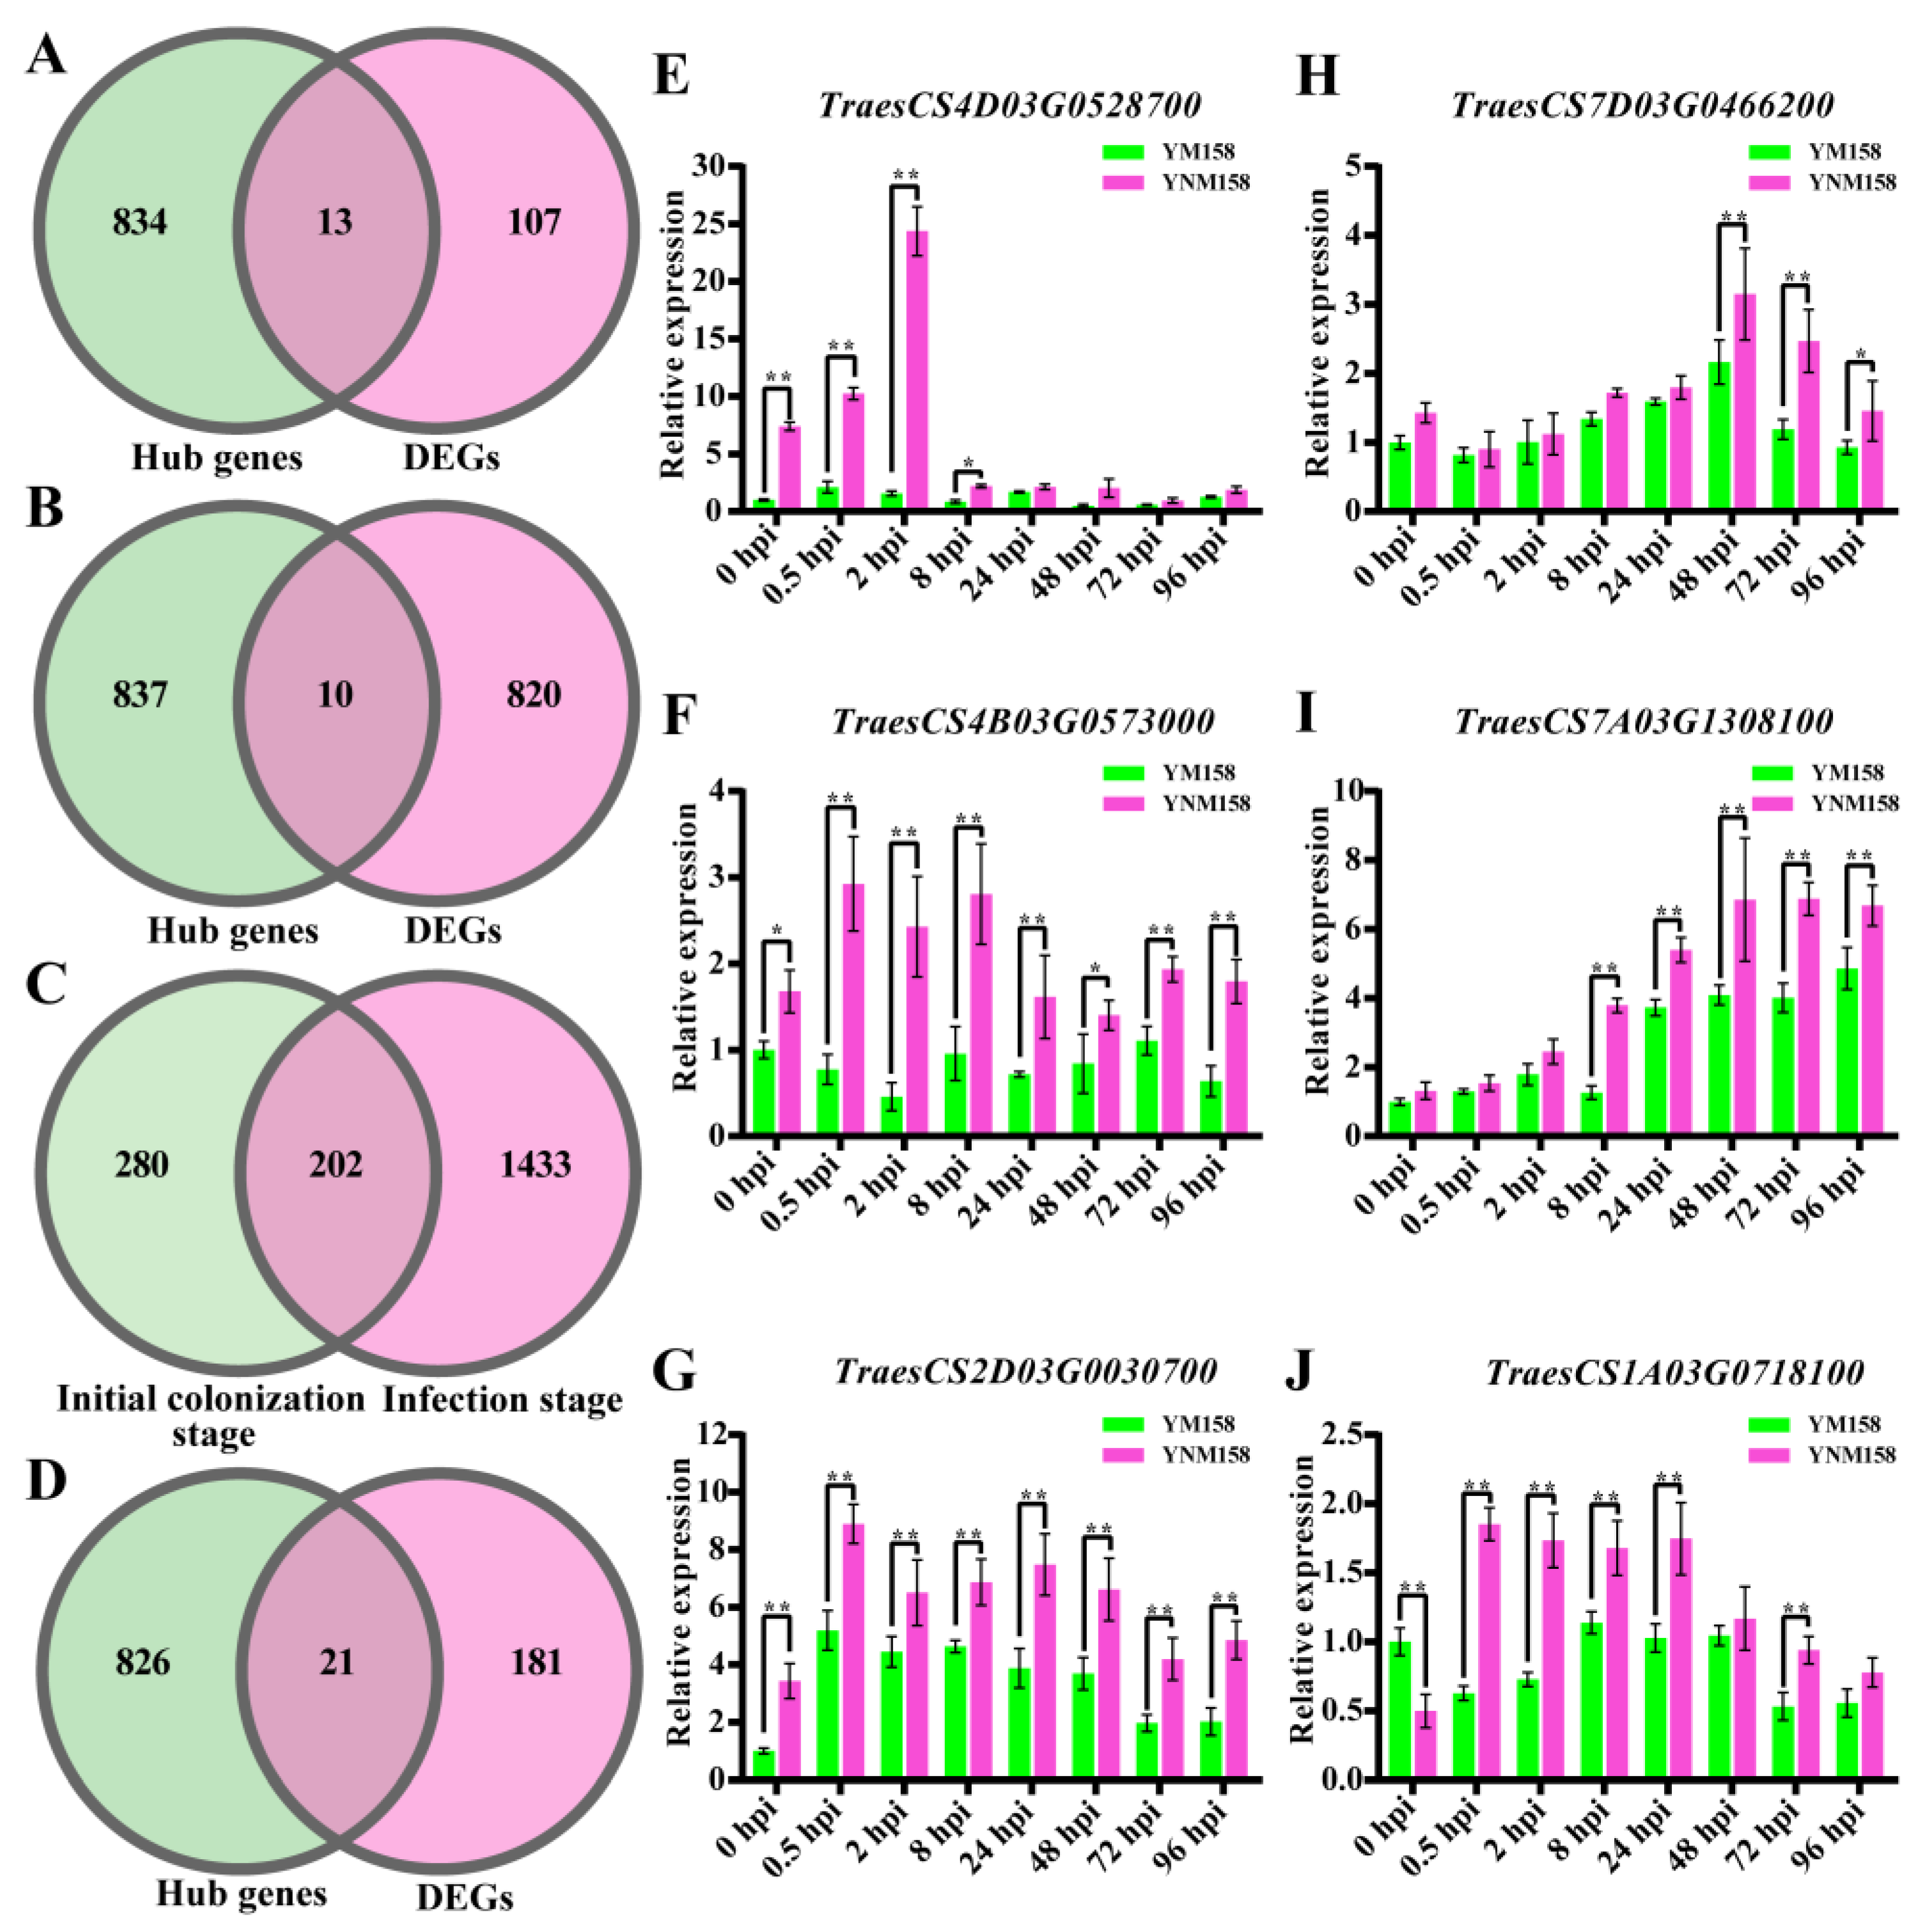
Venn diagrams were drawn between the wheat DEGs at different infection stages and the hub genes positively associated with YNM158. At the initial colonization stage, 120 DEGs were obtained from specific enrichment pathways (Table S15), of these, 13 DEGs were associated with the FHB resistance of YNM158 (Figure 7A and Table S16). At the infection stage, 830 DEGs were obtained from a specific pathway (Table S17), of which 10 DEGs were related to the FHB resistance in YNM158 (Figure 7B and Table S16). In the same pathways in both stages mentioned above, 202 DEGs (Figure 7C and Table S18) were identified, 21 of which may be related to the FHB resistance of YNM158 (Figure 7D and Table S16).
To verify the correlation between the core genes and the stages of FHB resistance, the selected genes were verified using qPCR. Compared with the expression in YM158 at 0 hpi, the expression levels of six wheat genes in YNM158 were up-regulated after F. graminearum infection (Table 3). Of these, TraesCS4D03G0528700 and TraesCS4B03G0573000 belonged to the phosphatidylinositol-signaling system and protein processing in the endoplasmic reticulum pathway, respectively. The expression patterns of both genes were the same at the initial colonization stage and were substantially up-regulated in YNM158. TraesCS4D03G0528700 showed the highest expression level at 2 hpi (Figure 7E), whereas TraesCS4B03G0573000 reached its highest level at 8 hpi (Figure 7F). TraesCS2D03G0030700 and TraesCS7D03G0466200 encode the nucleotide-binding site-leucine-rich repeat (NBS-LRR) disease resistance protein and 3-ketoacyl–CoA synthase, respectively, both of which belong to the plant–pathogen interaction pathway. However, their expression patterns differed slightly. The expression of TraesCS2D03G0030700 was substantially up-regulated after F. graminearum infection and the expression of this gene in YNM158 was always higher than that in YM158 (Figure 7G). Although TraesCS7D03G0466200 was also induced after F. graminearum infection, the expression of TraesCS7D03G0466200 in YNM158 was substantially higher than in YM158 until 48 hpi (Figure 7H). In addition, we found that the expression of one gene involved in the biosynthesis of secondary metabolites and the MAPK-signaling pathway was induced by F. graminearum. The qPCR results indicated that these two genes may mediate the resistance of YNM158 to FHB during the initial colonization and infection stages. TraesCS7A03G1308100 encoded hydroxycinnamoyl–CoA shikimate, the expression of which, in YNM158, was substantially higher than that in YM158 from 8 h after F. graminearum infection (Figure 7I). In contrast, the expression of TraesCS1A03G0718100 was substantially up-regulated at 0.5 hpi in YNM158. However, there was little difference in the expression of this gene between YM158 and YNM158 after 48 hpi (Figure 7J). These results suggest that the introduction of chromosome 7EL fragments may affect the disease-resistance pathway in wheat, thereby improving FHB resistance.

3. Discussion

3.1. YNM158 Can Be Effectively Applied in FHB Improvement in Wheat Breeding

Breeding and applying FHB-resistant varieties in wheat production is an effective way of controlling the destructive disease. However, long-term intraspecific cross-breeding of wheat has reduced the range of genetic variation among varieties and has resulted in poor resistance to FHB, whereas the related wild species and genera of wheat carry many FHB-resistant genes. For example, Fhb3 on chromosome 7Lr#1S of Leymus racemosus, Fhb6 on chromosome 1E(ts)#1S of Elymus tsukushiensis, and Fhb7 on chromosome 7el2 of Th. ponticum were reported to have major resistance to FHB [6,7,8,9]. In addition, the 1Yc and 3Sc chromosomes of Roegneria ciliaris [21], the 1E and 7E chromosomes of diploid Th. elongatum [12,13], chromosome 3St of Elymus repens [22], and 7Mg chromosome of Aegilops geniculata [23] also possess FHB-resistant genes. Although the introduction of alien chromosomes can improve resistance to FHB, it also introduces some genetic linkages, which makes the agronomic characteristics of most foreign germplasms poor and difficult to directly use in wheat breeding for FHB resistance. Therefore, to fully utilize wheat-related species in wheat breeding for FHB resistance, it is necessary to create small fragment translocation lines to develop new varieties with increased FHB resistance and no yield penalties. The Fhb7 from Th. ponticum was introduced into cultivated wheat using small segment translocation lines and is used in wheat breeding for FHB resistance [9].
The diploid form of tall wheatgrass, Th. elongatum, has a high level of FHB resistance and has been used to increase FHB resistance in the wheat strain, Chinese Spring, by translocation development [19,24]. In this study, we successfully established translocation lines with small fragments of chromosome 7EL from diploid Th. elongatum using physical radiation, one of which has excellent agronomic traits and high resistance to wheat FHB (YNM158). Contrary to previous reports, the translocation in YNM158 occurred on chromosome 4BS, a non-compensative translocation, and the reason for this phenomenon was that chromosome translocation was induced by ionizing radiation; the breakage and reconnection of wheat and alien chromosomes were random, so most of them were uncompensated translocations. Interestingly, the survey results of agronomic traits for two consecutive years showed that YNM158 did not perform poorly because of a non-compensatory translocation line, such as the genetic instability of exogenous chromosomes, high plant height and poor fertility. The reasons for this are worthy of further investigation. Previous studies have shown that non-compensatory translocation lines have important utility in wheat breeding. For example, the small fragment translocation line 5VS–6AS·6AL can be used to improve the quality of wheat soft grains [25]; the 3A–7Js translocation line can be used to improve wheat stem rust resistance [26]; and two homozygous translocation lines, T1AS·1AL–6VS and T4BS·4BL–6VS-4BL, carrying Pm21, can be used to enhance powdery mildew resistance in wheat [27]. Therefore, we propose that the translocation line YNM158, which contains a small fragment of chromosomes 7EL, has good application prospects in breeding wheat for resistance to FHB.

3.2. Transcriptome Analysis Validated That Glutathione Is One of the Important Contributors to FHB-Resistance Roles in the Pathogen Infection Stage

A decrease in the cost of the technique and widespread implementation have made transcriptome analysis a valuable tool for investigating the molecular mechanisms underlying cereal resistance to fungal infections. In the current study, glutathione metabolism was most enriched in YNM158 after F. graminearum infection during the infection stage (Figure 5D). Plants respond to fungal infections by activating defense genes, including the production of reactive oxygen species (ROS), which can enhance the strength of plant cell walls to resist pathogen invasion and colonization [28,29]. However, when large amounts of ROS accumulate in plants, they cause oxidative stress, damage plant cells, and lead to cell dysfunction and even death.
Currently, the enzymes involved in the antioxidant defense system can be divided into two groups: (i) enzymatic antioxidants, such as superoxide dismutase (SOD), catalase (CAT), ascorbate peroxidase (APX), guaiacol peroxidase GPX, glutathione reductase (GR), monodehydroascorbate reductase (MDHAR), and dehydroascorbate reductase (DHAR), and (ii) non-enzymatic antioxidants, such as ascorbic acid (AA), reduced glutathione (GSH), α-tocopherol, carotenoids, plastoquinone/ubiquinone, and flavonoids [30]. Early research has reported that the ascorbate–glutathione (AsA–GSH) cycle is an important method for removal of ROS in plants. Of these, APX is the key enzyme in this cycle and utilizes AsA as an electron donor to reduce H2O2 to water and prevent the accumulation of toxic levels of H2O2 in photosynthetic organisms under stress conditions [31]. Glutathione (GSH) participates in various metabolic processes and is an essential component of the antioxidative and detoxification systems in plant cells [32]. GSH can be used as both a reducing agent and strong nucleophile, participating in the elimination of reactive oxygen species (ROS) through thiol-disulfide redox reactions and in the detoxification of various heterogeneous organisms through conjugation reactions, respectively [33].
GSH is oxidized to glutathione (GSSG) during ROS clearance. To maintain the balance of GSH content in plants, the GR enzyme effectively and expeditiously reduces GSSG to GSH. It can be seen that the GR enzyme plays a very important role in clearing ROS and maintaining the content of GSH in plants. For example, the overexpression of GR gene from Haynaldia villosa in wheat can increase its resistance to powdery mildew [34]. In the current study, we found that the expression of some APX-encoding and GR-encoding genes in YNM158 was up-regulated during infection (Figure 5D). Therefore, we suggest that glutathione may play a key role in ROS-mediated resistance to FHB in wheat.
Glutathione S-transferase (GST) are a group of multifunctional enzymes widely present in plants and play important roles in plant secondary metabolism [35], growth and development [36], and biotic and abiotic stress responses [37]. One of its most important functions is the inactivation of toxic compounds. GST can form complexes with glutathione (GSH) by catalyzing hormones and toxins to inactivate or eliminate the toxicity of many substances and expel them into the body under the action of relevant transporters [38]. These results suggest that GST plays a crucial role in plant disease resistance. For example, NbGSTU1 increases the resistance to Colletotrichum destructivum in Nicotiana benthamiana [39]. The lack of GSTU13 function results in enhanced susceptibility toward several fungal pathogens in Arabidopsis thaliana [40]. Overexpression of LrGST5 in tobacco can improve the resistance of transgenic plants to F. oxysporum [41]. TaGSTU6 interactions enhance wheat resistance to powdery mildew but not wheat stripe rust [42].
Wheat infected with FHB can be contaminated with various mycotoxins, especially deoxynivalenol (DON) [43]. It has been reported that GSH can form GSH–DON conjugates under the catalysis of GST to reduce the accumulation of DON and protect plants from toxicity. For instance, Fhb7 and FhbRc1, encoding glutathione S-transferase, enhance the resistance to FHB in wheat [9,44]. In this study, the expression of GST-encoding genes, including TraesCS1A03G0109100, TraesCS3D03G0946300, TraesCS4D03G0493500, TraesCS5B03G0050700, TraesCS5A03G0730500, TraesCS5B03G0770700, and Tel7E01G1020600, was substantially up-regulated after infection with F. graminearum in YNM158. Among them, the expression of the Fhb7 homolog Tel7E01G1020600 increased sharply at 72 hpi and was tenfold higher than that in non-infected cells (Figure 3E). It can be seen that GST is one of the important contributors to FHB resistance roles in the pathogen infection stage. However, the Tel7E01G1020600 in YNM158 was derived from diploid Th. elongatum, which is not consistent with the origin of Fhb7. Therefore, whether Tel7E01G1020600 in YNM158 has the same disease resistance function as Fhb7 requires further investigation.

3.3. Other Genes from the 7EL Fragment in YNM158 Might Also Be Involved in Increasing FHB Resistance Especially in the Pathogen Initial Colonization Stage

The DON toxin is an important fungal pathogen produced when F. graminearum infects wheat. It can synthesize large amounts of F. graminearum along the inflorescence axis and promote disease expansion. However, some studies have reported that when the pathogen initially infects wheat anthers, there is no DON synthesis signal, and only when the disease spreads along the inflorescence axis from the inoculation point does DON begin to be synthesized in large quantities by the pathogen [45,46]. It can be seen that DON can help the pathogen spread along the wheat spike axis, but it is not necessary for its initial infection [47]. During the process of long-term co-evolution of plants and pathogens, a series of complex defense mechanisms have gradually formed. Pathogen-associated molecular pattern (PAMP)-triggered immunity (PTI) is the first line of defense against plant innate immunity and is mediated by pattern recognition receptors (PRRs). PRRs are divided into two types: receptor-like kinases (PLKs) and receptor-like proteins (PLPs). Many PLKs have been shown to play key roles in wheat disease resistance. For example, Sun et al. [48] reported that the repeat receptor-like kinase-encoding gene, TaBIR1, contributes to wheat resistance against Puccinia striiformis f. sp. tritici by mediating ROS production and callose deposition, and the cysteine-rich receptor-like kinase, TaCRK3, contributes to the defense against Rhizoctonia cerealis in wheat by directing anti-fungal activity and heightening the expression of defense-associated genes in the ethylene-signaling pathway [49].
RLKs have also been found to contribute to grain resistance to Fusarium resistance in cereals. For instance, Thapa et al. [50] identified two homologous genes on barley chromosome 6H (HvLRRK-6H) and wheat chromosome 6DL (TaLRRK-6D), respectively, which could enhance cereal resistance to FHB disease. Arabidopsis senses Fusarium elicitors during early immune responses to extracts from Fusarium spp. via a novel receptor complex encoded by the leucine-rich repeat receptor-like kinase MDIS1-interacting receptor-like kinase 2 (MIK2) at the cell surface [51]. Interestingly, we also identified several RLK-encoding genes on the 7EL fragment, and their expression was significantly up-regulated at the initial colonization stage after F. graminearum inoculation, such as Tel7E01G943900, which was substantially up-regulated at 0.5 hpi (Figure 3F).
During immune responses, plants have developed a number of disease-resistance mechanisms to resist nutrient uptake by pathogens that involve sugar transport, metabolism, and signal transduction. Previous studies have shown that hexose released by cell wall invertase (CWIN) not only acts as a signal molecule to trigger the expression of disease-resistance-related genes, but is also an essential metabolite and energy source for the synthesis of antioxidant compounds and defense molecules, such as salicylic acid and callose [52,53,54]. For example, AtSTP4- and Atβfruct1-encoding monosaccharide transporter and CWIN, respectively, are both induced in Arabidopsis during parasitic infection by fungus [55]. Chang et al. [56] reported that silencing the hexes transporter-encoding gene, PsHXT1, in wheat stripe rust can substantially inhibit the pathogenicity of bacteria. In the current study, the expression of the monosaccharide-sensing protein-encoding gene, Tel7E01G980900, was substantially up-regulated within 8 h of infection with F. graminearum and reached its highest level at 2 hpi in YNM158 (Figure 3G). The functions of monosaccharide-sensing proteins are similar to those of hexose transporters [57,58]. Therefore, we speculate that tests could also be conducted with CWINs to bring hexose back to host cells, reducing sugar availability to the pathogen, and thus improving host disease resistance. However, this must be confirmed in future studies.
It is well-known that F. graminearum is a kind of facultative trophic fungi. Therefore, wheat must use a series of defense mechanisms to resist pathogen infections at different stages. The introduction of 7EL chromosome fragments not only introduced the GST-encoding gene (which is one of the important contributors to DON detoxification) but also other genes that were upregulated at the initial colonization stage. These genes are also involved in increasing the FHB resistance. Therefore, an in-depth study of these genes may provide new insights into the molecular mechanisms underlying wheat resistance to FHB.

3.4. Introgression of the 7EL Fragment Altered the Gene Expression in Wheat after F. graminearum Inoculation

The introduction of alien chromosome fragments not only brings about resistance genes but also affects gene expression in normal chromosomes [59,60]. In the current study, the translocation of chromosomes affected the expression of wheat genes that were enriched in resistance pathways, including the phosphatidylinositol-signaling system, protein processing in endoplasmic reticulum, plant–pathogen interaction, and the MAPK-signaling pathway at different stages of F. graminearium infection.
When plants are infected with pathogens, phospholipase C (PLC) is rapidly activated by pathogen-associated molecular patterns (PAMPs) and effector proteins in plant cells [61]. Phosphatidylinositol 4-phosphate (PI4P) and phosphatidylinositol (4,5) bisphosphate [PI(4,5)P2] are catalyzed to produce inositol 2-phosphate (IP2), inositol 3-phosphate (IP3), and diacylglycerol (DAG). These are conserved compounds in pathogenic microbes that are perceived by immune receptors present in resistant plants [62,63]. Previous studies have reported that silencing and knock-out SlPLC2 in tomatoes can reduce susceptibility to Botrytis cinereal [61,62]. SlPLC6 plays a key role in both for Ve1-resistance-protein-mediated resistance to Verticillium dahliae and Pto/Prf-protein-mediated resistance to Pseudomonas syringae [64].
Salicylic acid (SA), jasmonate (JA), and methyl jasmonate can increase the expression of OsPI-PLC in rice (Oryza sativa) and improve the resistance of rice to Magnaporthe oryzae [65]. In the current study, the expression of some PLC genes in YNM158 was higher than in YN158 during the initial colonization stage, such as TraesCS4A03G0225500 and TraesCS4B03G0547100. Moreover, the qPCR results showed that the expression of TraesCS4D03G0528700, which encodes phosphatidylinositol 4-phosphate-5 kinase (PIPK5), in YNM158, was higher than that in YM158 at the initial colonization stage (Figure 7B). We know that PIP5K is the catalytic enzyme for the synthesis of PI(4,5)P2. Shimada et al. [66] pointed out that the biosynthesis of PI(4,5)P2 is an important target for improving the defense ability of Arabidopsis thaliana against Colletotrichum, and its activity also determines the defense ability of Arabidopsis thaliana against Colletotrichum. Therefore, we speculated that PIP5K could affect the accumulation of PI(4,5)P2 in YNM1158 to participate in the PLC-mediated response to F. graminearium infection, thus affecting the colonization of F. graminearium to improve resistance to FHB during the initial stages of infection.
There are also defense-related proteins in plants that are synthesized by the rough endoplasmic reticulum (RER), so that when plants are attacked by the pathogen, the genes encoding endoplasmic reticulum (ER) chaperones are induced, such as the immunoglobulin-binding protein (BIP), heat-shock protein (Hsp), calreticulin (CRT), and protein disulfide isomerase (PDI)-encoding genes. Previous studies have shown that the Hsp are ER chaperones that play an indispensable role as molecular chaperones in the quality control of PRRs and intracellular resistance (R) proteins against potential invaders [67]. For example, Hsp90 is not only involved in the defense of many microbial pathogens by activating cytosolic R proteins containing a nucleotide-binding domain and a leucine-rich repeat but also participates in chitin responses and anti-fungal immunity in a chaperone complex with its co-chaperone, Hop/Sti1 [67,68].
In terms of specific diseases, cytoplasmic Capsicum annuum Hsp70 (CaHsp70) can enhance the resistance to Xanthomonas campestris pv. vesicatoria in pepper [69], GmHsp40 can increase soybean resistance to soybean mosaic virus [70], Hsp70 can enhance resistance to powdery mildew in cucumber under heat shock-induction [71], and the MeHsp90.9–MeSGT1–MeRAR1 chaperone complex interacts with MeATGs to trigger autophagy signaling to improve disease resistance to cassava bacterial blight [72]. In the present study, we found that the expression of TraesCS4B03G0573000, which encodes a heat shock protein in YNM158, was markedly upregulated after infection with F. graminearium at the initial colonization stage, which was opposite to the expression pattern observed in YM158 (Figure 7F). Typically, the expression of genes encoding ER chaperones precedes the expression of genes encoding pathogenesis-related (PR) proteins [73]. Therefore, we inferred that the expression of genes encoding the Hsp protein was rapidly induced after infection with F. graminearium in YNM158, thus activating the defense mechanism earlier, inducing programmed cell death, affecting the colonization of pathogens, and making plants resistant to disease. This provides a new idea for further research on the mechanism of FHB resistance.
Reactive oxygen species (ROS) are important signaling molecules in defense responses during plant–pathogen interactions and are mainly produced by respiratory burst oxidase homologs (RBOHs) [74]. In Arabidopsis, AtRBOHD and AtRBOHF are responsible for ROS production during pathogen attacks [75]. In Nicotiana benthamiana, NbRBOHA and NbRBOHB silencing led to reduced ROS production and reduced resistance to infection by the potato pathogen, Phytophthora infestans [76]. Phosphorylation is known to be one of the essential mechanisms of RBOHD activation and is also transcriptionally activated by some kinases, such as MAPK cascades, and the transcriptional regulation of RBOHs may play a key roles in subsequent ROS bursts after turnover of the plasma membrane-localized RBOHs used for the first burst [77]. For example, Yamamizo et al. [78] reported that MAPK is involved in inducing the response of potato StRBOHC and StRBOHD genes in response to pathogen signals in potato, and Asai et al. [79] illustrated that the MAPK cascade, MEK2–SIPK, regulates the oxidative burst resulting from the induction of RBOHB expression in resistance to P. infestans and Colletotrichum orbiculare in N. benthamiana. Here, we found that the expression of an RBOH-encoded gene, TraesCS1A03G0718100, was up-regulated after F. graminearum infection in YNM158 (Figure 7J), as well as some genes encoding MAPK (Figure 5G). Therefore, we hypothesized that the MAPK in YNM158 may be involved in inducing the RBOH gene response to resistance against F. graminearum. However, this requires further investigations.

4. Materials and Methods

4.1. Plant Materials

Triticum aestivum ‘Chinese Spring’ (CS), ‘Sumai3’ (SU3), ‘Annong8455’ (AN8455), and ‘Yangmai158’ (YM158) were maintained at Yangzhou University, China. YM158 was pollinated with the 60Co-γ-irradiated pollen of the long-arm translocation line TW-7EL1 (T7BS·7EL) of chromosome 7E with excellent FHB resistance developed in previous studies [80]. The chromosomes of the F1 generation plants were identified using GISH and plants containing 7EL chromosome structure variations were selected for backcrossing with YM158. After six generations of self-breeding, a small fragment of the 7EL chromosome translocation line, Yangnongmai158 (YNM158), was selected.

4.2. Cell Cycle Synchronization and Preparation of Mitotic Chromosomes

Cell cycle synchronization and slide preparation were performed as described by Lei et al. [81], with minor modifications. Seeds were soaked in water for 3–5 h and germinated on moist filter paper for 2 d in the dark at 25 °C. When the roots had grown to approximately 2.5 cm length, they were treated with 2 μmol/L amiprophosmethyl (APM) for 2.5 h. The root tips were then cut and placed in a nitrous oxide gas chamber for 1 h. The root tips were then fixed in ice-cold 90% acetic acid for 8 min, washed with sterile double distilled water (ddH2O), and stored in 70% ethanol at −20 °C until use. For slide preparation, the root tips were washed with ddH2O for 5 min. The apical meristems of the roots were cut and incubated in 25 μL of enzyme solution containing 2% cellulase Onozuka R-10 (Yakult Pharmaceutical, Tokyo, Japan) and 1% pectolyase Y23 (ICN) for 1 h at 37 °C in a water bath. Meristems were separated with a needle in 50 μL of 100% acetic acid and immediately dropped onto microscope slides using a pipette at a height of approximately 10 cm and then placed in a wet box for about 20 min. The number and location of chromosomes were observed and recorded under the phase contrast objective (Nikon 80i, Nikon, Tokyo, Japan), and the well-prepared slides were stored in a −70 °C refrigerator until use.

4.3. Genomic In Situ Hybridization (GISH) and Fluorescence In Situ Hybridization (FISH) Analysis

GISH and non-denaturing (ND)-FISH methods followed those described previously [82]. The total genomic DNA from Th. elongatum was labeled with digoxigenin-12-dUTP using the Nick Translation method and was used as a probe for GISH. Repetitive sequences of oligo-pSc119.2 and oligo-pAs1 were synthesized as probes. The 5′ ends of oligo-pSc119.2 and oligo-pAs1 were labeled using 6-carboxyfluorescein (6-FAM) and 6-carboxytetramethylrhodamine (Tamra), respectively. The labeled probes were dissolved in 2 × SSC and 1× TE buffer (pH 7.0) and dropped onto prepared slides. Next, the slides were covered with a coverslip, placed in a humidified hybridization cassette at 37 °C for 10 h, and then transferred to 2 × SSC for 2 min at room temperature. Finally, the slides were quickly dried and 6.5 μL DAPI was added to each slide (Vector, No. H-1200). After the ND-FISH analysis, the slides were washed in 2 × SSC for 2 min at room temperature. After drying the same slides were subjected to GISH. Hybridization signals were observed using a fluorescent microscope and images were obtained with a CCD camera (Color Cooled Digital DS-Fi1c, Nikon 80i, Nikon, Tokyo, Japan).

4.4. Evaluation of Disease Resistance

The translocation line YNM158 and its hybrid offspring were screened for FHB resistance in the field and greenhouse in 2021 and 2022, respectively. In this study, a single-floret inoculation method was used to assess FHB resistance. The monosporic isolate F0609 of F. graminearum, commonly found in the middle and lower reaches of the Yangtze River in China, was kindly provided by Professor Huaigu Chen, Jiangsu Academy of Agricultural Sciences, Nanjing, China. At the early flowering stage, the central spikelet was injected into 10 µL fungal suspension (50,000 spores/mL), and at least three spikes from each plant were injected. Following inoculation, the plants were incubated for 72 h for FHB development. After 21 d, all infected spikelets per inoculated spike were counted. Wheat cultivar, An8455, served as the susceptible control, and SU3 served as the resistant control in the field and greenhouse trials. One in both the field and greenhouse.

4.5. De Novo Assembly of RNA-Seq Reads and Quantifying Gene Expression

The transcriptome analysis was performed at eight time points after inoculation with F. graminearum: 0 hpi, 0.5 hpi, 2 hpi, 8 hpi, 24 hpi, 48 hpi, 72 hpi, and 96 hpi (three repetitions per time point). After inoculation, three spikes were randomly selected each time and mixed to extract RNA. Total RNA was extracted using a Trizol reagent kit (Invitrogen, Carlsbad, CA, USA) according to the manufacturer’s protocol. The RNA quality was assessed on an Agilent 2100 Bioanalyzer (Agilent Technologies, Palo Alto, CA, USA) and checked by using RNase-free agarose gel electrophoresis. The mRNA was enriched using oligo (dT) beads. Enriched mRNA was fragmented and used as the template for cDNA synthesis. The cDNA fragments were sequenced using an Illumina HiSeq2500 by Gene Denovo Biotechnology Co (Guangzhou, China). For analysis after sequencing, refer to the article published by Dai et al. [83]. The genomes of Chinese Spring (IWGSC RefSeq v2.1) and Th. elongatum (GWHABKY00000000) were used as reference genomes. The sequences obtained were submitted on the sequence read archive (BioProject ID: PRJNA1011388).

4.6. Quantitative Real-Time Polymerase Chain Reaction

The RNA used for transcriptome sequencing was provided by the company and used in subsequent reverse transcriptase experiments. The cDNA was generated from 1 μg of total RNA and synthesized using the HiScript 1st Strand cDNA Synthesis Kit (Vazyme, Nanjing, China). Each qPCR reaction mixture was 10 μL, containing 5 μL of 2 × SupRealQ Purple Universal SYBR qPCR Master Mix (Vazyme), 1 μL of a mix solution of target gene primers (10 mm), 1 μL of diluted first-strand cDNAs, and 3 μL of double-distilled H2O. The qPCR was performed under the following program: 94 °C for 5 min, and then 40 cycles: 94 °C for 10 s followed by 60 °C for 30 s. For the melt curve analysis, the following program was included after 40 cycles: 95 °C for 10 s followed by 60 °C for 30 s and a constant increase from 60 to 95 °C. The relative expression levels were determined using the −2−ΔΔCt method. The qPCR assays were performed using three independent biological samples pretreatments and three technical replicates per sample. The primers used in this analysis are listed in Supplementary Table S19.

4.7. Data Analysis

All data were statistically analyzed using the IBM SPSS Statistics 25 software with pairwise comparisons of LSD to identify differences. Data conforming to normal distribution and homogeneity of variance were analyzed using one-way analysis of variance (ANOVA); otherwise, the Kruskal–Wallis one-way ANOVA was used. Different letters indicate significant differences (p < 0.05). GraphPad Prism 8 software was used to generate the figures.

5. Conclusions

FHB is a devastating wheat disease that seriously affects wheat yield and quality. Many laboratories worldwide have conducted studies on wheat resistance to FHB. It has been proven that the most economical and effective way to resist the damage caused by wheat FHB is to mine genes with high resistance to FHB and to breed new varieties that are resistant to FHB. In this study, the translocation line, YNM158, carrying the 7EL chromosome fragment obtained using distant hybridization not only had excellent resistance to FHB, but also had stable agronomic traits that could potentially be used in FHB resistance breeding. Transcriptome analysis indicated that the 7EL chromosome fragment not only carried genes that could detoxify DON but also contained genes that could affect the colonization of F. graminearum during the early stage of infection. In addition, introgression of the 7EL fragment altered gene expression and activated a specific resistance pathway in YNM158 after F. graminearum inoculation. YNM158 may have a variety of molecular mechanisms of action against F. graminearum infection and shows high resistance to the FHB phenotype. Therefore, these results not only provide a new germplasm for wheat resistance to FHB but also elucidate the molecular mechanism of wheat resistance and provide a new way for breeding new varieties with high resistance to FHB.

Supplementary Materials

The following supporting information can be downloaded at: https://www.mdpi.com/article/10.3390/ijms25179452/s1.

Author Contributions

Data curation, Y.D., W.F., S.C., J.S. and H.L.; formal analysis, Y.W.; funding acquisition, H.M. (Hongxiang Ma); investigation, W.F., S.C., J.S., H.M. (Haigang Ma), H.L. and J.L.; methodology, Y.D., J.Z. and B.W.; project administration, H.M. (Hongxiang Ma); resources, J.C.; software, Y.W.; supervision, J.C. and H.M. (Hongxiang Ma); validation, H.L. and Y.G.; visualization, Y.D.; writing—original draft, Y.D.; writing—review and editing, J.C. and H.M. (Hongxiang Ma). All authors have read and agreed to the published version of the manuscript.

Funding

This research was funded by the Project of Zhongshan Biological Breeding (ZSBBL-KY2023-02-3, BM2022008-02), Seed Industry Revitalization Project of Jiangsu Province (JBGS2021047), Jiangsu Key Project for the Research and Development (BE2022346), and a Project Funded by the Priority Academic Program Development of Jiangsu Higher Education Institutions (22KJB210018).

Institutional Review Board Statement

Not applicable.

Informed Consent Statement

Not applicable.

Data Availability Statement

The genome sequences of Chinese Spring were downloaded from the website: https://wheat-urgi.versailles.inra.fr/Seq-Repository/Assemblies. The data was accessed on 24 April 2021. The genome sequences of Th. elongatum were downloaded from the website: https://ngdc.cncb.ac.cn/gwh/Assembly/965/show. The data was accessed on 10 March 2020. The transcriptome sequencing data generated in this study have been deposited in the NCBI Sequence Read Archive (SRA) database under accession number PRJNA1011388. And the datasets generated or analyzed during this study are included in this article and its additional file or are available from the corresponding author on reasonable request.

Acknowledgments

We thank the participants for partaking in this study. The authors would like to thank the reviewers whose constructive comments are very helpful for strengthening the presentation of this paper.

Conflicts of Interest

The authors declare no conflicts of interest.

References

  1. Cuthbert, P.A.; Somers, D.J.; Thomas, J.; Cloutier, S.; Brule-Babel, A. Fine mapping Fhb1, a major gene controlling Fusarium head blight resistance in bread wheat (Triticum aestivum L.). Theor. Appl. Genet. 2006, 112, 1465–1472. [Google Scholar] [CrossRef]
  2. Cuthbert, P.A.; Somers, D.J.; Brule-Babel, A. Mapping of Fhb2 on chromosome 6BS: A gene controlling Fusarium head blight field resistance in bread wheat (Triticum aestivum L.). Theor. Appl. Genet. 2007, 114, 429–437. [Google Scholar] [CrossRef]
  3. Xue, S.; Li, G.Q.; Jia, H.Y.; Xu, F.; Lin, F.; Tang, M.Z.; Wang, Y.; An, X.; Xu, H.B.; Zhang, L.X.; et al. Fine mapping Fhb4, a major QTL conditioning resistance to Fusarium infection in bread wheat (Triticum aestivum L.). Theor. Appl. Genet. 2010, 121, 147–156. [Google Scholar] [CrossRef]
  4. Xue, S.L.; Xu, F.; Tang, M.Z.; Zhou, Y.; Li, G.Q.; An, X.; Lin, F.; Xu, H.B.; Jia, H.Y.; Zhang, L.X.; et al. Precise mapping Fhb5, a major QTL conditioning resistance to Fusarium infection in bread wheat (Triticum aestivum L.). Theor. Appl. Genet. 2011, 123, 1055–1063. [Google Scholar] [CrossRef] [PubMed]
  5. Wang, X.; Li, G.Q.; Jia, H.Y.; Cheng, R.; Zhong, J.K.; Shi, J.X.; Chen, R.T.; Wen, Y.X.; Ma, Z.Q. Breeding evaluation and precise mapping of Fhb8 for Fusarium head blight resistance in wheat (Triticum aestivum). Plant Breed. 2023, 143, 26–33. [Google Scholar] [CrossRef]
  6. Qi, L.L.; Pumphrey, M.O.; Friebe, B.; Chen, P.D.; Gill, B.S. Molecular cytogenetic characterization of alien introgressions with gene Fhb3 for resistance to Fusarium head blight disease of wheat. Theor. Appl. Genet. 2008, 117, 1155–1166. [Google Scholar] [CrossRef] [PubMed]
  7. Cainong, J.C.; Bockus, W.W.; Feng, Y.G.; Chen, P.D.; Qi, L.L.; Sehgal, S.K.; Danilova, T.V.; Koo, D.H.; Friebe, B.; Gill, B.S. Chromosome engineering, mapping, and transferring of resistance to Fusarium head blight disease from Elymus tsukushiensis into wheat. Theor. Appl. Genet. 2015, 128, 1019–1027. [Google Scholar] [CrossRef] [PubMed]
  8. Guo, J.; Zhang, X.L.; Hou, Y.L.; Cai, J.J.; Shen, X.R.; Zhou, T.T.; Xu, H.H.; Ohm, H.W.; Wang, H.W.; Li, A.F.; et al. High-density mapping of the major FHB resistance gene Fhb7 derived from Thinopyrum ponticum and its pyramiding with Fhb1 by marker-assisted selection. Theor. Appl. Genet. 2015, 128, 2301–2316. [Google Scholar] [CrossRef] [PubMed]
  9. Wang, H.W.; Sun, S.L.; Ge, W.Y.; Zhao, L.F.; Hou, B.Q.; Wang, K.; Lyu, Z.F.; Chen, L.Y.; Xu, S.S.; Guo, J.; et al. Horizontal gene transfer of Fhb7 from fungus underlies Fusarium head blight resistance in wheat. Science 2020, 368, eaba5435. [Google Scholar] [CrossRef]
  10. Dai, Y.; Huang, S.; Sun, G.; Li, H.; Chen, J. Origins and chromosome differentiation of Thinopyrum elongatum revealed by PepC, Pgk1 genes and ND-FISH. Genome 2021, 64, 901–913. [Google Scholar] [CrossRef]
  11. Jauhar, P.P.; Peterson, T.S.; Xu, S.S. Cytogenetic and molecular characterization of a durum alien disomic addition line with enhanced tolerance to Fusarium head blight. Genome 2009, 52, 467–483. [Google Scholar] [CrossRef]
  12. Jauhar; Prem, P. Durum wheat genetic stocks involving chromosome 1E of diploid wheatgrass: Resistance to Fusarium head blight. Nucleus 2014, 57, 19–23. [Google Scholar]
  13. Liu, H.P.; Dai, Y.; Chi, D.; Huang, S.; Li, H.F.; Duan, Y.M.; Cao, W.G.; Gao, Y.; Fedak, G.; Chen, J.M. Production and Molecular Cytogenetic Characterization of a Durum Wheat-Thinopyrum elongatum 7E Disomic Addition Line with Resistance to Fusarium Head Blight. Cytogenet. Genome Res. 2017, 153, 165–173. [Google Scholar] [CrossRef]
  14. Shen, R.; Kong, L.R.; Ohm, H. Fusarium head blight resistance in hexaploid wheat (Triticum aestivum)-Lophopyrum genetic lines and tagging of the alien chromatin by PCR markers. Theor. Appl. Genet. 2004, 108, 808–813. [Google Scholar] [CrossRef] [PubMed]
  15. Zhang, X.L.; Shen, X.R.; Hao, Y.F.; Cai, J.J.; Ohm, H.W.; Kong, L.R. A genetic map of Lophopyrum ponticum chromosome 7E, harboring resistance genes to Fusarium head blight and leaf rust. Theor. Appl. Genet. 2011, 122, 263–270. [Google Scholar] [CrossRef]
  16. Guo, X.R.; Wang, M.; Kang, H.Y.; Zhou, Y.H.; Han, F.P. Distribution, Polymorphism and Function Characteristics of the GST-Encoding Fhb7 in Triticeae. Plants 2022, 11, 2074. [Google Scholar] [CrossRef]
  17. Guo, X.R.; Shi, Q.H.; Wang, M.; Yuan, J.; Zhang, J.; Wang, J.; Liu, Y.; Su, H.D.; Wang, Z.; Li, J.B.; et al. Functional analysis of the glutathione S-transferases from Thinopyrum and its derivatives on wheat Fusarium head blight resistance. Plant Biotechnol. J. 2023, 21, 1091–1093. [Google Scholar] [CrossRef] [PubMed]
  18. Shen, X.; Ohm, H. Fusarium head blight resistance derived from Lophopyrum elongatum chromosome 7E and its augmentation with Fhb1 in wheat. Plant Breed. 2006, 125, 424–429. [Google Scholar] [CrossRef]
  19. Zhang, W.; Danilova, T.; Zhang, M.Y.; Ren, S.F.; Zhu, X.W.; Zhang, Q.J.; Zhong, S.B.; Dykes, L.; Fiedler, J.; Xu, S.; et al. Cytogenetic and genomic characterization of a novel tall wheatgrass-derived Fhb7 allele integrated into wheat B genome. Theor. Appl. Genet. 2022, 135, 4409–4419. [Google Scholar] [CrossRef]
  20. Stephens, A.E.; Gardiner, D.M.; White, R.G.; Munn, A.L.; Manners, J.M. Phases of Infection and Gene Expression of Fusarium graminearum during Crown Rot Disease of Wheat. Mol. Plant-Microbe Interact. 2008, 21, 1571–1581. [Google Scholar] [CrossRef]
  21. Kong, L.N.; Song, X.Y.; Xiao, J.; Sun, H.J.; Dai, K.L.; Lan, C.X.; Singh, P.W.; Yuan, C.X.; Zhang, S.Z.; Singh, R.; et al. Development and characterization of a complete set of Triticum aestivum-Roegneria ciliaris disomic addition lines. Theor. Appl. Genet. 2018, 131, 1793–1806. [Google Scholar] [CrossRef]
  22. Gong, B.R.; Zhu, W.; Li, S.Y.; Wang, Y.Q.; Xu, L.L.; Wang, Y.; Zeng, J.; Fan, X.; Sha, L.N.; Zhang, H.Q.; et al. Molecular cytogenetic characterization of wheat-Elymus repens chromosomal translocation lines with resistance to Fusarium head blight and stripe rust. BMC Plant Biol. 2019, 19, 590. [Google Scholar] [CrossRef] [PubMed]
  23. Yang, X.Y.; Xu, M.R.; Wang, Y.F.; Cheng, X.F.; Huang, C.X.; Zhang, H.; Li, T.D.; Wang, C.Y.; Chen, C.H.; Wang, Y.J.; et al. Development and Molecular Cytogenetic Identification of Two Wheat-Aegilops geniculata Roth 7M(g) Chromosome Substitution Lines with Resistance to Fusarium Head Blight, Powdery Mildew and Stripe Rust. Int. J. Mol. Sci. 2022, 23, 7056. [Google Scholar] [CrossRef] [PubMed]
  24. Haldar, A.; Tekieh, F.; Balcerzak, M.; Wolfe, D.; Lim, D.; Joustra, K.; Konkin, D.; Han, F.P.; Fedak, G.; Ouellet, T. Introgression of Thinopyrum elongatum DNA fragments carrying resistance to Fusarium head blight into Triticum aestivum cultivar Chinese Spring is associated with alteration of gene expression. Genome 2021, 64, 1009–1020. [Google Scholar] [CrossRef]
  25. Zhang, R.Q.; Wang, X.E.; Chen, P.D. Molecular and cytogenetic characterization of a small alien-segment translocation line carrying the softness genes of Haynaldia villosa. Genome 2012, 55, 639–646. [Google Scholar] [CrossRef]
  26. Li, J.; Bao, Y.; Han, R.; Wang, X.; Xu, W.; Li, G.; Yang, Z.; Zhang, X.; Li, X.; Liu, A.; et al. Molecular and Cytogenetic Identification of Stem Rust Resistant Wheat-Thinopyrum intermedium Introgression Lines. Plant Dis. 2022, 106, 2447–2454. [Google Scholar] [CrossRef] [PubMed]
  27. Chen, P.D.; You, C.F.; Hu, Y.; Chen, S.W.; Zhou, B.; Cao, A.Z.; Wang, X. Radiation-induced translocations with reduced Haynaldia villosa chromatin at the Pm21 locus for powdery mildew resistance in wheat. Mol. Breed. 2013, 31, 477–484. [Google Scholar] [CrossRef]
  28. Yang, C.; Liu, R.; Pang, J.; Ren, B.; Zhou, H.; Wang, G.; Wang, E.; Liu, J. Poaceae-specific cell wall-derived oligosaccharides activate plant immunity via OsCERK1 during Magnaporthe oryzae infection in rice. Nat. Commun. 2021, 12, 2178. [Google Scholar] [CrossRef]
  29. O’Brien, J.A.; Daudi, A.; Butt, V.S.; Bolwell, G.P. Reactive oxygen species and their role in plant defence and cell wall metabolism. Planta 2012, 236, 765–779. [Google Scholar] [CrossRef]
  30. García-Caparrós, P.; De Filippis, L.; Gul, A.; Hasanuzzaman, M.; Ozturk, M.; Altay, V.; Lao, M.T. Oxidative Stress and Antioxidant Metabolism under Adverse Environmental Conditions: A Review. Bot. Rev. 2021, 87, 421–466. [Google Scholar] [CrossRef]
  31. Pang, C.H.; Wang, B.S. Role of Ascorbate Peroxidase and Glutathione Reductase in Ascorbate-Glutathione Cycle and Stress Tolerance in Plants. In Ascorbate-Glutathione Pathway and Stress Tolerance in Plants; Springer: Dordrecht, The Netherlands, 2010; pp. 91–113. [Google Scholar]
  32. Lu, C.C.; Jiang, Y.K.; Yue, Y.Z.; Sui, Y.R.; Hao, M.X.; Kang, X.J.; Wang, Q.B.; Chen, D.Y.; Liu, B.Y.; Yin, Z.Y.; et al. Glutathione and neodiosmin feedback sustain plant immunity. J. Exp. Bot. 2023, 74, 976–990. [Google Scholar] [CrossRef] [PubMed]
  33. Gullner, G.; Kömives, T. The Role of Glutathione and Glutathione-related Enzymes in Plant-pathogen Interactions. In Plant Ecophysiology; Springer: Dordrecht, The Netherlands, 2001; pp. 207–239. [Google Scholar]
  34. Chen, Y.P.; Xing, L.P.; Wu, G.J.; Wang, H.Z.; Wang, X.E.; Cao, A.Z.; Chen, P.D. Plastidial glutathione reductase from Haynaldia villosa is an enhancer of powdery mildew resistance in wheat (Triticum aestivum). Plant Cell Physiol. 2007, 48, 1702–1712. [Google Scholar] [CrossRef] [PubMed]
  35. Mueller, L.A.; Goodman, C.D.; Silady, R.A.; Walbot, V. AN9, a petunia glutathione S-transferase required for anthocyanin sequestration, is a flavonoid-binding protein. Plant Physiol. 2000, 123, 1561–1570. [Google Scholar] [CrossRef]
  36. Gong, H.B.; Jiao, Y.X.; Hu, W.W.; Pua, E.C. Expression of glutathione-S-transferase and its role in plant growth and development in vivo and shoot morphogenesis in vitro. Plant Mol. Biol. 2005, 57, 53–66. [Google Scholar] [CrossRef] [PubMed]
  37. Ma, L.G.; Zhang, Y.H.; Meng, Q.L.; Shi, F.M.; Liu, J.; Li, Y.C. Molecular cloning, identification of GSTs family in sunflower and their regulatory roles in biotic and abiotic stress. World J. Microbiol. Biotechnol. 2018, 34, 109. [Google Scholar] [CrossRef]
  38. Edwards, R.; Dixon, D.P.; Walbot, V. Plant glutathione S-transferases: Enzymes with multiple functions in sickness and in health. Trends Plant Sci. 2000, 5, 193–198. [Google Scholar] [CrossRef] [PubMed]
  39. Dean, J.D.; Goodwin, P.H.; Hsiang, T. Induction of glutathione S-transferase genes of Nicotiana benthamiana following infection by Colletotrichum destructivum and C. orbiculare and involvement of one in resistance. J. Exp. Bot. 2005, 56, 1525–1533. [Google Scholar] [CrossRef]
  40. Pislewska-Bednarek, M.; Nakano, R.T.; Hiruma, K.; Pastorczyk, M.; Sanchez-Vallet, A.; Singkaravanit-Ogawa, S.; Ciesiolka, D.; Takano, Y.; Molina, A.; Schulze-Lefert, P.; et al. Glutathione Transferase U13 Functions in Pathogen-Triggered Glucosinolate Metabolism. Plant Physiol. 2018, 176, 538–551. [Google Scholar] [CrossRef]
  41. Han, Q.; Chen, R.; Yang, Y.; Cui, X.M.; Ge, F.; Chen, C.Y.; Liu, D.Q. A glutathione S-transferase gene from Lilium regale Wilson confers transgenic tobacco resistance to Fusarium oxysporum. Sci. Hortic. 2016, 198, 370–378. [Google Scholar] [CrossRef]
  42. Wang, Q.; Guo, J.; Jin, P.F.; Guo, M.Y.; Guo, J.; Cheng, P.; Li, Q.; Wang, B.T. Glutathione S-transferase interactions enhance wheat resistance to powdery mildew but not wheat stripe rust. Plant Physiol. 2022, 190, 1418–1439. [Google Scholar] [CrossRef]
  43. Chen, Y.; Kistler, H.C.; Ma, Z.H. Fusarium graminearum Trichothecene Mycotoxins: Biosynthesis, Regulation, and Management. Annu. Rev. Phytopathol. 2019, 57, 15–39. [Google Scholar] [CrossRef] [PubMed]
  44. Song, R.R.; Cheng, Y.F.; Wen, M.X.; Song, X.Y.; Wang, T.; Xia, M.S.; Sun, H.J.; Cheng, M.H.; Cui, H.M.; Yuan, C.X.; et al. Transferring a new Fusarium head blight resistance locus FhbRc1 from Roegneria ciliaris into wheat by developing alien translocation lines. Theor. Appl. Genet. 2023, 136, 36. [Google Scholar] [CrossRef] [PubMed]
  45. Ilgen, P.; Hadeler, B.; Maier, F.J.; Schäfer, W. Developing Kernel and Rachis Node Induce the Trichothecene Pathway of Fusarium graminearum during Wheat Head Infection. Mol. Plant-Microbe Interact. 2009, 22, 899–908. [Google Scholar] [CrossRef] [PubMed]
  46. Boenisch, M.J.; Schäfer, W. Fusarium graminearum forms mycotoxin producing infection structures on wheat. BMC Plant Biol. 2011, 11, 110. [Google Scholar] [CrossRef]
  47. Mudge, A.M.; Dill-Macky, R.; Dong, Y.H.; Gardiner, D.M.; White, R.G.; Manners, J.M. A role for the mycotoxin deoxynivalenol in stem colonisation during crown rot disease of wheat caused by Fusarium graminearum and Fusarium pseudograminearum. Physiol. Mol. Plant Pathol. 2006, 69, 73–85. [Google Scholar] [CrossRef]
  48. Sun, Y.C.; Wang, X.J.; Liu, F.Y.; Guo, H.Y.; Wang, J.F.; Wei, Z.T.; Kang, Z.S.; Tang, C.L. A Leucine-Rich Repeat Receptor-like Kinase TaBIR1 Contributes to Wheat Resistance against Puccinia striiformis f. sp. tritici. Int. J. Mol. Sci. 2023, 24, 6438. [Google Scholar] [CrossRef]
  49. Guo, F.L.; Wu, T.C.; Shen, F.D.; Xu, G.B.A.; Qi, H.J.; Zhang, Z.Y. The cysteine-rich receptor-like kinase TaCRK3 contributes to defense against Rhizoctonia cerealis in wheat. J. Exp. Bot. 2021, 72, 6904–6919. [Google Scholar] [CrossRef]
  50. Thapa, G.; Gunupuru, L.R.; Hehir, J.G.; Kahla, A.; Mullins, E.; Doohan, F.M. A Pathogen-Responsive Leucine Rich Receptor Like Kinase Contributes to Fusarium Resistance in Cereals. Front. Plant Sci. 2018, 9, 867. [Google Scholar] [CrossRef]
  51. Coleman, A.D.; Maroschek, J.; Raasch, L.; Takken, F.L.W.; Ranf, S.; Hückelhoven, R. The Arabidopsis leucine-rich repeat receptor-like kinase MIK2 is a crucial component of early immune responses to a fungal-derived elicitor. New Phytol. 2021, 229, 3453–3466. [Google Scholar] [CrossRef]
  52. Ruan, Y.L. Sucrose Metabolism: Gateway to Diverse Carbon Use and Sugar Signaling. Annu. Rev. Plant Biol. 2014, 65, 33–67. [Google Scholar] [CrossRef]
  53. Liu, Y.H.; Offler, C.E.; Ruan, Y.L. Regulation of fruit and seed response to heat and drought by sugars as nutrients and signals. Front. Plant Sci. 2013, 4, 282. [Google Scholar] [CrossRef] [PubMed]
  54. Xiang, L.; Le Roy, K.; Bolouri-Moghaddam, M.R.; Vanhaecke, M.; Lammens, W.; Rolland, F.; Van den Ende, W. Exploring the neutral invertase-oxidative stress defence connection in Arabidopsis thaliana. J. Exp. Bot. 2011, 62, 3849–3862. [Google Scholar] [CrossRef] [PubMed]
  55. Fotopoulos, V.; Gilbert, M.J.; Pittman, J.K.; Marvier, A.C.; Buchanan, A.J.; Sauer, N.; Hall, J.L.; Williams, L.E. The monosaccharide transporter gene, AtSTP4, and the cell-wall invertase, Atβfruct1, are induced in Arabidopsis during infection with the fungal biotroph Erysiphe cichoracearum. Plant Physiol. 2003, 132, 821–829. [Google Scholar] [CrossRef]
  56. Chang, Q.; Lin, X.H.; Yao, M.H.; Liu, P.; Guo, J.; Huang, L.L.; Voegele, R.T.; Kang, Z.S.; Liu, J. Hexose transporter PsHXT1-mediated sugar uptake is required for pathogenicity of wheat stripe rust. Plant Biotechnol. J. 2020, 18, 2367–2369. [Google Scholar] [CrossRef] [PubMed]
  57. Chen, L.Q.; Qu, X.Q.; Hou, B.H.; Sosso, D.; Osorio, S.; Fernie, A.R.; Frommer, W.B. Sucrose Efflux Mediated by SWEET Proteins as a Key Step for Phloem Transport. Science 2012, 335, 207–211. [Google Scholar] [CrossRef] [PubMed]
  58. Sutton, P.N.; Gilbert, M.J.; Williams, L.E.; Hall, J.L. Powdery mildew infection of wheat leaves changes host solute transport and invertase activity. Physiol. Plant. 2010, 129, 787–795. [Google Scholar] [CrossRef]
  59. Harewood, L.; Fraser, P. The impact of chromosomal rearrangements on regulation of gene expression. Hum. Mol. Genet. 2014, 23, R76–R82. [Google Scholar] [CrossRef]
  60. Spielmann, M.; Lupianez, D.G.; Mundlos, S. Structural variation in the 3D genome. Nat. Rev. Genet. 2018, 19, 453–467. [Google Scholar] [CrossRef]
  61. Perk, E.A.; Di Palma, A.A.; Colman, S.; Mariani, O.; Cerrudo, I.; D’Ambrosio, J.M.; Robuschi, L.; Pombo, M.A.; Rosli, H.G.; Villareal, F.; et al. CRISPR/Cas9-mediated phospholipase C 2 knock-out tomato plants are more resistant to Botrytis cinerea. Planta 2023, 257, 117. [Google Scholar] [CrossRef]
  62. Gonorazky, G.; Guzzo, M.C.; Abd-El-Haliem, A.M.; Joosten, M.; Laxalt, A.M. Silencing of the tomato phosphatidylinositol-phospholipase C2 (SlPLC2) reduces plant susceptibility to Botrytis cinerea. Mol. Plant Pathol. 2016, 17, 1354–1363. [Google Scholar] [CrossRef]
  63. Laxalt, A.M.; Munnik, T. Phospholipid signalling in plant defence. Curr. Opin. Plant Biol. 2002, 5, 332–338. [Google Scholar] [CrossRef] [PubMed]
  64. Vossen, J.H.; Abd-El-Haliem, A.; Fradin, E.F.; van den Berg, G.C.M.; Ekengren, S.K.; Meijer, H.J.G.; Seifi, A.; Bai, Y.L.; ten Have, A.; Munnik, T.; et al. Identification of tomato phosphatidylinositol-specific phospholipase-C (PI-PLC) family members and the role of PLC4 and PLC6 in HR and disease resistance. Plant J. 2010, 62, 224–239. [Google Scholar] [CrossRef] [PubMed]
  65. Song, F.M.; Goodman, R.M. Molecular cloning and characterization of a rice phosphoinositide-specific phospholipase C gene, OsPI-PLC1, that is activated in systemic acquired resistance. Physiol. Mol. Plant Pathol. 2002, 61, 31–40. [Google Scholar] [CrossRef]
  66. Shimada, T.L.; Betsuyaku, S.; Inada, N.; Ebine, K.; Fujimoto, M.; Uemura, T.; Takano, Y.; Fukuda, H.; Nakano, A.; Ueda, T. Enrichment of Phosphatidylinositol 4,5-Bisphosphate in the Extra-Invasive Hyphal Membrane Promotes Colletotrichum Infection of Arabidopsis thaliana. Plant Cell Physiol. 2019, 60, 1514–1524. [Google Scholar] [CrossRef]
  67. Park, C.J.; Seo, Y.S. Heat Shock Proteins: A Review of the Molecular Chaperones for Plant Immunity. Plant Pathol. J. 2015, 31, 323–333. [Google Scholar] [CrossRef]
  68. Chen, L.T.; Hamada, S.; Fujiwara, M.; Zhu, T.H.; Thao, N.P.; Wong, H.L.; Krishna, P.; Ueda, T.; Kaku, H.; Shibuya, N.; et al. The Hop/Sti1-Hsp90 Chaperone Complex Facilitates the Maturation and Transport of a PAMP Receptor in Rice Innate Immunity. Cell Host Microbe 2010, 7, 185–196. [Google Scholar] [CrossRef]
  69. Kim, N.H.; Hwang, B.K. Pepper Heat Shock Protein 70a Interacts with the Type III Effector AvrBsT and Triggers Plant Cell Death and Immunity. Plant Physiol. 2015, 167, 307–322. [Google Scholar] [CrossRef]
  70. Liu, J.Z.; Whitham, S.A. Overexpression of a soybean nuclear localized typeIII DnaJ domain-containing HSP40 reveals its roles in cell death and disease resistance. Plant J. 2013, 74, 110–121. [Google Scholar] [CrossRef]
  71. Widiastuti, A.; Arofatullah, N.A.; Kharisma, A.D.; Sato, T. Upregulation of heat shock transcription factors, Hsp70, and defense-related genes in heat shock-induced resistance against powdery mildew in cucumber. Physiol. Mol. Plant Pathol. 2021, 116, 101730. [Google Scholar] [CrossRef]
  72. Wei, Y.X.; Zeng, H.Q.; Liu, W.; Cheng, X.; Zhu, B.B.; Guo, J.R.; Shi, H.T. Autophagy-related genes serve as heat shock protein 90 co-chaperones in disease resistance against cassava bacterial blight. Plant J. 2021, 107, 925–937. [Google Scholar] [CrossRef]
  73. Jelitto-Van Dooren, E.; Vidal, S.; Denecke, J. Anticipating endoplasmic reticulum stress: A novel early response before pathogenesis-related gene induction. Plant Cell 1999, 11, 1935–1943. [Google Scholar] [CrossRef] [PubMed]
  74. Wu, B.; Qi, F.; Liang, Y. Fuels for ROS signaling in plant immunity. Trends Plant Sci. 2023, 28, 1124–1131. [Google Scholar] [CrossRef]
  75. Torres, M.A.; Dangl, J.L.; Jones, J.D.G. Arabidopsis gp91phoxhomologues AtrbohD and AtrbohF are required for accumulation of reactive oxygen intermediates in the plant defense response. Proc. Natl. Acad. Sci. USA 2002, 99, 517–522. [Google Scholar] [CrossRef] [PubMed]
  76. Yoshioka, H.; Numata, N.; Nakajima, K.; Katou, S.; Kawakita, K.; Rowland, O.; Jones, J.D.G.; Doke, N. Nicotiana benthamiana gp91phox homologs NbrbohA and NbrbohB participate in H2O2 accumulation and resistance to Phytophthora infestans. Plant Cell 2003, 15, 706–718. [Google Scholar] [CrossRef] [PubMed]
  77. Adachi, H.; Yoshioka, H. Kinase-mediated orchestration of NADPH oxidase in plant immunity. Brief. Funct. Genom. 2015, 14, 253–259. [Google Scholar] [CrossRef]
  78. Yamamizo, C.; Doke, N.; Yoshioka, H.; Kawakita, K. Involvement of mitogen-activated protein kinase in the induction of StrbohC and StrbohD genes in response to pathogen signals in potato. J. Gen. Plant Pathol. 2007, 73, 304–313. [Google Scholar] [CrossRef]
  79. Asai, S.; Ohta, K.; Yoshioka, H. MAPK signaling regulates nitric oxide and NADPH oxidase-dependent oxidative bursts in Nicotiana benthamiana. Plant Cell 2008, 20, 1390–1406. [Google Scholar] [CrossRef]
  80. Zhang, L.L.; Chen, S.Q.; Li, H.F.; Liu, H.P.; Dai, Y.; Gao, Y.; Chen, J.M. Development of wheat-Thinopyrum elongatum translocation lines resistant to Fusarium head blight. Sci. Agric. Sin. 2016, 49, 3477–3488. (In Chinese) [Google Scholar]
  81. Lei, J.; Zhou, J.; Sun, H.; Wan, W.; Xiao, J.; Yuan, C.; Karafiátová, M.; Doleel, J.; Wang, H.; Wang, X. Development of oligonucleotide probes for FISH karyotyping in Haynaldia villosa, a wild relative of common wheat. Crop J. 2020, 8, 676–681. [Google Scholar] [CrossRef]
  82. Tang, Z.; Yang, Z.; Fu, S. Oligonucleotides replacing the roles of repetitive sequences pAs1, pSc119.2, pTa-535, pTa 71, CCS1, and PA WRC.1 for FISH analysis. J. Appl. Genet. 2014, 55, 313–318. [Google Scholar] [CrossRef]
  83. Dai, Y.; Tabassum, M.A.; Chen, L.; Pan, Z.; Song, L. Physiological and transcriptomic response of soybean seedling roots to variable nitrate levels. Agron. J. 2021, 113, 3639–3652. [Google Scholar] [CrossRef]
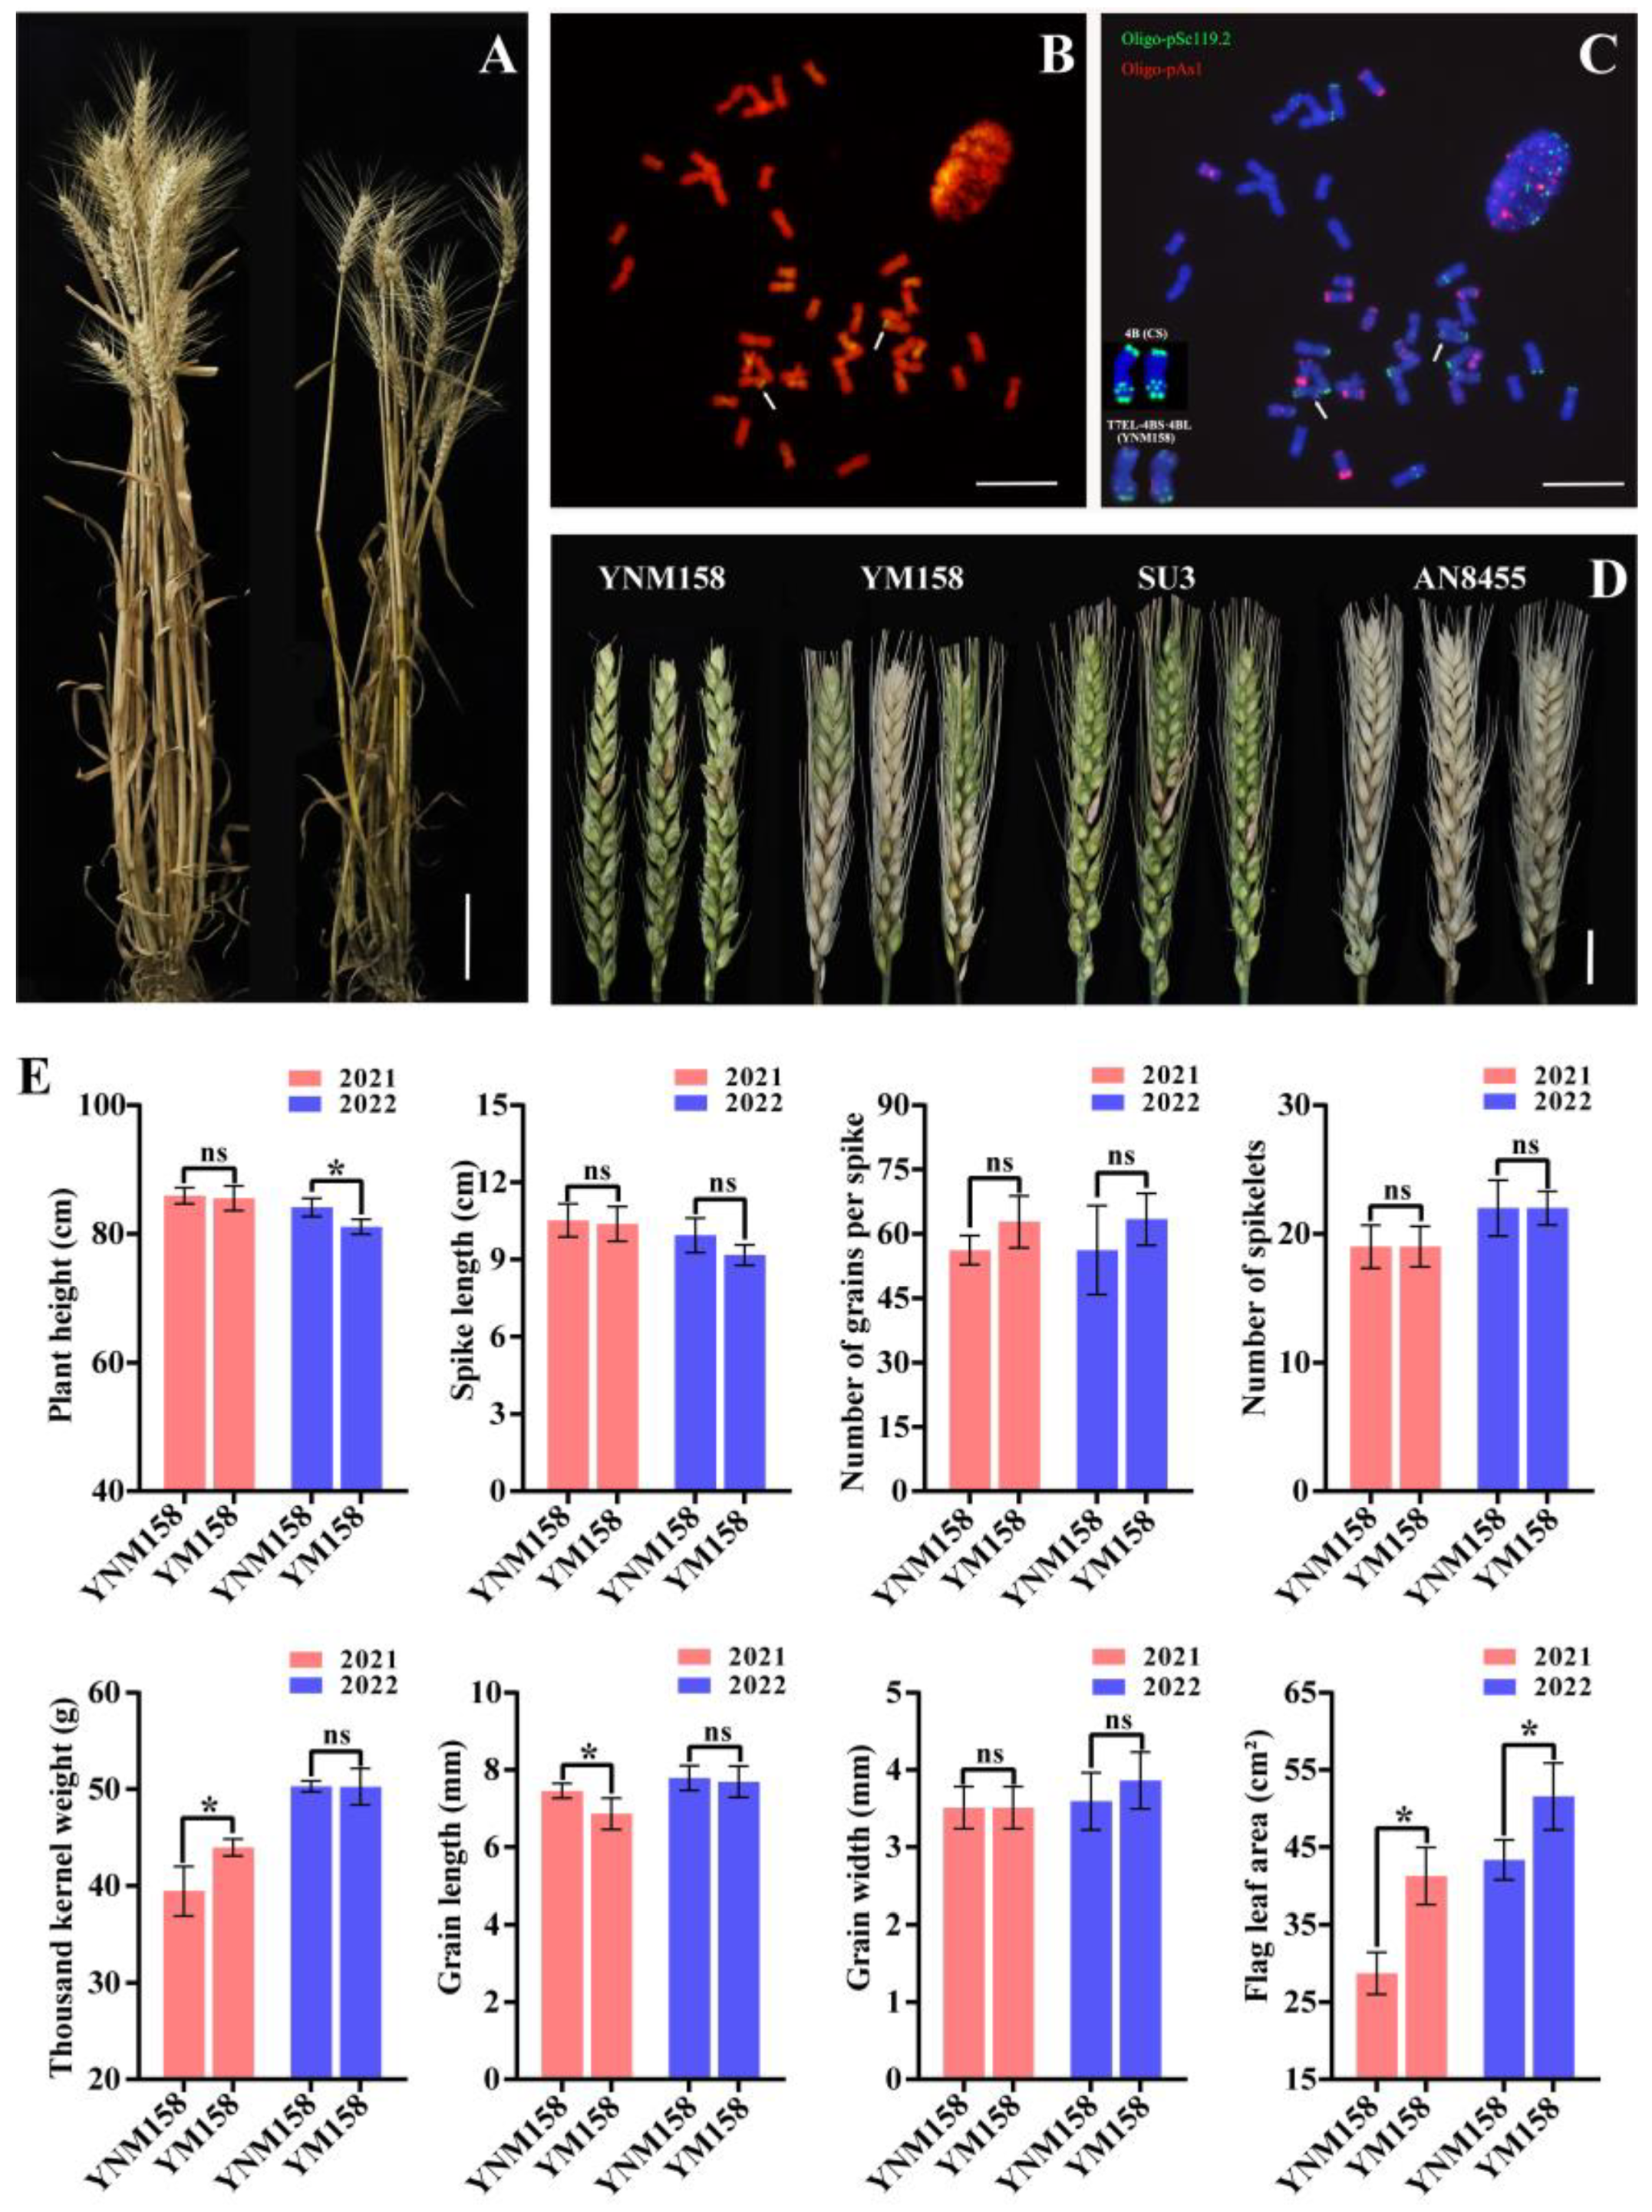
Figure 1. The establishment of wheat-Th. elongatum 7EL chromosome translocation line YNM158. (A) Mature plants of YNM158 (left) and YM158 (right). Scale bar = 10 cm. (B) GISH analysis of the translocation lines YNM158: diploid Th. elongatum genomic DNA was used as a probe (green); arrows show the translocated chromosome pair. Scale bar = 100 μm. (C) ND-FISH analysis of the translocation lines YNM158: Oligo-pAs1 (red signal) modified with 5′TAMRA and Oligo-pSc119.2 (green signal) modified with 5′FAM were used as probes; chromosomes were counterstained with DAPI (blue), and arrows show the translocated chromosome pairs. Scale bar = 100 μm. (D) Symptoms of YNM158 and the control varieties at 21 dpi with F. graminearum isolate F0609. Scale bar = 2 cm. (E) Statistical analysis of eight agronomic traits for YNM158 and YM158. Statistical significance of differences was evaluated by t-test (* p < 0.05).
Ijms 25 09452 g001
Figure 2. Analysis of the differentially expressed genes (DEGs) identified from YNM158. (A) Statistical analysis of the DEGs number on 7EL chromosome at different times after F. graminearum infection. (B) Gene ontology function enrichment analysis of DEGs on 7EL chromosome after F. graminearum infection. (C) KEGG pathway enrichment analysis of DEGs on 7EL chromosome after F. graminearum infection. (D) The heatmap of the DEGs enriched in starch and sucrose metabolism pathway.
Ijms 25 09452 g002
Figure 3. Gene expression patterns analysis on 7EL chromosome. (A) The trend analysis of DEGs at different times after F. graminearum infection. (B) Gene dendrogram by clustering the dissimilarity based on topological overlap. (C) Correlation heatmap between modules and infection time with F. graminearum. The 4 modules are provided in the left panel. The module–trait correlation, from −1 (light blue) to 1 (pink), is indicated with the color scale on the right. Each column presents the infection time, and their association with each module is represented by a correlation coefficient (showing top-left corner) and a p-value (showing lower-right corner). (D) Venn diagrams showing the overlapping of DEGs between WGCNA and trend analysis. (EG) Relative expression of Tel7E01G1020600, Tel7E01G946300, and Tel7E01G980900 by qPCR. (H) The correlation analysis between the relative expressions obtained by qPCR and RNA-seq by Pearson correlation analysis. *: p < 0.05; **: p < 0.01 by Student’s t-test.
Ijms 25 09452 g003
Figure 4. Screened the DEGs between YM158 and YNM158. (A) DEGs Venn diagram of initial colonization stage. (B) DEGs Venn diagram at infection stage. (C) Different types of specific DEGs statistics.
Ijms 25 09452 g004
Figure 5. KEGG pathway enrichment analysis of wheat DEGs. (A) The specific enrichment pathways at the initial colonization stage. (B) The heatmap of the representative DEGs enriched at the initial colonization stage. (C) The specific enrichment pathways at the infection stage. (D) The heatmap of the representative DEGs enriched at the infection stage. (E) The same enrichment pathways at the initial colonization stage. (F) The same enrichment pathways at the infection stage. (G) The heatmap of the representative DEGs enriched at both stages.
Ijms 25 09452 g005
Figure 6. WGCNA of wheat DEGs identified in the YM158 and YNM158 after F. graminearum infection. (A) The x-axis represents the soft threshold β. (B) The y-axis represents the mean of all genes’ adjacency functions in the corresponding gene module. (C) Fourteen modules of co-expressed genes are shown in a hierarchical cluster tree. A major tree branch represents a module. Modules in designated colors are presented in the lower panel. (D) Module–trait relationships: The 14 modules are provided in the left panel. The module–trait correlation, from −1 (green) to 1 (red), is indicated with the color scale on the right. The association with each module is represented by a correlation coefficient and a p-value (showing in parentheses).
Ijms 25 09452 g006
Figure 7. The core genes extraction and expression verification by RT-PCR. (A) Venn diagram between the hub genes associated with YNM158 and DEGs in the specific pathways at initial colonization stage. (B) Venn diagram between the hub genes associated with YNM158 and DEGs in the specific pathways at infection stage. (C) DEGs Venn diagram between the initial colonization stage and infection stage in the same pathways. (D) Venn diagram between the hub genes associated with YNM158 and DEGs in both stages. (EJ) The relative expression of the core genes in YM158 and YNM158. *: p < 0.05; **: p < 0.01 by Student’s t-test.
Ijms 25 09452 g007
Table 1. Mean percentage of diseased spikelets (PDS) in different environments.
Lines2020–20212021–2022
FieldGreenhouseFieldGreenhouse
YNM1584.81% ± 0.19 d5.18% ± 0.37 c5.21% ± 0.23 d5.27% ± 0.20 d
SU36.49% ± 1.79 d7.38% ± 2.89 c4.36% ± 0.22 d5.06% ± 0.21 d
AN845583.42% ± 10.36 a75.83% ± 14.69 a87.88% ± 5.51 a60.19% ± 6.24 a
YM2328.79% ± 6.41 c53.69% ± 5.15 b15.54% ± 3.54 c21.87% ± 7.05 c
YM15847.01% ± 11.92 b-31.80% ± 12.91 b45.09% ± 8.21 b
Note: The data were statistically analyzed by Kruskal–Wallis one-way ANOVA. Pairwise comparisons were completed using LSD. Different letters show significance at p < 0.05.
Table 2. The gene was verified by qPCR.
Gene IDGene Description
Tel7E01G1002700Lysine ketoglutarate reductase trans-splicing-like protein (DUF707)
Tel7E01G1013700Galactoside 2-alpha-L-fucosyltransferase
Tel7E01G1020600Glutathione S-transferase
Tel7E01G211400Protein kinase
Tel7E01G899900NF-X1-type zinc finger protein NFXL1
Tel7E01G905000Disease resistance protein (NBS-LRR class) family
Tel7E01G934300Carbonic anhydrase
Tel7E01G939300Receptor-like kinase
Tel7E01G941500Carboxypeptidase
Tel7E01G943900Receptor-like kinase
Tel7E01G946300Blue copper binding protein
Tel7E01G980900Monosaccharide-sensing protein 2
Table 3. The core genes verified by RT-PCR at different infection stages.
Gene IDPathwayGene Description
Initial colonization stage
TraesCS4D03G0528700Phosphatidylinositol signaling systemPhosphatidylinositol-4-phosphate 5-kinase family protein
TraesCS4B03G0573000Protein processing in endoplasmic reticulum70 kDa heat shock protein
Infection stage
TraesCS2D03G0030700Plant–pathogen interactionNBS-LRR disease resistance protein
TraesCS7D03G0466200Plant–pathogen interaction3-ketoacyl–CoA synthase
Both stage
TraesCS7A03G1308100Biosynthesis of secondary metabolitesHydroxycinnamoyl–CoA
TraesCS1A03G0718100MAPK signaling pathway–plantRespiratory burst oxidase-like protein
Disclaimer/Publisher’s Note: The statements, opinions and data contained in all publications are solely those of the individual author(s) and contributor(s) and not of MDPI and/or the editor(s). MDPI and/or the editor(s) disclaim responsibility for any injury to people or property resulting from any ideas, methods, instructions or products referred to in the content.