
Salivary Molecular Spectroscopy with Machine Learning Algorithms for a Diagnostic Triage for Amelogenesis Imperfecta
 , , , , and
Abstract
:1. Introduction
2. Results
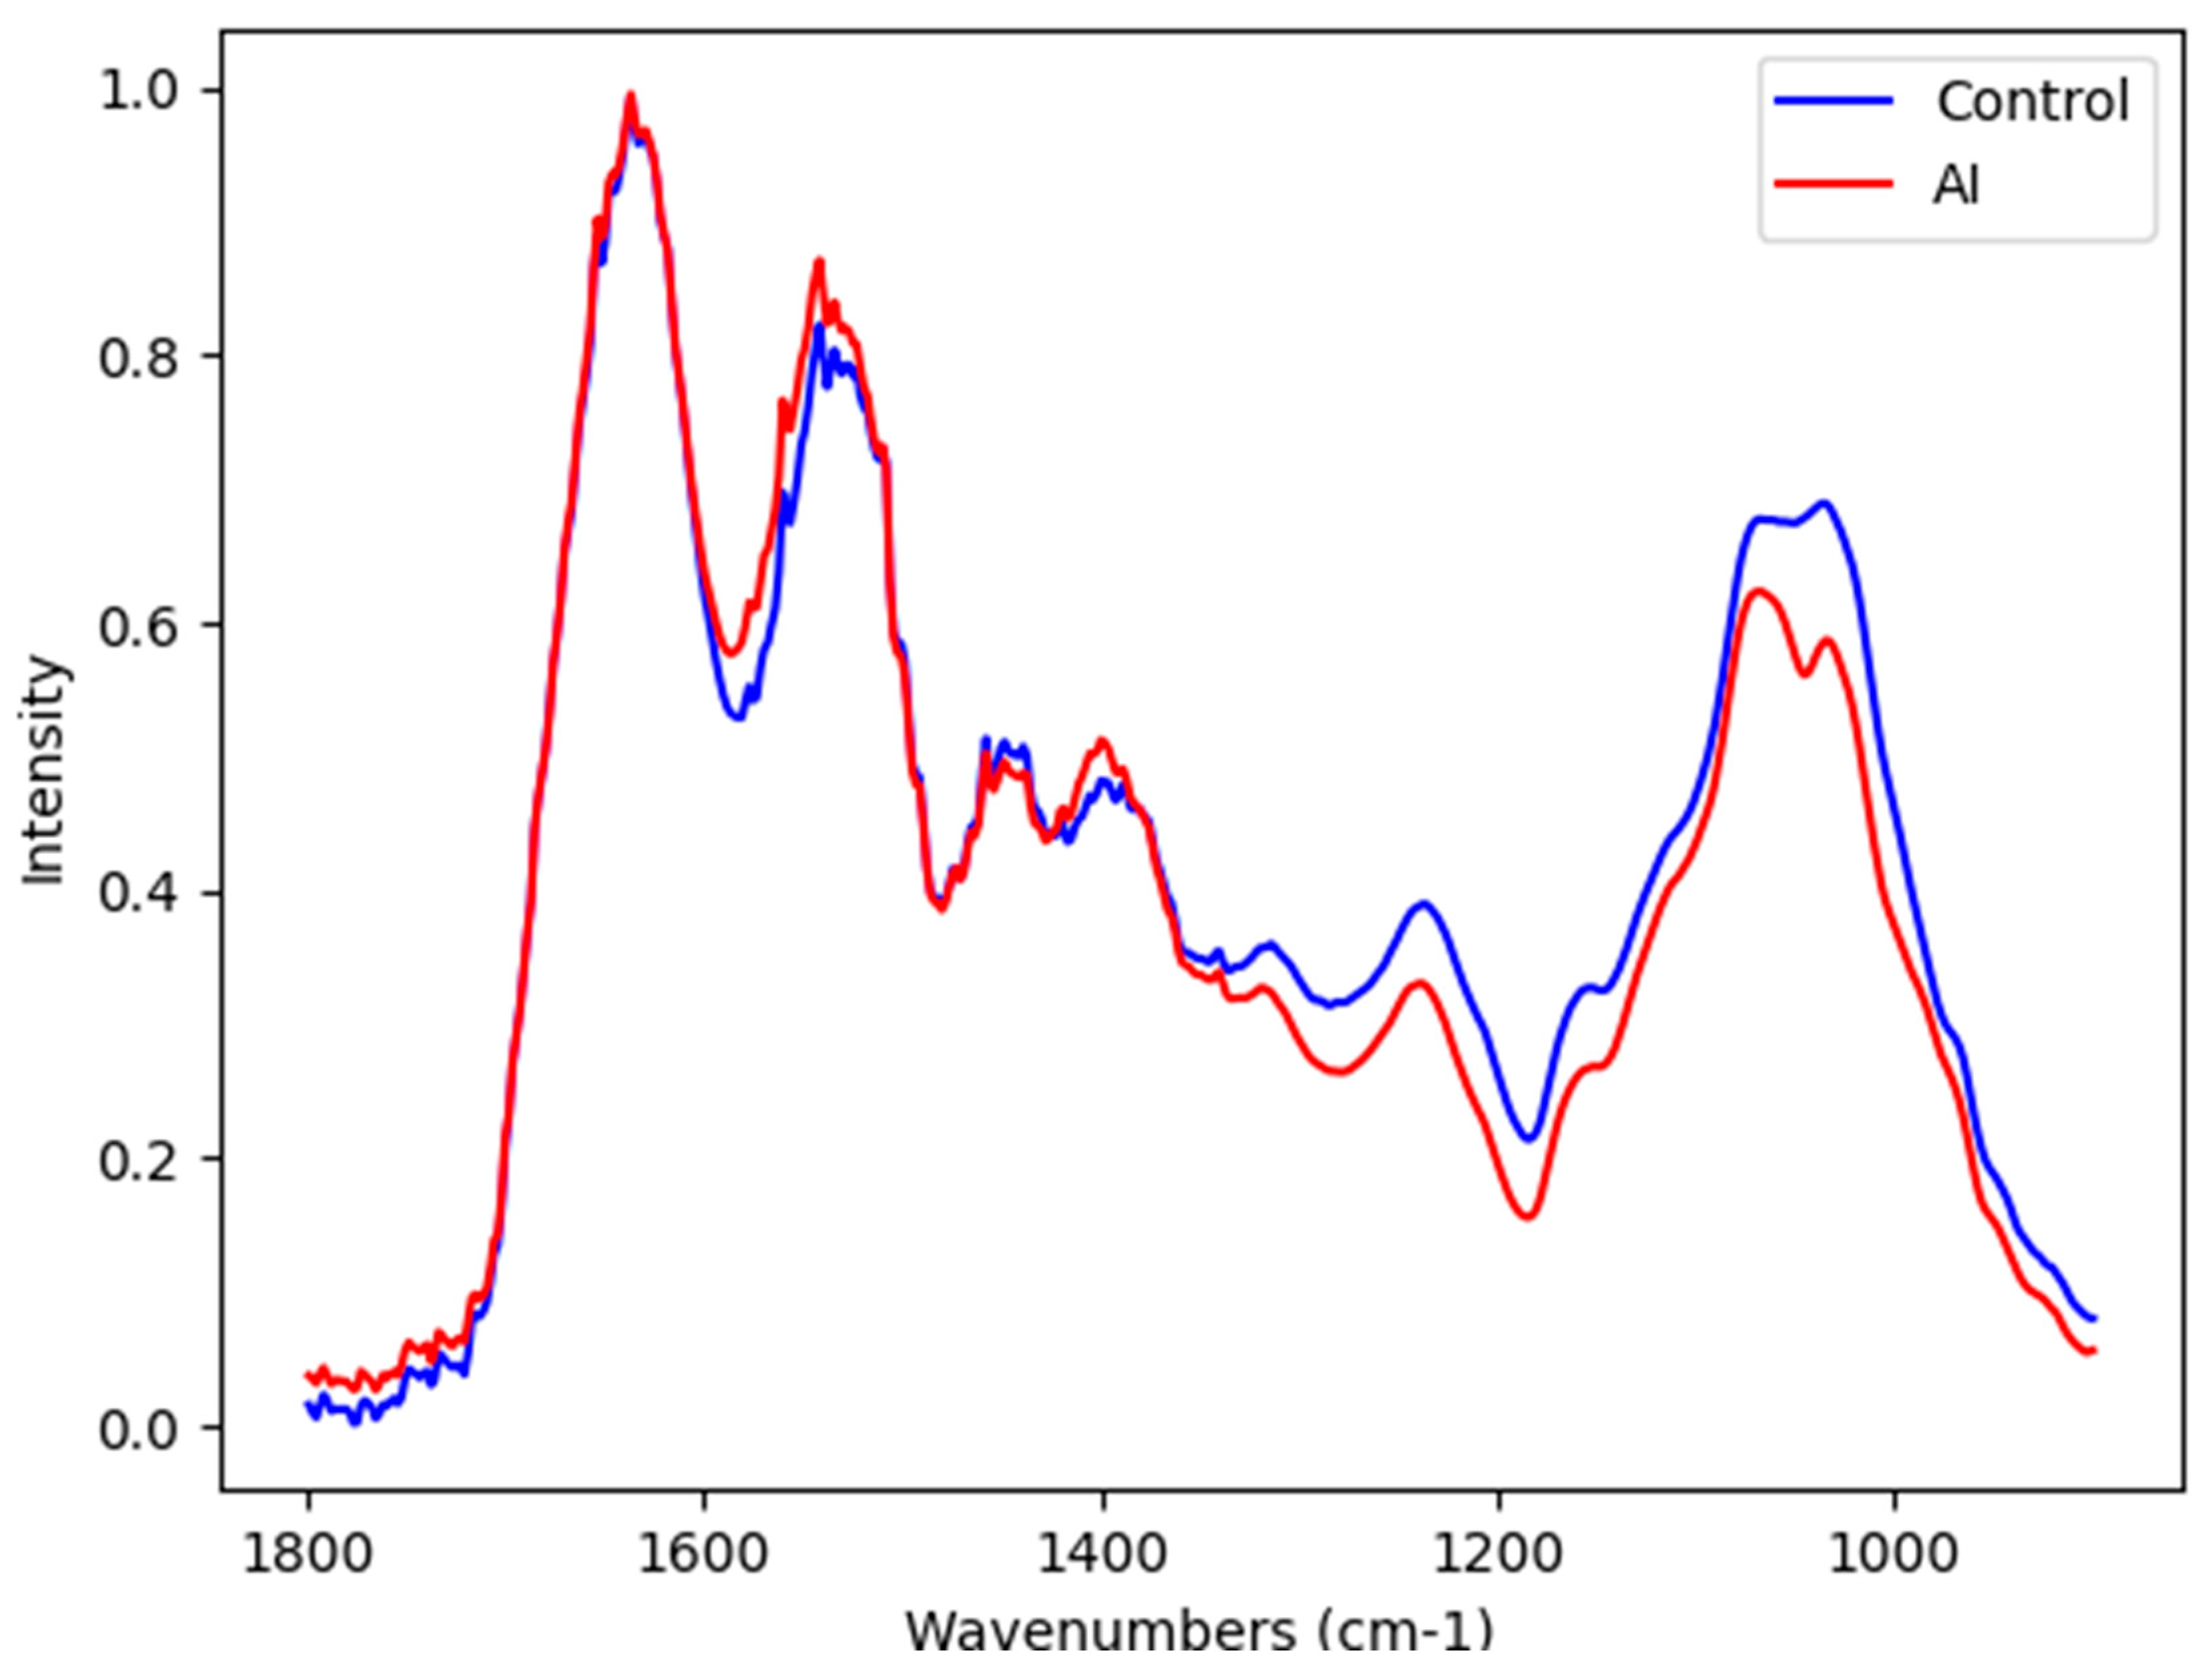
Blood Plasma Infrared Spectroscopy
3. Discussion
4. Materials and Methods
4.1. Study Design
4.2. Saliva Collection
4.3. Chemical Profile of Unstimulated Saliva by ATR-FTIR Spectroscopy
4.4. Chemometric Analysis
4.5. Spectra Data Evaluation Procedures
4.6. Statistical Analysis for Epidemiological Characteristics
5. Conclusions
Author Contributions
Funding
Institutional Review Board Statement
Informed Consent Statement
Data Availability Statement
Conflicts of Interest
References
- Smith, C.E.L.; Poulter, J.A.; Antanaviciute, A.; Kirkham, J.; Brookes, S.J.; Inglehearn, C.F.; Mighell, A.J. Amelogenesis Imperfecta; Genes, Proteins, and Pathways. Front Physiol. 2017, 8, 435. [Google Scholar] [CrossRef] [PubMed]
- Gadhia, K.; McDonald, S.; Arkutu, N.; Malik, K. Amelogenesis Imperfecta: An Introduction. Br. Dent. J. 2012, 212, 377–379. [Google Scholar] [CrossRef]
- Aldred, M.J.; Savarirayan, R.; Crawford, P.J. Amelogenesis Imperfecta: A classification and catalogue for the 21st century. Oral Dis. 2003, 1, 19–23. [Google Scholar] [CrossRef] [PubMed]
- Hoppenreijs, T.J.M.; Voorsmit, R.A.C.A.; Freihofer, H.P.M. Open Bite Deformity in Amelogenesis Imperfecta Part 1: An Analysis of Contributory Factors and Implications for Treatment. J. Cranio-Maxillofac. Surg. 1998, 26, 260–266. [Google Scholar] [CrossRef]
- Lundberg, J.O. Nitrate Transport in Salivary Glands with Implications for NO Homeostasis. Proc. Natl. Acad. Sci. USA 2012, 109, 13144–13145. [Google Scholar] [CrossRef] [PubMed]
- Wang, L.; Middleton, C.T.; Zanni, M.T.; Skinner, J.L. Development and Validation of Transferable Amide I Vibrational Frequency Maps for Peptides. J. Phys. Chem. B 2011, 115, 3713–3724. [Google Scholar] [CrossRef] [PubMed]
- Caixeta, D.C.; Oliveira, S.W.; Cardoso-Sousa, L.; Cunha, T.M.; Goulart, L.R.; Martins, M.M.; Marin, L.M.; Jardim, A.C.G.; Siqueira, W.L.; Sabino-Silva, R. One-Year Update on Salivary Diagnostic of COVID-19. Front. Public Health 2021, 9, 589564. [Google Scholar] [CrossRef]
- Dawes, C.; Wong, D.T.W. Role of Saliva and Salivary Diagnostics in the Advancement of Oral Health. J. Dent. Res. 2019, 98, 133–141. [Google Scholar] [CrossRef] [PubMed]
- Kaczor-Urbanowicz, K.E.; Martin Carreras-Presas, C.; Aro, K.; Tu, M.; Garcia-Godoy, F.; Wong, D.T. Saliva Diagnostics–Current Views and Directions. Exp. Biol. Med. 2017, 242, 459–472. [Google Scholar] [CrossRef]
- Küchler, E.C.; Pecharki, G.D.; Castro, M.L.; Ramos, J.; Barbosa, F., Jr.; Brancher, J.A.; Vieira, A.R.; Gerlach, R.F.; Trevilatto, P.C. Genes Involved in the Enamel Development Are Associated with Calcium and Phosphorus Level in Saliva. Caries Res. 2017, 51, 225–230. [Google Scholar] [CrossRef]
- Weber, M.L.; Hsin, H.-Y.; Kalay, E.; Brožková, D.Š.; Shimizu, T.; Bayram, M.; Deeley, K.; Küchler, E.C.; Forella, J.; Ruff, T.D.; et al. Role of Estrogen Related Receptor Beta (ESRRB) in DFN35B Hearing Impairment and Dental Decay. BMC Med. Genet. 2014, 15, 81. [Google Scholar] [CrossRef]
- Vieira, A.R.; Modesto, A. Amelogenesis Imperfecta Enamel Changes, Amelogenin, and Dental Caries Susceptibility. Front. Dent. Med. 2020, 1, 613851. [Google Scholar] [CrossRef]
- Butler, H.J.; Brennan, P.M.; Cameron, J.M.; Finlayson, D.; Hegarty, M.G.; Jenkinson, M.D.; Palmer, D.S.; Smith, B.R.; Baker, M.J. Development of High-Throughput ATR-FTIR Technology for Rapid Triage of Brain Cancer. Nat. Commun. 2019, 10, 4501. [Google Scholar] [CrossRef]
- Caixeta, D.C.; Aguiar, E.M.G.; Cardoso-Sousa, L.; Coelho, L.M.D.; Oliveira, S.W.; Espindola, F.S.; Raniero, L.; Crosara, K.T.B.; Baker, M.J.; Siqueira, W.L.; et al. Salivary Molecular Spectroscopy: A Sustainable, Rapid and Non-Invasive Monitoring Tool for Diabetes Mellitus during Insulin Treatment. PLoS ONE 2020, 15, e0223461. [Google Scholar] [CrossRef]
- Ferreira, I.C.C.; Aguiar, E.M.G.; Silva, A.T.F.; Santos, L.L.D.; Cardoso-Sousa, L.; Araújo, T.G.; Santos, D.W.; Goulart, L.R.; Sabino-Silva, R.; Maia, Y.C.P. Attenuated Total Reflection-Fourier Transform Infrared (ATR-FTIR) Spectroscopy Analysis of Saliva for Breast Cancer Diagnosis. J. Oncol. 2020, 2020, 4343590. [Google Scholar] [CrossRef]
- Baker, M.J.; Trevisan, J.; Bassan, P.; Bhargava, R.; Butler, H.J.; Dorling, K.M.; Fielden, P.R.; Fogarty, S.W.; Fullwood, N.J.; Heys, K.A.; et al. Using Fourier Transform IR Spectroscopy to Analyze Biological Materials. Nat. Protoc. 2014, 9, 1771–1791. [Google Scholar] [CrossRef]
- Rodrigues, V.P.; Franco, M.M.; Marques, C.P.C.; de Carvalho, R.C.C.; Leite, S.A.M.; Pereira, A.L.A.; Benatti, B.B. Salivary Levels of Calcium, Phosphorus, Potassium, Albumin and Correlation with Serum Biomarkers in Hemodialysis Patients. Arch. Oral Biol. 2016, 62, 58–63. [Google Scholar] [CrossRef]
- Movasaghi, Z.; Rehman, S.; ur Rehman, I., Dr. Fourier Transform Infrared (FTIR) Spectroscopy of Biological Tissues. Appl. Spectrosc. Rev. 2008, 43, 134–179. [Google Scholar] [CrossRef]
- Takamura, A.; Watanabe, K.; Akutsu, T.; Ozawa, T. Soft and Robust Identification of Body Fluid Using Fourier Transform Infrared Spectroscopy and Chemometric Strategies for Forensic Analysis. Sci. Rep. 2018, 8, 8459. [Google Scholar] [CrossRef]
- Wang, X.; Mihailova, B.; Klocke, A.; Heidrich, S.; Bismayer, U. Effect of Artificial Saliva on the Apatite Structure of Eroded Enamel. Int. J. Spectrosc. 2011, 2011, 236496. [Google Scholar] [CrossRef]
- Caixeta, D.C.; Carneiro, M.G.; Rodrigues, R.; Alves, D.C.T.; Goulart, L.R.; Cunha, T.M.; Espindola, F.S.; Vitorino, R.; Sabino-Silva, R. Salivary ATR-FTIR Spectroscopy Coupled with Support Vector Machine Classification for Screening of Type 2 Diabetes Mellitus. Diagnostics 2023, 13, 1396. [Google Scholar] [CrossRef] [PubMed]
- Theakstone, A.G.; Brennan, P.M.; Jenkinson, M.D.; Goodacre, R.; Baker, M.J. Investigating Centrifugal Filtration of Serum-Based FTIR Spectroscopy for the Stratification of Brain Tumours. PLoS ONE 2023, 18, e0279669. [Google Scholar] [CrossRef]
- Tessaro, L.; da Silva Mutz, Y.; de Andrade, J.C.; Aquino, A.; Belem, N.K.R.; Silva, F.G.S.; Conte-Junior, C.A. ATR-FTIR Spectroscopy and Chemometrics as a Quick and Simple Alternative for Discrimination of SARS-CoV-2 Infected Food of Animal Origin. Spectrochim. Acta Part A Mol. Biomol. Spectrosc. 2023, 285, 121883. [Google Scholar] [CrossRef] [PubMed]
- Seow, W.K. Clinical Diagnosis of Enamel Defects: Pitfalls and Practical Guidelines. Int. Dent. J. 1997, 47, 173–182. [Google Scholar] [CrossRef] [PubMed]
- Sabandal, M.M.I.; Schäfer, E. Amelogenesis Imperfecta: Review of Diagnostic Findings and Treatment Concepts. Odontology 2016, 104, 245–256. [Google Scholar] [CrossRef]
- Silva, L.G.; Péres, A.F.S.; Freitas, D.L.D.; Morais, C.L.M.; Martin, F.L.; Crispim, J.C.O.; Lima, K.M.G. ATR-FTIR Spectroscopy in Blood Plasma Combined with Multivariate Analysis to Detect HIV Infection in Pregnant Women. Sci. Rep. 2020, 10, 20156. [Google Scholar] [CrossRef] [PubMed]
- Siqueira, W.L.; Bermejo, P.R.; Mustacchi, Z.; Nicolau, J. Buffer Capacity, PH, and Flow Rate in Saliva of Children Aged 2–60 months with Down Syndrome. Clin. Oral Investig. 2005, 9, 26–29. [Google Scholar] [CrossRef] [PubMed]
- Davidovich, E.; Aframian, D.J.; Shapira, J.; Peretz, B. A Comparison of the Sialochemistry, Oral PH, and Oral Health Status of down Syndrome Children to Healthy Children. Int. J. Paediatr. Dent. 2010, 20, 235–241. [Google Scholar] [CrossRef]
- de Sousa, M.C.; Vieira, R.B.; dos Santos, D.S.; Carvalho, C.A.T.; Camargo, S.E.A.; Mancini, M.N.G.; de Oliveira, L.D. Antioxidants and Biomarkers of Oxidative Damage in the Saliva of Patients with Down’s Syndrome. Arch. Oral Biol. 2015, 60, 600–605. [Google Scholar] [CrossRef]
- Khaustova, S.; Shkurnikov, M.; Tonevitsky, E.; Artyushenko, V.; Tonevitsky, A. Noninvasive Biochemical Monitoring of Physiological Stress by Fourier Transform Infrared Saliva Spectroscopy. Analyst 2010, 135, 3183. [Google Scholar] [CrossRef]
- Udensi, J.; Loskutova, E.; Loughman, J.; Byrne, H.J. Raman Spectroscopic Analysis of Human Blood Serum of Glaucoma Patients Supplemented with Macular Pigment Carotenoids. J. Biophotonics 2024, 17, e202400060. [Google Scholar] [CrossRef] [PubMed]
- Greenacre, M.; Groenen, P.J.F.; Hastie, T.; D’Enza, A.I.; Markos, A.; Tuzhilina, E. Principal Component Analysis. Nat. Rev. Methods Primers 2022, 2, 100. [Google Scholar] [CrossRef]
- Untereiner, V.; Sockalingum, G.D.; Garnotel, R.; Gobinet, C.; Ramaholimihaso, F.; Ehrhard, F.; Diebold, M.-D.; Thiéfin, G. Bile Analysis Using High-Throughput FTIR Spectroscopy for the Diagnosis of Malignant Biliary Strictures: A Pilot Study in 57 Patients. J. Biophotonics 2014, 7, 241–253. [Google Scholar] [CrossRef]

| Algorithm (Spectral Area) | Pre-Processing | Sensitivity | Specificity | Accuracy |
|---|---|---|---|---|
| Linear Discriminant Analysis (LDA) 1800–900 cm−1 | rb + amide I * | 82% | 64% | 72% |
| Savitzky–Golay | 64% | 57% | 60% | |
| Random forest 1800–900 cm−1 | rb + amide I * | 54% | 50% | 52% |
| Savitzky–Golay | 64% | 79% | 72% | |
| Supporting Vector Machine (SVM) 1800–900 cm−1 | rb + amide I * | 100% | 79% | 88% |
| Savitzky–Golay | 73% | 71% | 72% |
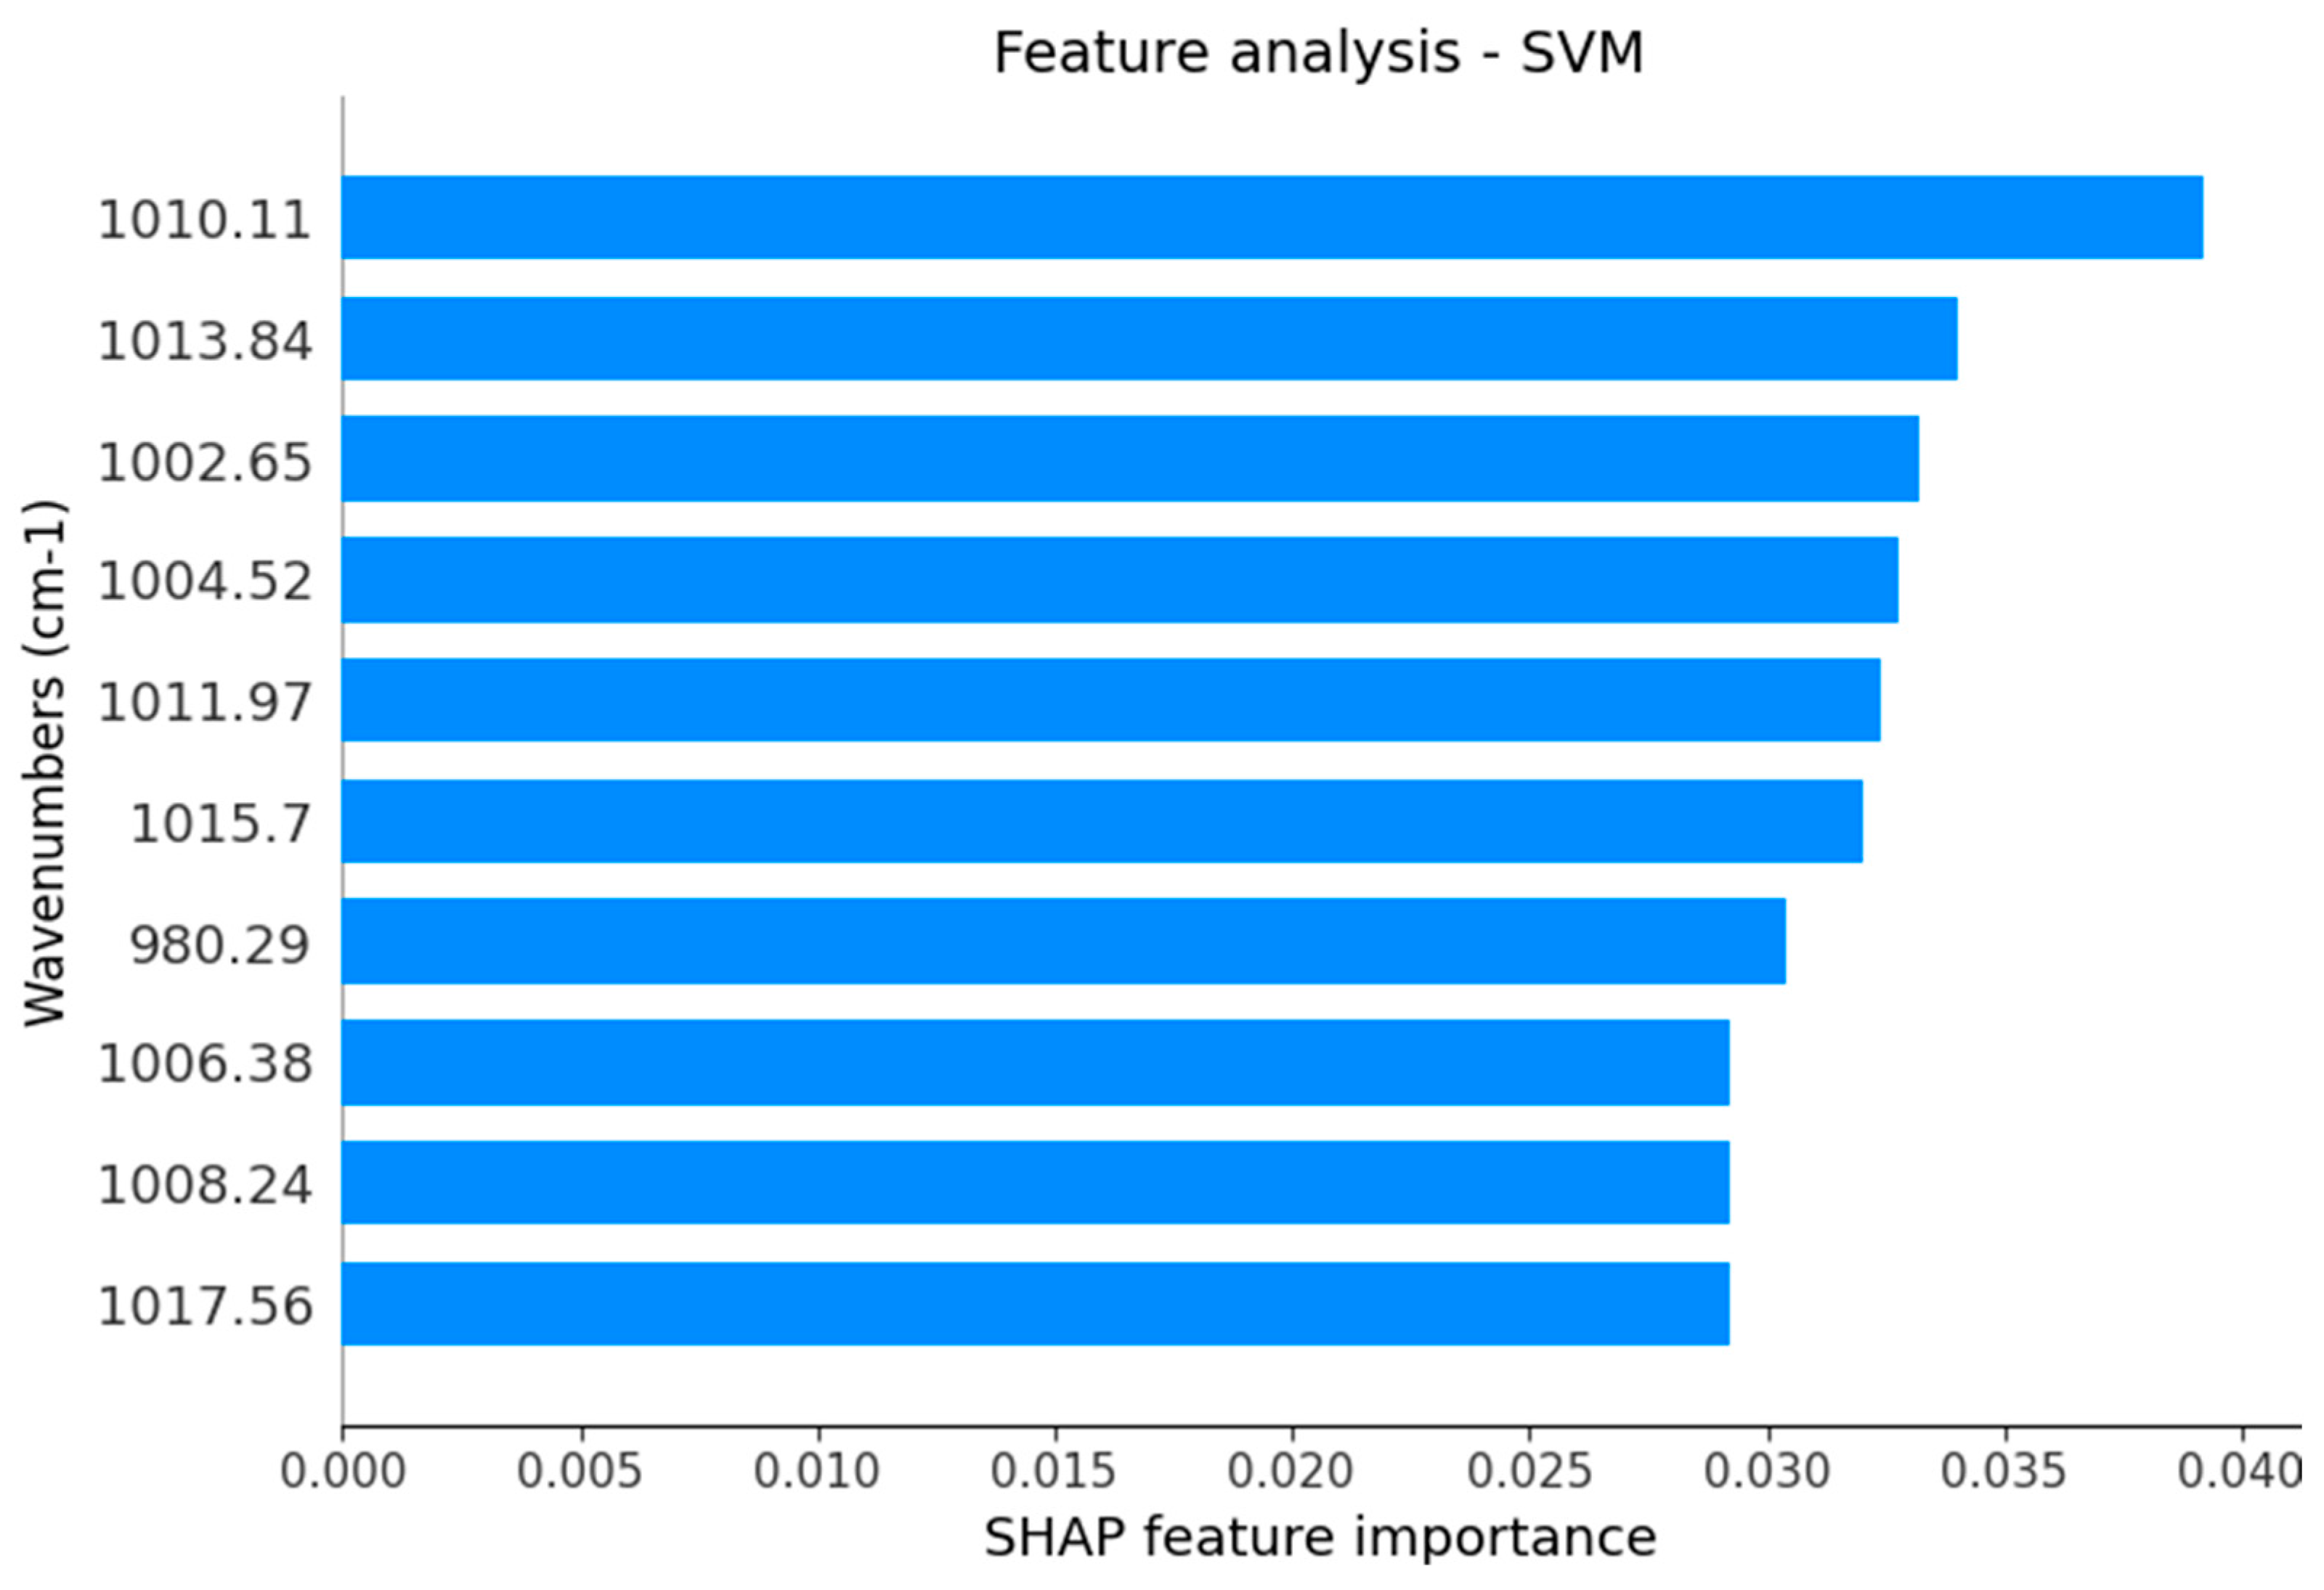
| Selected Vibrational Mode | Tentative Assignment | Type of Potential Source |
|---|---|---|
| 1017 cm−1 | DNA | DNA |
| 1015 cm−1 | Antisymmetric stretching mode of PO4 tetrahedra | Hydroxyapatite |
| 1013 cm−1 | Antisymmetric stretching mode of PO4 tetrahedra | Hydroxyapatite |
| 1011 cm−1 | Antisymmetric stretching mode of PO4 tetrahedra | Hydroxyapatite |
| 1010 cm−1 | Stretching C-O deoxyribose | Carbohydrates |
| 1008 cm−1 | C = C torsion | Proteins |
| 1006 cm−1 | Sugar moieties from glycoproteins | Glycosylated proteins |
| 1004 cm−1 | Sugar moieties from glycoproteins | Glycosylated proteins |
| 1002 cm−1 | Stretching C-O deoxyribose | Carbohydrates |
| 980 cm−1 | OCH3 (polysaccharides) | Carbohydrates |
Disclaimer/Publisher’s Note: The statements, opinions and data contained in all publications are solely those of the individual author(s) and contributor(s) and not of MDPI and/or the editor(s). MDPI and/or the editor(s) disclaim responsibility for any injury to people or property resulting from any ideas, methods, instructions or products referred to in the content. |
© 2024 by the authors. Licensee MDPI, Basel, Switzerland. This article is an open access article distributed under the terms and conditions of the Creative Commons Attribution (CC BY) license (https://creativecommons.org/licenses/by/4.0/).
Share and Cite
Avelar, F.M.; Lanza, C.R.M.; Bernardino, S.S.; Garcia-Junior, M.A.; Martins, M.M.; Carneiro, M.G.; de Azevedo, V.A.C.; Sabino-Silva, R. Salivary Molecular Spectroscopy with Machine Learning Algorithms for a Diagnostic Triage for Amelogenesis Imperfecta. Int. J. Mol. Sci. 2024, 25, 9464. https://doi.org/10.3390/ijms25179464
Avelar FM, Lanza CRM, Bernardino SS, Garcia-Junior MA, Martins MM, Carneiro MG, de Azevedo VAC, Sabino-Silva R. Salivary Molecular Spectroscopy with Machine Learning Algorithms for a Diagnostic Triage for Amelogenesis Imperfecta. International Journal of Molecular Sciences. 2024; 25(17):9464. https://doi.org/10.3390/ijms25179464
Chicago/Turabian StyleAvelar, Felipe Morando, Célia Regina Moreira Lanza, Sttephany Silva Bernardino, Marcelo Augusto Garcia-Junior, Mario Machado Martins, Murillo Guimarães Carneiro, Vasco Ariston Carvalho de Azevedo, and Robinson Sabino-Silva. 2024. "Salivary Molecular Spectroscopy with Machine Learning Algorithms for a Diagnostic Triage for Amelogenesis Imperfecta" International Journal of Molecular Sciences 25, no. 17: 9464. https://doi.org/10.3390/ijms25179464