Abstract
Complement component 3 (C3) deficiency has recently been reported as one of the novel causes of constipation. To identify a unique gene specific to constipation caused by C3 deficiency, the total RNA extracted from the mid colon of C3 knockout (C3 KO) mice was hybridized to oligonucleotide microarrays, and the function of the candidate gene was verified in in vitro and in vivo models. C3 KO mice used for microarrays showed definite phenotypes of constipation. Overall, compared to the wild type (WT), 1237 genes were upregulated, and 1292 genes were downregulated in the C3 KO mice. Of these, the major genes included were lysine (K)-specific demethylase 5D (KDM5D), olfactory receptor 870 (Olfr870), pancreatic lipase (PNLIP), and alkaline phosphatase intestinal (ALPI). Specifically, the ALPI gene was selected as a novel gene candidate based on alterations during loperamide (Lop)-induced constipation and intestinal bowel disease (IBD). The upregulation of ALPI expression treated with acetate recovered the expression level of mucin-related genes in primary epithelial cells of C3 KO mice as well as most phenotypes of constipation in C3 KO mice. These results indicate that ALPI plays an important role as the novel gene associated with C3 deficiency-induced constipation.
1. Introduction
Complement component 3 (C3) is the most important protein that mediates the complement activation process in the classical, alternative, and lectin pathways for innate immune response [1]. During the activation process, this protein is cleaved into C3a and C3b by C3 convertase [2]. The C3a fragment can mediate various physiological responses including the contraction of smooth muscles, enhancement of vascular permeability, release of histamine from the mast cells, and suppression of B cell polyclonal responses through binding to C3a receptors, while the C3b fragments are combined with C3 convertase to form C5 convertase (C4b2a3b or C3bBb3b), which is responsible for assembly of the membrane attack complex (MAC) [3,4,5]. In addition to the above-mentioned roles, the novel function of C3 has recently been investigated in chronic constipation. Some prominent symptoms of constipation associated with stool excretion, gastrointestinal (GI) transit, mucosal layer thickness, and mucin secretion were detected in sixteen-week-old C3 knockout (C3 KO) mice [6]. These mice also showed dysregulation of the composition of neuronal and interstitial cells of Cajal (ICC), the excitatory and inhibitory transmission of the enteric nervous system (ENS), and expression of C3 receptors in the mid colon during C3 deficiency-induced constipation [7]. Significant inflammatory responses were observed in C3 KO mice with constipation phenotypes through activation of the inducible nitric oxide synthase (iNOS)-mediated cyclooxygenase-2 (COX-2) induction pathway, apoptosis-associated speck-like protein containing a caspase recruitment domain (ASC)-inflammasome pathway and the nuclear factor kappa B (NF-κB) signaling pathway [8]. Furthermore, these mice also showed dysbiosis of fecal microbiota with the presence of Anaerocolumna, Caecibacterium, Christensenella, Prevotellamassilia, Reuthenibacterium and Prevotella populations during constipation [9]. Based on these results, several recent studies carried out to elucidate the novel functions of C3 in the pathogenesis and treatment of constipation have received a lot of attention.
Meanwhile, a limited number of studies have focused on the identification of new genes associated with constipation for the development of novel therapeutics for the treatment of constipation. Around 581 upregulated genes and 216 downregulated genes were detected in the mid colon of Sprague Dawley (SD) rats with constipation induced by loperamide (Lop) during the characterization of the global gene profile in response to the laxative effects of aqueous extracts of Liriope platyphylla (AEtLP). They included various functional genes such as solute carrier family 9 (sodium/hydrogen exchanger), member 5 (SLC9A5), kallikrein-related peptidase 10 (KLK10), fibroblast growth factor 15 (FGF15), alkaline phosphatase intestinal (ALPI), sphingosine kinase 1 (SPHK1), angiotensin I-converting enzyme (peptidyl-dipeptidase A) 1 (ACE), SET-binding protein 1 (SETBP1), serine (or cysteine) peptidase inhibitor, clade A, member 3N (SERPINA3N), lipocalin 2 (LCN2) and RAS-like, estrogen-regulated, growth-inhibitor (RERG) [10]. Also, in the comparative pharmacokinetics analyses of rhein (a natural botanical medicine), alterations to expression of several genes including LCN2, guanylate-binding protein 2 (GBP2), indolethylamine N-methyltransferase (INMT), glucose-6-phosphatase catalytic subunit (G6PC), carbon catabolite repression 4-like (CCRN41) and cathedrin17 (CDH17) were detected in the liver tissue of constipated SD rats after administration of Lop [11]. Furthermore, genes that were differentially expressed between irritable bowel syndrome (IBS) patients with constipation and healthy controls were detected in the sigmoid colon. Among them, some genes such as T cell differentiation protein (MAL), cadherin 16 (CDH16), tight junction-associated protein 1 (TJAP1), and NADPH oxidase 4 (NOX4) were upregulated in the IBS-constipation (IBS-C) group, while other genes such as damage-specific DNA-binding protein 1 (DDB1) and CUL4-associated factor 1 (DCAF1), aldehyde dehydrogenase 9, family member A1 (ALDH9A1), synaptosome-associated protein 47 (SNAP47), palladin, cytoskeletal-associated protein (PALLD) and NK3 homeobox 1 (NKX3-1) were downregulated in the same group [12]. However, no studies to date have attempted to identify the novel genes that play an important role in C3 deficiency-induced constipation despite scientific evidence that C3 deficiency is an important cause of constipation.
In this study, we have attempted to identify a novel gene in response to the C3 deficiency-induced constipation through characterization of changes in the global gene profile. Subsequently, the function of the key gene candidates was further verified by a recovery study in the intestinal epithelial cells of C3 KO mice with constipation phenotypes.
2. Results
2.1. Verification of C3 Deficiency-Induced Constipation in C3 KO Mice
First, we confirmed the constipation phenotypes in C3 KO mice to obtain suitable colon samples for microarray analysis although they have been reported in previous studies. Especially, the verification of constipation phenotypes of mice used in this study is very important to provide a scientific justification for the changes in the global gene expression. To achieve this, the alterations in the stool parameters, GI transit, and the histological structure of mid colon were analyzed in sixteen-week-old wild-type (WT) and C3 KO mice. The number and water content of stools were lower by 52% and 43%, respectively, in the C3 KO mice compared to the WT mice (Figure 1A). A similar pattern was detected in the transit ratio of the charcoal meal and the colon length. These levels were decreased by 29% and 19%, respectively, in the C3 KO mice compared to the WT mice (Figure 1B). Also, the C3 KO mice showed a decrease in mucosal and muscle layer thickness when compared to those of the WT mice (Figure 1C). Therefore, these results suggest that sixteen-week-old C3 KO mice were prominent constipation phenotypes. Furthermore, the above results indicate that these mice with chronic constipation caused by C3 deficiency are suitable for the characterization of the genetic profile.
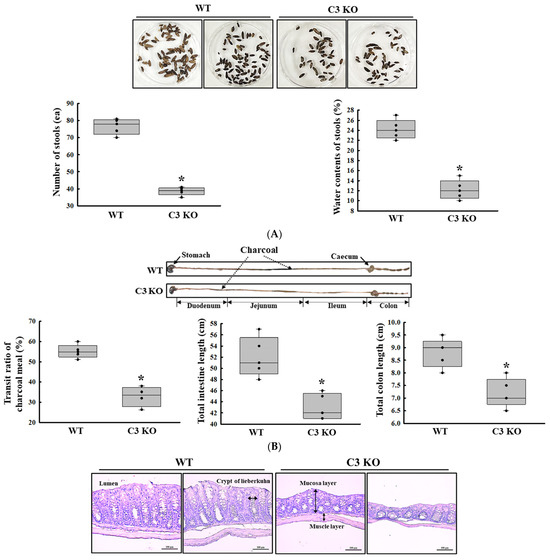
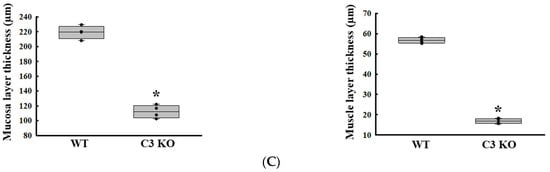
Figure 1.
Stool excretion, GI transit ratio and mid colon histology of C3 KO mice. (A) Stools excretion. Digital camera images of the stools were taken immediately after collection from the metabolic cage. The total number and water contents of stools were measured as described in the Materials and Methods. Five to six mice per group were used for the stool sample collection, and each parameter was assayed in duplicates. (B) GI transit ratio and intestine length. The total intestinal tract was excised from mice of the subset groups treated with charcoal meal powder. The arrows indicate the position of the charcoal meal. Five to six mice per group were used in the GI transit ratio test, and the charcoal meal transit distance, total intestine length and colon length were measured in duplicates. (C) Histological structures of the mid colons. The H&E-stained sections of the mid colon from the WT and KO mice were observed at 100× magnification using a light microscope. Five to six mice per group were used in the histological analysis, and each parameter was measured in duplicates in two different slides. The data were presented as the mean ± SD. * p < 0.05 vs. WT mice. Abbreviation: WT, wild type; C3 KO, complement C3 knockout; GI, gastrointestinal; H&E, hematoxylin and eosin.
2.2. Characterization of the Changes in the Global Gene Expression Using the Mid Colon Tissue in C3 Deficiency-Induced Constipation
To characterize the changes in the global gene expression in response to C3 deficiency-induced constipation, the total RNA extracted from the mid colon tissue of the sixteen-week-old C3 KO mice was hybridized into oligonucleotide microarrays. First, the differential distribution of the global genes between the WT mice and C3 KO mice was confirmed in the normalized data using a volume plot and scatter plot. Genes that upregulated and downregulated more than 1.5-fold were successfully distributed between the two groups, and five genes with high fold changes, including transglutaminase 3, E polypeptide (TGM3), carbonic anhydrase 1 (CAR1), chymotrypsin-like elastase family, member 1 (CELA1), resistin-like beta (RETNLB) and immunoglobulin kappa chain variable 21 (IGK-V21), were detected in the volume plot (Figure 2A,B). Based on the above comparison, the differentially expressed gene (DEG) (|Fold change (FC)| ≥ 1.5) between the WT and C3 KO mice were detected and these comprised 2529 genes that responded to constipation from the pool of total filtered genes (33,793). Among these, 1237 genes were upregulated, and 1292 genes were downregulated in the C3 KO mice compared to the WT mice. On the other hand, statistical significance was detected in only 545 genes out of the 2529 DEG if cut off value was set to more than 2. These genes exhibited 226 upregulations and 229 downregulations (Table 1, Figure 2C and Supplement Figure S1).
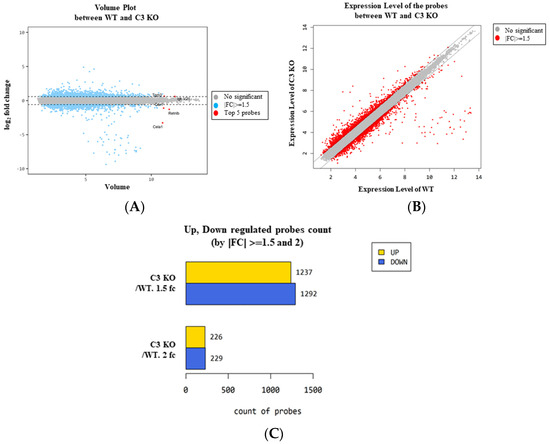
Figure 2.
Volume and scatter plots of the normalized microarray in C3 KO mice. (A) Volume plot of the WT mice and C3 KO mice. (B) Scatter plot of the WT and C3 KO mice. (C) Differentially regulated probe count. The number of genes expressed differently between WT and C3 KO mice were represented as 1.5 FC and 2 FC. Abbreviation: WT, wild type; C3 KO, complement C3 knockout; FC, fold change.

Table 1.
Selection of the differentially expressed genes in the colon of C3 KO mice.
Based on the PANTHER/X ontology analyses, 2529 genes with an FC of more than 1.5 were classified into 20 Gene Ontology (GO) categories after dividing them into upregulated genes and downregulated genes. The upregulated genes included various GO categories, such as immunoglobulin chain (30 genes), response to chemicals (21 genes), molecular transducer activity (16 genes), biological regulation (13 genes), and cell periphery (11 genes). Also, differences in the GO categories including predicted gene (50 genes), immunoglobulin chain (23 genes), response to chemical (22 genes), cell periphery (21 genes), and molecular transducer activity (20 genes) were detected in the downregulated genes (Table 2). Furthermore, each gene was characterized from the lists of total genes upregulated and downregulated in the C3 deficiency-induced constipation in the mid colon of the C3 KO mice. Of the 226 upregulated genes, the largest difference was detected in eukaryotic translation initiation factor 2 subunit 3 and structural gene Y-linked (Eif2s3y) genes (29.68-fold), followed by ubiquitously transcribed tetratricopeptide repeat containing, Y-linked (UTY, 24.65-fold), lysine demethylase 5D (KDM5D, 19.14-fold), immunoglobulin kappa variable 6-32 (IGKV6-32, 7.94-fold), olfactory receptor 870 (Olfr870, 5.71-fold), and DEAD-box helicase 3 Y-linked (DDX3Y, 5.65-fold) (Table 3 and Supplementary Table S1). Also, 229 downregulated genes, including pancreatic lipase (PNLIP, -658.36-fold), carboxyl ester lipase (CEL, -476.60-fold), carboxypeptidase B1 (CPB1, -257.26-fold), chymotrypsin-like (CTRL, -214.25-fold), pancreatic lipase-related protein 1 (PNLIPRP1, -205.18-fold), and regenerating islet-derived 1 (REG1, -187.41-fold) were downregulated in C3 deficiency-induced constipation (Table 4 and Supplementary Table S2). Taken together, these results provide the gene profile in animal models with C3 deficiency-induced constipation.
Table 2.
Selection of the differentially expressed genes in the colon of C3 KO mice.
Table 3.
List of genes (by |FC| ≥ 3) upregulated by C3 deficiency-induced constipation.
Table 4.
List of genes (by |FC| ≥ 3) downregulated by C3 deficiency-induced constipation.
2.3. Reliability of the Expression of Differential Genes Detected in the Microarray Analysis
We confirmed the reliability of the gene expressions obtained from the microarray analysis. To achieve this, the expression level of two upregulated genes (endothelin-1; EDN1 and neurexophilin and PC-esterase domain family member 4; NXPE4) and two downregulated genes (RETNLB and ALPI) were measured by RT-qPCR analyses. The expression patterns of these genes were completely reflected in those observed from the microarray analysis of the mid colon in C3 deficiency-induced constipation, although the alteration rate varied. The expression level of the EDN1 and NXPE4 genes was increased in the C3 KO mice compared to the WT mice, while those of RETNLB and ALPI were decreased in the same group (Figure 3).
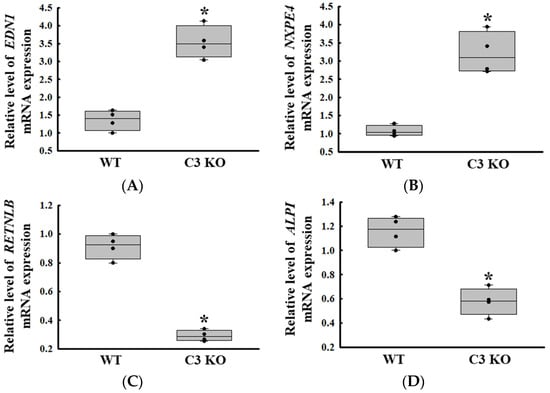
Figure 3.
Transcription level of the upregulated genes and downregulated genes. Transcription level of EDN1 (A) and NXPE4 (B). Transcription level of RETNLB (C) and ALPI (D). The transcription levels of four genes were measured in the total mRNA of the colon by RT-qPCR using specific primers. The mRNA levels of the four genes were calculated based on the intensity of β-actin as an endogenous control. The preparation of total RNAs was performed on three to five mice per group, RT-qPCR analyses were assayed twice for each total RNA. The data were presented as the mean ± SD. * p < 0.05 vs. WT mice. Abbreviation: WT, wild type; C3 KO, complement C3 knockout; EDN1, endothelin-1; NXPE4, neurexophilin and PC-esterase domain family member 4; RETNLB, resistin-like beta; ALPI, alkaline phosphatase intestinal; RT-qPCR, quantitative real-time PCR.
2.4. Biological Functions of Genes Associated with C3 Deficiency-Induced Constipation
To identify the biological functions of the genes associated with C3 deficiency-induced constipation, a Kyoto Encyclopedia of Genes and Genomes (KEGG) pathways analysis was conducted on 1237 upregulated genes and 1292 downregulated genes. Among these 2529 genes, the largest number of genes (150 genes) were related to olfactory transduction. Also, these analyses showed that some of these genes were related to ten important pathways, including olfactory transduction, pancreatic secretion, protein digestion and absorption, neuroactive ligand–receptor interaction, microRNAs in cancer, complement and coagulation cascades, fat digestion and absorption, neutrophil extracellular trap formation, calcium signaling pathway and systemic lupus erythematosus (Figure 4A). Specifically, several DEGs such as vitronectin (VTN), C3, C4A, CD59b antigen (CD59b), integrin alpha X (ITGAX), fibrinogen alpha chain (FGA), coagulation factor III (F3), CD55 molecule, decay accelerating factor for complement (CD55), kininogen 1 (KNG1), complement C3d receptor 2 (CR2), C7, fibrinogen gamma chain (FGG) and peptidase inhibitor, clade A, member 1C (SERPINAL1C) belonged to the neuroactive ligand–receptor interaction pathway (Figure 4B). In addition, the complement and coagulation cascades pathway included several marker genes including 2210010C04Rik, Protease, serine 2 (PRSS2), amylase alpha 2B (AMY2B), PRSS1, trypsin (TRY)4, cholecystokinin A receptor (CCKAR), TRY5, TRY10, gamma-aminobutyric acid A receptor, subunit alpha 4 (GABRA4), glucagon-like peptide 1 receptor (GLP1R), 1810009J06Rik, C3, adrenergic receptor, alpha 1d (ADRALD), PRSS3, trace amine-associated receptor 7D (TAAR7D) and 9230113P08Rik for GI-related diseases (Figure 4C). Therefore, these results suggest that the DEGs associated with C3 deficiency-induced constipation are closely associated with olfactory transduction, neuroactive ligand–receptor interaction, microRNAs in cancer, pancreatic secretion, protein digestion and absorption, and the calcium signaling pathway.
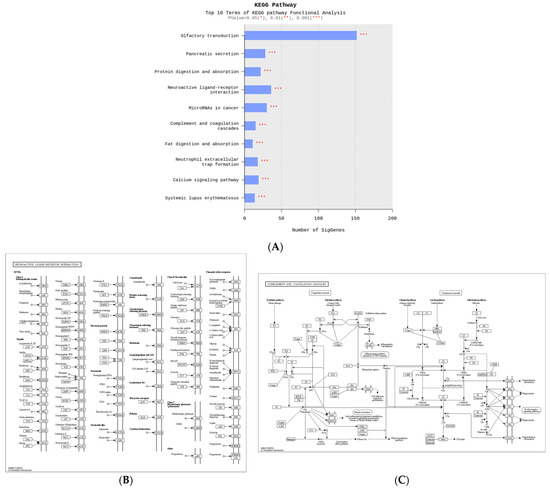
Figure 4.
KEGG pathway of functional analyses about differential genes between WT and C3 KO mice. (A) Top ten terms with statistical significance in the KEGG pathway. (B) Neuroactive ligand–receptor Interaction. (C) Complement and coagulation cascades. Abbreviation: WT, wild type; C3 KO, complement C3 knockout; KEGG, Kyoto Encyclopedia of Genes and Genomes.
2.5. Selection of the ALPI Gene as a New Treatment Target for C3 Deficiency-Induced Constipation and Verification of Its Function in Acetate-Treated Epithelial Cells
Next, we tried to identify the novel target gene associated with C3 deficiency-induced constipation based on the changes in the global gene expression in the colon. Among all the altered expression of gene, the ALPI gene was selected as the novel functional gene for constipation because the expression level of this gene was downregulated in Lop-induced constipation and C3 deficiency-induced constipation as well as the fact that the deficiency of the protein encoded by ALPI had been investigated as the cause of inflammatory bowel disease (IBD) [10,13]. Thus, the expression of the ALPI gene and its effects on mucin secretion ability and water retention capacity in C3 deficiency-induced constipation was first investigated in the epithelial cells derived from the C3 KO mice. Hence, alterations in the expression levels of the mucin (MUC) and aquaporins (AQP) genes were analyzed in C3-deficient epithelial cells after acetate treatment because in an earlier study 1 mM acetate treatment successfully induced the expression of the ALPI gene in pluripotent stem cell derived intestinal epithelial cell layers [14]. Briefly, the successful isolation of epithelial cells from the colon of C3 KO mice was verified by the detection of a high level of receptor protein kinase (C-kit) mRNA compared to that of muscle cells (Figure 5A). The expression level of the ALPI gene was lower in the epithelial cells derived from the C3 KO mice than in those from the WT mice. However, these levels were remarkably enhanced to levels above those of the WT mice cells after the acetate treatment (Figure 5B). These results show that the acetate-treated epithelial cells from C3 KO mice were suitable for analyzing the recovery effects of the ALPI gene during C3 deficiency-induced constipation. Furthermore, the expression levels of mucin, cell surface-associated (MUC1), oligomeric mucus/gel-forming (MUC2), Kruppel-like factor 4 (KLF4), AQP3, and AQP8 genes were significantly increased in the epithelial cells during the upregulation of the acetate-induced ALPI gene (Figure 5C). Therefore, all the results from the study in epithelial cells suggest that the upregulation of ALPI expression may be tightly linked to the improvement of C3 deficiency-induced constipation.
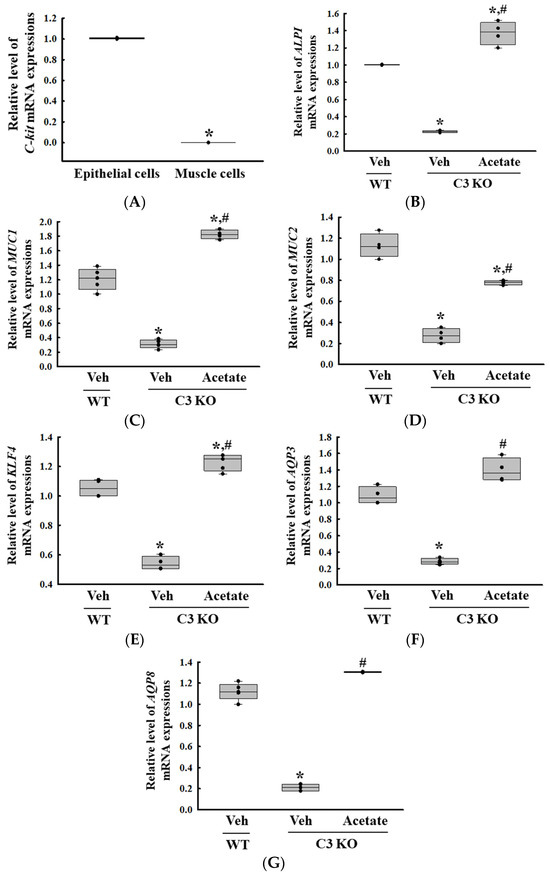
Figure 5.
Transcription level of C-kit, ALPI and mucin secretion genes in epithelial cells from intestine of C3 KO mice after acetate treatment. (A) Transcription level of C-kit gene in isolated epithelial cells and muscle cells. * p < 0.05 vs. Muscle cells. (B) Transcription level of the ALPI gene in acetate-treated C3 KO epithelial cells. (C–G) Transcription level of MUC1, MUC2, KLF4, AQP3 and AQP8 in acetate-treated C3 KO epithelial cells. The transcription levels of each gene were measured in the total mRNA of the epithelial cells by RT-qPCR using specific primers. The mRNA levels of each gene were calculated based on the intensity of β-actin as an endogenous control. The preparation of total RNAs was performed on three to five wells per group, RT-qPCR analyses were assayed twice for each total RNA. The data were presented as the mean ± SD. * p < 0.05 vs. no treated group. # p < 0.05 vs. vehicle-treated C3 KO group. Abbreviation: WT, wild type; C3 KO, complement C3 knockout; MUC, mucin; AQP, aquaporin; ALPI, alkaline phosphatase intestinal; C-kit, receptor protein kinase; PBS, phosphate buffer saline; RT-qPCR; quantitative real-time PCR.
2.6. Verification of the ALPI Gene as a New Treatment Target for C3 Deficiency-Induced Constipation in Acetate-Treated C3 KO Mice
Finally, we verified whether the improvement of C3 deficiency-induced constipation due to ALPI upregulation in acetate-treated epithelial cells could be reproduced in the C3 KO mice. To achieve this, alterations in the excretion parameters, GI motility, histological structure of the mid colon, mucin secretion ability, and water retention capacity were analyzed in the C3 KO mice treated with 50 mg/kg acetate for 24 h. First, the transcription levels of the ALPI gene and the expression level of ALPI proteins were upregulated in the mid colon of the acetate-treated C3 KO mice when compared with the vehicle-treated C3 KO mice (Figure 6A,B). Also, the decrease in the number and water content of the stools in the vehicle-treated C3 KO mice significantly recovered after acetate treatment, although the recovery rate was not completed (Figure 7A). Furthermore, similar recovery patterns in acetate-treated mice were detected in GI motility, colon length, and the histological structure of the colon. The transit ratio of the charcoal meal and the colon length were lower in the vehicle-treated C3 KO mice than in the untreated WT mice. However, these levels were remarkably increased in the acetate-treated C3 KO mice compared to the vehicle-treated C3 KO mice (Figure 7B). The acetate treatment in C3 KO mice with constipation phenotypes induced an increase in the thickness of the mucosa and the muscle layer although these did not fully recover to normal levels (Figure 7C). Moreover, the markers for mucin secretion ability and water retention capacity showed similar alteration patterns after acetate treatment. The decrease in MUC1, MUC2, AQP3, and AQP8 expression was seen in C3 KO mice recovered after the acetate treatment (Figure 8A–D). Taken together, the results of the above study suggest that the upregulation of ALPI expression could contribute to the improvement of C3 deficiency-induced constipation in C3 KO mice. In addition, these results suggest that alterations in the ALPI gene expression can act as one of the novel causes of C3 deficiency-induced constipation.
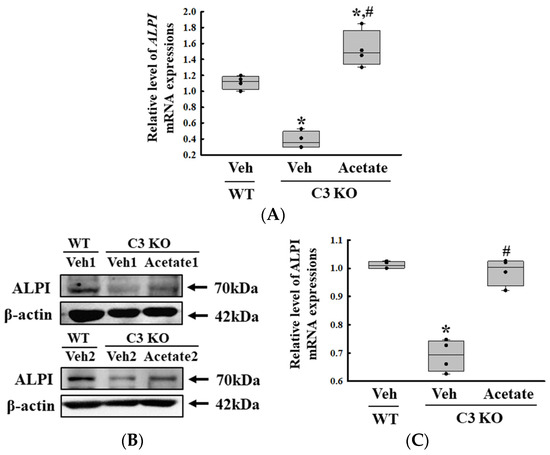
Figure 6.
Transcription and expression levels of the ALPI gene and proteins. (A) Transcription level of the ALPI gene in acetate-treated C3 KO mice. The transcription levels of the ALPI gene were measured in the total mRNA of the epithelial cells by RT-qPCR using specific primers. The mRNA levels of each gene were calculated based on the intensity of β-actin as an endogenous control. The preparation of total RNAs was performed on three to five mice per group, RT-qPCR analyses were assayed twice for each total RNA. (B) Expression levels of ALPI proteins in acetate-treated C3 KO mice. After collecting the mid colons from the C3 KO mice, the expression levels of ALPI proteins were assessed in tissue homogenates using the specific primary antibody and densitometry. The tissue homogenates were prepared from four to six mice per group and the Western blot was analyzed twice for each sample. After normalizing with β-actin as endogenous control, the relative level of ALPI expression was presented as a relative value to the vehicle-treated WT group (C). The data were presented as the mean ± SD. * p < 0.05 vs. no treated group. # p < 0.05 vs. vehicle-treated C3 KO group. Abbreviation: WT, wild type; C3 KO, complement C3 knockout; ALPI, alkaline phosphatase intestinal; RT-qPCR, quantitative real-time PCR.
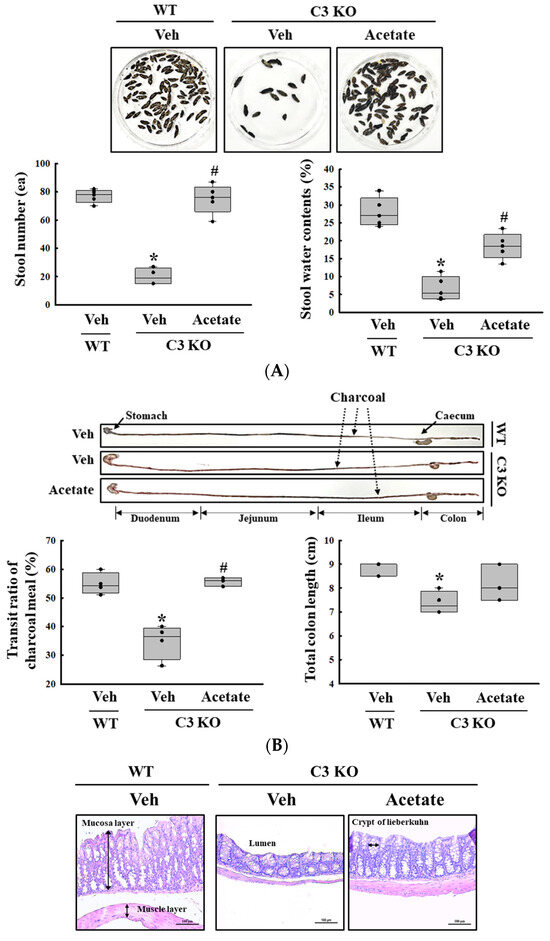
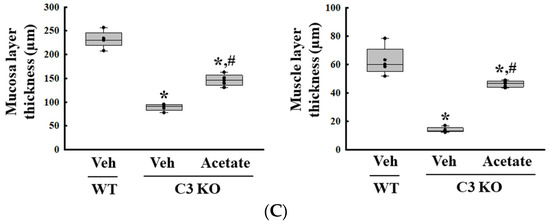
Figure 7.
Stool parameters, GI transit and histological structure of colon in acetate-treated C3 KO mice. (A) Stool parameters. The preparation of the total stools was performed on three to five mice per group and each parameter was analyzed twice for each sample. (B) GI transit and total length of GI tract. After collection from the stomach to the anus, the entire GI tract was arranged in a row, and the location of the charcoal meal was marked with arrows. Transit ratio of charcoal meal and total length of GI tract were measured as described in materials and method. The preparation of the GI tract was performed on three to five mice per group, and each parameter was analyzed twice for each mouse. (C) Histological structure of mid colon. The H&E-stained tissue sections were prepared from tissue samples from three to five mice per group, and the pathological factors were analyzed twice for each stained tissue. The data are presented as the mean ± SD. * p < 0.05 vs. no treated group. # p < 0.05 vs. vehicle-treated C3 KO group. Abbreviation: WT, wild type; C3 KO, complement C3 knockout; ALPI, alkaline phosphatase intestinal; H&E, hematoxylin and eosin.
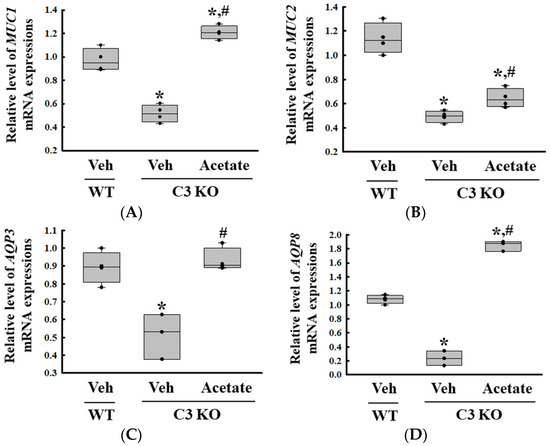
Figure 8.
Transcription level of (A) MUC1, (B) MUC2, (C) AQP3 and (D) AQP8 gene in the colon tissue of acetate-treated C3 KO mice. The transcription levels of four genes were measured in the total mRNA of the colon tissues by RT-qPCR using specific primers. The mRNA levels of each gene were calculated based on the intensity of β-actin as an endogenous control. The preparation of total RNAs was performed on three to five mice per group, RT-qPCR analyses were assayed twice for each total RNA. The data were presented as the mean ± SD. * p < 0.05 vs. no treated group. # p < 0.05 vs. vehicle-treated group. Abbreviation: WT, wild type; C3 KO, complement C3 knockout; MUC, mucin; AQP, aquaporin.
3. Discussion
C3 deficiency-induced constipation is being actively studied in the context of inflammatory response, regulatory mechanism of ENS, gut microbiota composition, and application of therapeutic drugs [7,8,9,15]. However, many additional studies are needed to understand the pathophysiological mechanisms associated with constipation due to C3 deficiency and the therapeutic targets for its management in animal models. This study aimed to supplement the current insufficient scientific evidence available on the subject. We sought to identify new genes and their functions associated with C3 deficiency-induced constipation. In this study, the alterations in the global gene expression were characterized in the mid colon of sixteen-week-old C3 KO mice with the constipation phenotype. Among the genes characterized, the ALPI gene was selected, and its function was analyzed in primary epithelial cells and C3 KO mice. Our results provide novel scientific information on the gene profiles associated with C3 deficiency-induced constipation, even though various genes whose functions remain unidentified have also been included in this list. In addition, these results suggest for the first time that the ALPI gene has an important function in the pathogenesis of constipation, although further clinical studies are needed to establish this.
Even though various studies are being conducted on the treatment of constipation of varied etiology, the alterations in the global gene expression in response to the constipation phenotypes have been characterized in only two studies in animals and patients. Approximately 797 genes (581 upregulated and 216 downregulated) were differentially expressed in the mid colon of Lop-induced constipation in rats. Among them, the major genes in the downregulated category included SLC9A5, KLK10, FGF15, and ALPI, whereas the major genes in the regulated category were cytochrome P450 (CYP) 2B2 (CYP2B2), ACE, G6PC, and SETBP1 [10]. Also, a similar characterization of the global gene expression was analyzed in IBS patients with constipation (IBS-C). Approximately 1270 genes (False discovery rate (FDR) < 0.05) were detected as DEGs between IBS-C vs. age-/sex-matched healthy controls (HCs). Five genes including aldehyde dehydrogenase 9, family member A1 (ALDH9A1), claudin 15 (CLDN15), enhancer of zeste 2 polycomb repressive complex 2 subunit (EXH2), ring finger protein 19A, RBR E3 ubiquitin protein ligase (RNF19A), and YIP1 interacting factor homolog B, membrane trafficking protein (YIF1B) showed significant positive correlations between the microarray and nCounter® values [12]. In the current study, the global gene expression in the mid colon was compared between C3 KO mice with constipation phenotypes and WT mice. A total of 2529 genes differentially expressed between the WT and C3 KO mice were identified from the mid colon and these comprised 1237 upregulated genes and 1292 downregulated genes. The major genes in the downregulated category included Eif2s3y, UTY, KDM5D, IGKV6-32, Olfr870, DDX3Y, EDN1, and NXPE4, whereas the major genes in the upregulated category were PNLIP, CEL, CPB1, CTRL, PNLIPRP1, REG1, RETNLB and ALPI. When compared to earlier studies, the number of altered genes with differential expressions was higher in our study than in the previous two studies. In lop-induced constipation, the total number of the upregulated genes was 2.7 times higher than the downregulated genes, but a similar number of upregulated and downregulated genes was observed between mice with WT and C3 deficiency-induced constipation [10]. Also, approximately 25 genes were found to be altered in all three types of constipation including IBS-C, Lop-induced constipation, and C3 deficiency-induced constipation. Of these, ten genes including annexin A8 (ANXA8), MIS18 kinetochore protein A (MIS18A), CDC42 effector protein 5 (CDC42EP5) and ankyrin repeat domain 37 (ANKRD37) showed the same upregulation pattern in all the three models [10,12].
Meanwhile, we selected seven genes that were expected to play an important role in C3 deficiency-induced constipation from a total of 2529 genes differentially expressed between WT and C3 KO mice. Among them, the five downregulated genes, including PRSS2, trefoil factor 2 (TFF2), RETNLB, solute carrier family 9 (sodium/hydrogen exchanger) (SLC9A5), member 3 (SLC9A3), and ALPI, and the two upregulated genes including EDN1 and NXPE4 were thought to be candidates associated with C3 deficiency-induced constipation. Scientific evidence on the role of these genes in constipation has been reported in several earlier studies. First, in the present study, the PRSS2 gene encoded trypsinogen-2 (anionic trypsin) was downregulated 94.18-fold in C3 deficiency-induced constipation. This protein was preferentially secreted from the pancreas and cleaved into an active form in the small intestine. In IBS patients, the enhanced level of this protein was associated with an increase in intestinal permeability and an induction of intestinal hypersensitivity [16]. Also, the proteins encoded by the TFF2 gene produced from gastrointestinal mucosa stimulate immune regulation and recovery, affect the healing of the mucosal layer, and suppress the inflammatory response in the rectum [17]. In our study, the expression of this gene was decreased 10.82-fold in the C3 KO mice compared to the WT mice. The RETNLB gene encodes for the resistin-like beta protein, which is associated with mucin secretion, although C3 deficiency-induced constipation decreases their transcription -2.43-fold [18]. The SLC9A3 gene is considered to be a Na/H exchanger in the epithelial brush border, and defects in this gene can induce diarrhea [19]. The decrease was -2.11-fold for both genes RETNLB and SLC9A3. Furthermore, the ALPI gene was downregulated 2.06-fold in the mid colon during C3 deficiency-induced constipation. This gene plays an important role in the homeostasis of the intestine, and a defect in this gene induces inflammatory responses and an imbalance of intestinal microbiota [10]. Moreover, two upregulated genes associated with C3 deficiency-induced constipation were also identified. The EDN1 gene encodes the endothelin 1 protein, which is associated with pulmonary hypertension, lipid metabolism, and insulin resistance [20,21,22]. It regulates the motility of the GI and intestinal passage time. The symptoms of constipation improved by the suppression of secretion of this protein [23]. NXPE4 is a cytoplasmic protein expressed in the salivary gland, colon, and rectum [24]. In the present study, the expression levels of the EDN1 and NXPE4 genes were upregulated 2.06- and 2.00-fold, respectively, during C3 deficiency-induced constipation.
In this study, we identified the ALPI gene as a constipation-associated novel gene because it was commonly detected in the Lop-induced constipation model and the C3 deficiency-induced constipation model of the present study [10]. The ALPI gene encodes intestinal alkaline phosphatase, an endogenous protein expressed in the intestinal epithelium to maintain gut homeostasis [25]. It is released from the enterocyte apical membrane into the lumen by lysophosphatidylcholine and is then incorporated into intracellular lipid droplets and surfactant-like particles [26,27]. The alkaline phosphatase plays a pivotal role in energy regulation and intestinal barrier functions such as the absorption of long-chain fatty acids, regulation of duodenal bicarbonate secretion, detoxification of bacterial endotoxin, and control of the transmucosal passage of bacteria [25,28]. Based on the physiological role of these proteins, some studies have reported the exogenous administration of these proteins as supplements to treat animals and humans to relieve intestinal and systemic inflammation in various diseases [29]. The supplementation decreases the levels of C-reactive proteins and reduces inflammation in ulcerative colitis and dextran sodium sulfate (DSS)-induced colitis [30,31]. A defect in the gene leading to a deficiency in the protein in mice induces an increase in the colitis score in DSS-induced models and the bacterial translocation caused by intestinal ischemia [31,32]. Therefore, the results of the present study provide the first evidence for the novel function of the ALPI gene in constipation implying that the suppression of ALPI expression could be tightly linked to the induction of constipation. However, many additional studies on the mechanism are needed.
Furthermore, to confirm our findings, we examined whether the recovery of ALPI expression can improve the constipation caused by C3 deficiency. The upregulation of ALPI expression was induced by butyrate and acetate treatments as an earlier study indicated that the transcription of the ALPI gene was increased in induced pluripotent stem cells (iPSC)-derived human intestinal epithelial cells treated with 1 mM acetate [14]. Subsequently, the epithelial cells wherein ALPI gene expression levels were restored were analyzed for the mucin secretion ability and water retention capacity with respect to the functions of the epithelial cells in the colon [33]. In this study, the upregulation of ALPI expression by the acetate treatment was accompanied by the upregulation of MUC1, MUC2, AQP3, and AQP8 transcripts in C3-deficient epithelial cells and C3 KO mice.
4. Materials and Methods
4.1. Animal Care and Use
Firstly, the animal protocols used in this study were reviewed in terms of science, ethics and safety, and approved by the Pusan National University-Institutional Animal Care and Use Committee (PNU-IACUC; Approval Number PNU-2023-0407). All mice were provided from Laboratory Animals Banks in the Korea Food and Drug Administration (KFDA). They were provided ad libitum access to tap water and a standard irradiated chow diet (Samtako BioKorea Co., Osan, Republic of Korea). Also, these mice were bred at the PNU-Laboratory Animal Resources Center (LARC), which is accredited by the KFDA (Accredited Unit Number: 000231) and the Association for Assessment and Accreditation of Laboratory Animal Care (AAALAC, Accredited Unit Number: 001525). The LARC provided an international standard environmental condition for animal breeding including 23 ± 2 °C temperature, 50 ± 10% relative humidity, 12 h of light/dark cycle (lights on at 08:00 h and off at 20:00 h) and a specific pathogen free (SPF) state. The WT and C3 KO mice were used for microarray analyses, acetate treatment, and constipation phenotypes analyses.
4.2. Experimental Designs of C3 KO Mice for Microarray Analyses
First of all, the WT and C3 KO mice that need for microarray analyses were produced by crossbreeding between heterogeneous type (HT) mice of C3 gene, as described in our previous studies [6,7]. When WT and C3 KO mice grew up to the sixteen-week-old, these mice were divided into WT mice (n = 7) and C3 KO mice (n = 7). The stool parameters were analyzed using stools collected from a metabolic cage (Daejong Instrument Industry Co., Ltd., Seoul, Republic of Korea) after 1 day of breeding. A charcoal meal was administrated into each mouse for GI transit analyses as described in previous study [6]. Finally, all the mice were euthanized based on the American Veterinary Medical Association (AVMA) Guidelines using CO2 gas with a minimum purity of 99.0%. To achieve this, a cage containing dirty bedding and mice was placed in the gas chamber for mice and CO2 gas of 99.0% purity was injected into this chamber without pre-charging, with a fill rate of ~50% of the chamber volume per minute. After then, their final death was confirmed by ascertaining cardiac and respiratory arrest, or dilated pupils and fixed body. The GI tracts were collected from the mice of the subset group for GI transit, and the mid colon tissues were collected for histopathological and microarray analyses because this region plays an important role in the process of reabsorption of water and compaction of the digested food mixtures into stools [34].
4.3. Experimental Designs for the Acetate Treatment of C3 KO Mice
Acetate treatment was used to upregulate the expression of ALPI, as described in our previous studies (Figure 9) [14]. Sixteen-week-old WT (n = 7) and C3 KO mice (n = 14) were divided into groups as follows; Untreated WT mice (n = 7), vehicle-treated C3 KO mice (n = 7) and acetate-treated C3 KO mice (n = 7). The upregulation of ALPI expression was induced by the oral gavage of a single dose of acetate (50 mg/kg, Sigma-Aldrich Co., St. Louis, MO, USA) in 1× phosphate buffer saline (PBS) solution for a day, while the mice in the vehicle-treated group were injected with the same volume of 1× PBS solution. At 24 h after the final acetate treatment, all mice were individually held in metabolic cages (Daejong Instrument Industry Co., Ltd.) for two days to analyze the GI motility and excretion parameters and were euthanized using CO2 gas. Also, the colon tissue samples were collected and stored at −80 °C until mRNA and protein analyses could be carried out.
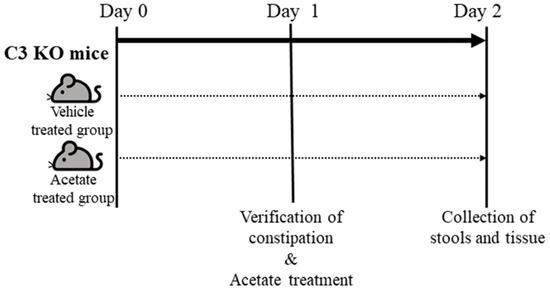
Figure 9.
Schedule for acetate treatment into C3 KO mice. After allocation of the WT and C3 KO mice into one of three experimental groups, mice of each group were treated with 5 mM acetate or 1× PBS, and subsequentially collected the stools and colon tissue from these mice. Abbreviation: WT, wild type; C3 KO, complement C3 knockout; RT-qPCR, quantitative real-time PCR; PBS, phosphate buffer saline.
4.4. Analyses of the Stool Parameters
All mice were individually held in metabolic cages (Daejong Instrument Industry Co., Ltd.) throughout the experiment to obtain uncontaminated stool samples, as described in a previous study [7,8]. Briefly, the stools excreted from each mouse were collected at 9 a.m. for two days, weighed twice using an electronic balance, and their number was counted twice. Also, their morphology was analyzed after taking images with a digital camera. The stool water content was also calculated as follows:
where A is the weight of fresh stools collected from mice of the subset groups, while B is the weight of stools after drying at 60 °C for 12 h.
Stool water content = (A − B)/A × 100
4.5. GI Motility Analysis
The charcoal transit ratio was used to determine GI motility as described in previous studies with some modifications [35]. Firstly, the WT and C3 KO mice fasted for 18 h except for water ad libitum to remove food mixture from the GI tracts. They were administrated 0.5 mL of charcoal meal (3% suspension of activated charcoal in 0.5% aqueous methylcellulose) (Sigma-Aldrich Co.). After 30 min of treatment, all mice were euthanized using CO2 after, and total GI tract was collected from the abdominal cavity. The charcoal transit ratio in each mouse was calculated as follows:
Charcoal transit ratio (%) = [(Total intestine length − Transit distance of charcoal meal)/
Total intestine length] × 100
Total intestine length] × 100
4.6. Histopathological Analysis
After collecting the mid colons from the WT and C3 KO mice, these tissues were fixed in 10% formalin for 48 h, and embedded in paraffin wax. These tissues were sectioned into 4 μm thick slices using Microtome (Leica Microsystems, Heerbrugg, Switzerland), and then stained with hematoxylin & eosin (H&E; Sigma-Aldrich Co.) to distinguish between the nuclear and cytoplasmic parts. An alteration on the histological structure of these stained colon sections were observed under a light microscope, after which the thickness of the mucosal layer and muscle layer in the mid colon were observed using the Leica Application Suite (Leica Microsystems).
4.7. Quantitative Real-Time PCR (RT-qPCR) Analysis
The relative quantities of the mRNAs for gene identified from microarray were confirmed using RT-qPCR analysis. Briefly, the total RNAs were purified from frozen mid colon tissues using RNAzol (Tet-Test Inc., Friendswood, TX, USA) as manufacture’s protocol. Their concentration was determined using ND-2000 Spectrophotometer (NanoDrop, Wilmington, DE, USA), 4 μg of total RNAs were used to synthesis complementary DNA (cDNA) under the specific conditions including oligo-deoxythymidine (dT) primer (Thermo Fisher Scientific Inc., Waltham, MA, USA), 2′-deoxynuclease 5′-triphosphate (dNTP) and reverse transcriptase (Superscript II, Thermo Fisher Scientific Inc., #18064-014). After then, each gene was amplified using a cDNA template, 2× Power SYBR Green (TOYOBO Co., Osaka, Japan), and specific primer (Supplementary Table S3) as described in a previous study [36]. The reaction cycle at which PCR products exceeded the fluorescence intensity threshold during the exponential phase of PCR amplification was considered the threshold cycle.
4.8. Western Blot Analysis
After collecting the mid colon (40 mg) from each mouse, tissue homogenate was prepared in Pro-prep Protein Extraction Solution (iNtRON Biotechnology Inc., Seongnam, Republic of Korea) using Polytron PT-MR 3100D Homogenizer (Kinematica AG, Lusern, Switzerland). The protein concentration of each sample was determined using Bicinchoninic acid Protein Assay (BCA) Kit (Thermo Fisher Scientific Inc.), and then 30 µg of protein were used to separate each protein on the 10% dodecyl sulfate-polyacrylamide gel electrophoresis (SDS-PAGE). After electrophoresis for 1.5 h, these separated proteins were transferred onto nitrocellulose membranes at 40 V for 2 h. Each membrane was incubated in 4 °C with different primary antibody follows: ALPI (Invitrogen Co., Ltd., Carlsbad, CA, USA, #PA5-22210), β-actin (Cell Signaling Technology Inc., Cambridge, MA, USA, #4967). After removing non-specific antibodies using washing solution (137 mM NaCl, 2.7 mM KCl, 10 mM Na2HPO4 and 0.05% Tween 20), and this membrane was sequentially incubated with horseradish peroxidase (HRP)—conjugated goat anti-rabbit IgG (TransGen Biotech Co., Ltd., Beijing, China, G21234) for 1 h. Finally, chemiluminescent substrates (Dogen, Seoul, Republic of Korea, DG-WF 100) were reacted with HRPs on the immunoblots, and the intensity of each band on the immunoblot was measured using FluorChem® FC2 Imaging system (Alpha Innotech Corporation, San Leandro, CA, USA).
4.9. Microarray Analysis
An alteration on the gene profiles for C3 deficiency-induced constipation were analyzed using microarray analysis as described in previous studies [37]. Briefly, total RNAs were purified according to methods previously applied to the RT-qPCR analysis, and their purity were analyzed Agilent 2100 Bioanalyzer (Agilent Technologies, Palo Alto, CA, USA). Also, the Affymetrix Whole Transcript Expression array process was performed using the GeneChipTM Whole Transcript PLUS Reagent Kit (ThermoFisher Scientifc Inc.). Total cDNA for mRNA was synthesized using the GeneChipTM Whole Transcript Amplification Kit (ThermoFisher Scientifc Inc.), and biotin-labeled with terminal deoxynucleotidyl transferase (TdT) using the GeneChipTM HT WT Terminal Labeling Kit (ThermoFisher Scientific Inc.). After then, these labeled DNA targets (5.5 μg) were hybridized to the Affymetrix GeneChipTM Mouse 2.0 ST Array (ThermoFisher Scientific Inc.) at 45 °C for 16 h. The unbound fragments were washout from arrays, and the specific targets were stained on a GeneChipTM Fluidics Station 450 (ThermoFisher Scientific Inc.). Finally, the target signals were scanned on a GCS3000 Scanner (Affymetrix, Santa Clara, CA, USA) and their values were calculated using the Affymetrix® GeneChip™ Command Console® Software (AGCC).
After normalizing using a robust multi-average (RMA) method implemented in Affymetrix® Power Tools (APT, Affymetrix), the result with gene level RMA analysis was exported, and DEG analysis was performed. The statistical significance for transcription level of each gene was determined using an independent Tukey’s post hoc t-test and the fold change in which the null hypothesis was that no difference exists among groups. The FDR was controlled by adjusting the p-value using the Benjamini–Hochberg algorithm. In case of the DEG set, hierarchical cluster analysis was performed using complete linkage and Euclidean distance as a similarity measure. Gene-enrichment and functional annotation analysis for a significant probe list was performed using Gene Ontology (GO, http://geneontology.org) and Kyoto Encyclopedia of Genes and Genomes (KEGG, http://kegg.jp). All data analysis and visualization of differentially expressed genes were conducted using R 3.3.2 (www.r-project.org).
4.10. Acetate Treatment of Epithelial Cells Derived from the Colon of C3 KO Mice
The epithelial cells for the acetate treatment were collected from the colon of the WT and C3 KO mice, as described in previous studies with some modifications [38]. Briefly, the colons of the mice were extracted, and the impurities were eliminated in a Ca2+ free Hank’s solution (Gibco, Grand Island, NE, USA). Subsequently, the muscular layer of the intestines was excised. The cells were then dispersed using enzyme solution (albumin (MP Biomedicals, Irvine, CA, USA), trypsin inhibitors (Sigma-Aldrich Co.), and collagenase type 2 (Worthington Biochemical Co., Lakewood, NJ, USA)). For the acetate treatment, the epithelial cells were seeded at a density of 1 × 10⁷ cells/10 mL in a 25 cm2 surface area culture flask and grown to 70-80% confluence in a 37 °C incubator. After that, they were incubated with 5 mM acetate for another 24 h (Figure 10). The treatment concentrations of acetate to upregulate ALPI expression were based on a previous study [14]. Next, the cells harvested from the 25 cm2 culture flask were used for total RNA isolation and RT-qPCR analysis.
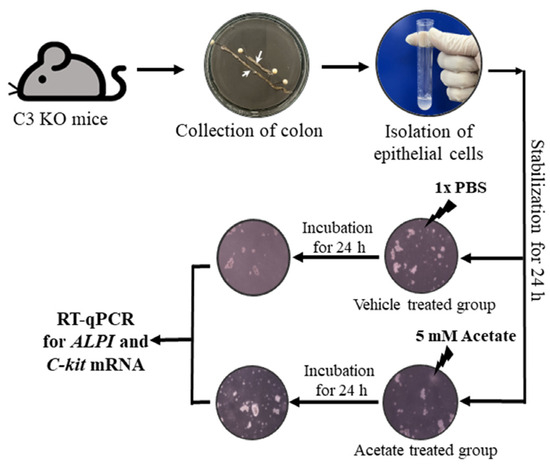
Figure 10.
Scheme for purification of epithelial cells from intestine of C3 KO mice and acetate treatment. After collection of the epithelial cells from the intestines of WT and C3 KO mice, these cells were treated with 5 mM acetate or 1× PBS, and the expression of several genes were evaluated by RT-qPCR analysis using specific primers. Abbreviation: WT, wild type; C3 KO, complement C3 knockout; ALPI, alkaline phosphatase intestinal; C-kit, receptor protein kinase; PBS, phosphate buffer saline; RT-qPCR; quantitative real-time PCR.
4.11. Statistical Analysis
Statistical significance was evaluated using one-way analysis of variance (ANOVA) (SPSS for Windows, Release 10.10, Standard Version, Chicago, IL, USA) followed by Tukey’s post hoc t-test for multiple comparisons. Data are presented as the mean ± SD (standard deviation). p < 0.05 was considered to indicate a statistically significant difference.
5. Conclusions
In this study, we sought to identify a novel gene associated with C3 deficiency-induced constipation using microarray analyses. The present results suggest that C3 deficiency-induced constipation may be associated with 1237 upregulated genes including PNLIP, CEL, CPB1, CTRL, PNLIPRP1, and REG1 as well as 1292 downregulated genes including Eif2s3y, UTY, KDM5D, IGKV6-32, Olfr870, and DDX3Y. Based on the global gene profile, the ALPI gene was selected as one of the possible candidates as the unique gene associated with C3 deficiency-induced constipation. The upregulation of ALPI expression by acetate treatment improved the key symptoms of constipation in epithelial cells and C3 KO mice with C3 deficiency. Taken together, our results suggest that ALPI can be considered a novel gene unique to constipation associated with C3 deficiency. However, this study had some limitations in that it did not confirm the expression level of all the differential genes using RT-qPCR because of the large number of genes. Moreover, the lack of analyses of the molecular mechanism of the effects of C3 deficiency-induced constipation in the transcriptional regulation of colon-expressed genes should be considered a drawback of this study. Also, further research will be needed to evaluate whether the exogenous administration of the protein encoded by the ALPI gene can be considered a treatment option to improve the symptoms of constipation in C3 KO mice.
Supplementary Materials
The following supporting information can be downloaded at: https://www.mdpi.com/article/10.3390/ijms25179530/s1.
Author Contributions
Conceptualization, D.Y.H.; methodology, D.Y.H.; software, H.J.S. and J.E.K.; validation, H.J.S. and J.E.K.; formal analysis, H.J.S., J.E.K., Y.J.R. and A.S.; investigation, H.J.S., T.R.K., K.H.P. and E.S.P.; data curation, H.J.S., J.E.K.; writing—original draft preparation, D.Y.H.; writing—review and editing, J.T.H. and S.I.C.; visualization, D.Y.H. and H.J.S.; supervision, D.Y.H.; project administration, D.Y.H.; funding acquisition, D.Y.H. All authors have read and agreed to the published version of the manuscript.
Funding
This work was supported by Basic Science Research Program through the National Research Foundation of Korea (NRF) funded by the Ministry of Education (2019R1A2C1084140-14) and the BK21 FOUR project through the National Research Foundation of Korea (NRF) funded by the Ministry of Education, Korea (F23YY8109033). Also, this work was supported by 2023 BK FOUR Graduate School Innovation Support funded by Pusan National University (PNU-Fellowship program).
Institutional Review Board Statement
This study was conducted in accordance with the Declaration of Helsinki, and approved by the Pusan National University-Institutional Animal Care and Use Committee (PNU-IACUC) based on the ethical procedures for scientific care (Approval Number: PNU-2023-0407).
Informed Consent Statement
Not applicable.
Data Availability Statement
The microarray datasets produced in this study are available in the GEO database (http://www.ncbi.nlm.nih.gov/geo) under accession number GSE261184. Data are openly available in a public repository that issues datasets with DOIs.
Acknowledgments
We thank Jin Hyang Hwang, the animal technician, for directing animal care at the Laboratory Animal Resources Center at the Pusan National University.
Conflicts of Interest
The authors declare no conflicts of interest.
References
- Nishida, N.; Walz, T.; Springer, T.A. Structural transitions of complement component C3 and its activation products. Proc. Natl. Acad. Sci. USA 2006, 103, 19737–19742. [Google Scholar] [CrossRef] [PubMed]
- Zwarthoff, S.A.; Berends, E.T.; Mol, S.; Ruyken, M.; Aerts, P.C.; Józsi, M.; Haas, C.J.C.; Rooijakkers, S.H.M.; Gorham, R.D., Jr. Functional characterization of alternative and classical pathway C3/C5 convertase activity and inhibition using purified models. Front. Immunol. 2018, 9, 1691. [Google Scholar] [CrossRef] [PubMed]
- Fischer, W.H.; Hugli, T.E. Regulation of B cell functions by C3a and C3a (desArg): Suppression of TNF-alpha, IL-6, and the polyclonal immune response. J. Immunol. 1997, 159, 4279–4286. [Google Scholar] [CrossRef] [PubMed]
- Rawal, N.; Pangburn, M.K. Formation of high-affinity C5 convertases of the alternative pathway of complement. J. Immunol. 2001, 166, 2635–2642. [Google Scholar] [CrossRef] [PubMed]
- Rawal, N.; Pangburn, M.K. Formation of high affinity C5 convertase of the classical pathway of complement. J. Biol. Chem. 2003, 278, 38476–38483. [Google Scholar] [CrossRef]
- Park, J.W.; Kim, J.E.; Choi, Y.J.; Kang, M.J.; Choi, H.J.; Bae, S.J.; Hong, J.T.; Lee, H.; Hwang, D.Y. Deficiency of complement component 3 may be linked to the development of constipation in FVB/N-C3em1Hlee/Korl mice. FASEB J. 2021, 35, e21221. [Google Scholar] [CrossRef] [PubMed]
- Choi, Y.J.; Song, H.J.; Kim, J.E.; Lee, S.J.; Jin, Y.J.; Roh, Y.J.; Seol, A.; Kim, H.S.; Hwang, D.Y. Dysregulation of the enteric nervous system in the mid colon of complement component 3 knockout mice with constipation phenotypes. Int. J. Mol. Sci. 2022, 23, 6862. [Google Scholar] [CrossRef]
- Choi, Y.J.; Kim, J.E.; Lee, S.J.; Gong, J.E.; Jin, Y.J.; Lee, H.; Hwang, D.Y. Promotion of the inflammatory response in mid colon of complement component 3 knockout mice. Sci. Rep. 2022, 12, 1700. [Google Scholar] [CrossRef] [PubMed]
- Choi, Y.J.; Kim, J.E.; Lee, S.J.; Gong, J.E.; Son, H.J.; Hong, J.T.; Hwang, D.Y. Dysbiosis of fecal microbiota from complement 3 knockout mice with constipation phenotypes contributes to development of defecation delay. Front. Physiol. 2021, 12, 650789. [Google Scholar] [CrossRef]
- Kim, J.E.; Park, S.H.; Kwak, M.H.; Go, J.; Koh, E.K.; Song, S.H.; Sung, J.E.; Lee, H.S.; Hong, J.T.; Hwang, D.Y. Characterization of changes in global genes expression in the distal colon of loperamide-induced constipation SD rats in response to the laxative effects of Liriope platyphylla. PLoS ONE 2015, 10, e0129664. [Google Scholar] [CrossRef]
- Hou, M.L.; Chang, L.W.; Lin, C.H.; Lin, L.C.; Tsai, T.H. Comparative pharmacokinetics of rhein in normal and loperamide-induced constipated rats and microarray analysis of drug-metabolizing genes. J. Ethnopharmacol. 2014, 155, 1291–1299. [Google Scholar] [CrossRef] [PubMed]
- Videlock, E.J.; Mahurkar-Joshi, S.; Hoffman, J.M.; Iliopoulos, D.; Pothoulakis, C.; Mayer, E.A.; Chang, L. Sigmoid colon mucosal gene expression supports alterations of neuronal signaling in irritable bowel syndrome with constipation. Am. J. Physiol. Gastrointest. Liver Physiol. 2018, 315, G140–G157. [Google Scholar] [CrossRef] [PubMed]
- Parlato, M.; Charbit-Henrion, F.; Pan, J.; Romano, C.; Duclaux-Loras, R.; Le Du, M.H.; Warner, N.; Francalanci, P.; Bruneau, J.; Bras, M.; et al. Human ALPI deficiency causes inflammatory bowel disease and highlights a key mechanism of gut homeostasis. EMBO Mol. Med. 2018, 10, e8483. [Google Scholar] [CrossRef] [PubMed]
- Grouls, M.; Janssen, A.W.; Duivenvoorde, L.P.; Hooiveld, G.J.; Bouwmeester, H.; van der Zande, M. Differential gene expression in iPSC-derived human intestinal epithelial cell layers following exposure to two concentrations of butyrate, propionate and acetate. Sci. Rep. 2022, 12, 13988. [Google Scholar] [CrossRef] [PubMed]
- Song, H.J.; Kim, J.E.; Jin, Y.J.; Roh, Y.J.; Seol, A.; Kim, T.R.; Park, K.H.; Park, E.S.; An, B.S.; Yang, S.Y.; et al. Complement C3-deficiency-induced constipation in FVB/N-C3em1Hlee/Korl knockout mice was significantly relieved by uridine and Liriope platyphylla L. extracts. Int. J. Mol. Sci. 2023, 24, 15757. [Google Scholar] [CrossRef] [PubMed]
- Zhou, Q.; Zhang, B.; Verne, N.G. Intestinal membrane permeability and hypersensitivity in the irritable bowel syndrome. Pain 2009, 146, 41–46. [Google Scholar] [CrossRef] [PubMed]
- Judd, L.M.; Chalinor, H.V.; Walduck, A.; Pavlic, D.I.; Däbritz, J.; Dubeykovskaya, Z.; Wang, T.C.; Menheniott, T.R.; Giraud, A.S. TFF2 deficiency exacerbates weight loss and alters immune cell and cytokine profiles in DSS colitis, and this cannot be rescued by wild-type bone marrow. Am. J. Physiol. Gastrointest. Liver Physiol. 2015, 308, G12–G24. [Google Scholar] [CrossRef]
- Xia, B.; Zhong, R.; Wu, W.; Luo, C.; Meng, Q.; Gao, Q.; Zhao, Y.; Chen, L.; Zhang, S.; Zhao, X.; et al. Mucin O-glycan-microbiota axis orchestrates gut homeostasis in a diarrheal pig model. Microbiome 2022, 10, 139. [Google Scholar] [CrossRef] [PubMed]
- Nee, J.; Lembo, A. Current and future treatment approaches for IBS with diarrhea (IBS-D) and IBS mixed pattern (IBS-M). Aliment. Pharmacol. Ther. 2021, 54, S63–S74. [Google Scholar] [CrossRef]
- Jin, J.J.; Nakura, J.; Wu, Z.; Yamamoto, M.; Abe, M.; Tabara, Y.; Yamamoto, Y.; Igase, M.; Kohara, K.; Miki, T. Association of endothelin-1 gene variant with hypertension. Hypertension 2003, 41, 163–167. [Google Scholar] [CrossRef]
- Zanatta, C.M.; Crispim, D.; Sortica, D.A.; Klassmann, L.P.; Gross, J.L.; Gerchman, F.; Canani, L.H. Endothelin-1 gene polymorphisms and diabetic kidney disease in patients with type 2 diabetes mellitus. Diabetol. Metab. Syndr. 2015, 7, 103. [Google Scholar] [CrossRef] [PubMed]
- Ghosh, A.; Gao, L.; Thakur, A.; Siu, P.M.; Lai, C.W. Role of free fatty acids in endothelial dysfunction. J. Biomed. Sci. 2017, 24, 50. [Google Scholar] [CrossRef] [PubMed]
- Zhou, X.; Chen, Y.; Ma, X.; Yu, Y.; Yu, X.; Chen, X.; Suo, H. Efficacy of Bacillus coagulans BC01 on loperamide hydrochloride-induced constipation model in Kunming mice. Front. Nutr. 2022, 9, 964257. [Google Scholar] [CrossRef]
- Holland, A.M.; Bon-Frauches, A.C.; Keszthelyi, D.; Melotte, V.; Boesmans, W. The enteric nervous system in gastrointestinal disease etiology. Cell Mol. Life Sci. 2021, 78, 4713–4733. [Google Scholar] [CrossRef] [PubMed]
- Lallès, J.P. Intestinal alkaline phosphatase: Multiple biological roles in maintenance of intestinal homeostasis and modulation by diet. Nutr. Rev. 2010, 68, 323–332. [Google Scholar] [CrossRef] [PubMed]
- Nakano, T.; Inoue, I.; Alpers, D.H.; Akiba, Y.; Katayama, S.; Shinozaki, R.; Kaunitz, J.D.; Ohshima, S.; Akita, M.; Takahashi, S.; et al. Role of lysophosphatidylcholine in brush-border intestinal alkaline phosphatase release and restoration. Am. J. Physiol. Gastrointest. Liver Physiol. 2009, 297, G207–G214. [Google Scholar] [CrossRef] [PubMed]
- Eliakim, R.; Mahmood, A.; Alpers, D.H. Rat intestinal alkaline phosphatase secretion into lumen and serum is coordinately regulated. Biochim. Biophys. Acta Mol. Cell Res. 1991, 1091, 1–8. [Google Scholar] [CrossRef] [PubMed]
- Lallès, J.P. Intestinal alkaline phosphatase: Novel functions and protective effects. Nutr. Rev. 2014, 72, 82–94. [Google Scholar] [CrossRef] [PubMed]
- Fawley, J.; Gourlay, D.M. Intestinal alkaline phosphatase: A summary of its role in clinical disease. J. Surg. Res. 2016, 202, 225–234. [Google Scholar] [CrossRef]
- Lukas, M.; Drastich, P.; Konecny, M.; Gionchetti, P.; Urban, O.; Cantoni, F.; Bortlik, M.; Duricova, D.; Bulitta, M. Exogenous alkaline phosphatase for the treatment of patients with moderate to severe ulcerative colitis. Inflamma Bowel Dis. 2010, 16, 1180–1186. [Google Scholar] [CrossRef]
- Tuin, A.; Poelstra, K.; de Jager-Krikken, A.; Bok, L.; Raaben, W.; Velders, M.P.; Dijkstra, G. Role of alkaline phosphatase in colitis in man and rats. Gut 2008, 58, 379–387. [Google Scholar] [CrossRef] [PubMed]
- Goldberg, R.F.; Austen Jr, W.G.; Zhang, X.; Munene, G.; Mostafa, G.; Biswas, S.; McCormack, M.; Eberlin, K.R.; Nguyen, J.T.; Tatlidede, H.S.; et al. Intestinal alkaline phosphatase is a gut mucosal defense factor maintained by enteral nutrition. Proc. Natl. Acad. Sci. USA 2008, 105, 3551–3556. [Google Scholar] [CrossRef] [PubMed]
- Allaire, J.M.; Crowley, S.M.; Law, H.T.; Chang, S.Y.; Ko, H.J.; Vallance, B.A. The intestinal epithelium: Central coordinator of mucosal immunity. Trends Immunol. 2018, 39, 677–696. [Google Scholar] [CrossRef] [PubMed]
- Andrews, C.N.; Storr, M. The pathophysiology of chronic constipation. Can. J. Gastroenterol. 2011, 25, 16B–21B. [Google Scholar] [CrossRef] [PubMed]
- Kim, J.E.; Choi, Y.J.; Lee, S.J.; Gong, J.E.; Lee, Y.J.; Sung, J.E.; Jung, Y.S.; Lee, H.S.; Hong, J.T.; Hwang, D.Y. Antioxidant activity and laxative effects of tannin-enriched extract of Ecklonia cava in loperamide-induced constipation of SD rats. PLoS ONE. 2021, 16, e0246363. [Google Scholar] [CrossRef]
- Lee, S.J.; Roh, Y.J.; Kim, J.E.; Jin, Y.J.; Song, H.J.; Seol, A.; Park, S.H.; Douangdeuane, B.; Souliya, O.; Choi, S.I.; et al. Protective effects of Dipterocarpus tuberculatus in blue light-induced macular degeneration in A2E-laden ARPE19 cells and retina of Balb/c mice. Antioxidants 2023, 12, 329. [Google Scholar] [CrossRef]
- Zhou, H.; Choi, S.I.; Zou, F.; Oh, S.; Kim, J.E.; Hwang, D.Y.; Lee, J. Cytotoxicity and gene expression in sarcoma 180 cells in response to spiky magnetoplasmonic supraparticles. ACS Appl. Mater. Interfaces 2014, 6, 19680–19689. [Google Scholar] [CrossRef]
- Kim, B.J. Shengmaisan regulates pacemaker potentials in interstitial cells of cajal in mice. J. Pharmacopunct. 2013, 16, 36. [Google Scholar] [CrossRef]


Disclaimer/Publisher’s Note: The statements, opinions and data contained in all publications are solely those of the individual author(s) and contributor(s) and not of MDPI and/or the editor(s). MDPI and/or the editor(s) disclaim responsibility for any injury to people or property resulting from any ideas, methods, instructions or products referred to in the content. |
© 2024 by the authors. Licensee MDPI, Basel, Switzerland. This article is an open access article distributed under the terms and conditions of the Creative Commons Attribution (CC BY) license (https://creativecommons.org/licenses/by/4.0/).