
MicroRNAs Regulate the Expression of Genes Related to the Innate Immune and Inflammatory Response in Rabbits Infected with Lagovirus europaeus GI.1 and GI.2 Genotypes


 and
and
Abstract
:1. Introduction
2. Results
2.1. MiRs Expression Levels and Its Downstream Targets Involved in Innate Immune and Inflammatory Responses in Four Tissues in Rabbits during Lagovirus europaeus/GI.1 and GI.2 Genotype Infection
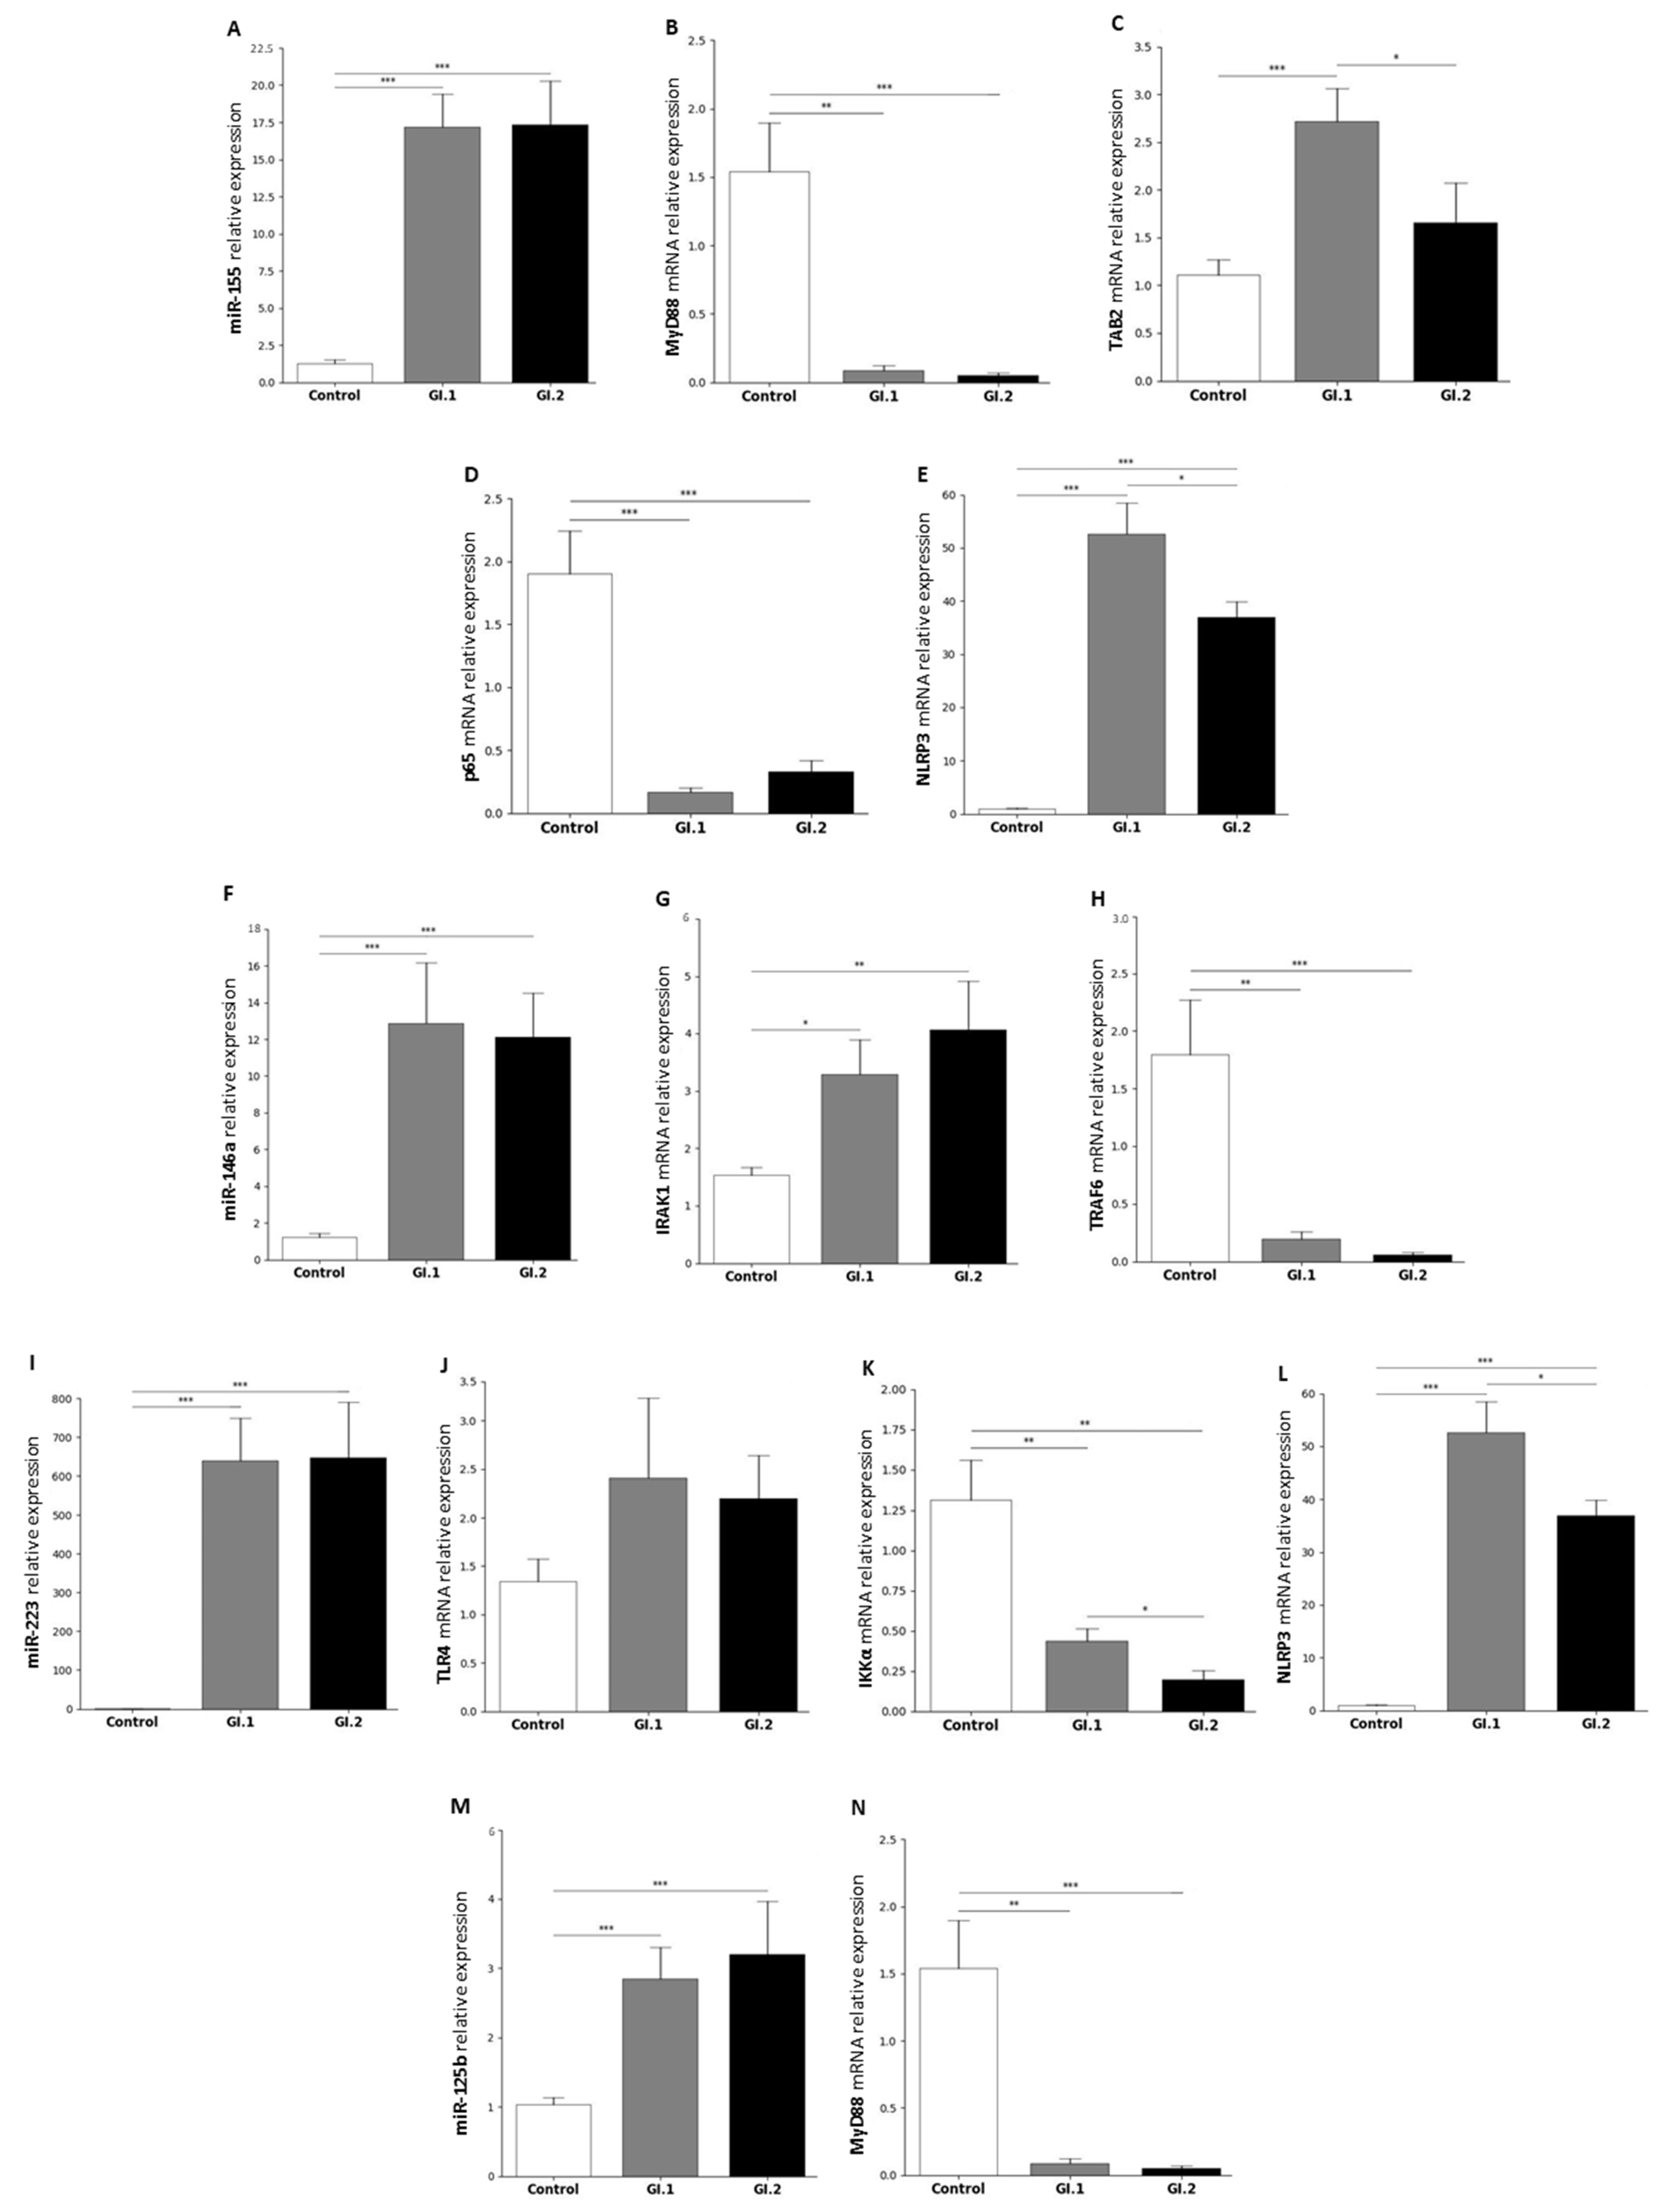
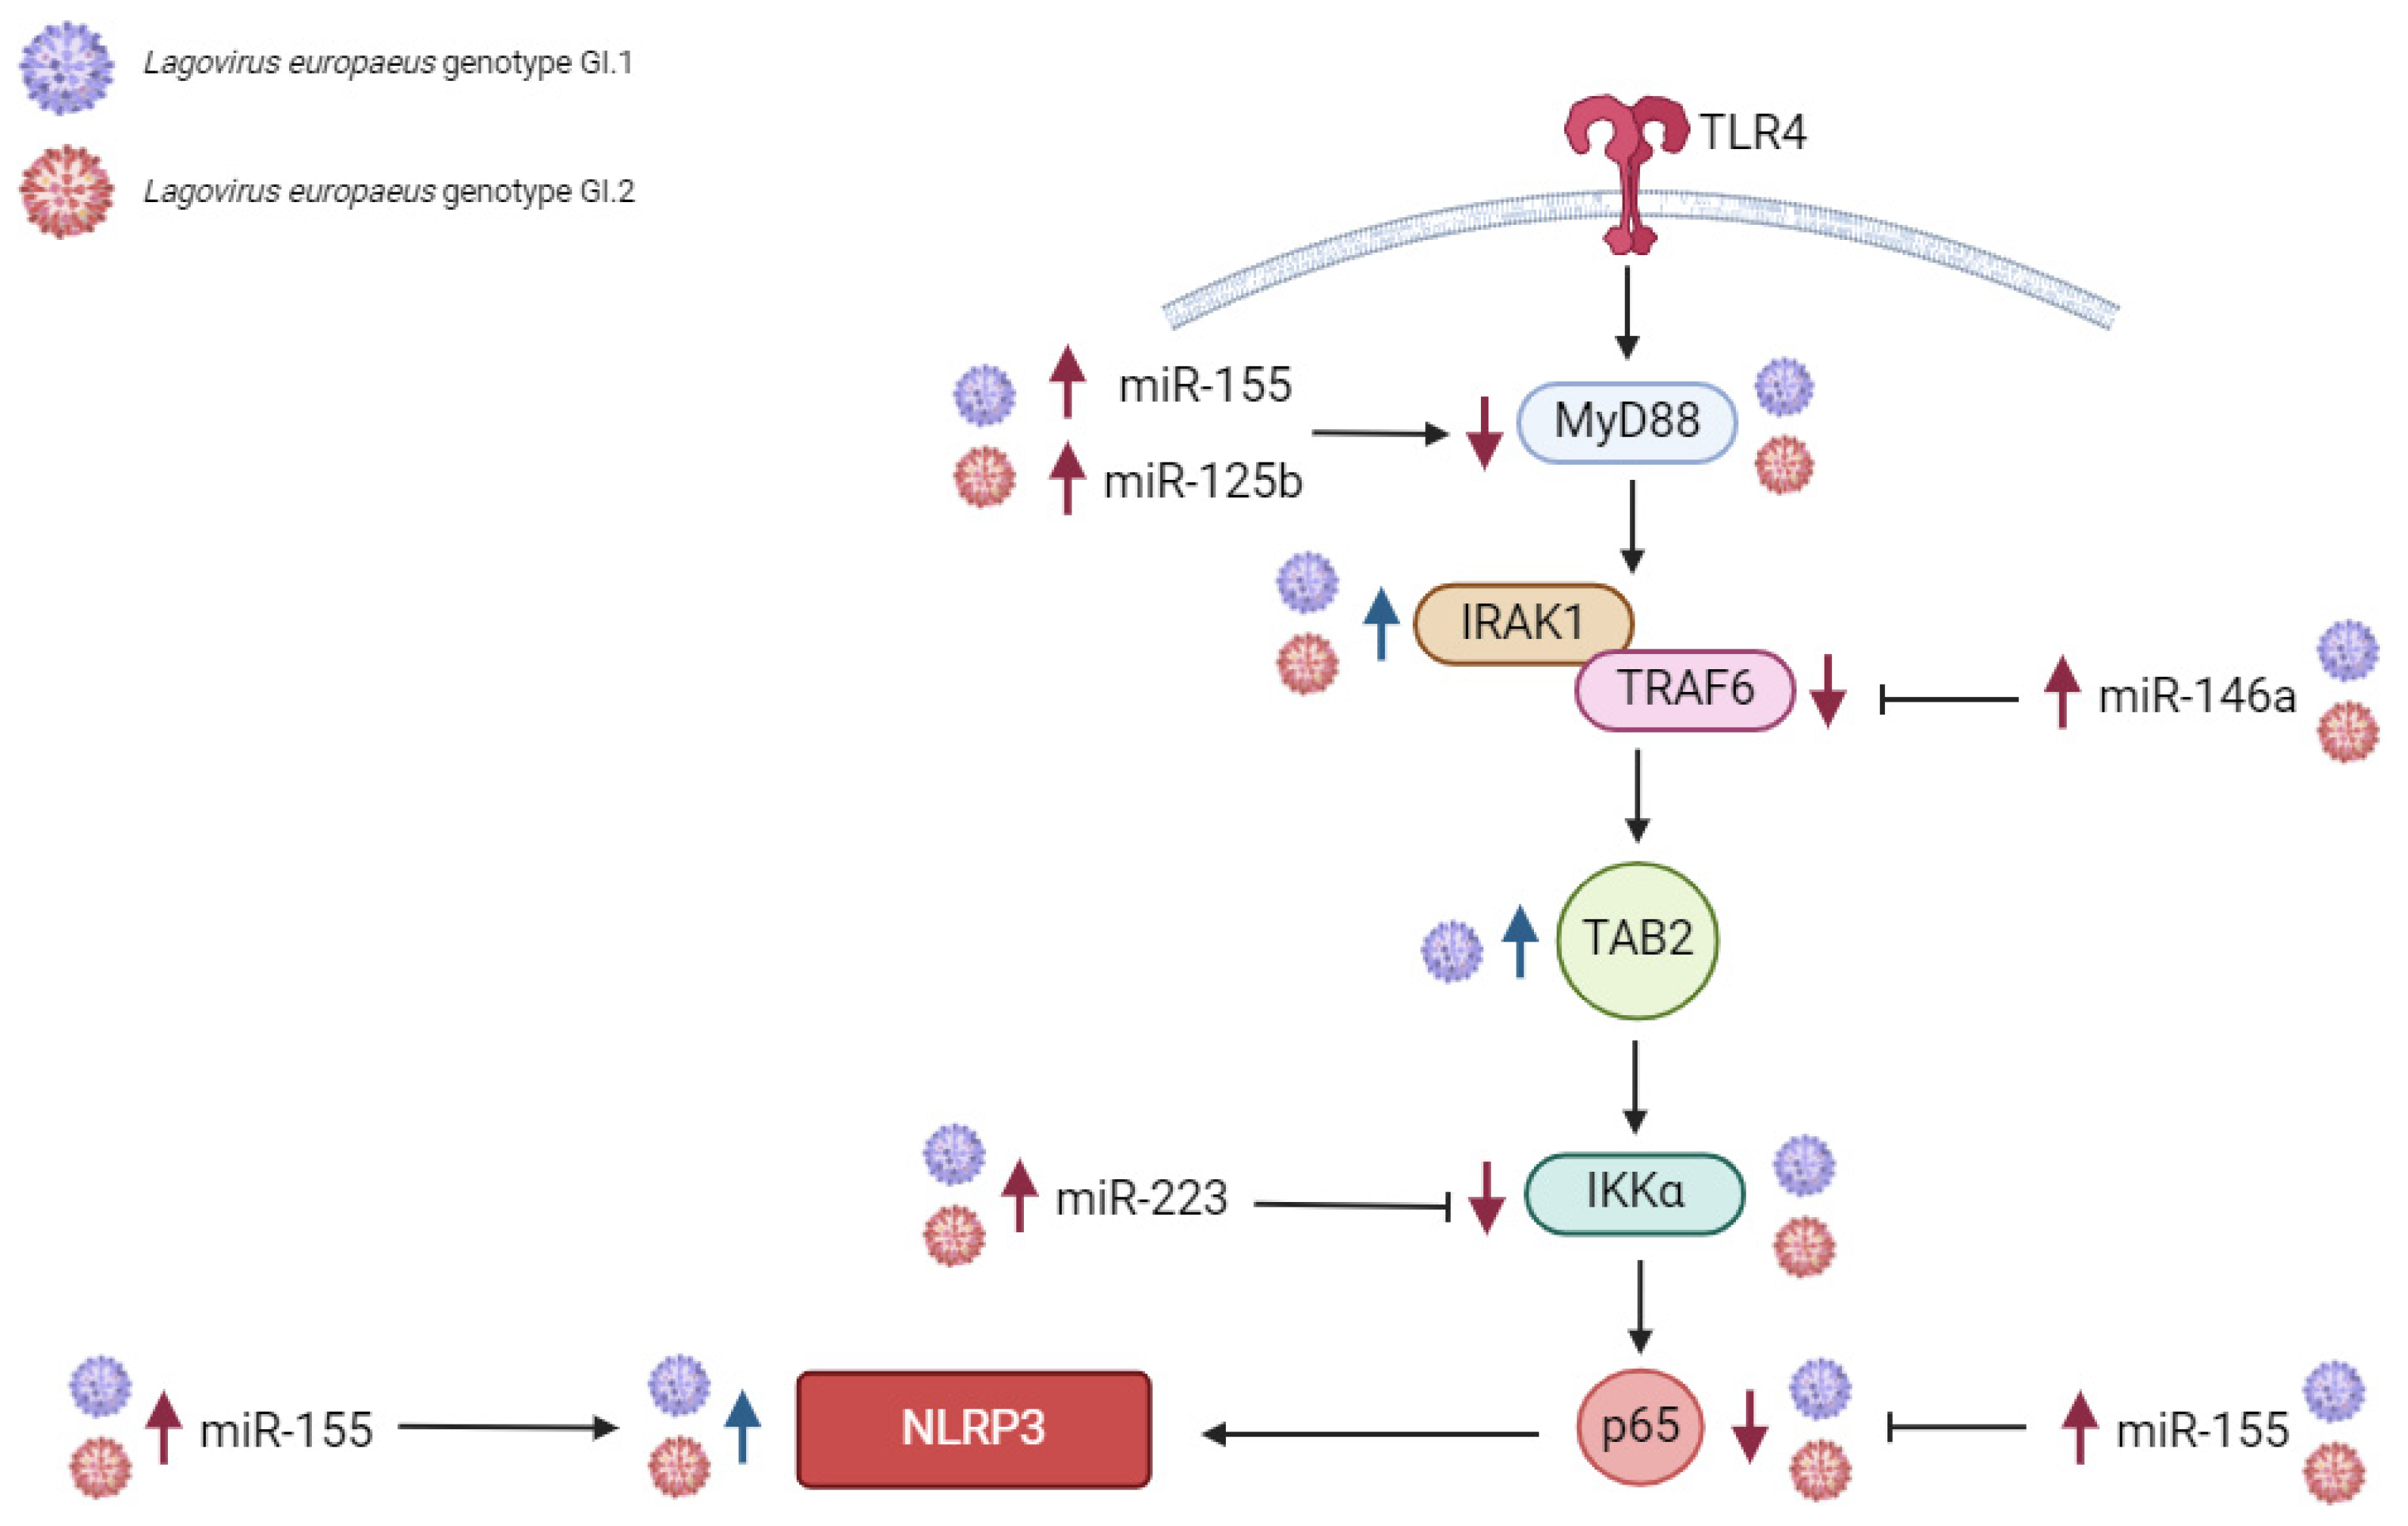
2.1.1. Liver
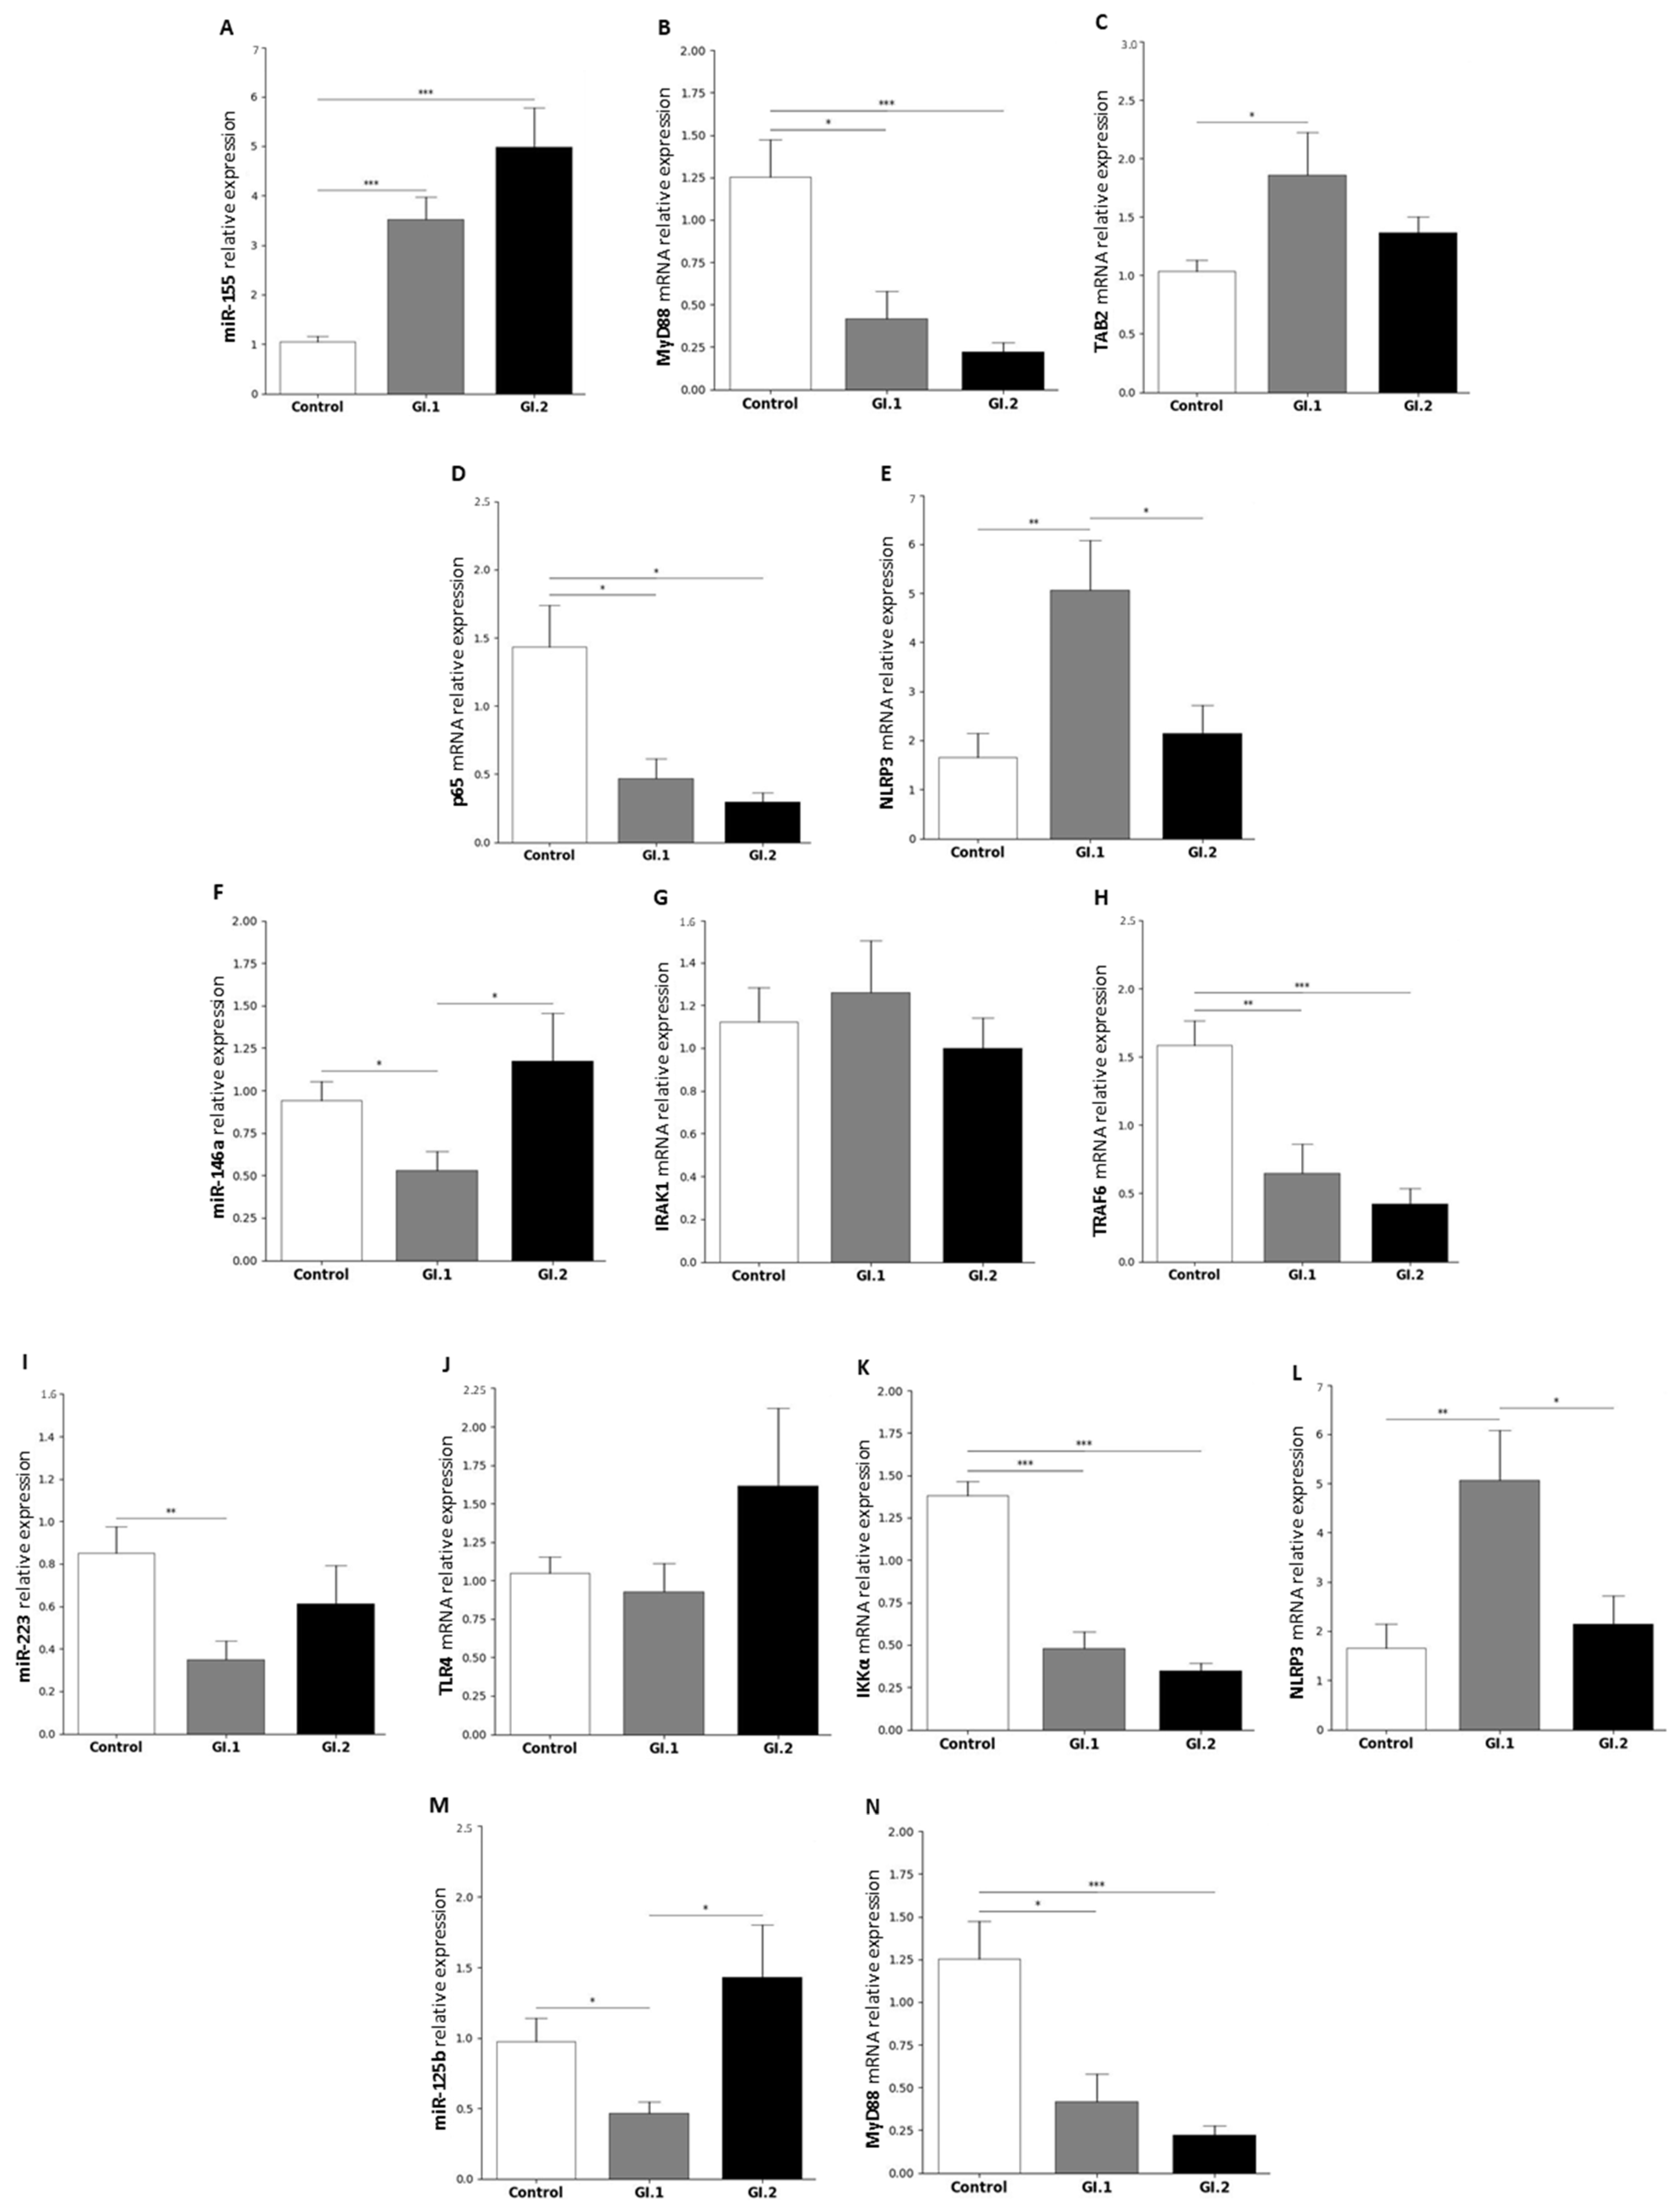
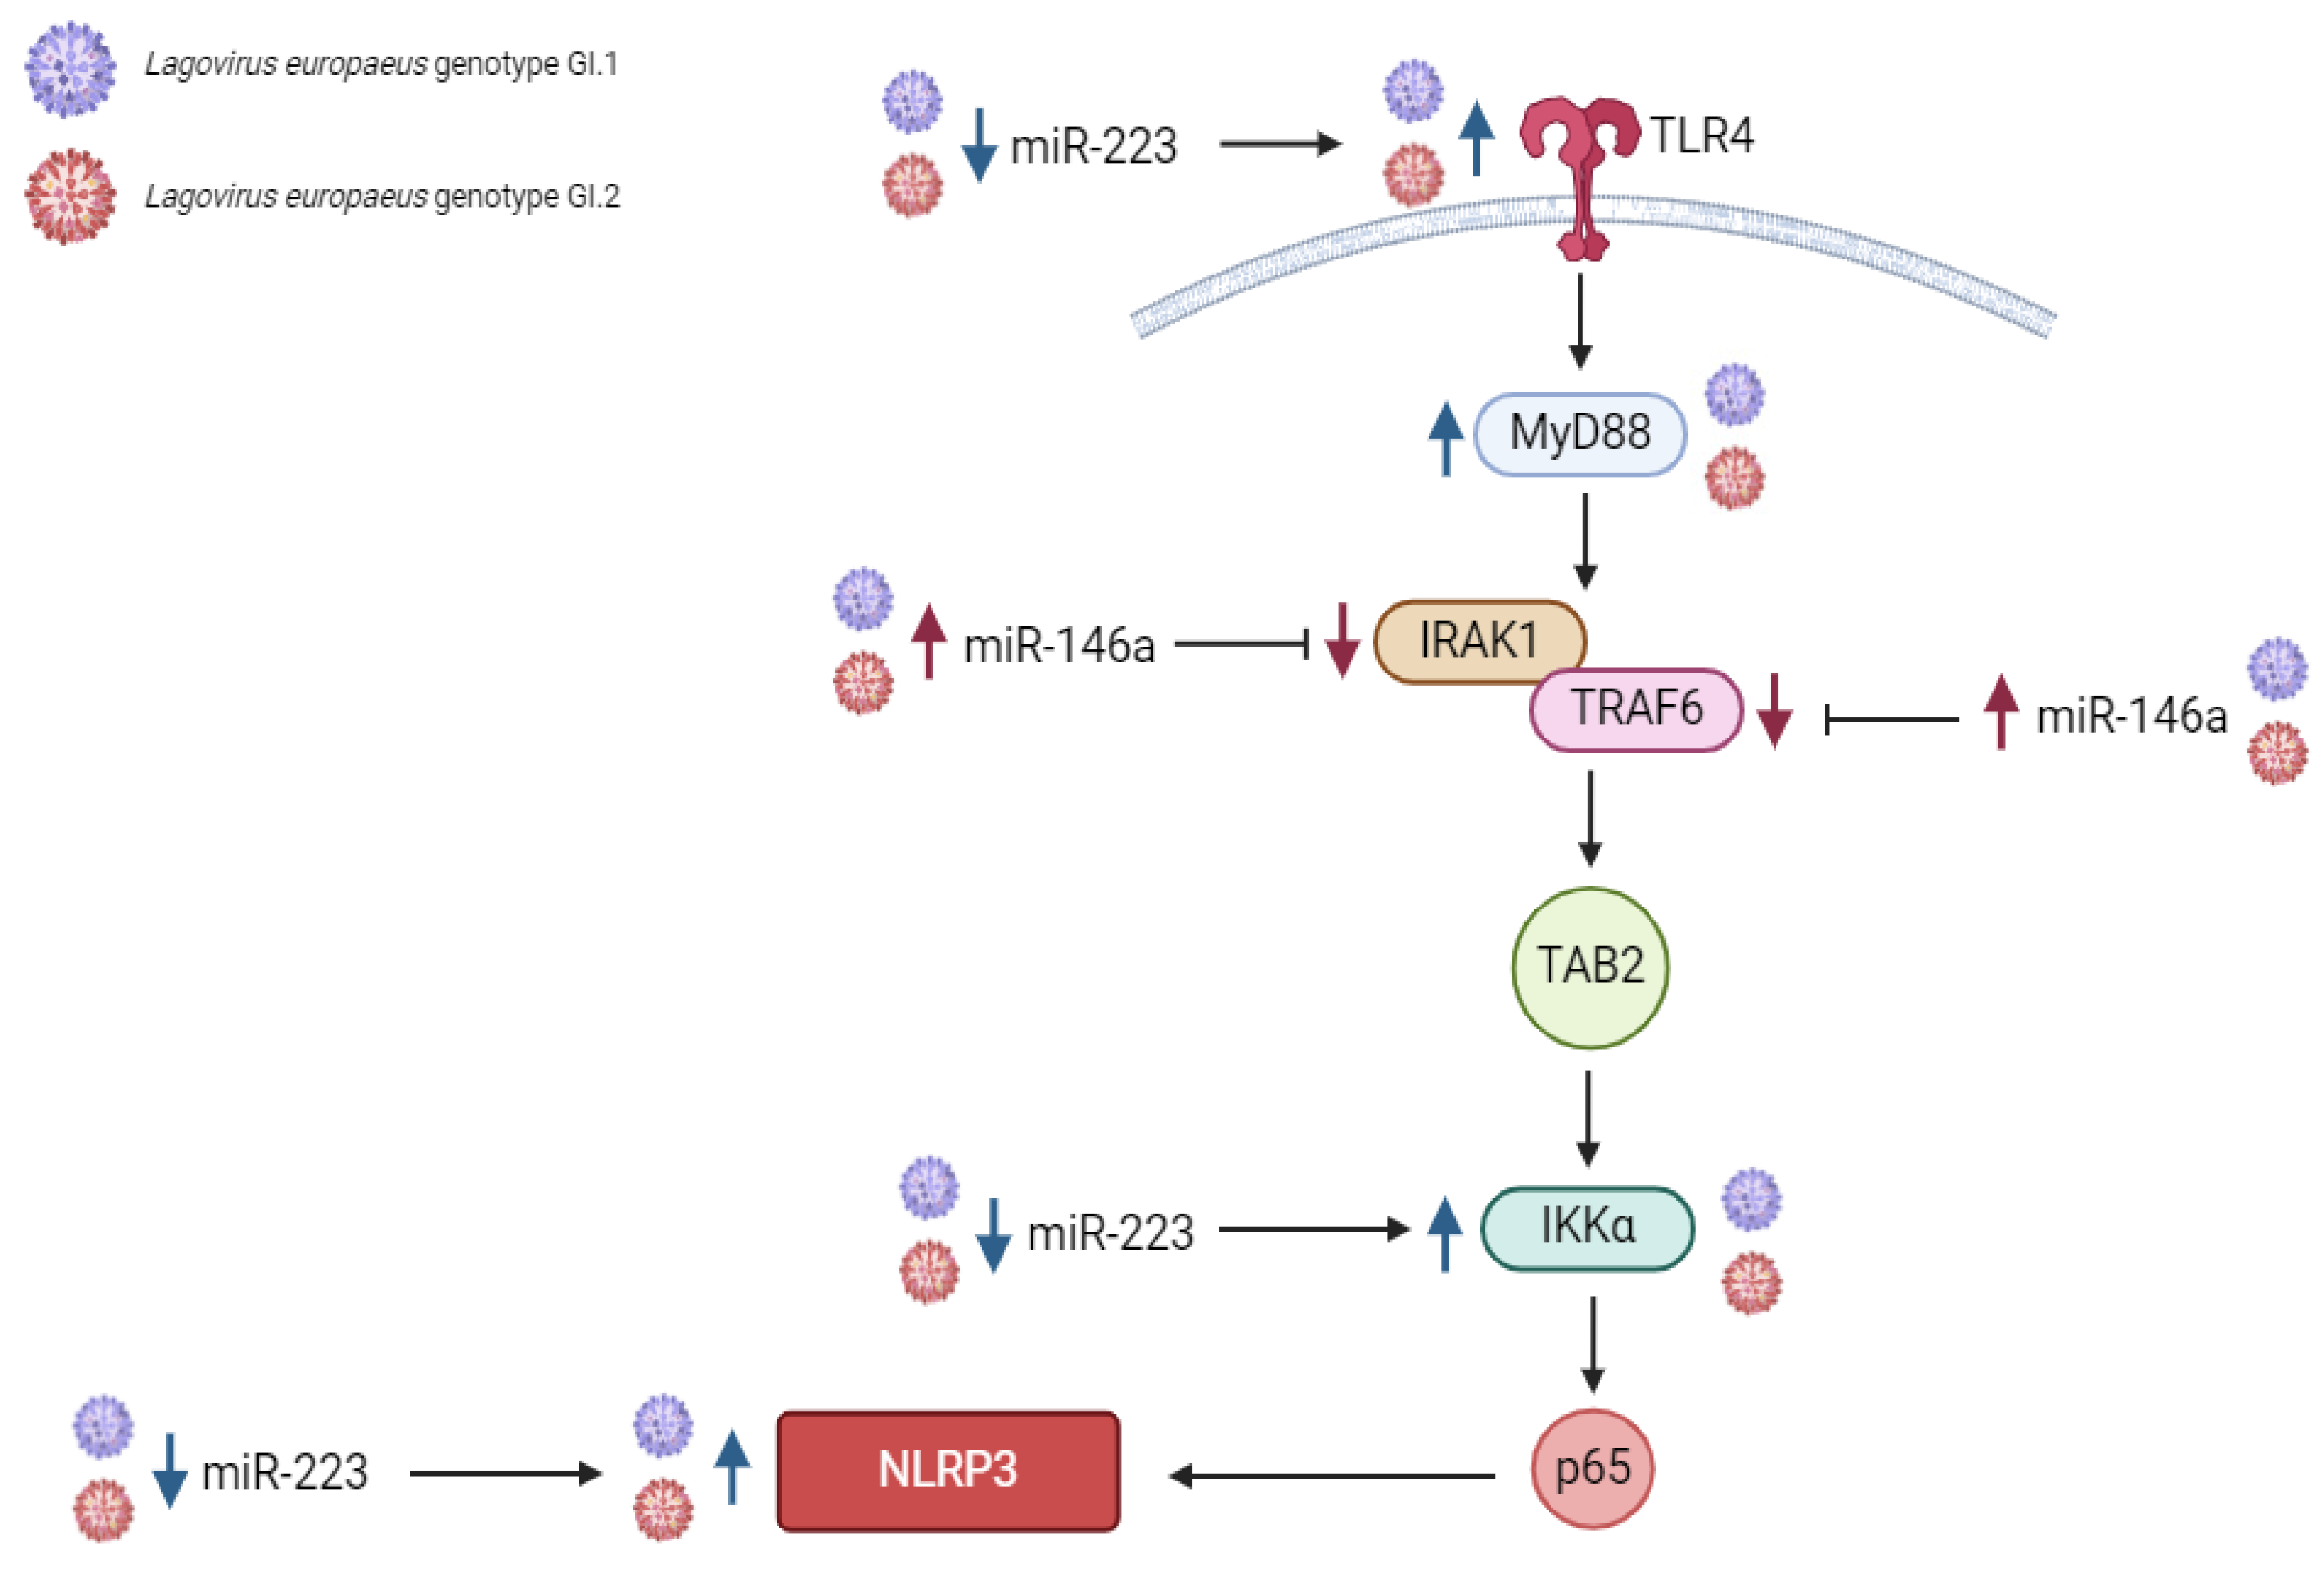
2.1.2. Lung
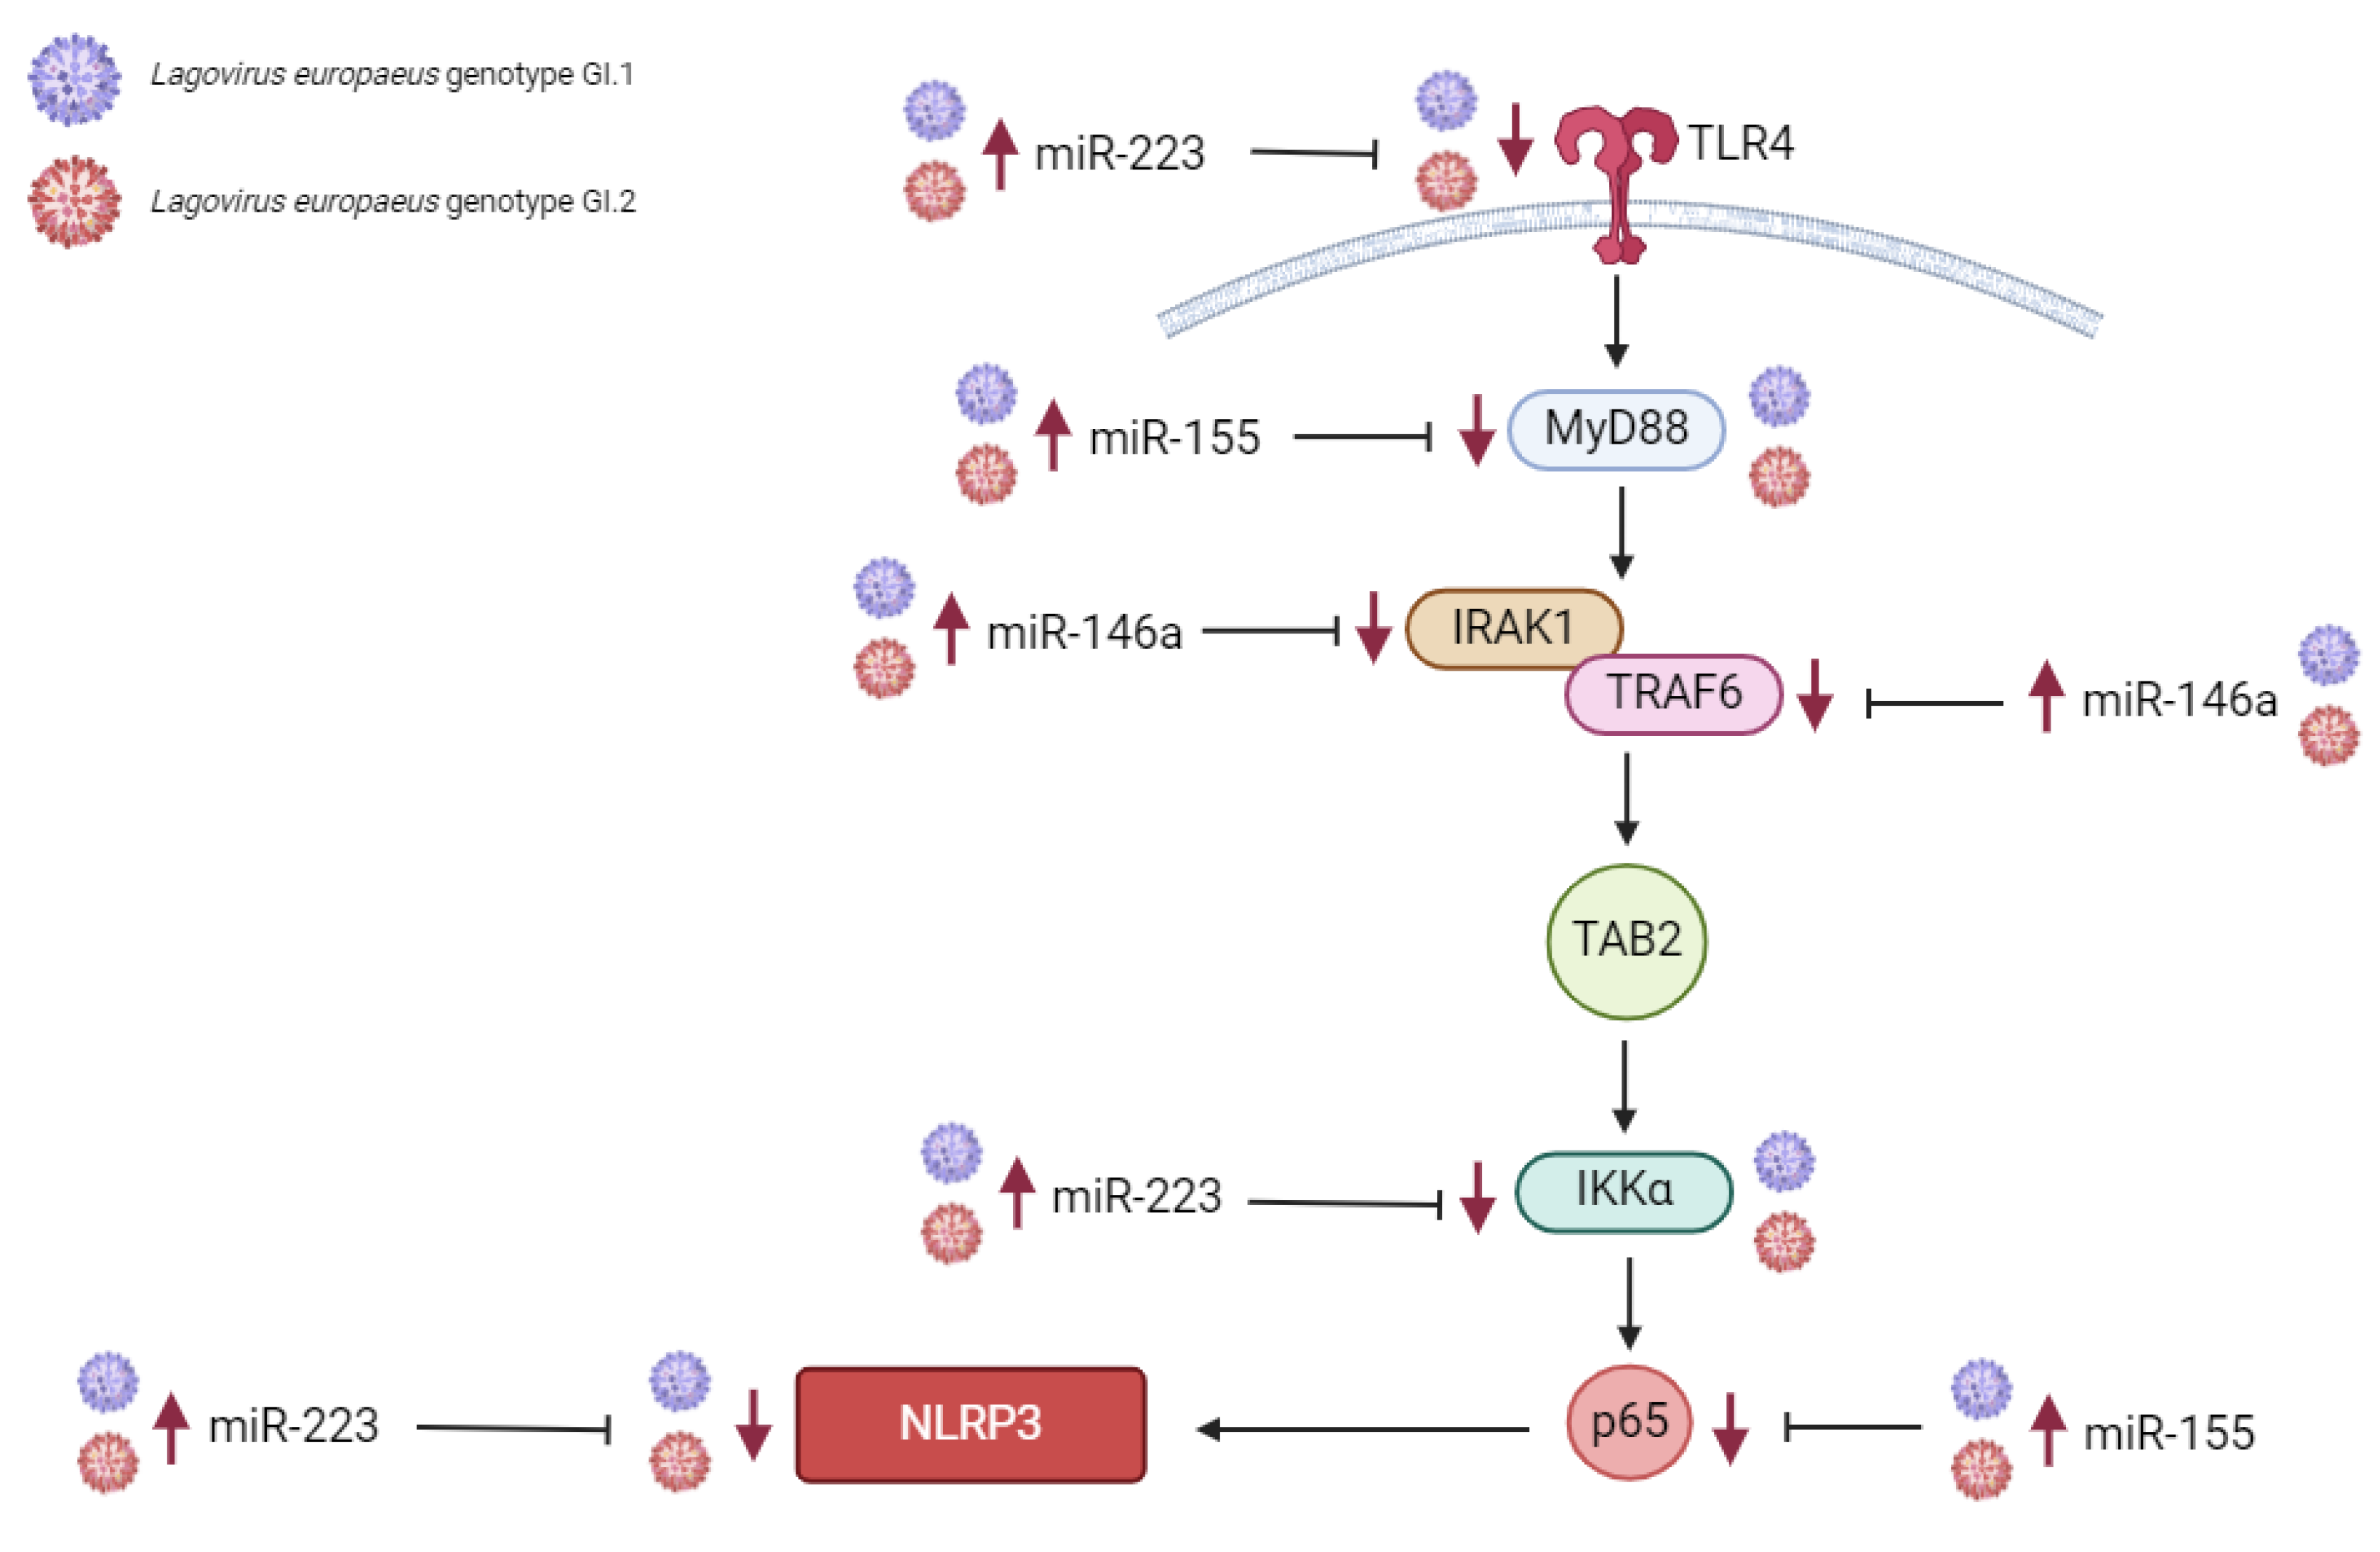
2.1.3. Kidney
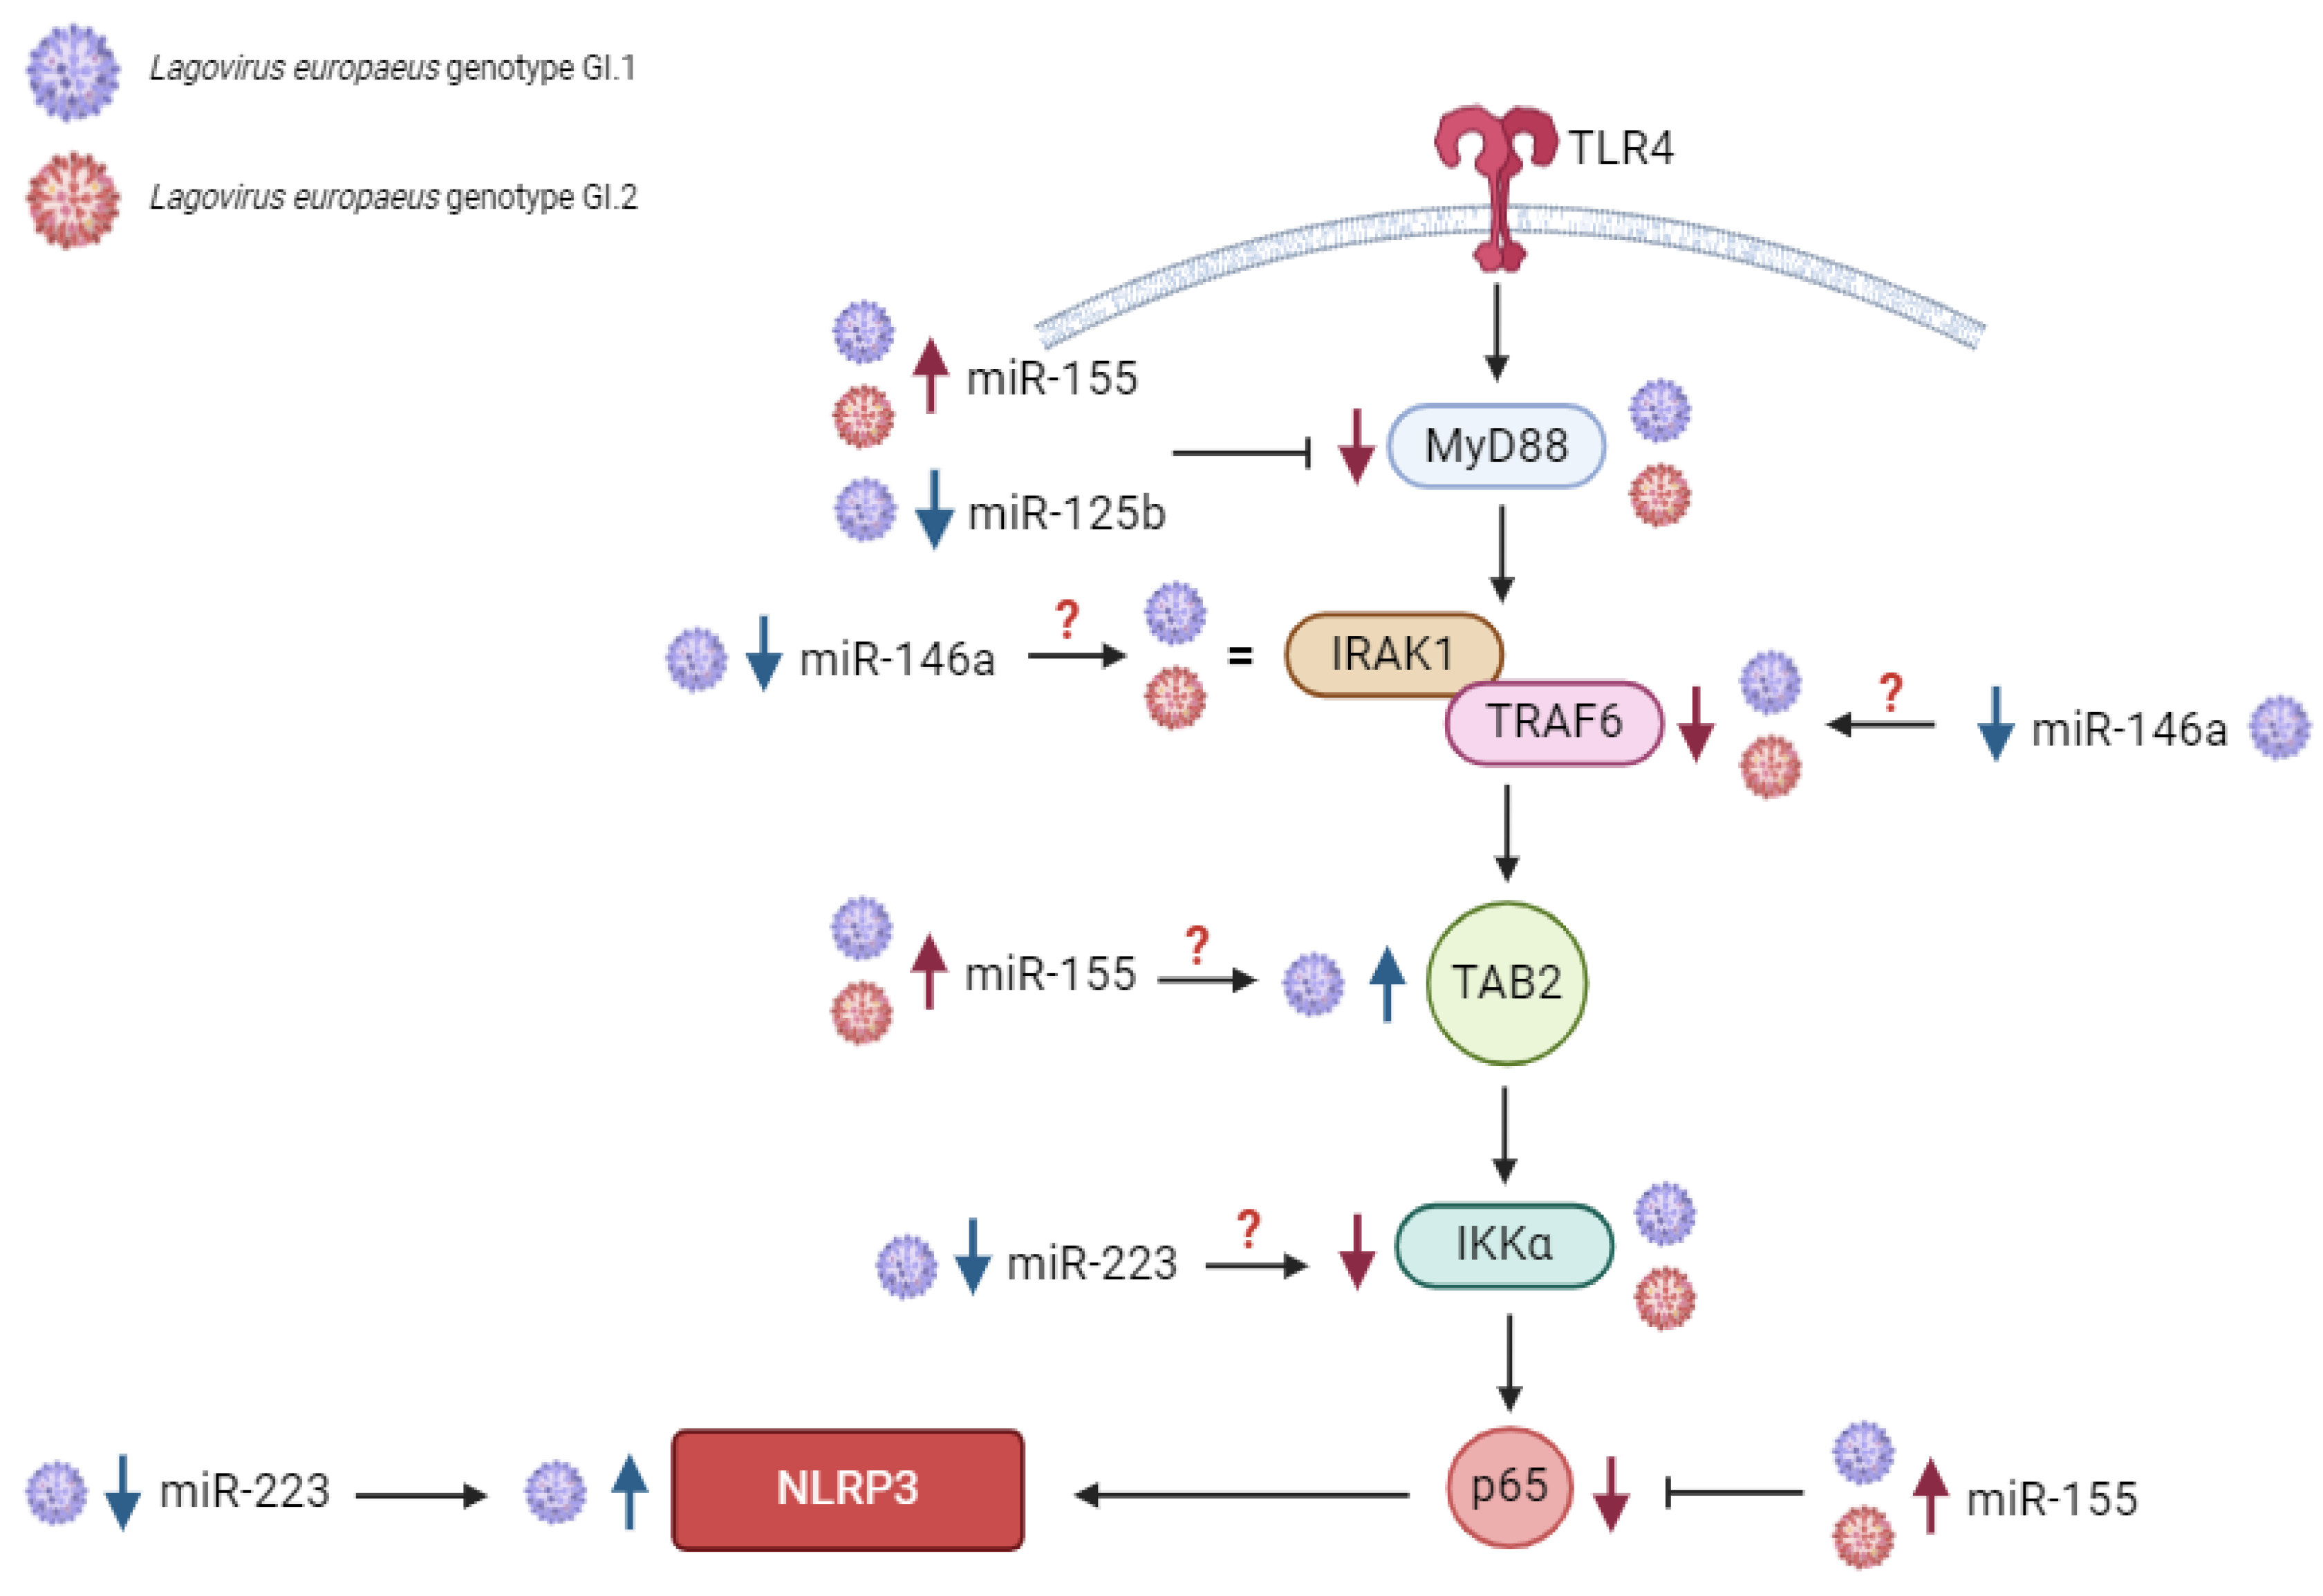
2.1.4. Spleen
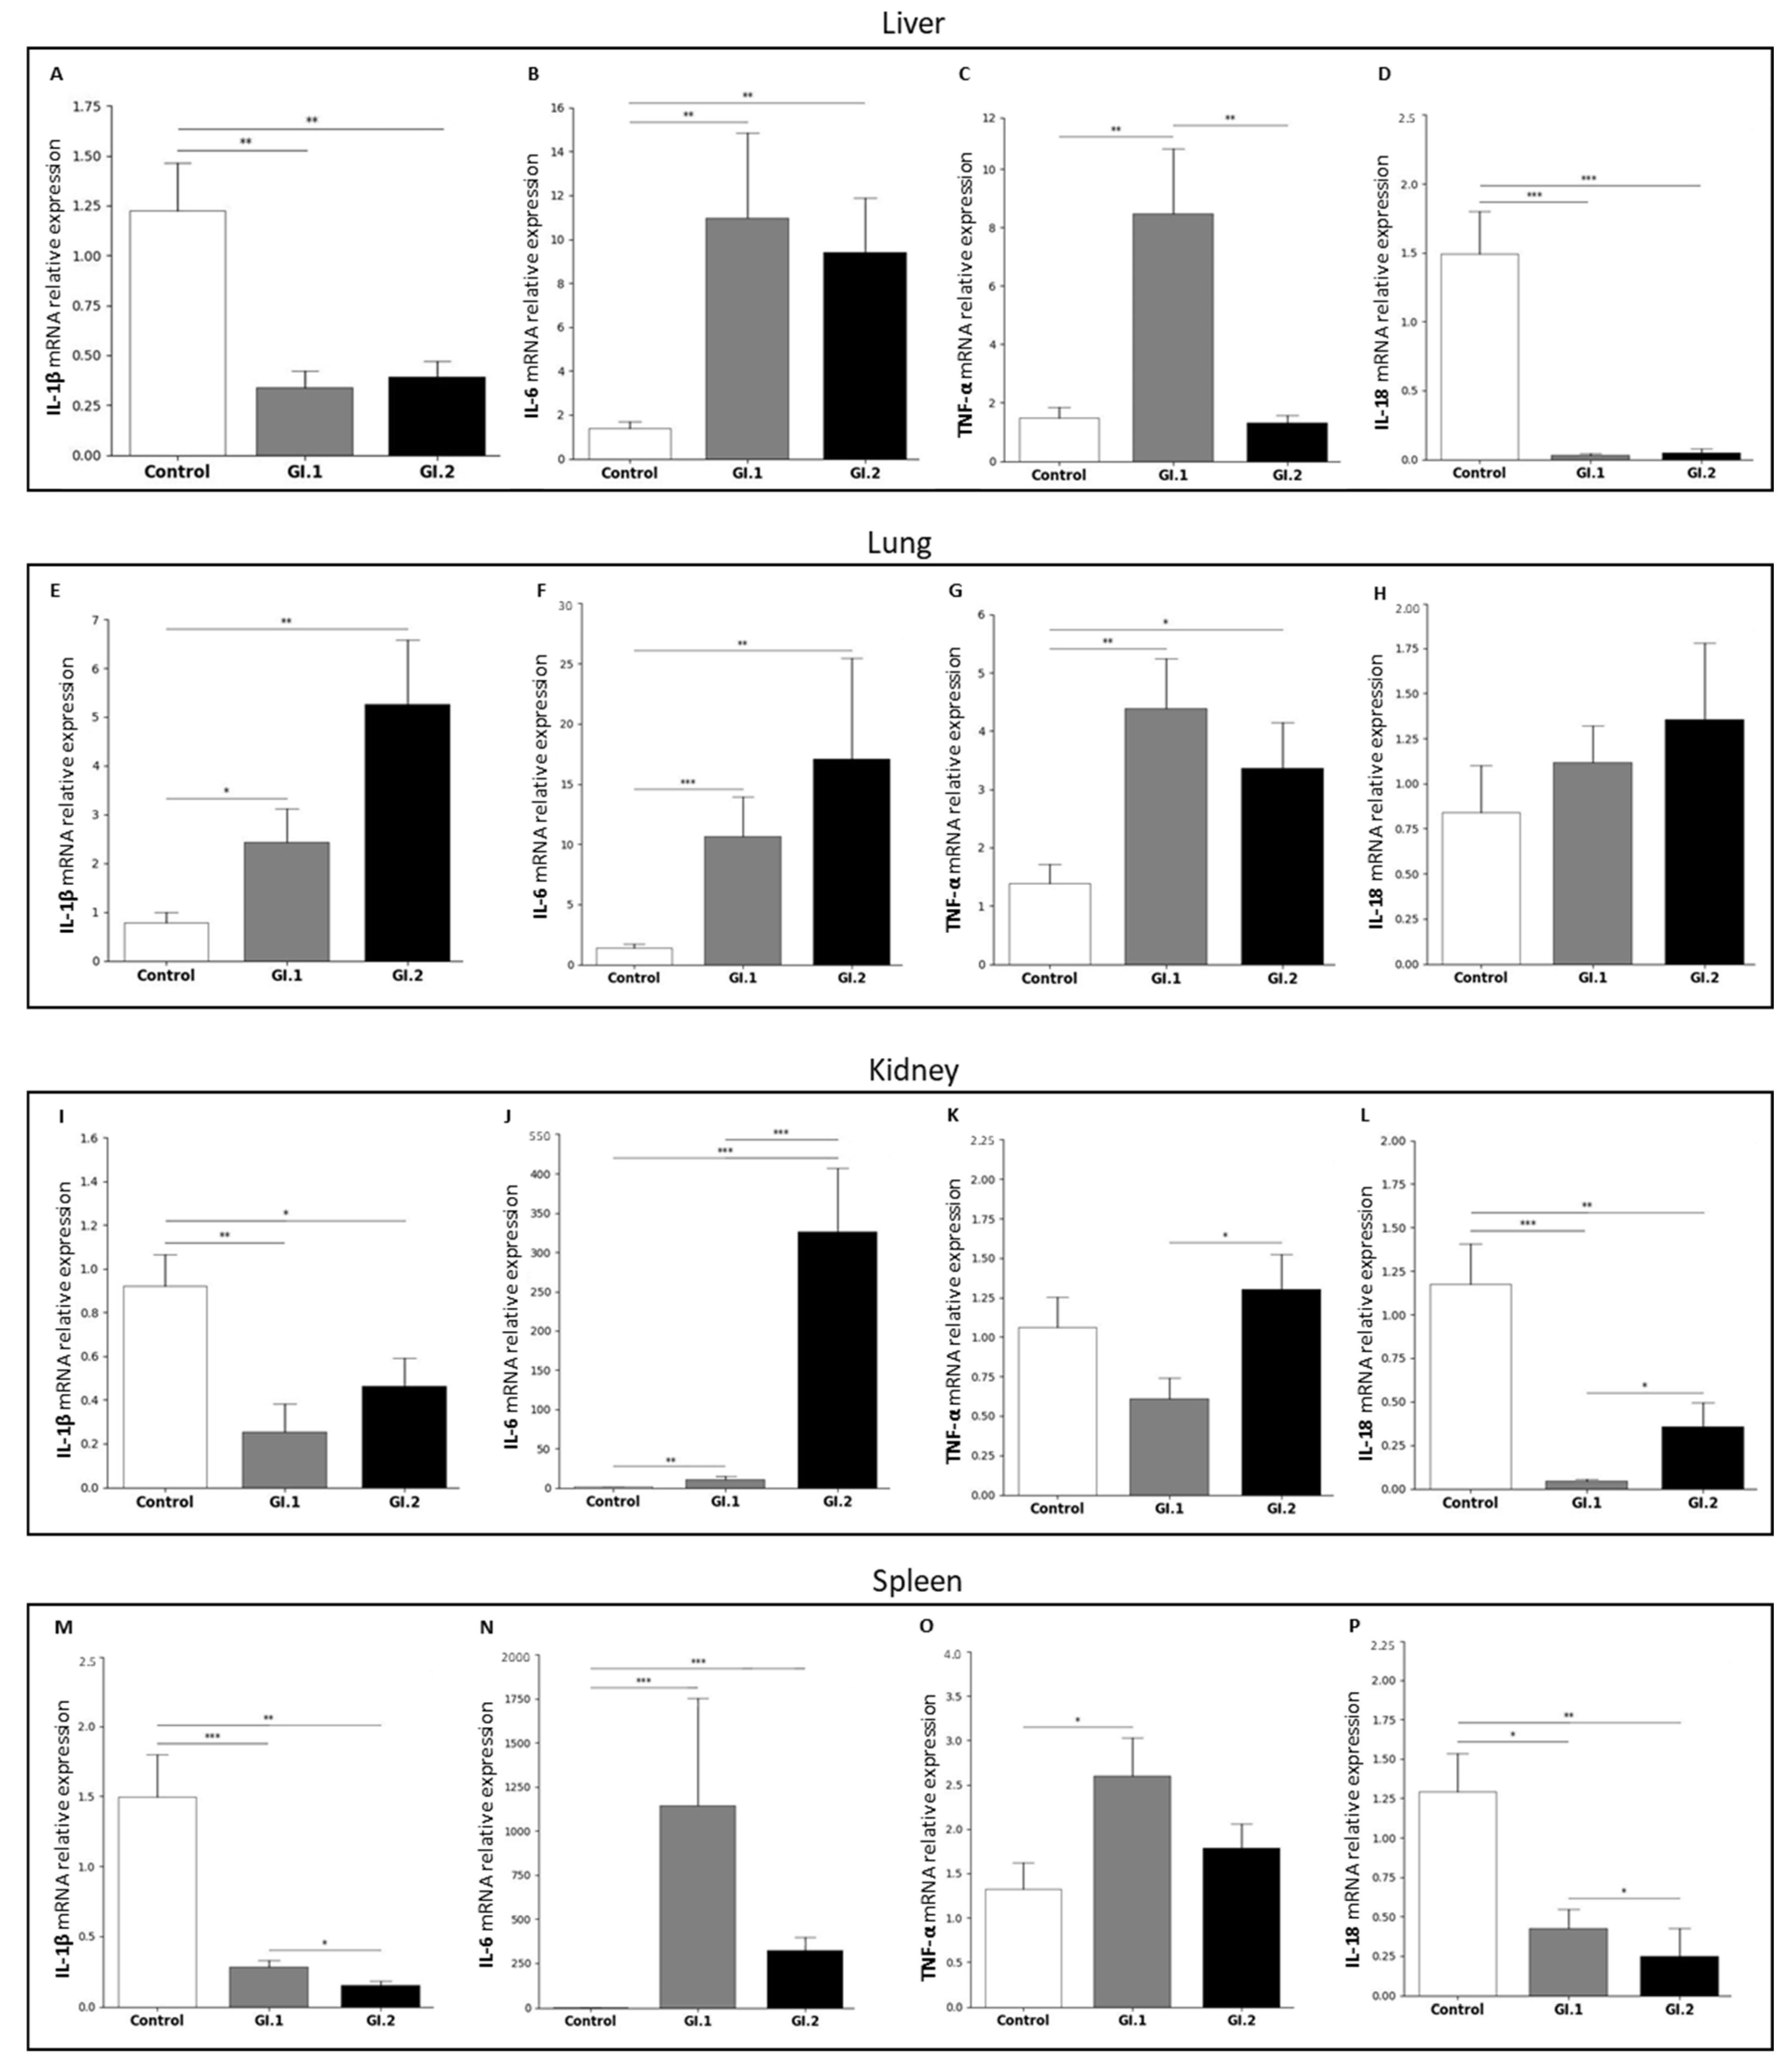
2.2. Biomarkers of Inflammation in the Liver, Lung, Kidney, and Spleen during Lagovirus europaeus/GI.1 and GI.2 Genotype Infection in Rabbits
2.3. Clinical Signs of Disease and Post-Mortem Analysis
3. Discussion
3.1. Proposed miRs, Target Genes, and Pathways of Innate Immune and Inflammatory Response during Lagovirus europaeus/GI.1 and GI.2 Infection
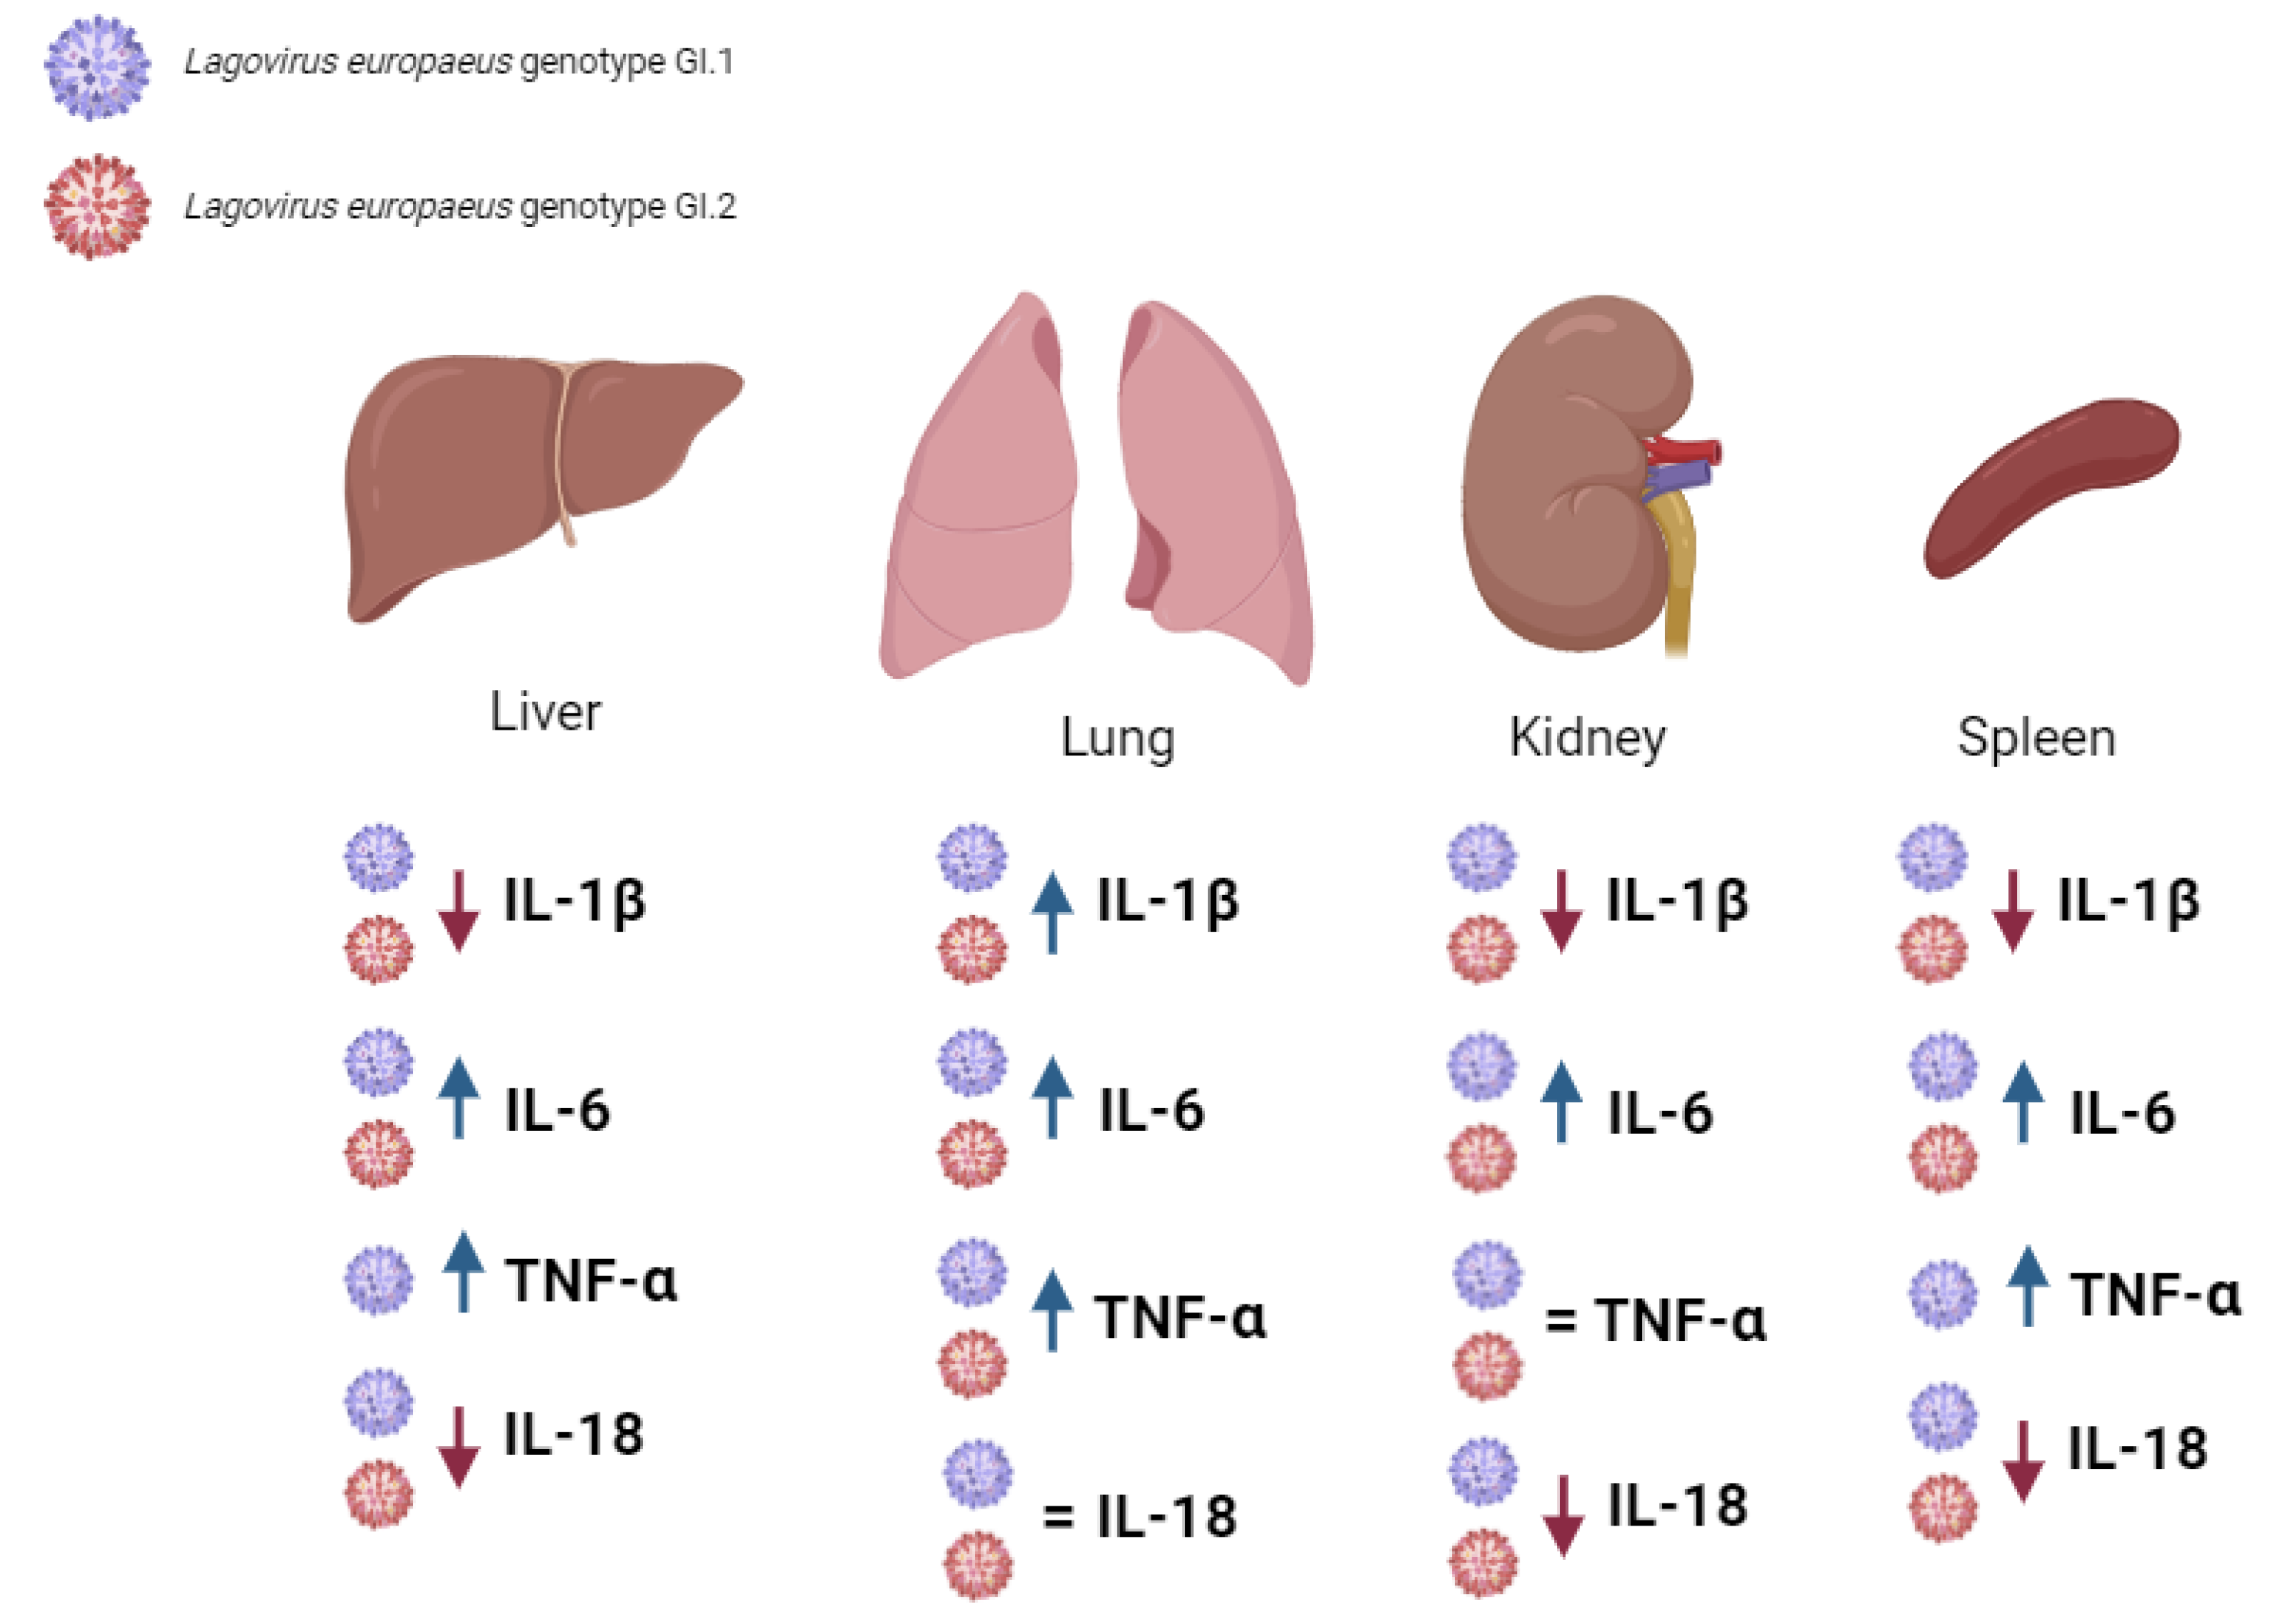
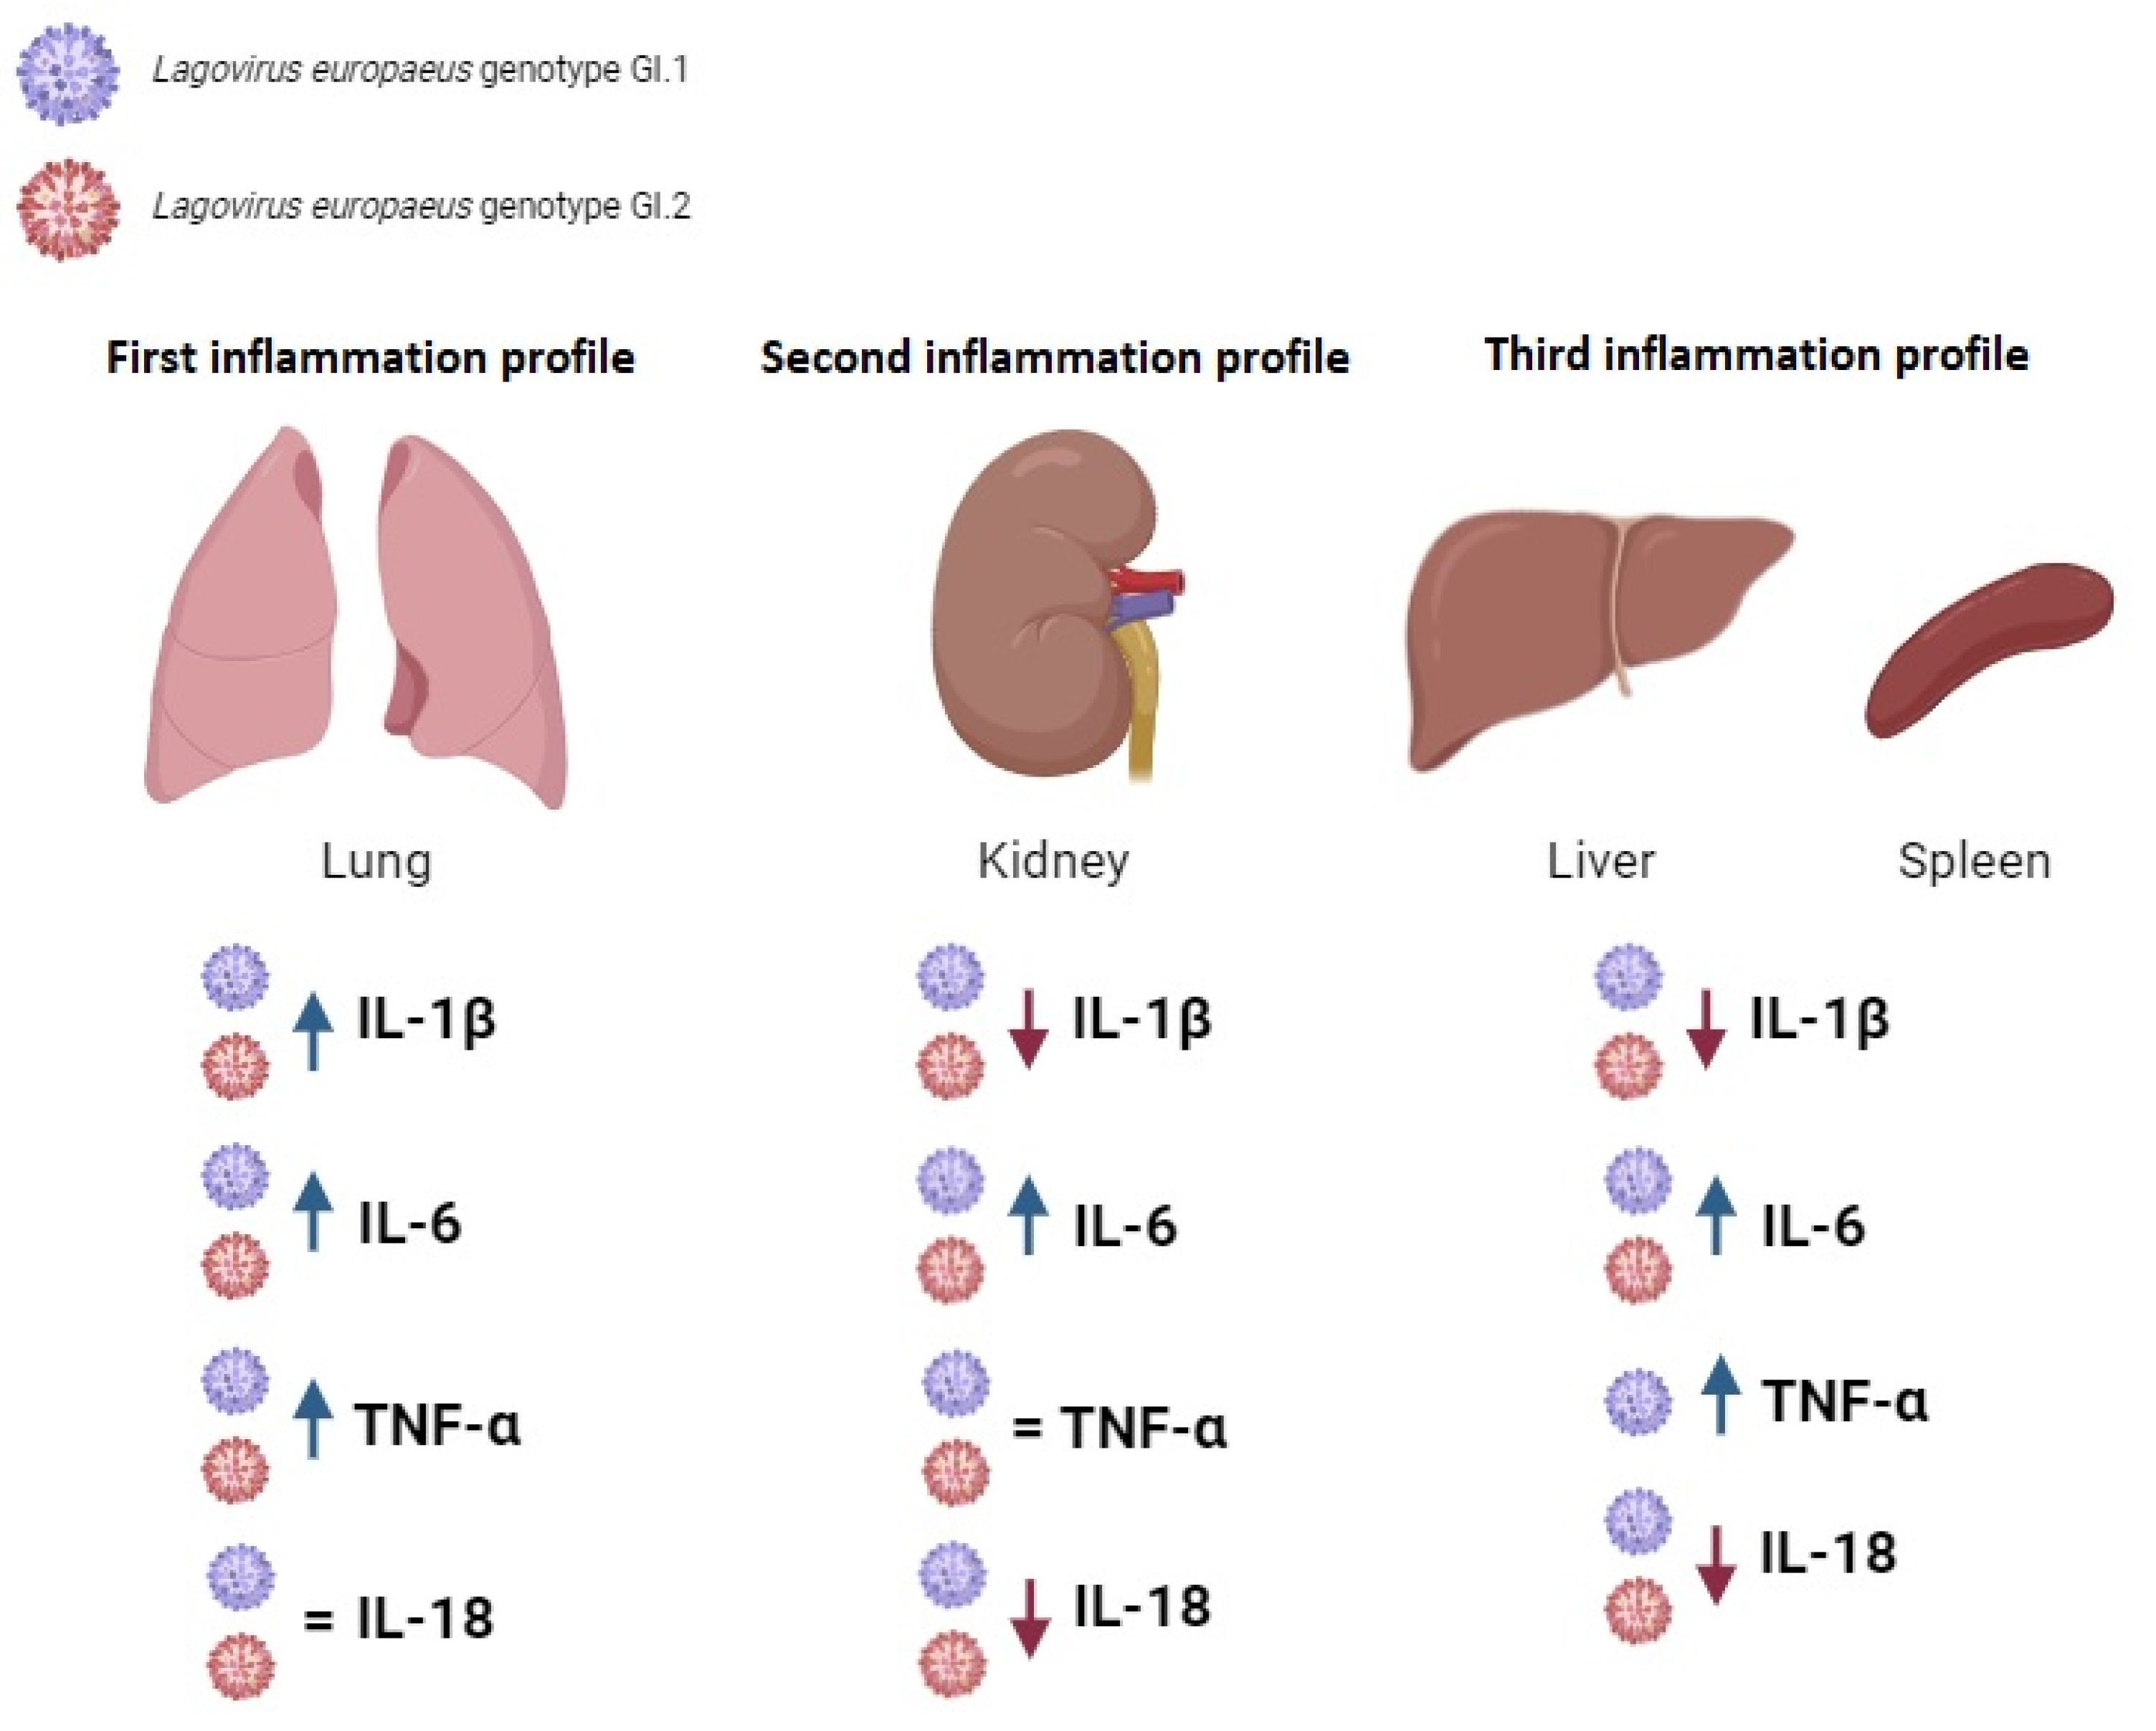
3.2. Proposed Inflammation Profiles in Response to L. europaeus Infection of GI.1 and GI.2 Genotypes
- (1)
- Pulmonary profile (increase three key acute phase cytokines- IL-1β, IL-6, TNF-α; IL-18-no change);
- (2)
- Renal profile (increase: IL-6, decrease: IL-1β, IL-18; TNF-α -no changes);
- (3)
- Liver and spleen profile (increase: IL-6, TNF-α; decrease: IL-1β, IL-18).
4. Materials and Methods
4.1. Ethical Statements
4.2. Viruses
4.3. Experimental Models
4.4. Tissue Sample Collection
4.5. Selection and In-Silico Prediction of miRs Target Genes Involved in the Innate Immune and Inflammatory Response in Oryctolagus cuniculus
4.6. miRs and mRNA Isolation from Tissues
4.7. miRs Polyadenylation and Reverse Transcription Reaction
4.8. mRNAs Polyadenylation and Reverse Transcription Reaction
4.9. Quantification of miRs in Tissue Samples Using Quantitative Real-Time PCR and Data Analysis
4.10. Quantification of mRNAs in Tissue Samples Using Quantitative Real-Time PCR and Data Analysis
4.11. Statistical Analysis
5. Conclusions
Author Contributions
Funding
Institutional Review Board Statement
Informed Consent Statement
Data Availability Statement
Conflicts of Interest
References
- Le Pendu, J.; Abrantes, J.; Bertagnoli, S.; Guitton, J.S.; Le Gall-Recule, G.; Lopes, A.M.; Marchandeau, S.; Alda, F.; Almeida, T.; Celio, A.P.; et al. Proposal for a unified classification system and nomenclature of lagoviruses. J. Gen. Virol. 2017, 98, 1658–1666. [Google Scholar] [CrossRef]
- Liu, S.J.; Xue, H.P.; Pu, B.Q.; Qian, N.H. A new viral disease in rabbits. Anim. Husb. Vet. Med. 1984, 16, 253–255. [Google Scholar]
- Abrantes, J.; van der Loo, W.; Le Pendu, J.; Esteves, P.J. Rabbit haemorrhagic disease (RHD) and rabbit haemorrhagic disease virus (RHDV): A review. Vet. Res. 2012, 43, 12. [Google Scholar] [CrossRef] [PubMed]
- Rocchi, M.; Dagleish, M. Diagnosis and prevention of RHVD2 infection. Vet. Rec. 2018, 182, 604–605. [Google Scholar] [CrossRef]
- Muller, C.; Hrynkiewicz, R.; Bebnowska, D.; Maldonado, J.; Baratelli, M.; Kollner, B.; Niedzwiedzka-Rystwej, P. Immunity against Lagovirus europaeus and the Impact of the Immunological Studies on Vaccination. Vaccines 2021, 9, 255. [Google Scholar] [CrossRef] [PubMed]
- Trzeciak-Ryczek, A.; Tokarz-Deptula, B.; Deptula, W. The importance of liver lesions and changes to biochemical and coagulation factors in the pathogenesis of RHD. Acta Biochim. Pol. 2015, 62, 169–171. [Google Scholar] [CrossRef]
- Park, J.H.; Lee, Y.S.; Itakura, C. Pathogenesis of acute necrotic hepatitis in rabbit hemorrhagic disease. Lab. Anim. Sci. 1995, 45, 445–449. [Google Scholar] [PubMed]
- Alonso, C.; Oviedo, J.M.; Martin-Alonso, J.M.; Diaz, E.; Boga, J.A.; Parra, F. Programmed cell death in the pathogenesis of rabbit hemorrhagic disease. Arch. Virol. 1998, 143, 321–332. [Google Scholar] [CrossRef]
- Jung, J.Y.; Lee, B.J.; Tai, J.H.; Park, J.H.; Lee, Y.S. Apoptosis in rabbit haemorrhagic disease. J. Comp. Pathol. 2000, 123, 135–140. [Google Scholar] [CrossRef]
- San-Miguel, B.; Alvarez, M.; Culebras, J.M.; Gonzalez-Gallego, J.; Tunon, M.J. N-acetyl-cysteine protects liver from apoptotic death in an animal model of fulminant hepatic failure. Apoptosis 2006, 11, 1945–1957. [Google Scholar] [CrossRef]
- Ni, Z.; Wei, W.; Liu, G.Q.; Chen, L.; Yu, B.; Yun, T.; Hua, J.G.; Li, S.M. Studies on the apoptosis of RK13 cells induced by rabbit hemorrhagic disease virus. Bing. Du. Xue Bao 2009, 25, 316–317. [Google Scholar] [PubMed]
- Garcia-Lastra, R.; San-Miguel, B.; Crespo, I.; Jorquera, F.; Alvarez, M.; Gonzalez-Gallego, J.; Tunon, M.J. Signaling pathways involved in liver injury and regeneration in rabbit hemorrhagic disease, an animal model of virally-induced fulminant hepatic failure. Vet. Res. 2010, 41, 2. [Google Scholar] [CrossRef]
- Marques, R.M.; Costa, E.S.A.; Aguas, A.P.; Teixeira, L.; Ferreira, P.G. Early acute depletion of lymphocytes in calicivirus-infected adult rabbits. Vet. Res. Commun. 2010, 34, 659–668. [Google Scholar] [CrossRef]
- Chen, M.; Liu, X.; Hu, B.; Fan, Z.; Song, Y.; Wei, H.; Qiu, R.; Xu, W.; Zhu, W.; Wang, F. Rabbit Hemorrhagic Disease Virus Non-structural Protein 6 Induces Apoptosis in Rabbit Kidney Cells. Front. Microbiol. 2018, 9, 3308. [Google Scholar] [CrossRef]
- Vallejo, D.; Crespo, I.; San-Miguel, B.; Alvarez, M.; Prieto, J.; Tunon, M.J.; Gonzalez-Gallego, J. Autophagic response in the Rabbit Hemorrhagic Disease, an animal model of virally-induced fulminant hepatic failure. Vet. Res. 2014, 45, 15. [Google Scholar] [CrossRef] [PubMed]
- Ostrycharz, E.; Fitzner, A.; Kesy, A.; Siennicka, A.; Hukowska-Szematowicz, B. MicroRNAs participate in the regulation of apoptosis and oxidative stress-related gene expression in rabbits infected with Lagovirus europaeus GI.1 and GI.2 genotypes. Front. Microbiol. 2024, 15, 1349535. [Google Scholar] [CrossRef] [PubMed]
- Bebnowska, D.; Hrynkiewicz, R.; Rzeszotek, S.; Freus, M.; Poniewierska-Baran, A.; Niedzwiedzka-Rystwej, P. Apoptotic Cell Death in an Animal Model of Virus-Induced Acute Liver Failure-Observations during Lagovirus europaeus/GI.2 Infection. Int. J. Mol. Sci. 2024, 25, 798. [Google Scholar] [CrossRef]
- Bebnowska, D.; Hrynkiewicz, R.; Wisniewska, K.; Zabinska, M.; Rintz, E.; Pierzynowska, K.; Niedzwiedzka-Rystwej, P. Apoptosis activation during Lagovirus europaeus/GI.2 infection in rabbits. Front. Microbiol. 2023, 14, 1308018. [Google Scholar] [CrossRef]
- Niedzwiedzka-Rystwej, P.; Deptula, W. Apoptosis of peripheral blood leukocytes from rabbits infected with non-haemagglutinating strains of rabbit haemorrhagic disease virus (RHDV). Vet. Immunol. Immunopathol. 2012, 149, 54–57. [Google Scholar] [CrossRef]
- Hukowska-Szematowicz, B. Genetic and immunological characteristic of European strains of RHD (rabbit heamorrhagic disease) virus. Pol. J. Environ. Stud. 2013, 2, 1–114. [Google Scholar]
- Niedzwiedzka-Rystwej, P.; Hukowska-Szematowicz, B.; Tokarz-Deptula, B.; Trzeciak-Ryczek, A.; Dzialo, J.; Deptula, W. Apoptosis of peripheral blood leucocytes in rabbits infected with different strains of rabbit haemorrhagic disease virus. Acta Biochim. Pol. 2013, 60, 65–69. [Google Scholar] [CrossRef] [PubMed]
- Hu, B.; Wei, H.; Song, Y.; Chen, M.; Fan, Z.; Qiu, R.; Zhu, W.; Xu, W.; Wang, F. NF-kappaB and Keap1 Interaction Represses Nrf2-Mediated Antioxidant Response in Rabbit Hemorrhagic Disease Virus Infection. J. Virol. 2020, 94, e00016-20. [Google Scholar] [CrossRef]
- Hukowska-Szematowicz, B.; Ostrycharz, E.; Dudzinska, W.; Roszkowska, P.; Siennicka, A.; Wojciechowska-Koszko, I. Digital PCR (dPCR) Quantification of miR-155-5p as a Potential Candidate for a Tissue Biomarker of Inflammation in Rabbits Infected with Lagovirus europaeus/Rabbit Hemorrhagic Disease Virus (RHDV). Viruses 2023, 15, 1578. [Google Scholar] [CrossRef] [PubMed]
- Hukowska-Szematowicz, B.; Maciejak-Jastrzebska, A.; Blatkiewicz, M.; Maciak, K.; Gora, M.; Janiszewska, J.; Burzynska, B. Changes in MicroRNA Expression during Rabbit Hemorrhagic Disease Virus (RHDV) Infection. Viruses 2020, 12, 965. [Google Scholar] [CrossRef] [PubMed]
- Ostrycharz, E.; Hukowska-Szematowicz, B. Micro-Players of Great Significance-Host microRNA Signature in Viral Infections in Humans and Animals. Int. J. Mol. Sci. 2022, 23, 10536. [Google Scholar] [CrossRef]
- Bartel, D.P. MicroRNAs: Genomics, biogenesis, mechanism, and function. Cell 2004, 116, 281–297. [Google Scholar] [CrossRef]
- Hrynkiewicz, R.; Bebnowska, D.; Niedzwiedzka-Rystwej, P. Myeloperoxidase and Lysozymes as a Pivotal Hallmark of Immunity Status in Rabbits. Animals 2020, 10, 1581. [Google Scholar] [CrossRef]
- Tokarz-Deptuła, B. Immunity phenomena in rabbits infected with the RHD virus (rabbit haemorrhagic disease). Pol. J. Environ. Sci. 2009, 7, 1–81. [Google Scholar]
- Tokarz-Deptula, B.; Kulus, J.; Baraniecki, L.; Stosik, M.; Deptula, W. Characterisation of Lagovirus europaeus GI-RHDVs (Rabbit Haemorrhagic Disease Viruses) in Terms of Their Pathogenicity and Immunogenicity. Int. J. Mol. Sci. 2024, 25, 5342. [Google Scholar] [CrossRef]
- Niedźwiedzka-Rystwej, P.; Deptuła, W. Non-specific immunity in rabbits infected with 10 strains of the rabbit haemorrhagic disease virus with different biological properties. Cent. Europ. J. Biol. 2010, 5, 613–632. [Google Scholar] [CrossRef]
- Hukowska-Szematowicz, B.; Deptuła, W. Non-specific cellular in rabbits experimentlaly infected with four Czech strains of the Rabbit Haemorrhagic Disease Virus with Different patho-genicity. Pol. J. Environ. Stud. 2012, 21, 879–892. [Google Scholar]
- Niedzwiedzka-Rystwej, P.; Tokarz-Deptula, B.; Deptula, W. Reactivity of selected markers of innate and adaptive immunity in rabbits experimentally infected with antigenic variants of RHD (Lagovirus europaeus/GI.1a). Vet. Res. Commun. 2022, 46, 233–242. [Google Scholar] [CrossRef] [PubMed]
- Hukowska-Szematowicz, B. Changes in innate and adaptive immune response to Lagovirus europaeus GI.1 (Rabbit Haemorrhagic Disease Virus-RHDV) infection. Acta Biol. 2020, 27, 77–91. [Google Scholar] [CrossRef]
- Marcato, P.S.; Benazzi, C.; Vecchi, G.; Galeotti, M.; Della Salda, L.; Sarli, G.; Lucidi, P. Clinical and pathological features of viral haemorrhagic disease of rabbits and the European brown hare syndrome. Rev. Sci. Technol. 1991, 10, 371–392. [Google Scholar] [CrossRef]
- Ferreira, P.G.; Costa, E.S.A.; Oliveira, M.J.; Monteiro, E.; Aguas, A.P. Leukocyte-hepatocyte interaction in calicivirus infection: Differences between rabbits that are resistant or susceptible to rabbit haemorrhagic disease (RHD). Vet. Immunol. Immunopathol. 2005, 103, 217–221. [Google Scholar] [CrossRef]
- Ostrycharz, E.; Blatkiewicz, M.; Hukowska-Szematowicz, B. Młodzi naukowcy 2.0. Tom 1. Expression of the Master Anti-Inflammatory Regulator IL-10 during Lagovirus Europaeus GI.1/RHDV (Rabbit Hemorrhagic Disease Virus) Infection.; Fundacja Centrum Badań Socjologicznych (Centre of Sociological Research): Szczecin, Poland, 2021; pp. 59–72. [Google Scholar]
- Trzeciak-Ryczek, A.; Tokarz-Deptula, B.; Deptula, W. Expression of IL-1Ra, IL-6, IL-8, IL-18, TNF-alpha and IFN-gamma genes in peripheral blood leukocytes of rabbits infected with RHDV (Rabbit Haemorrhagic Disease Virus). Dev. Comp. Immunol. 2017, 76, 310–315. [Google Scholar] [CrossRef]
- Trzeciak-Ryczek, A.; Tokarz-Deptula, B.; Deptula, W. Expression of IL-1beta, IL-2, IL-10, TNF-beta and GM-CSF in peripheral blood leukocytes of rabbits experimentally infected with rabbit haemorrhagic disease virus. Vet. Microbiol. 2016, 186, 71–81. [Google Scholar] [CrossRef]
- Semerjyan, A.B.; Sargsyan, M.A.; Arzumanyan, H.H.; Hakobyan, L.H.; Abroyan, L.O.; Semerjyan, Z.B.; Avetisyan, A.S.; Karalova, E.M.; Manukyan, D.M.; Matevosyan, H.S.; et al. Immune cell pathology in rabbit hemorrhagic disease. Vet. World 2019, 12, 1332–1340. [Google Scholar] [CrossRef]
- Teixeira, L.; Marques, R.M.; Aguas, A.P.; Ferreira, P.G. Regulatory T cells are decreased in acute RHDV lethal infection of adult rabbits. Vet. Immunol. Immunopathol. 2012, 148, 343–347. [Google Scholar] [CrossRef]
- Marques, R.M.; Costa, E.S.A.; Aguas, A.P.; Teixeira, L.; Ferreira, P.G. Early inflammatory response of young rabbits attending natural resistance to calicivirus (RHDV) infection. Vet. Immunol. Immunopathol. 2012, 150, 181–188. [Google Scholar] [CrossRef]
- O’Toole, A.D.; Mohamed, F.M.; Zhang, J.; Brown, C.C. Early pathogenesis in rabbit hemorrhagic disease virus 2. Microb. Pathog. 2022, 173, 105814. [Google Scholar] [CrossRef] [PubMed]
- Yu, J.; Li, Y.; Xiao, L.; Xie, J.; Guo, Z.; Ye, Y.; Lin, Y.; Cao, Y.; Wu, X.; Mao, C.; et al. Neglected Spleen Transcriptional Profile Reveals Inflammatory Disorder Conferred by Rabbit Hemorrhagic Disease Virus 2 Infection. Viruses 2024, 16, 495. [Google Scholar] [CrossRef] [PubMed]
- Hukowska-Szematowicz, B.; Deptuła, W. Peripheral blood lymphocytes in rabbits infected with Czech strains, CAMPV-562 and CAMPV-558 of RHD virus. Cent. Eur. J. Immunol. 2008, 33, 8–13. [Google Scholar]
- Niedźwiedzka-Rystwej, P.; Tokarz-Deptuła, B.; Hukowska-Szematowicz, B.; Działo, J.; Trzeciak-Ryczek, A. Peripheral blood lymphocytes B and T and their subpopulation in rabbits infected with rabbit haemorrhagic diseaase virus (RHDV). Med. Weter. 2013, 59, 484–487. [Google Scholar]
- Nejad, C.; Stunden, H.J.; Gantier, M.P. A guide to miRNAs in inflammation and innate immune responses. FEBS J. 2018, 285, 3695–3716. [Google Scholar] [CrossRef]
- Mahesh, G.; Biswas, R. MicroRNA-155: A Master Regulator of Inflammation. J. Interferon Cytokine Res. 2019, 39, 321–330. [Google Scholar] [CrossRef] [PubMed]
- Jafarzadeh, A.; Naseri, A.; Shojaie, L.; Nemati, M.; Jafarzadeh, S.; Bannazadeh Baghi, H.; Hamblin, M.R.; Akhlagh, S.A.; Mirzaei, H. MicroRNA-155 and antiviral immune responses. Int. Immunopharmacol. 2021, 101, 108188. [Google Scholar] [CrossRef]
- Das, K.; Rao, L.V.M. The Role of microRNAs in Inflammation. Int. J. Mol. Sci. 2022, 23, 15479. [Google Scholar] [CrossRef]
- Lee, H.M.; Kim, T.S.; Jo, E.K. MiR-146 and miR-125 in the regulation of innate immunity and inflammation. BMB Rep. 2016, 49, 311–318. [Google Scholar] [CrossRef]
- Marques-Rocha, J.L.; Samblas, M.; Milagro, F.I.; Bressan, J.; Martinez, J.A.; Marti, A. Noncoding RNAs, cytokines, and inflammation-related diseases. FASEB J. 2015, 29, 3595–3611. [Google Scholar] [CrossRef] [PubMed]
- Sonkoly, E.; Stahle, M.; Pivarcsi, A. MicroRNAs and immunity: Novel players in the regulation of normal immune function and inflammation. Semin. Cancer Biol. 2008, 18, 131–140. [Google Scholar] [CrossRef] [PubMed]
- Szumna, M.; Hukowska-Szematowicz, B. MicroRNAa as new immunity regulators in viral and bacterial infection. Acta Biol. 2020, 27, 93–108. [Google Scholar] [CrossRef]
- Gruys, E.; Toussaint, M.J.; Niewold, T.A.; Koopmans, S.J. Acute phase reaction and acute phase proteins. J. Zhejiang Univ. Sci. B 2005, 6, 1045–1056. [Google Scholar] [CrossRef] [PubMed]
- Jain, S.; Gautam, V.; Naseem, S. Acute-phase proteins: As diagnostic tool. J. Pharm. Bioallied Sci. 2011, 3, 118–127. [Google Scholar] [CrossRef] [PubMed]
- Pirhonen, J. Regulation of IL-18 expression in virus infection. Scand. J. Immunol. 2001, 53, 533–539. [Google Scholar] [CrossRef]
- Kaplanski, G. Interleukin-18: Biological properties and role in disease pathogenesis. Immunol. Rev. 2018, 281, 138–153. [Google Scholar] [CrossRef]
- Slaats, J.; Ten Oever, J.; van de Veerdonk, F.L.; Netea, M.G. IL-1beta/IL-6/CRP and IL-18/ferritin: Distinct Inflammatory Programs in Infections. PLoS Pathog. 2016, 12, e1005973. [Google Scholar] [CrossRef]
- Chen, L.; Deng, H.; Cui, H.; Fang, J.; Zuo, Z.; Deng, J.; Li, Y.; Wang, X.; Zhao, L. Inflammatory responses and inflammation-associated diseases in organs. Oncotarget 2018, 9, 7204–7218. [Google Scholar] [CrossRef]
- Tanaka, T.; Narazaki, M.; Kishimoto, T. IL-6 in inflammation, immunity, and disease. Cold Spring Harb. Perspect. Biol. 2014, 6, a016295. [Google Scholar] [CrossRef]
- Kang, S.; Kishimoto, T. Interplay between interleukin-6 signaling and the vascular endothelium in cytokine storms. Exp. Mol. Med. 2021, 53, 1116–1123. [Google Scholar] [CrossRef]
- Jang, D.I.; Lee, A.H.; Shin, H.Y.; Song, H.R.; Park, J.H.; Kang, T.B.; Lee, S.R.; Yang, S.H. The Role of Tumor Necrosis Factor Alpha (TNF-alpha) in Autoimmune Disease and Current TNF-alpha Inhibitors in Therapeutics. Int. J. Mol. Sci. 2021, 22, 2719. [Google Scholar] [CrossRef]
- Mohd Zawawi, Z.; Kalyanasundram, J.; Mohd Zain, R.; Thayan, R.; Basri, D.F.; Yap, W.B. Prospective Roles of Tumor Necrosis Factor-Alpha (TNF-alpha) in COVID-19: Prognosis, Therapeutic and Management. Int. J. Mol. Sci. 2023, 24, 6142. [Google Scholar] [CrossRef] [PubMed]
- Lai, W.Y.; Wang, J.W.; Huang, B.T.; Lin, E.P.; Yang, P.C. A Novel TNF-alpha-Targeting Aptamer for TNF-alpha-Mediated Acute Lung Injury and Acute Liver Failure. Theranostics 2019, 9, 1741–1751. [Google Scholar] [CrossRef]
- Haneklaus, M.; Gerlic, M.; Kurowska-Stolarska, M.; Rainey, A.A.; Pich, D.; McInnes, I.B.; Hammerschmidt, W.; O’Neill, L.A.; Masters, S.L. Cutting edge: miR-223 and EBV miR-BART15 regulate the NLRP3 inflammasome and IL-1beta production. J. Immunol. 2012, 189, 3795–3799. [Google Scholar] [CrossRef] [PubMed]
- Morales, L.; Oliveros, J.C.; Enjuanes, L.; Sola, I. Contribution of Host miRNA-223-3p to SARS-CoV-Induced Lung Inflammatory Pathology. mBio 2022, 13, e0313521. [Google Scholar] [CrossRef] [PubMed]
- Houshmandfar, S.; Saeedi-Boroujeni, A.; Rashno, M.; Khodadadi, A.; Mahmoudian-Sani, M.R. miRNA-223 as a regulator of inflammation and NLRP3 inflammasome, the main fragments in the puzzle of immunopathogenesis of different inflammatory diseases and COVID-19. Naunyn Schmiedebergs Arch. Pharmacol. 2021, 394, 2187–2195. [Google Scholar] [CrossRef] [PubMed]
- Yuan, S.; Wu, Q.; Wang, Z.; Che, Y.; Zheng, S.; Chen, Y.; Zhong, X.; Shi, F. miR-223: An Immune Regulator in Infectious Disorders. Front. Immunol. 2021, 12, 781815. [Google Scholar] [CrossRef]
- Gu, J.; Xu, H.; Chen, Y.; Li, N.; Hou, X. MiR-223 as a Regulator and Therapeutic Target in Liver Diseases. Front. Immunol. 2022, 13, 860661. [Google Scholar] [CrossRef]
- Wan, L.; Yuan, X.; Liu, M.; Xue, B. miRNA-223-3p regulates NLRP3 to promote apoptosis and inhibit proliferation of hep3B cells. Exp. Ther. Med. 2018, 15, 2429–2435. [Google Scholar] [CrossRef]
- Shi, M.; Lu, Q.; Zhao, Y.; Ding, Z.; Yu, S.; Li, J.; Ji, M.; Fan, H.; Hou, S. miR-223: A key regulator of pulmonary inflammation. Front. Med. 2023, 10, 1187557. [Google Scholar] [CrossRef]
- Zheng, Q.; Hua, C.; Liang, Q.; Cheng, H. The NLRP3 inflammasome in viral infection (Review). Mol. Med. Rep. 2023, 28, 160. [Google Scholar] [CrossRef] [PubMed]
- Peng, Q.; Yin, R.; Zhu, X.; Jin, L.; Wang, J.; Pan, X.; Ma, A. miR-155 activates the NLRP3 inflammasome by regulating the MEK/ERK/NF-kappaB pathway in carotid atherosclerotic plaques in ApoE(-/-) mice. J. Physiol. Biochem. 2022, 78, 365–375. [Google Scholar] [CrossRef]
- Sanada, T.; Sano, T.; Sotomaru, Y.; Alshargabi, R.; Yamawaki, Y.; Yamashita, A.; Matsunaga, H.; Iwashita, M.; Shinjo, T.; Kanematsu, T.; et al. Anti-inflammatory effects of miRNA-146a induced in adipose and periodontal tissues. Biochem. Biophys. Rep. 2020, 22, 100757. [Google Scholar] [CrossRef] [PubMed]
- Escoubet-Lozach, L.; Benner, C.; Kaikkonen, M.U.; Lozach, J.; Heinz, S.; Spann, N.J.; Crotti, A.; Stender, J.; Ghisletti, S.; Reichart, D.; et al. Mechanisms establishing TLR4-responsive activation states of inflammatory response genes. PLoS Genet. 2011, 7, e1002401. [Google Scholar] [CrossRef] [PubMed]
- Yuan, K.; Zhang, X.; Lv, L.; Zhang, J.; Liang, W.; Wang, P. Fine-tuning the expression of microRNA-155 controls acetaminophen-induced liver inflammation. Int. Immunopharmacol. 2016, 40, 339–346. [Google Scholar] [CrossRef] [PubMed]
- Sul, O.J.; Sung, Y.B.; Rajasekaran, M.; Ke, K.; Yu, R.; Back, S.H.; Choi, H.S. MicroRNA-155 induces autophagy in osteoclasts by targeting transforming growth factor beta-activated kinase 1-binding protein 2 upon lipopolysaccharide stimulation. Bone 2018, 116, 279–289. [Google Scholar] [CrossRef]
- Yang, B.; Yang, R.; Xu, B.; Fu, J.; Qu, X.; Li, L.; Dai, M.; Tan, C.; Chen, H.; Wang, X. miR-155 and miR-146a collectively regulate meningitic Escherichia coli infection-mediated neuroinflammatory responses. J. Neuroinflammation 2021, 18, 114. [Google Scholar] [CrossRef]
- Blevins, H.M.; Xu, Y.; Biby, S.; Zhang, S. The NLRP3 Inflammasome Pathway: A Review of Mechanisms and Inhibitors for the Treatment of Inflammatory Diseases. Front. Aging Neurosci. 2022, 14, 879021. [Google Scholar] [CrossRef]
- Fitzner, A.; Kesy, A.; Bulenger, K.; Niedbalski, W. Evidence of independent introductions of RHDV2 strains in Poland based on the genome analysis of viral isolates from 2016–2018. Acta Biochim. Pol. 2021, 68, 255–263. [Google Scholar] [CrossRef]
- Regulation of the Minister of Agriculture and Rural Development of 10 March 2006 on Detailed Conditions for Maintenance of Laboratory Animals in Experimental Units and Breeding Units. Available online: https://leap.unep.org/countries/pl/national-legislation/regulation-detailed-conditions-keeping-laboratory-animals (accessed on 25 July 2024).
- Percie du Sert, N.; Ahluwalia, A.; Alam, S.; Avey, M.T.; Baker, M.; Browne, W.J.; Clark, A.; Cuthill, I.C.; Dirnagl, U.; Emerson, M.; et al. Reporting animal research: Explanation and elaboration for the ARRIVE guidelines 2.0. PLoS Biol. 2020, 18, e3000411. [Google Scholar] [CrossRef]
- Percie du Sert, N.; Hurst, V.; Ahluwalia, A.; Alam, S.; Avey, M.T.; Baker, M.; Browne, W.J.; Clark, A.; Cuthill, I.C.; Dirnagl, U.; et al. The ARRIVE guidelines 2.0: Updated guidelines for reporting animal research. PLoS Biol. 2020, 18, e3000410. [Google Scholar] [CrossRef]
- Chou, C.H.; Shrestha, S.; Yang, C.D.; Chang, N.W.; Lin, Y.L.; Liao, K.W.; Huang, W.C.; Sun, T.H.; Tu, S.J.; Lee, W.H.; et al. miRTarBase update 2018: A resource for experimentally validated microRNA-target interactions. Nucleic Acids Res. 2018, 46, D296–D302. [Google Scholar] [CrossRef]
- Chen, Y.; Wang, X. miRDB: An online database for prediction of functional microRNA targets. Nucleic Acids Res. 2020, 48, D127–D131. [Google Scholar] [CrossRef] [PubMed]
- Ashburner, M.; Ball, C.A.; Blake, J.A.; Botstein, D.; Butler, H.; Cherry, J.M.; Davis, A.P.; Dolinski, K.; Dwight, S.S.; Eppig, J.T.; et al. Gene ontology: Tool for the unification of biology. The Gene Ontology Consortium. Nat. Genet. 2000, 25, 25–29. [Google Scholar] [CrossRef] [PubMed]
- Agarwal, V.; Bell, G.W.; Nam, J.W.; Bartel, D.P. Predicting effective microRNA target sites in mammalian mRNAs. Elife 2015, 4, e05005. [Google Scholar] [CrossRef] [PubMed]
- Tang, B.; Xiao, B.; Liu, Z.; Li, N.; Zhu, E.D.; Li, B.S.; Xie, Q.H.; Zhuang, Y.; Zou, Q.M.; Mao, X.H. Identification of MyD88 as a novel target of miR-155, involved in negative regulation of Helicobacter pylori-induced inflammation. FEBS Lett. 2010, 584, 1481–1486. [Google Scholar] [CrossRef]
- Bandyopadhyay, S.; Long, M.E.; Allen, L.A. Differential expression of microRNAs in Francisella tularensis-infected human macrophages: miR-155-dependent downregulation of MyD88 inhibits the inflammatory response. PLoS ONE 2014, 9, e109525. [Google Scholar] [CrossRef]
- Imaizumi, T.; Tanaka, H.; Tajima, A.; Yokono, Y.; Matsumiya, T.; Yoshida, H.; Tsuruga, K.; Aizawa-Yashiro, T.; Hayakari, R.; Inoue, I.; et al. IFN-gamma and TNF-alpha synergistically induce microRNA-155 which regulates TAB2/IP-10 expression in human mesangial cells. Am. J. Nephrol. 2010, 32, 462–468. [Google Scholar] [CrossRef]
- Zhou, H.; Huang, X.; Cui, H.; Luo, X.; Tang, Y.; Chen, S.; Wu, L.; Shen, N. miR-155 and its star-form partner miR-155* cooperatively regulate type I interferon production by human plasmacytoid dendritic cells. Blood 2010, 116, 5885–5894. [Google Scholar] [CrossRef]
- Wei, T.T.; Cheng, Z.; Hu, Z.D.; Zhou, L.; Zhong, R.Q. Upregulated miR-155 inhibits inflammatory response induced by C. albicans in human monocytes derived dendritic cells via targeting p65 and BCL-10. Ann. Transl. Med. 2019, 7, 758. [Google Scholar] [CrossRef]
- Shen, S.M.; Jiang, H.; Zhao, J.N.; Shi, Y. Down-regulation of miR-155 inhibits inflammatory response in human pulmonary microvascular endothelial cells infected with influenza A virus by targeting sphingosine-1-phosphate receptor 1. Chin. Med. J. 2020, 133, 2429–2436. [Google Scholar] [CrossRef] [PubMed]
- Zhang, X.; Guo, Y.; Xu, X.; Tang, T.; Sun, L.; Wang, H.; Zhou, W.; Fang, L.; Li, Q.; Xie, P. miR-146a promotes Borna disease virus 1 replication through IRAK1/TRAF6/NF-kappaB signaling pathway. Virus Res. 2019, 271, 197671. [Google Scholar] [CrossRef] [PubMed]
- Li, T.; Morgan, M.J.; Choksi, S.; Zhang, Y.; Kim, Y.S.; Liu, Z.G. MicroRNAs modulate the noncanonical transcription factor NF-kappaB pathway by regulating expression of the kinase IKKalpha during macrophage differentiation. Nat. Immunol. 2010, 11, 799–805. [Google Scholar] [CrossRef] [PubMed]
- Bauernfeind, F.; Rieger, A.; Schildberg, F.A.; Knolle, P.A.; Schmid-Burgk, J.L.; Hornung, V. NLRP3 inflammasome activity is negatively controlled by miR-223. J. Immunol. 2012, 189, 4175–4181. [Google Scholar] [CrossRef]
- Ma, X.; Tian, D.; Lv, W.; Gao, B.; Ma, Z.; Zheng, X. Anti-inflammatory effects of microRNA-223 on sepsis-induced lung injury in rats by targeting the Toll-like receptor signaling pathway. Exp. Ther. Med. 2021, 22, 964. [Google Scholar] [CrossRef] [PubMed]
- Peng, C.; Wang, H.; Zhang, W.J.; Jie, S.H.; Tong, Q.X.; Lu, M.J.; Yang, D.L. Inhibitory effect of miR-125b on hepatitis C virus core protein-induced TLR2/MyD88 signaling in THP-1 cells. World J. Gastroenterol. 2016, 22, 4354–4361. [Google Scholar] [CrossRef]
- Primer-BLAST. Computational Tools for Online. Available online: https://www.ncbi.nlm.nih.gov/tools/primer-blast/ (accessed on 25 July 2024).
- Beacon-Designer. Computationaly Tools for Online. Available online: http://www.premierbiosoft.com/qOligo/Oligo.jsp?PID=1 (accessed on 25 July 2024).


| Tissues | Proinflammatory Cytokines Determined at the mRNA Level | |||
|---|---|---|---|---|
| Gene | IL-1β | IL-6 | TNF-α | IL-18 |
| Liver | ||||
| Control vs. GI.1 | ↓ ×3.6 | ↑ ×8.0 | ↑ ×5.7 | ↓ ×46.8 |
| Control vs. GI.2 | ↓ ×3.1 | ↑ ×6.8 | = | ↓ ×31.0 |
| GI.1 vs. GI.2 | = | = | ↑ ×6.4 | = |
| Lung | ||||
| Control vs. GI.1 | ↑ ×3.1 | ↑ ×7.7 | ↑ ×3.1 | = |
| Control vs. GI.2 | ↑ ×6.7 | ↑ ×12.3 | ↑ ×2.4 | = |
| GI.1 vs. GI.2 | = | = | = | = |
| Kidney | ||||
| Control vs. GI.1 | ↓ ×3.6 | ↑ ×8.5 | = | ↓ ×27.5 |
| Control vs. GI.2 | ↓ ×2.0 | ↑ ×261.0 | = | ↓ ×3.3 |
| GI.1 vs. GI.2 | = | ↓ ×30.0 | ↓ ×2.1 | ↓ ×8.3 |
| Spleen | ||||
| Control vs. GI.1 | ↓ ×5.5 | ↑ ×997.0 | ↑ ×1.9 | ↓ ×3.0 |
| Control vs. GI.2 | ↓ ×1.9 | ↑ ×282.0 | = | ↓ ×5.1 |
| GI.1 vs. GI.2 | ↑ ×5.2 | = | = | ↑ ×1.7 |
| miRs | Target Genes | Gene Product | Reference Used to Select Target Gene |
|---|---|---|---|
| miR-155 | MyD88 | Myeloid differentiation primary response protein MyD88 | [46,88,89] |
| TAB2 | TGF-beta-activated kinase 1 and MAP3K7-binding protein 2 | [46,90,91] | |
| p65 (subunit of NF-κβ) | Transcription factor p65 | [46,92,93] | |
| NLRP3 inflammasome | NACHT, LRR, and PYD domains containing protein 3 | [46] | |
| miR-146a | IRAK1 | Interleukin-1 receptor-associated kinase 1 | [25,46,94] |
| TRAF6 | TNF receptor-associated factor 6 | [25,46,94] | |
| miR-223 | TLR4 | Toll-like receptor 4 | [46,68,95] |
| IKKα | Inhibitor of nuclear factor kappa-B kinase subunit alpha | [46,67,96] | |
| NLRP3 | NACHT, LRR, and PYD domains-containing protein 3 | [46,97] | |
| miR-125b | MyD88 | Myeloid differentiation primary response protein MyD88 | [50,98] |
| miRs | Sequences |
|---|---|
| miRs tested | |
| ocu-miR-155-5p | 5′UUAAUGCUAAUCGUGAUAGGGGUU3′ |
| ocu-miR-146a-5p | 5′UGAGAACUGAAUUCCAUGGGUUG3′ |
| ocu-miR-223-5p | 5′CGUGUAUUUGACAAGCUGAGUUG3′ |
| ocu-miR-125b-5p | 5′UCCCUGAGACCCUAACUUGUGA3′ |
| reference miRs | |
| ocu-miR-103a-3p | 5′AGCAGCAUUGUACAGGGCUAUGA3′ |
| Gene | GenBank Accession No. | Primers | Ta (°C) | Amplicon Length (bp) | Tm of the Amplification Products (°C) | |
|---|---|---|---|---|---|---|
| MyD88 | XM_002723869.4 | Forward Revers | 5′-CCCCAGCGACATGCAGTTTG-3′ 5′-TTCTGATGGGCACCTGGAGAG-3′ | 61 | 227 | 90.8 |
| TAB2 | XM_051836813.1 | Forward Revers | 5′-ACCTCCAGCAGTTCCTCTTC-3′ 5′-TCATCTCCTGTGGTGGCATT-3′ | 60 | 152 | 83.5 |
| p65 | XM_051827970.1 | Forward Revers | 5′-CCCTTCCAAGTGCCCATAGA-3′ 5′-CCTCTTTCTGCACCTTGTCG-3′ | 60 | 250 | 91.5 |
| NLRP3 | MK829787.1 | Forward Revers | 5′-TGTCTCACGTCCAGCTTTTG-3′ 5′-AGCCAGAGTCTGCGAATGTT-3′ | 60 | 161 | 87.5 |
| IRAK1 | XM_051837494.1 | Forward Revers | 5′-GGACTTTGCTGGCTACTGTG-3′ 5′-CAGGAGGACGTTGGAACTCT-3′ | 60 | 229 | 89.9 |
| TRAF6 | XM_002709054.4 | Forward Revers | 5′-ACGGGGAACCTTTCTGGCTC-3′ 5′-TGTGGCCTGCATCCCTTATTG-3′ | 61 | 187 | 86.4 |
| TLR4 | NM_001082732.2 | Forward Revers | 5′-TTTCACACGGCCACTGCTG-3′ 5′-ATTGGGAACGACCTCCACAC-3′ | 61 | 142 | 81.4 |
| IKKα | XM_002718612.4 | Forward Revers | 5′-GGTAACTCCTCAAGATGGGGAC-3′ 5′-TGCCCTGTTCCTCATTTGCT-3′ | 60 | 107 | 78.7 |
| IL-1β | NM_001082201.1 | Forward Revers | 5′-GGTGTTGTCTGGCACGTATG-3′ 5′-TTGGGGTCTACACTCTCCAG-3′ | 60 | 210 | 84.0 |
| IL-6 | NM_001082064.2 | Forward Revers | 5′-GGCGGTGAATAATGAGACCTG-3′ 5′-ATGAAGTGGATCGTGGTCGT-3′ | 60 | 276 | 87.3 |
| TNF-α | NM_001082263.1 | Forward Revers | 5′-CGTAGTAGCAAACCCGCAAG-3′ 5′-TGATGGCAGAGAGGAGGTTG-3′ | 60 | 245 | 91.3 |
| IL-18 | NM_001122940.1 | Forward Revers | 5′-TGTATAGAAAATGCACCCCAGAC-3′ 5′-TCTTTCTGTCCTGCGAGATGT-3′ | 60 | 221 | 80.0 |
| 18S | NR_033238.1 | Forward Revers | 5′-ATCAGATACCGTCGTAGTTC-3′ 5′-TTCCGTCAATTCCTTTAAG-3′ | 60 | 167 | 88.0 |
Disclaimer/Publisher’s Note: The statements, opinions and data contained in all publications are solely those of the individual author(s) and contributor(s) and not of MDPI and/or the editor(s). MDPI and/or the editor(s) disclaim responsibility for any injury to people or property resulting from any ideas, methods, instructions or products referred to in the content. |
© 2024 by the authors. Licensee MDPI, Basel, Switzerland. This article is an open access article distributed under the terms and conditions of the Creative Commons Attribution (CC BY) license (https://creativecommons.org/licenses/by/4.0/).
Share and Cite
Ostrycharz-Jasek, E.; Fitzner, A.; Siennicka, A.; Budkowska, M.; Hukowska-Szematowicz, B. MicroRNAs Regulate the Expression of Genes Related to the Innate Immune and Inflammatory Response in Rabbits Infected with Lagovirus europaeus GI.1 and GI.2 Genotypes. Int. J. Mol. Sci. 2024, 25, 9531. https://doi.org/10.3390/ijms25179531
Ostrycharz-Jasek E, Fitzner A, Siennicka A, Budkowska M, Hukowska-Szematowicz B. MicroRNAs Regulate the Expression of Genes Related to the Innate Immune and Inflammatory Response in Rabbits Infected with Lagovirus europaeus GI.1 and GI.2 Genotypes. International Journal of Molecular Sciences. 2024; 25(17):9531. https://doi.org/10.3390/ijms25179531
Chicago/Turabian StyleOstrycharz-Jasek, Ewa, Andrzej Fitzner, Aldona Siennicka, Marta Budkowska, and Beata Hukowska-Szematowicz. 2024. "MicroRNAs Regulate the Expression of Genes Related to the Innate Immune and Inflammatory Response in Rabbits Infected with Lagovirus europaeus GI.1 and GI.2 Genotypes" International Journal of Molecular Sciences 25, no. 17: 9531. https://doi.org/10.3390/ijms25179531