
Raman Spectroscopy of Optically Trapped Living Human T Cell Subsets and Monocytes

 ,
,  and
and
Abstract
:1. Introduction
2. Results
3. Discussion
4. Materials and Methods
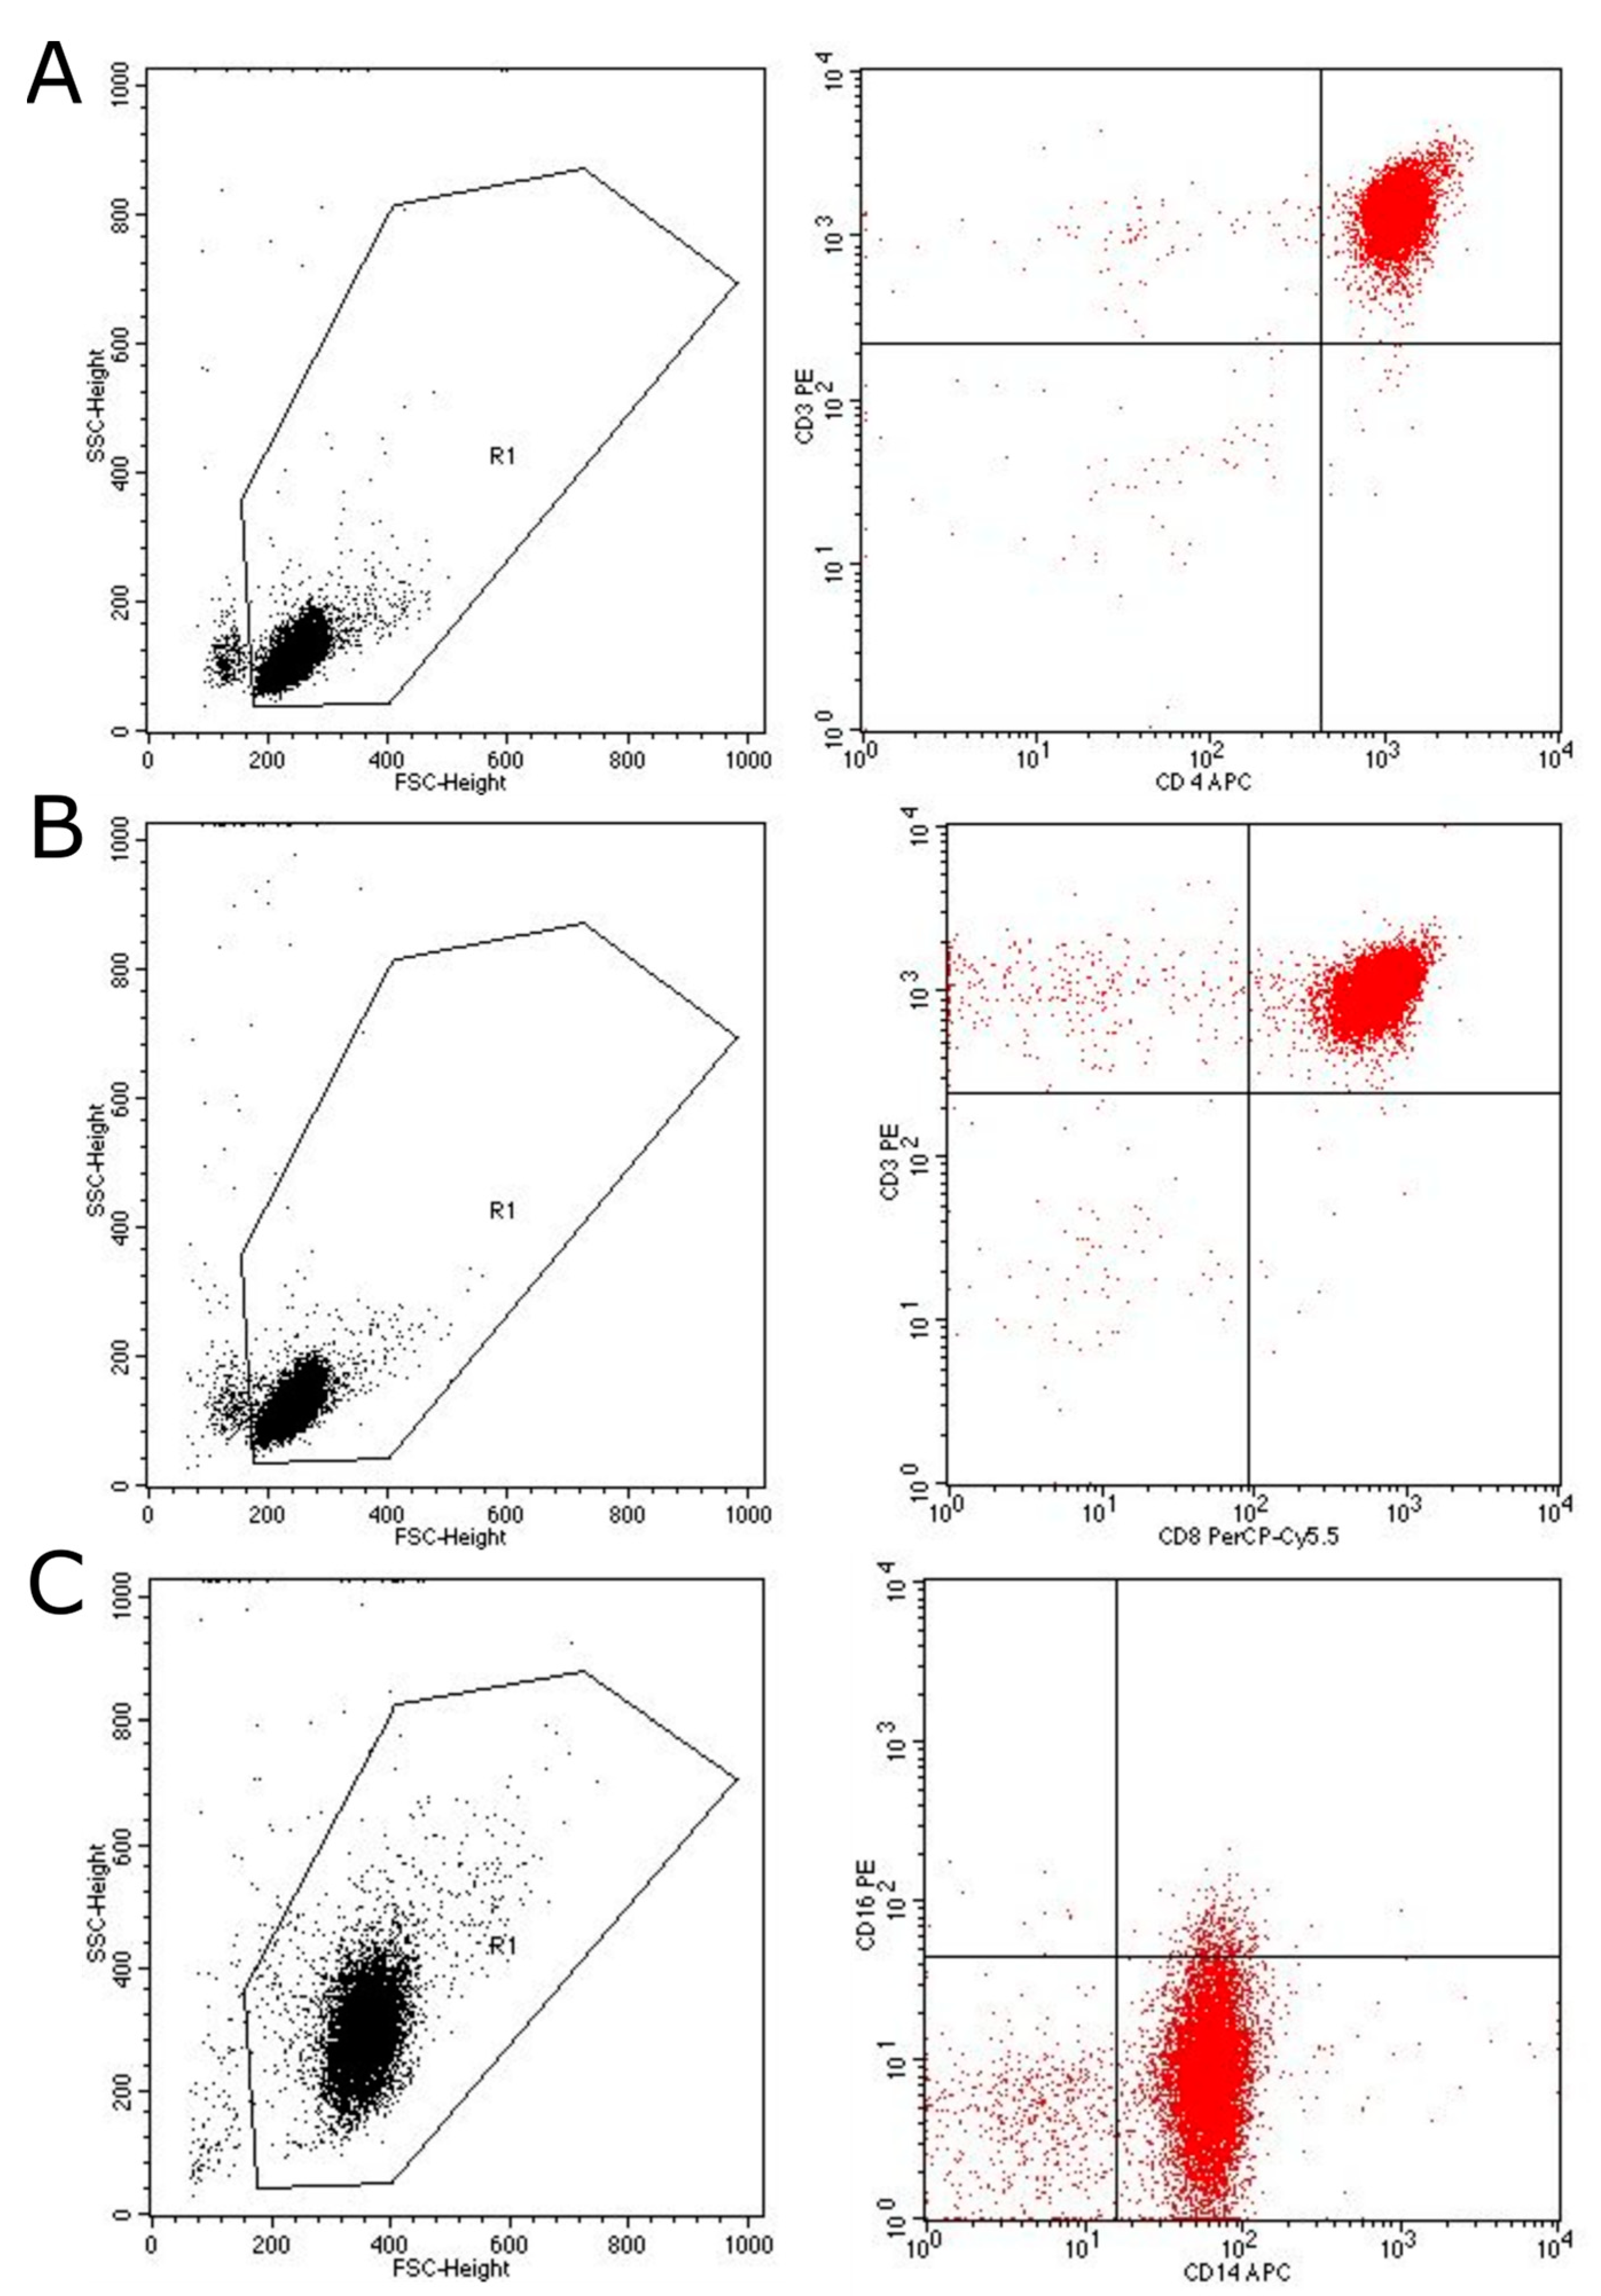
4.1. Cell Preparation
4.2. Raman Spectroscopy
4.3. Data Analysis
Author Contributions
Funding
Institutional Review Board Statement
Informed Consent Statement
Data Availability Statement
Conflicts of Interest
Appendix A

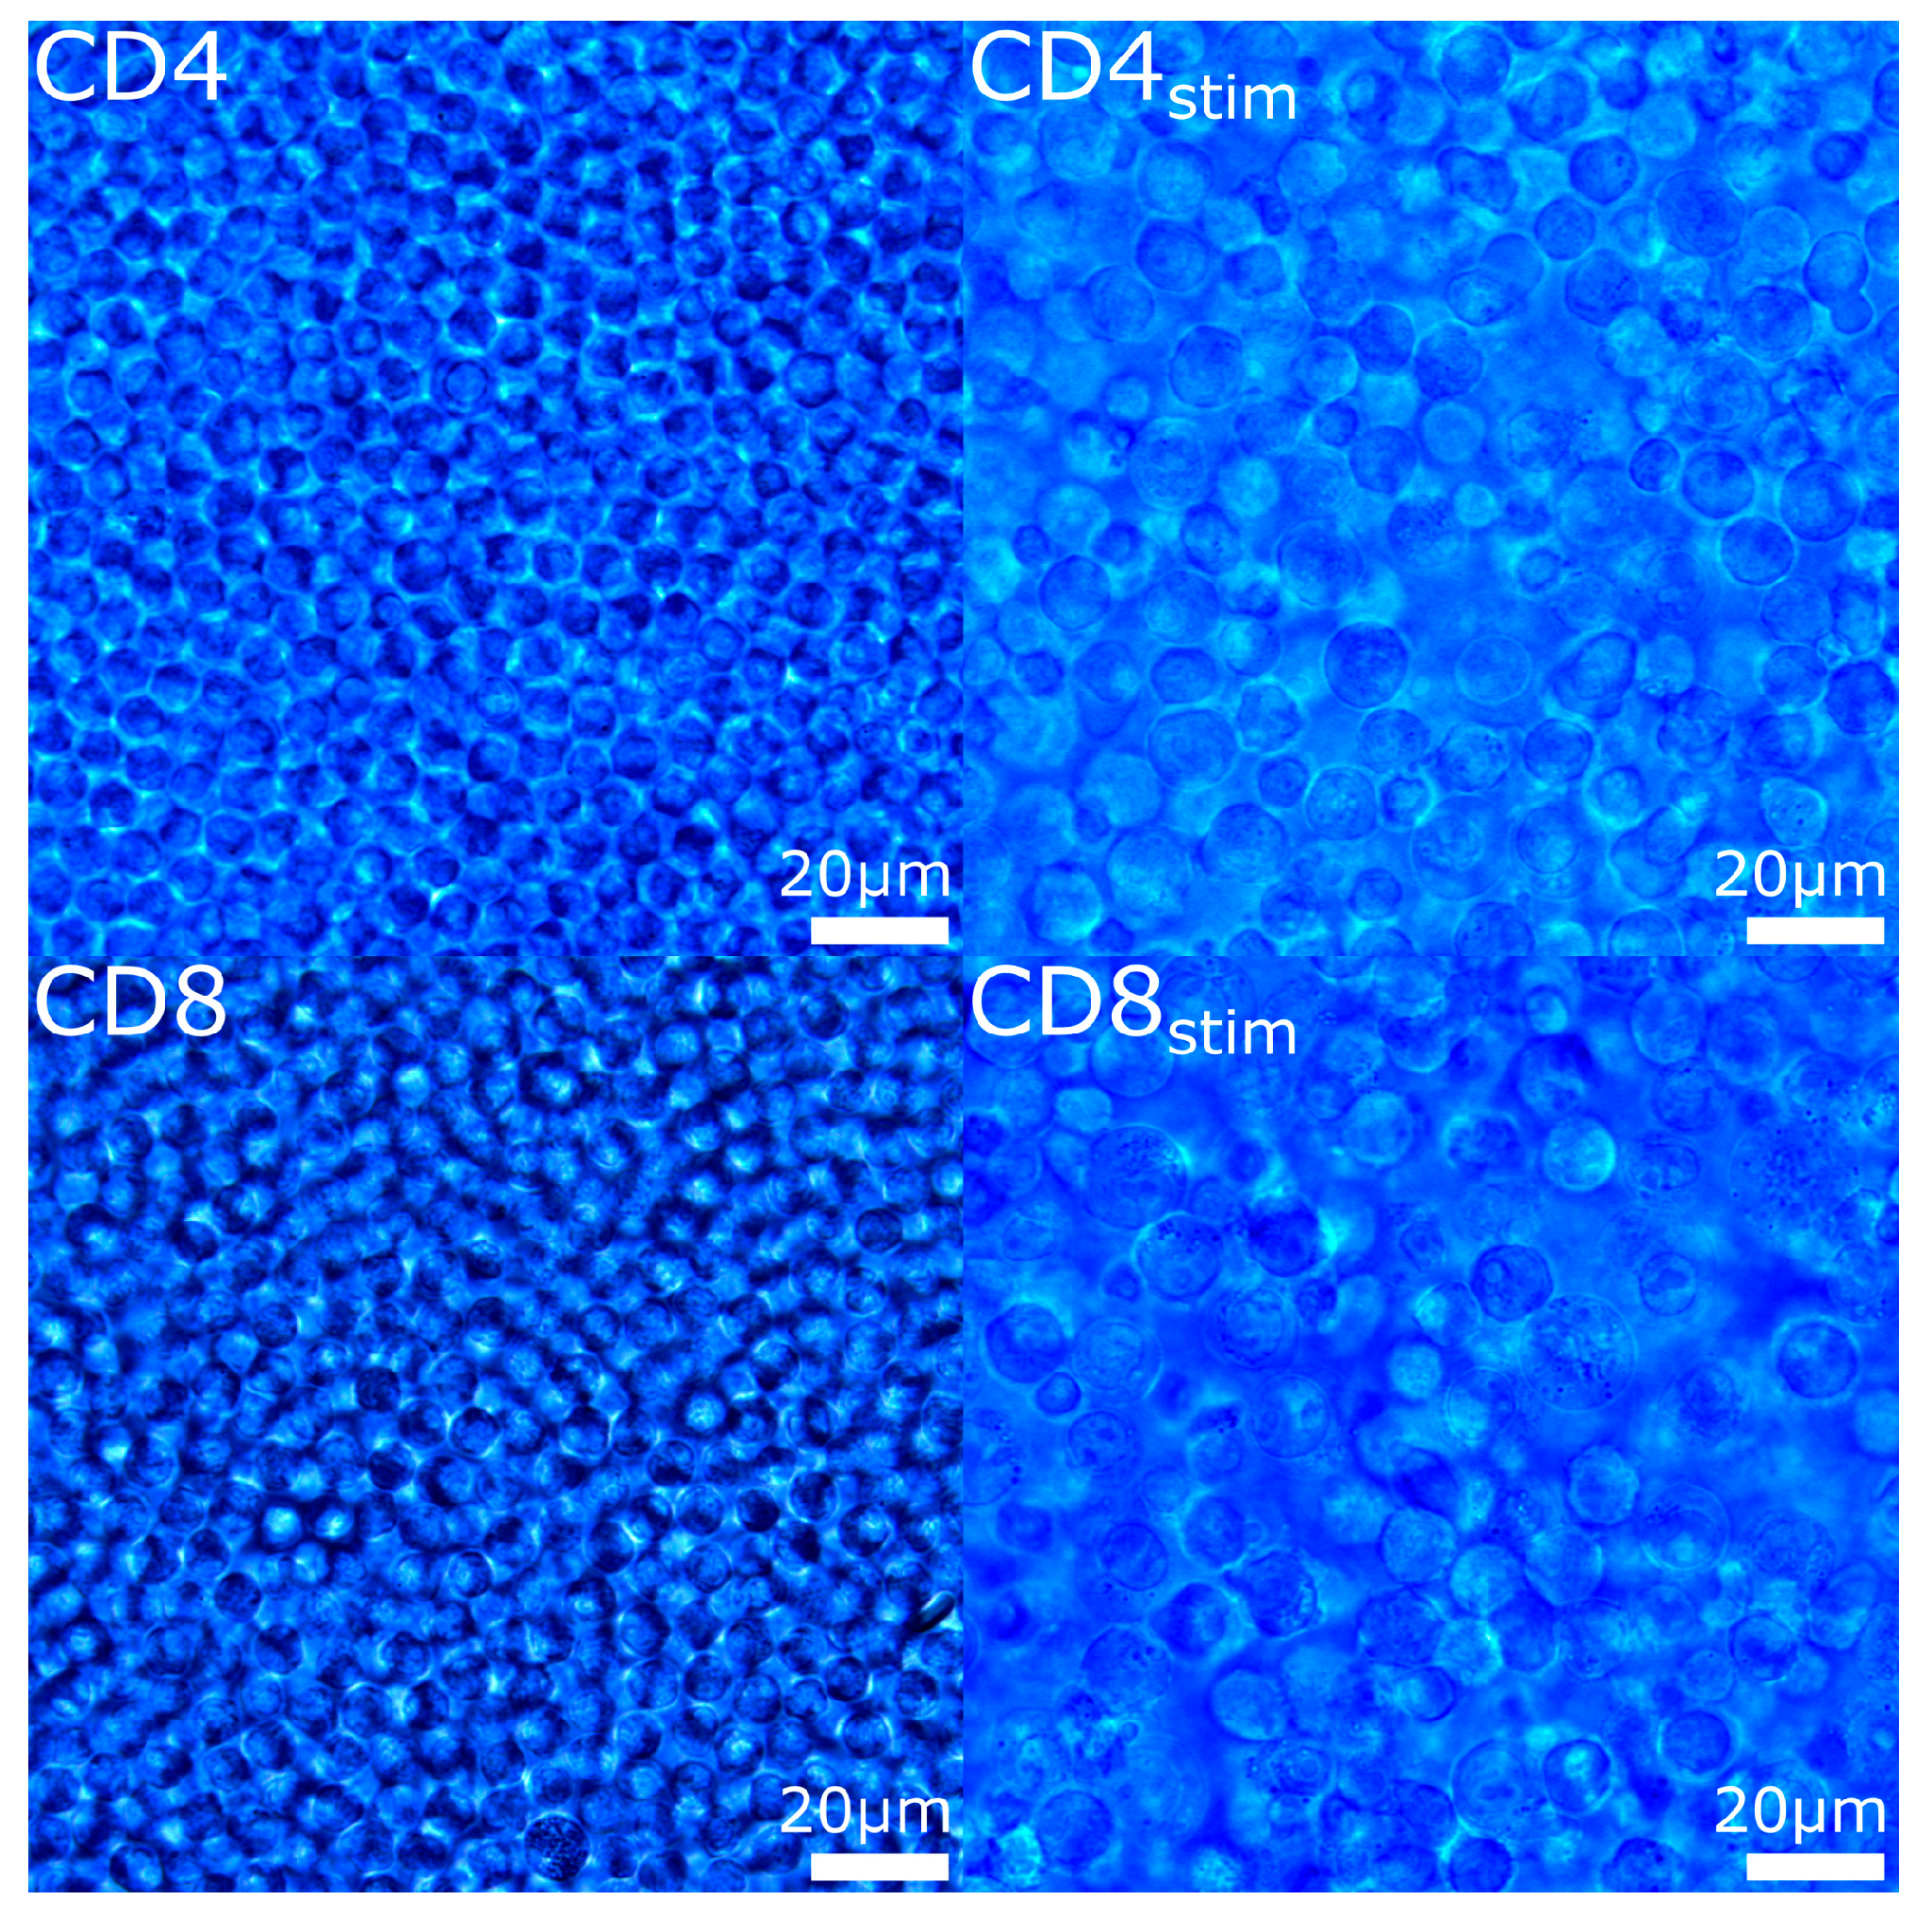
| Cell Type | Diameter (Mean ± SD, µm) |
|---|---|
| CD4 | 6.6 ± 0.5 |
| CD4stim | 10.9 ± 1.4 |
| CD8 | 6.8 ± 0.6 |
| CD8stim | 11.3 ± 2.2 |
| Mono | 8.5 ± 0.4 |


References
- Ralbovsky, N.M.; Lednev, I.K. Towards development of a novel universal medical diagnostic method: Raman spectroscopy and machine learning. Chem. Soc. Rev. 2020, 49, 7428–7453. [Google Scholar] [CrossRef]
- Ember, K.J.I.; Hoeve, M.A.; McAughtrie, S.L.; Bergholt, M.S.; Dwyer, B.J.; Stevens, M.M.; Faulds, K.; Forbes, S.J.; Campbell, C.J. Raman spectroscopy and regenerative medicine: A review. npj Regen. Med. 2017, 2, 12. [Google Scholar] [CrossRef] [PubMed]
- Auner, G.W.; Koya, S.K.; Huang, C.; Broadbent, B.; Trexler, M.; Auner, Z.; Elias, A.; Mehne, K.C.; Brusatori, M.A. Applications of Raman spectroscopy in cancer diagnosis. Cancer Metastasis Rev. 2018, 37, 691–717. [Google Scholar] [CrossRef] [PubMed]
- Wolthuis, R.; van Aken, M.; Fountas, K.; Robinson, J.S., Jr.; Bruining, H.A.; Puppels, G.J. Determination of Water Concentration in Brain Tissue by Raman Spectroscopy. Anal. Chem. 2001, 73, 3915–3920. [Google Scholar] [CrossRef]
- Cutshaw, G.; Uthaman, S.; Hassan, N.; Kothadiya, S.; Wen, X.; Bardhan, R. The Emerging Role of Raman Spectroscopy as an Omics Approach for Metabolic Profiling and Biomarker Detection toward Precision Medicine. Chem. Rev. 2023, 123, 8297–8346. [Google Scholar] [CrossRef]
- Ribeiro, A.R.B.; Silva, E.C.O.; Araújo, P.M.C.; Souza, S.T.; da Silva Fonseca, E.J.; Barreto, E. Application of Raman spectroscopy for characterization of the functional polarization of macrophages into M1 and M2 cells. Spectrochim. Acta—Part A Mol. Biomol. Spectrosc. 2022, 265, 120328. [Google Scholar] [CrossRef] [PubMed]
- Fore, S.; Chan, J.; Taylor, D.; Huser, T. Raman spectroscopy of individual monocytes reveals that single-beam optical trapping of mononuclear cells occurs by their nucleus. J. Opt. 2011, 13, 044021. [Google Scholar] [CrossRef]
- Chen, M.; McReynolds, N.; Campbell, E.C.; Mazilu, M.; Barbosa, J.; Dholakia, K.; Powis, S.J. The Use of Wavelength Modulated Raman Spectroscopy in Label-Free Identification of T Lymphocyte Subsets, Natural Killer Cells and Dendritic Cells. PLoS ONE 2015, 10, e0125158. [Google Scholar] [CrossRef]
- Hobro, A.J.; Kumagai, Y.; Akira, S.; Smith, N.I. Raman spectroscopy as a tool for label-free lymphocyte cell line discrimination. Analyst 2016, 141, 3756–3764. [Google Scholar] [CrossRef]
- Chaudhary, N.; Nguyen, T.N.Q.; Cullen, D.; Meade, A.D.; Wynne, C. Discrimination of immune cell activation using Raman micro-spectroscopy in an in-vitro & ex-vivo model. Spectrochim. Acta Part A Mol. Biomol. Spectrosc. 2021, 248, 119118. [Google Scholar] [CrossRef]
- Brown, K.L.; Palyvoda, O.Y.; Thakur, J.S.; Nehlsen-Cannarella, S.L.; Fagoaga, O.R.; Gruber, S.A.; Auner, G.W. Differentiation of alloreactive versus CD3/CD28 stimulated T-lymphocytes using raman spectroscopy: A greater specificity for noninvasive acute renal allograft rejection detection. Cytom. Part A 2009, 75, 917–923. [Google Scholar] [CrossRef]
- Ichimura, T.; Chiu, L.; Fujita, K.; Machiyama, H.; Yamaguchi, T.; Watanabe, T.M.; Fujita, H. Non-label immune cell state prediction using Raman spectroscopy. Sci. Rep. 2016, 6, 37562. [Google Scholar] [CrossRef] [PubMed]
- Pavillon, N.; Smith, N.I. Non-invasive monitoring of T cell differentiation through Raman spectroscopy. Sci. Rep. 2023, 13, 3129. [Google Scholar] [CrossRef] [PubMed]
- Trickett, A.; Kwan, Y.L. T cell stimulation and expansion using anti-CD3/CD28 beads. J. Immunol. Methods 2003, 275, 251–255. [Google Scholar] [CrossRef]
- Attfield, K.E.; Jensen, L.T.; Kaufmann, M.; Friese, M.A.; Fugger, L. The immunology of multiple sclerosis. Nat. Rev. Immunol. 2022, 22, 734–750. [Google Scholar] [CrossRef] [PubMed]
- Chan, J.; Fore, S.; Wachsmann-Hogiu, S.; Huser, T. Raman spectroscopy and microscopy of individual cells and cellular components. Laser Photonics Rev. 2008, 2, 325–349. [Google Scholar] [CrossRef]
- Xie, C.; Li, Y.Q. Confocal micro-Raman spectroscopy of single biological cells using optical trapping and shifted excitation difference techniques. J. Appl. Phys. 2003, 93, 2982–2986. [Google Scholar] [CrossRef]
- Movasaghi, Z.; Rehman, S.; Rehman, I.U. Raman spectroscopy of biological tissues. Appl. Spectrosc. Rev. 2007, 42, 493–541. [Google Scholar] [CrossRef]
- Perney, N.M.B.; Horak, P.; Hanley, N.A.; Melvin, T. The self-orientation of mammalian cells in optical tweezers-the importance of the nucleus. Phys. Biol. 2012, 9, 024001. [Google Scholar] [CrossRef]
- Jess, P.R.T.; Garcés-Chávez, V.; Smith, D.; Mazilu, M.; Paterson, L.; Riches, A.; Herrington, C.S.; Sibbett, W.; Dholakia, K. Dual beam fibre trap for Raman micro-spectroscopy of single cells. Opt. Express 2006, 14, 5779. [Google Scholar] [CrossRef]
- Kann, B.; Teubl, B.J.; Roblegg, E.; Windbergs, M. Label-free in vitro visualization of particle uptake into human oral buccal epithelial cells by confocal Raman microscopy. Analyst 2014, 139, 5069–5074. [Google Scholar] [CrossRef] [PubMed]
- Miltenyi Biotec B.V. & Co., KG. Classical Monocyte Isolation Kit, Human. 2022. Available online: https://www.miltenyibiotec.com/DE-en/products/classical-monocyte-isolation-kit-human.html (accessed on 25 February 2022).
- Miltenyi Biotec B.V. & Co., KG. CD4+ T Cell Isolation Kit, Human. 2022. Available online: https://www.miltenyibiotec.com/US-en/products/cd4-t-cell-isolation-kit-human.html (accessed on 25 February 2022).
- Miltenyi Biotec B.V. & Co., KG. CD8+ T Cell Isolation Kit, Human. 2022. Available online: https://www.miltenyibiotec.com/DE-en/products/cd8-t-cell-isolation-kit-human.html (accessed on 25 February 2022).
- Jones, R.R.; Hooper, D.C.; Zhang, L.; Wolverson, D.; Valev, V.K. Raman Techniques: Fundamentals and Frontiers. Nanoscale Res. Lett. 2019, 14, 231. [Google Scholar] [CrossRef] [PubMed]
- Pedregosa, F.; Varoquaux, G.; Gramfort, A.; Michel, V.; Thirion, B.; Grisel, O.; Blondel, M.; Prettenhofer, P.; Weiss, R.; Dubourg, V.; et al. Scikit-learn: Machine Learning in Python. J. Mach. Learn. Res. 2011, 12, 2825–2830. [Google Scholar]
- Xu, J.; Yu, T.; Zois, C.E.; Cheng, J.-X.; Tang, Y.; Harris, A.L.; Huang, W.E. Unveiling Cancer Metabolism through Spontaneous and Coherent Raman Spectroscopy and Stable Isotope Probing. Cancers 2021, 13, 1718. [Google Scholar] [CrossRef] [PubMed]
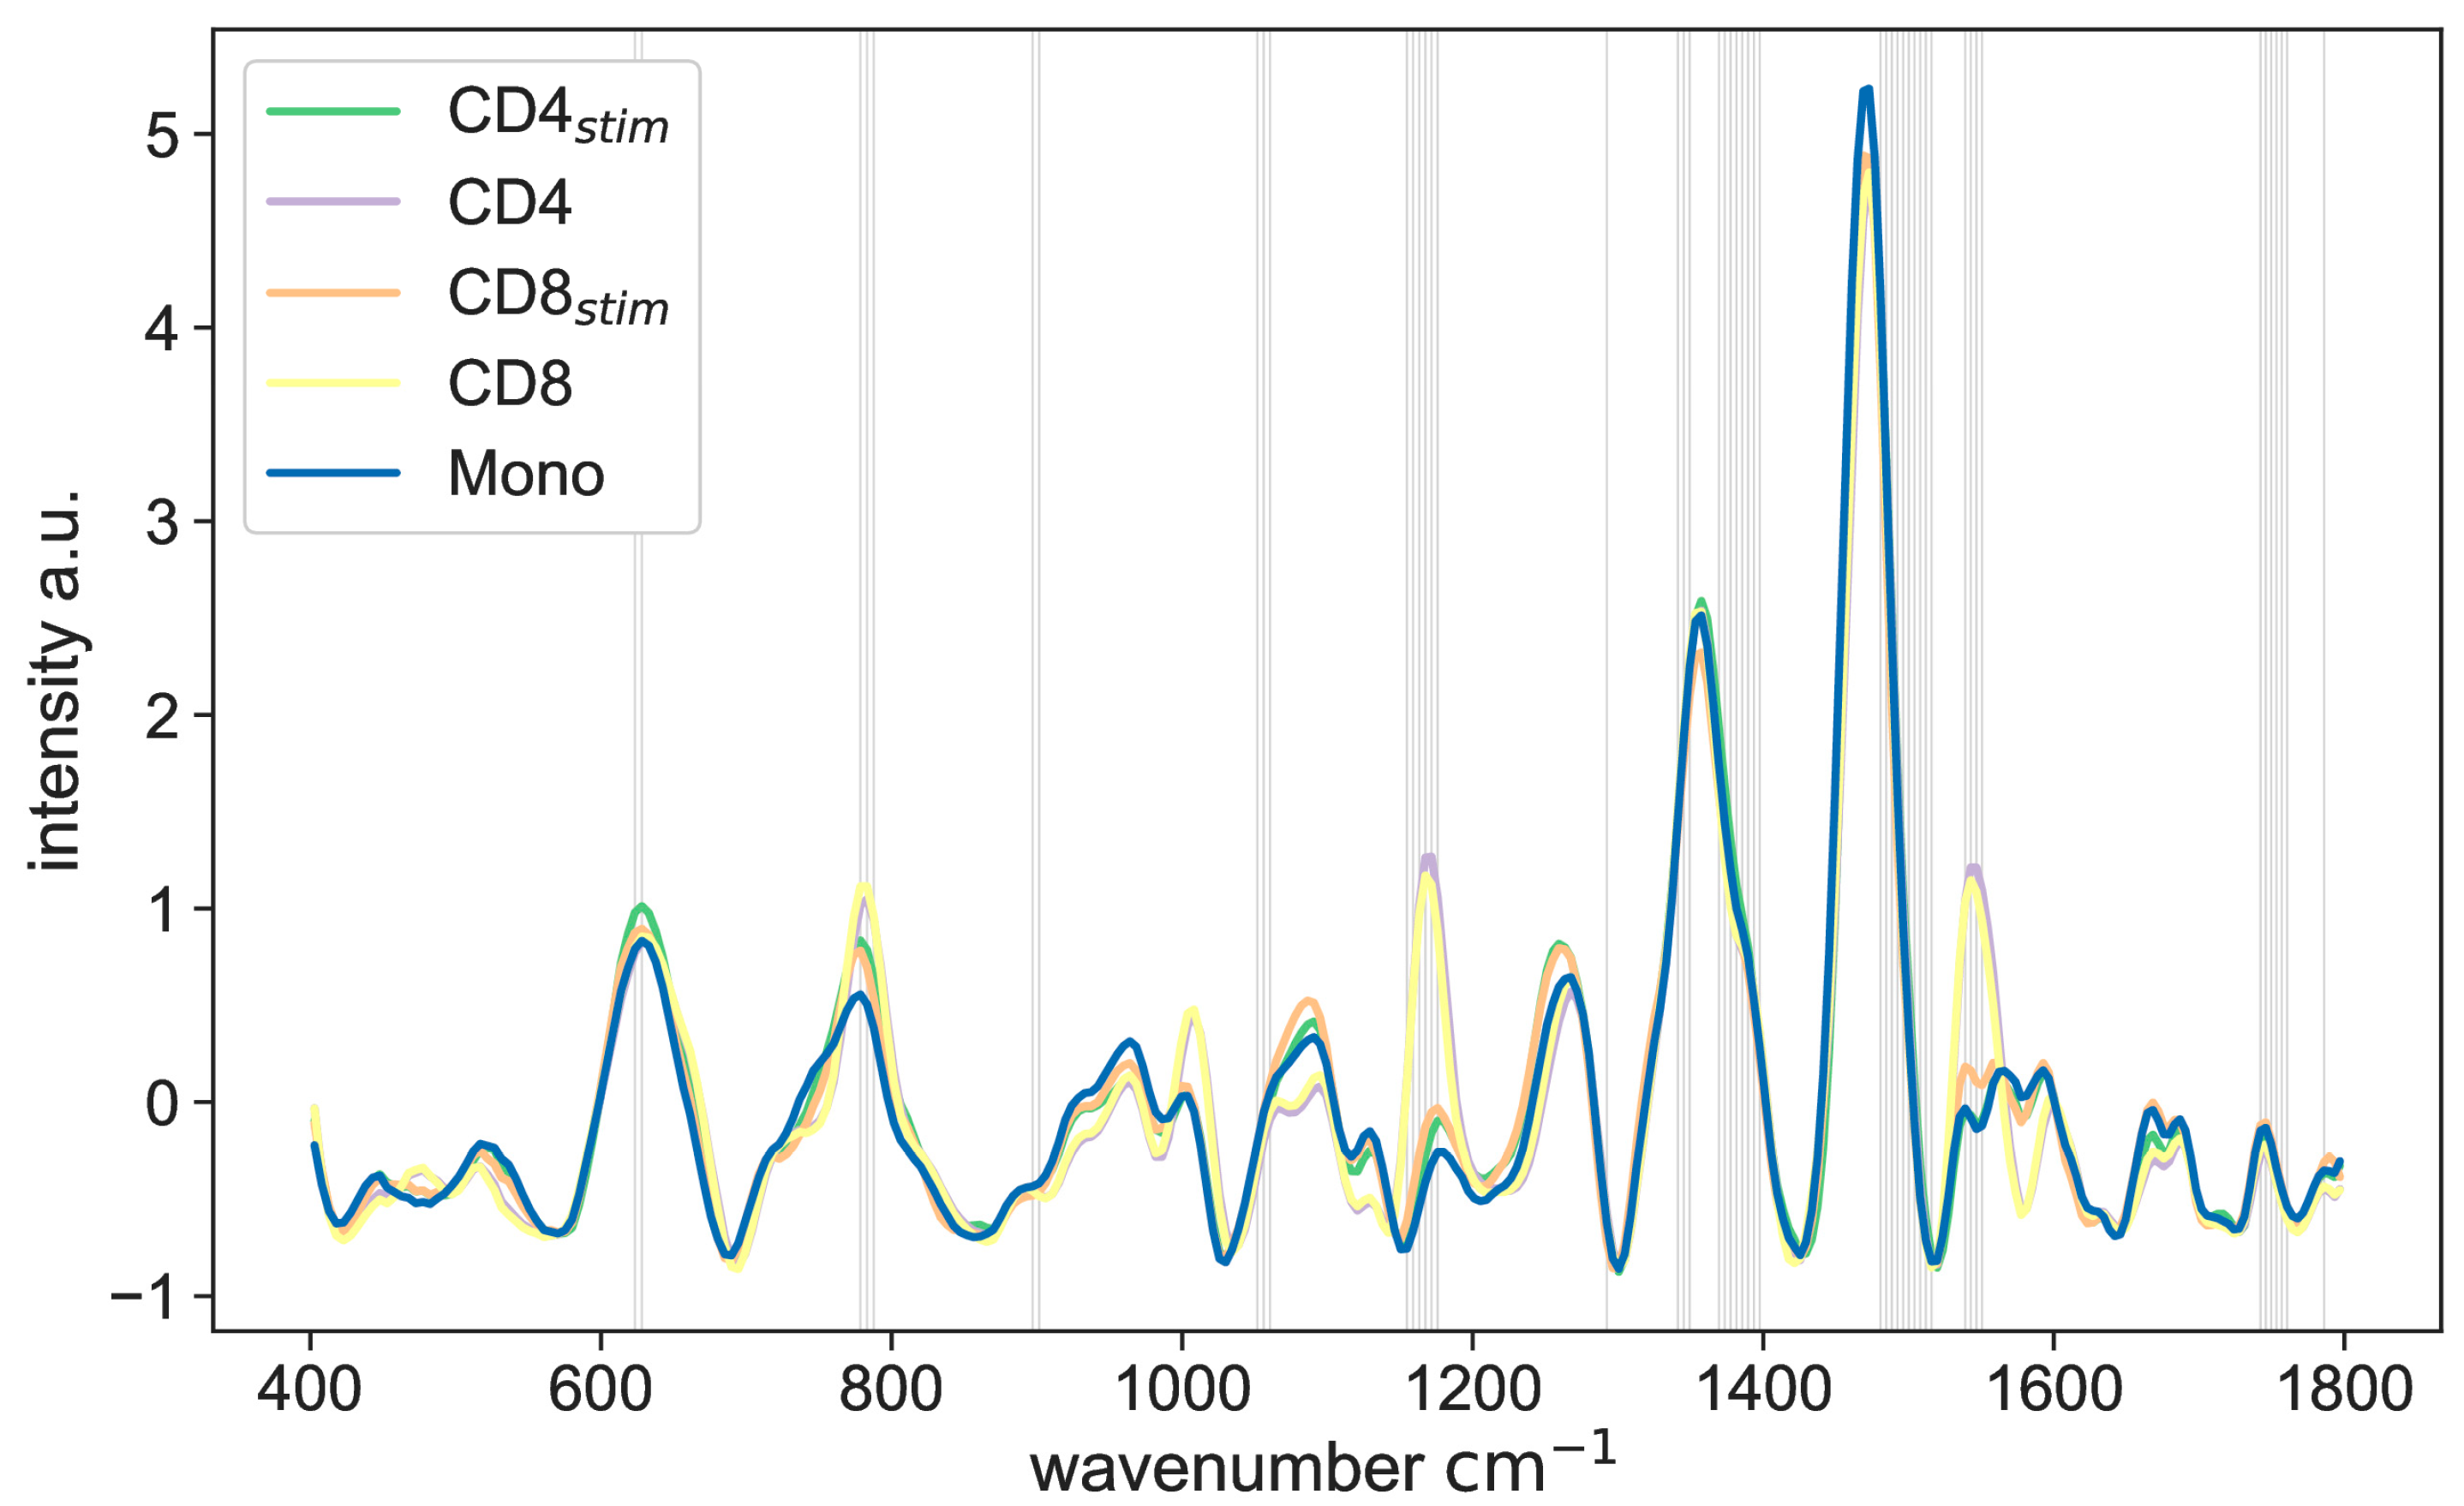


| Compared Cell Types | Accuracy (Mean ± SD) | Approx. Discriminating Bands 1 (cm−1) |
|---|---|---|
| CD4:CD8 | 0.63 ± 0.48 | 1167, 1546, 1445 |
| CD4:CD4stim | 0.92 ± 0.28 | 1163, 1546, 1389 |
| CD8:CD8stim | 0.91 ± 0.29 | 1163, 1546, 628 |
| CD4stim:CD8stim | 0.7 ± 0.46 | 1385, 623, 1457 |
| CD4:Monocytes | 0.96 ± 0.19 | 1167, 1546, 1385 |
| CD8:Monocytes | 0.96 ± 0.19 | 1167, 1546, 1389 |
| CD4stim:Monocytes | 0.83 ± 0.37 | 1385, 1464, 623 |
| CD8stim:Monocytes | 0.82 ± 0.38 | 1385, 623, 1154 |
| Approx. Discriminating Bands (cm−1) | Tentative Assignation (Examples) [18] |
|---|---|
| 1167 | C=N stretching in a quinoid ring, C-H in the plane, Tyrosine, Lipids |
| 1546 | NADH, C6-H deformation mode, Tryptophan, Amide II |
| 1445 | δ (CH2), δ (CH3), phospholipids |
| 1163 | Tyrosine, quinoid ring |
| 1389 | CH rocking, C-N stretching |
| 628 | Glycerol, Methionine |
| 1385 | CH3 band, CH rocking |
| 623 | Proteins |
| 1457 | Deoxyribose, Nucleic acids, proteins |
| Cell Type | Number of Donors | Number of Measured Cells |
|---|---|---|
| CD4 | 16 | 1637 |
| CD8 | 15 | 1687 |
| CD4stim | 9 | 961 |
| CD8stim | 8 | 856 |
| Monocytes | 14 | 1453 |
Disclaimer/Publisher’s Note: The statements, opinions and data contained in all publications are solely those of the individual author(s) and contributor(s) and not of MDPI and/or the editor(s). MDPI and/or the editor(s) disclaim responsibility for any injury to people or property resulting from any ideas, methods, instructions or products referred to in the content. |
© 2024 by the authors. Licensee MDPI, Basel, Switzerland. This article is an open access article distributed under the terms and conditions of the Creative Commons Attribution (CC BY) license (https://creativecommons.org/licenses/by/4.0/).
Share and Cite
Nötzel, M.; Mahamid, M.; Kronstein-Wiedemann, R.; Ziemssen, T.; Akgün, K. Raman Spectroscopy of Optically Trapped Living Human T Cell Subsets and Monocytes. Int. J. Mol. Sci. 2024, 25, 9557. https://doi.org/10.3390/ijms25179557
Nötzel M, Mahamid M, Kronstein-Wiedemann R, Ziemssen T, Akgün K. Raman Spectroscopy of Optically Trapped Living Human T Cell Subsets and Monocytes. International Journal of Molecular Sciences. 2024; 25(17):9557. https://doi.org/10.3390/ijms25179557
Chicago/Turabian StyleNötzel, Martin, Maria Mahamid, Romy Kronstein-Wiedemann, Tjalf Ziemssen, and Katja Akgün. 2024. "Raman Spectroscopy of Optically Trapped Living Human T Cell Subsets and Monocytes" International Journal of Molecular Sciences 25, no. 17: 9557. https://doi.org/10.3390/ijms25179557