Article

Left Ventricular Systolic Dysfunction in NBCe1-B/C-Knockout Mice

1
Department of Physiology and Biophysics, Jacobs School of Medicine and Biomedical Sciences, State University of New York: The University at Buffalo, Buffalo, NY 14203, USA
2
Division of Cardiovascular Medicine and the Clinical and Translational Research Center, State University of New York: University at Buffalo, Buffalo, NY 14203, USA
3
Veterans Affairs Western New York Health Care System, Buffalo, NY 14215, USA
4
Department of Biomedical Engineering, State University of New York: University at Buffalo, Buffalo, NY 14260, USA
5
Department of Pharmacology and Toxicology, State University of New York: University at Buffalo, Buffalo, NY 14203, USA
6
Department of Medicine, State University of New York: University at Buffalo, Buffalo, NY 14203, USA
7
Department of Ophthalmology, Jacobs School of Medicine and Biomedical Sciences, State University of New York: The University at Buffalo, Buffalo, NY 14209, USA
*
Authors to whom correspondence should be addressed.
These authors contributed equally to this work.
Int. J. Mol. Sci. 2024, 25(17), 9610; https://doi.org/10.3390/ijms25179610
Submission received: 29 July 2024 / Revised: 30 August 2024 / Accepted: 3 September 2024 / Published: 5 September 2024

Abstract

:
Congenital proximal renal tubular acidosis (pRTA) is a rare systemic disease caused by mutations in the SLC4A4 gene that encodes the electrogenic sodium bicarbonate cotransporter, NBCe1. The major NBCe1 protein variants are designated NBCe1-A, NBCe1-B, and NBCe1-C. NBCe1-A expression is kidney-specific, NBCe1-B is broadly expressed and is the only NBCe1 variant expressed in the heart, and NBCe1-C is a splice variant of NBCe1-B that is expressed in the brain. No cardiac manifestations have been reported from patients with pRTA, but studies in adult rats with virally induced reduction in cardiac NBCe1-B expression indicate that NBCe1-B loss leads to cardiac hypertrophy and prolonged QT intervals in rodents. NBCe1-null mice die shortly after weaning, so the consequence of congenital, global NBCe1 loss on the heart is unknown. To circumvent this issue, we characterized the cardiac function of NBCe1-B/C-null (KOb/c) mice that survive up to 2 months of age and which, due to the uninterrupted expression of NBCe1-A, do not exhibit the confounding acidemia of the globally null mice. In contrast to the viral knockdown model, cardiac hypertrophy was not present in KOb/c mice as assessed by heart-weight-to-body-weight ratios and cardiomyocyte cross-sectional area. However, echocardiographic analysis revealed reduced left ventricular ejection fraction, and intraventricular pressure–volume measurements demonstrated reduced load-independent contractility. We also observed increased QT length variation in KOb/c mice. Finally, using the calcium indicator Fura-2 AM, we observed a significant reduction in the amplitude of Ca2+ transients in paced KOb/c cardiomyocytes. These data indicate that congenital, global absence of NBCe1-B/C leads to impaired cardiac contractility and increased QT length variation in juvenile mice. It remains to be determined whether the cardiac phenotype in KOb/c mice is influenced by the absence of NBCe1-B/C from neuronal and endocrine tissues.

1. Introduction

Congenital proximal renal tubular acidosis (pRTA) is a rare, systemic disease characterized by severe acidemia resulting from impaired proximal tubule bicarbonate (HCO3) transport. In addition to low plasma pH and [HCO3], the 20 pRTA case reports to date describe several other disease features such as growth retardation, ocular pathologies (band keratopathy, cataracts, and glaucoma), dental abnormalities, intellectual impairment, bilateral basal ganglia calcification, epilepsy, migraines, and muscle weakness [1,2,3,4,5,6,7,8,9,10,11,12,13,14,15,16,17,18,19,20]. In these reports, various mutations in the SLC4A4 gene, which encodes the electrogenic sodium/bicarbonate (Na+/2HCO3) cotransporter (NBCe1), were determined to cause congenital pRTA. Notably, SLC4A4 expresses three major variants of NBCe1 designated A–C (Figure 1: reviewed in [21]). NBCe1-A is only expressed in the kidney proximal tubule, and it is the loss of NBCe1-A that is largely responsible for the severe urinary HCO3 wasting and acidemia characteristic of congenital pRTA [22,23]. NBCe1-B, while being a minor renal variant, is the major extrarenal variant with expression in cells of the pancreas, intestine, bone, brain, and heart [23,24,25]. Finally, NBCe1-C expression has only been reported in the brains of rats [26], whereas no NBCe1-C transcripts or protein expression has been detected in human tissue [27], and its relevance is currently unknown.
The identification of SLC4A4 mutations as the cause of congenital pRTA has prompted the development of several mouse models that have advanced our understanding of the underlying pathologies associated with congenital pRTA and highlighted the importance of NBCe1. Among these include the total-NBCe1-knockout mouse (KOtotal) [28], the NBCe1-A-specific-knockout mouse (KOa) [22], and the NBCe1-B/C-knockout mouse (KOb/c) [29]. There are two important findings to note from the study of these mouse models. Firstly, both KOtotal and KOa mice develop spontaneous, severe metabolic acidosis due to loss of the HCO3 transport activity of NBCe1-A in the kidney proximal tubule. Secondly, since KOb/c mice maintain kidney NBCe1-A expression, they do not develop metabolic acidosis. However, both KOtotal and KOb/c mice have similar phenotypic features (except for metabolic acidosis) including developmental defects, ocular abnormalities, enamel hypomineralization, and impacted intestines [28,29]. Moreover, both KOtotal and KOb/c mice have increased mortality (50% mortality at 12 and 35 days, respectively), whereas KOa mice live into adulthood [22,28,29]. The conclusions drawn from these findings is that the organ-specific loss of NBCe1-B/C is responsible for the extrarenal phenotypic features of congenital pRTA (as opposed to the overt acidemia), and furthermore, it is the loss of NBCe1-B/C that is the major contributor to the increased mortality seen in total NBCe1 deletion. Nevertheless, the contribution of NBCe1 to the physiology of extrarenal organ systems remains understudied.
Of increasing interest is the role of NBCe1-B in cardiac physiology. In cardiomyocytes, NBCe1-B imports base into the sarcoplasm, working in conjunction with the electroneutral NBC (NBCn1) and the Na+/H+ exchanger (NHE1), to neutralize intracellular acids and maintain intracellular pH balance (reviewed in [30]). However, compared to the 1Na+:1(H+ or HCO3) transport stoichiometry of NBCn1 and NHE1, NBCe1-B imports the equivalent of two HCO3 ions (actually one CO3= ion [31]) per single Na+ ion. Thus, NBCe1 imports half as many Na+ ions per base equivalent compared to NBCn1 or NHE1. This difference in stoichiometry has led to the description of NBCe1-B as “Na+ sparing” [30]. Consequently, a reduction in NBCe1-B expression/activity, with compensatory upregulation of NHE1 and/or NBCn1 activity [32,33], is hypothesized to cause an increased intracellular Na+ load that impairs the Ca2+-extrusion activity of the Na+/Ca2+ exchanger (NCX1), resulting in Ca2+-mediated hypertrophic growth, electrophysiologic disruption, and/or functional changes [30]. Indeed, reduction in cardiac NBCe1-B expression via virally induced inhibition in adult rats led to cardiac hypertrophy [32]. In addition, reduced cardiac NBCe1-B expression resulted in increased QT interval duration, which correlated with prolongation of the action potential duration (APD) in isolated rat cardiomyocytes [32]. Finally, in the spontaneously hypertensive rat model of pre-existing cardiac hypertrophy, NBCe1-B activity was reduced, whereas NBCn1 activity was upregulated; an effect found to be mediated by angiotensin II signaling [33], overall supporting the hypothesis that the loss of NBCe1-B leads to cardiac dysfunction.
However, despite the growing evidence supporting the importance NBCe1-B in cardiac physiology, no cardiac manifestations have been described in case reports of congenital pRTA patients, and no phenotypes have been linked to individuals with homozygous NBCe1-B/C-specific nucleotide changes [1,2,3,4,5,6,7,8,9,10,11,12,13,14,15,16,17,18,19,20]. The extent to which this may be explained by a high perinatal mortality has never been addressed. Thus, the effect of congenital absence of cardiac NBCe1-B remains unclear. While congenital pRTA is an exceedingly rare disease, heart failure with reduced ejection fraction (i.e., systolic dysfunction) is a significant cause of morbidity and mortality in the United States with an estimated >3 million adults effected [34], underscoring the need for novel therapeutics to abate the development and progression of heart failure. Therefore, understanding the underlying molecular mechanisms of systolic dysfunction is a valuable target.
Accordingly, the major aim of this study is to characterize the cardiac function of the KOb/c mouse, which is uniquely suited for investigation of the effect of congenital, global NBCe1-B loss without the confounding effect of metabolic acidosis seen in KOtotal mice. To this end, we assessed the cardiac function of 4–5-week-old wild-type (WT) and KOb/c mice using echocardiography, intraventricular admittance catheter-derived pressure–volume analysis, and electrocardiography (ECG). We additionally performed histological examination of hearts for evidence of hypertrophy. Finally, we assessed the effect of NBCe1-B absence on [Ca2+]i dynamics using quantitative high-speed fluorescent recordings of paced Fura-2 AM-loaded cardiomyocytes isolated from WT and KOb/c hearts.

2. Results

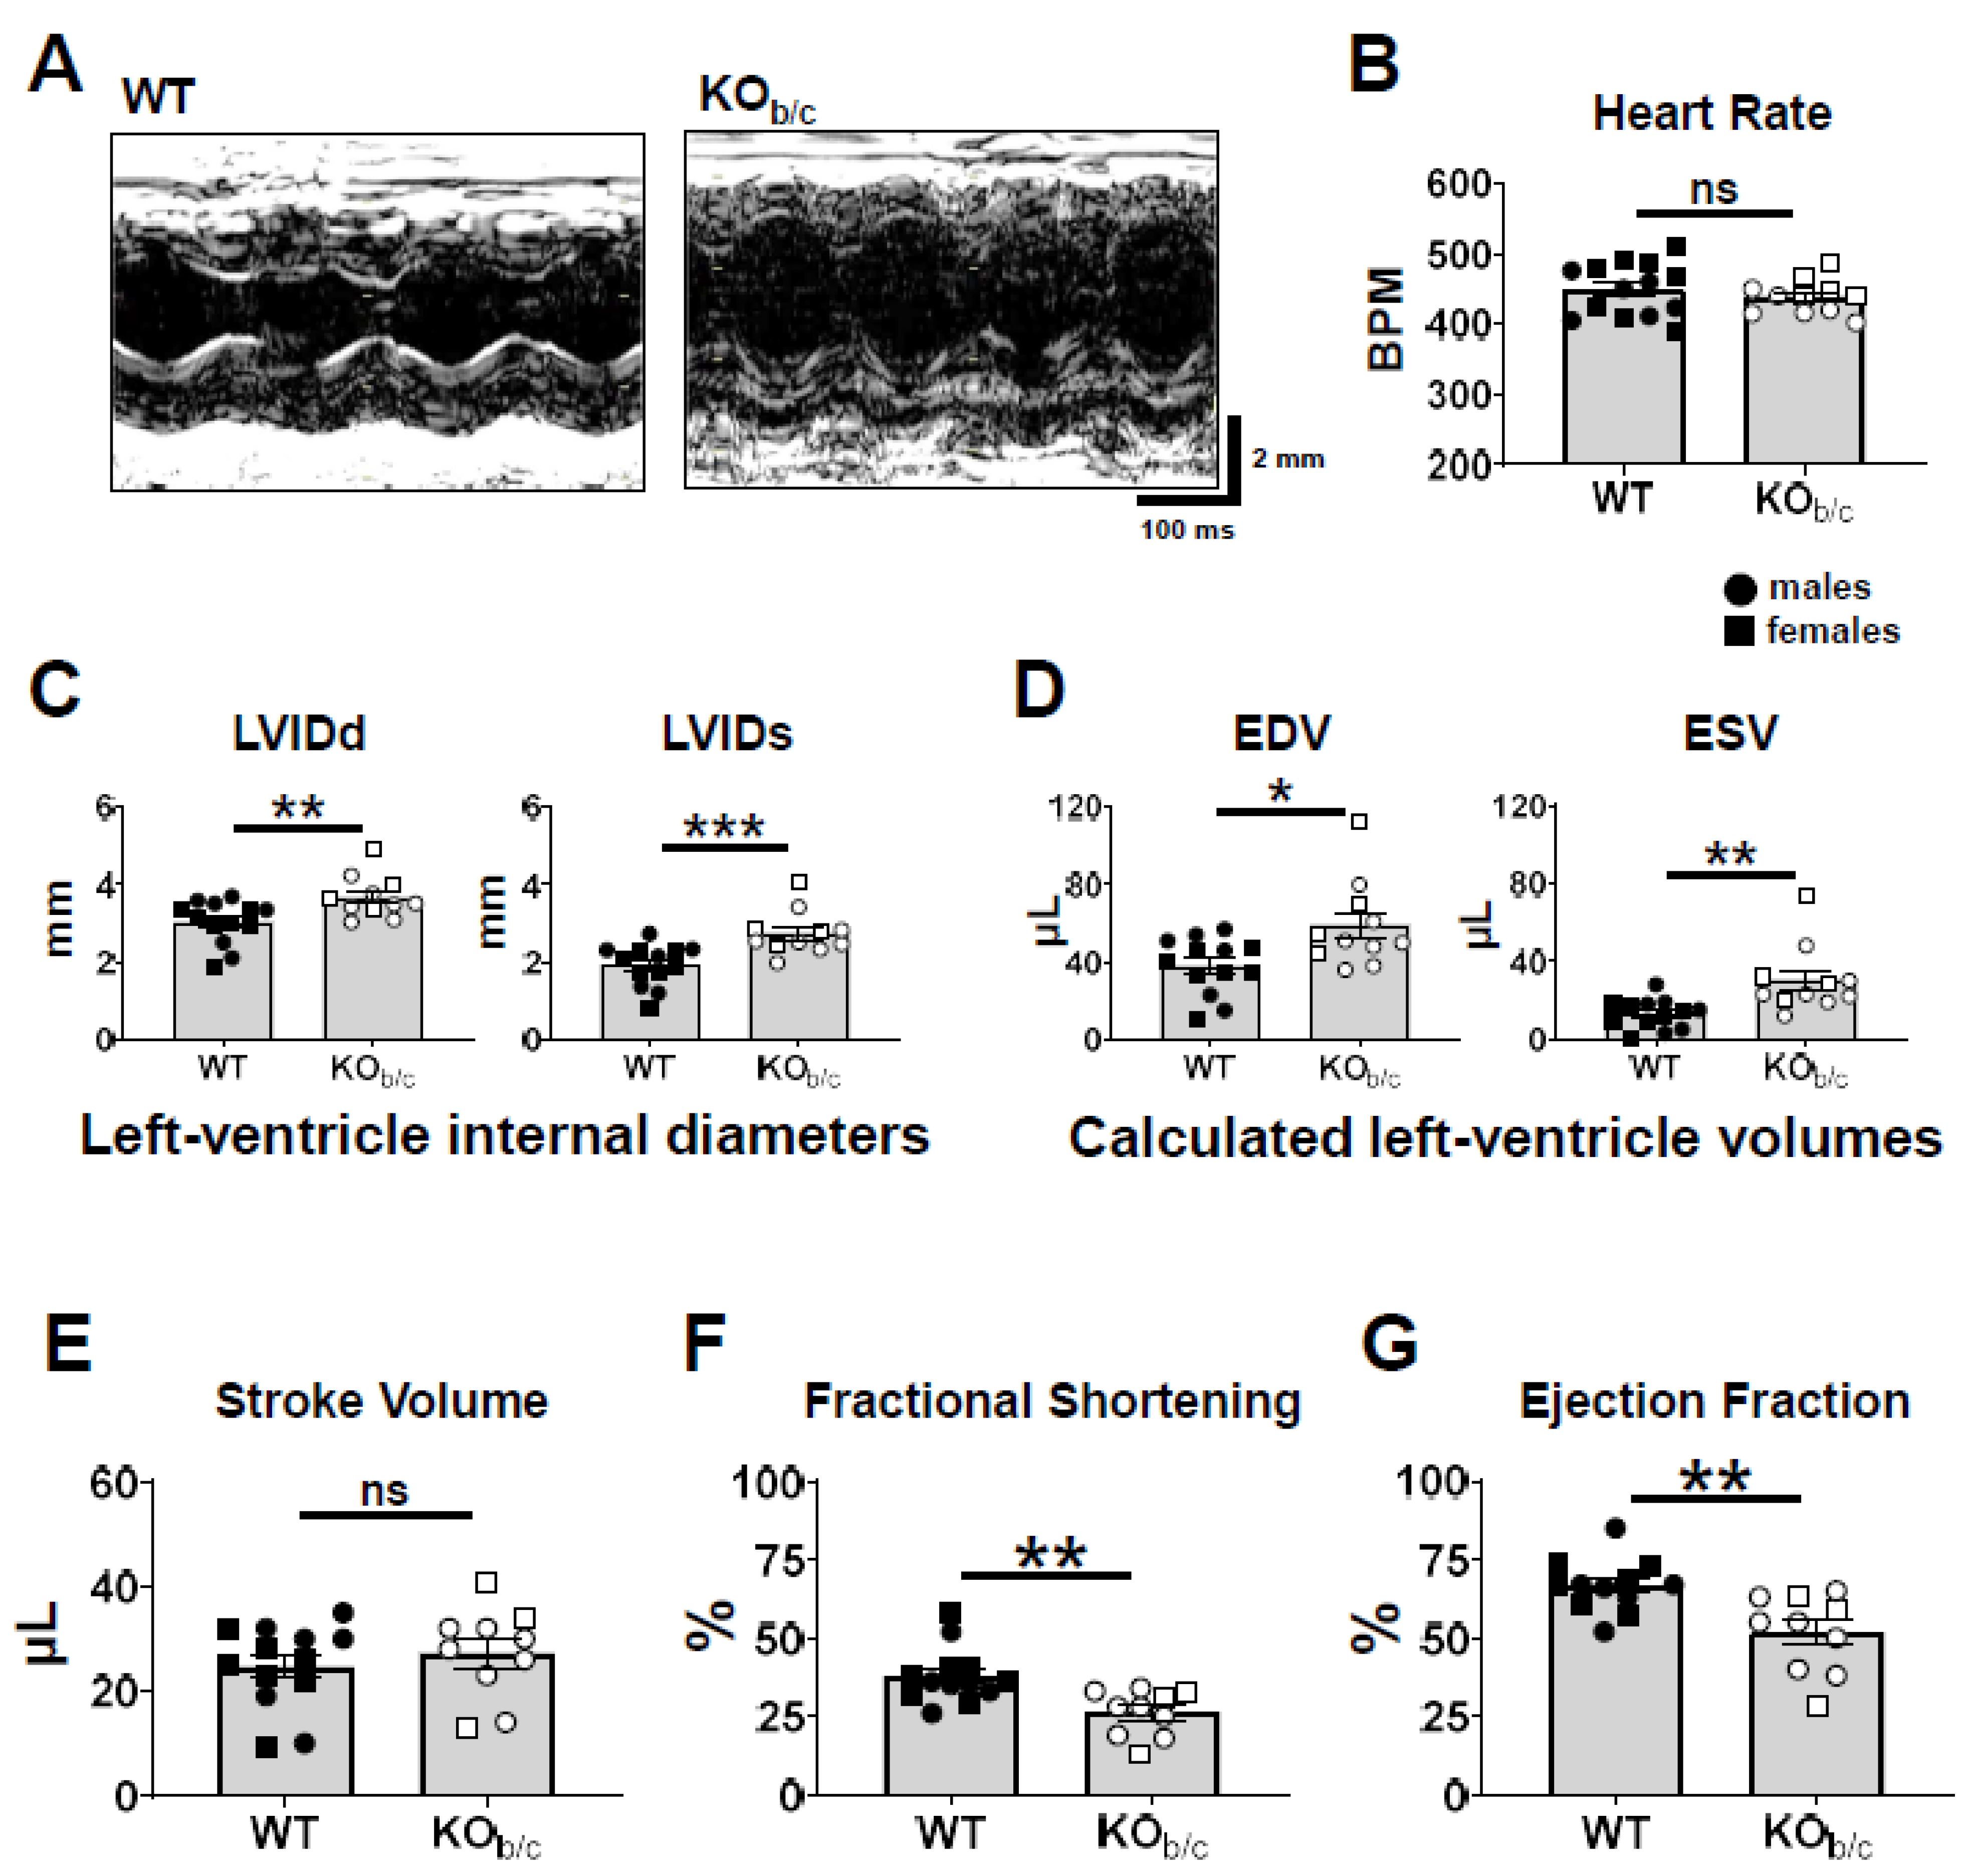
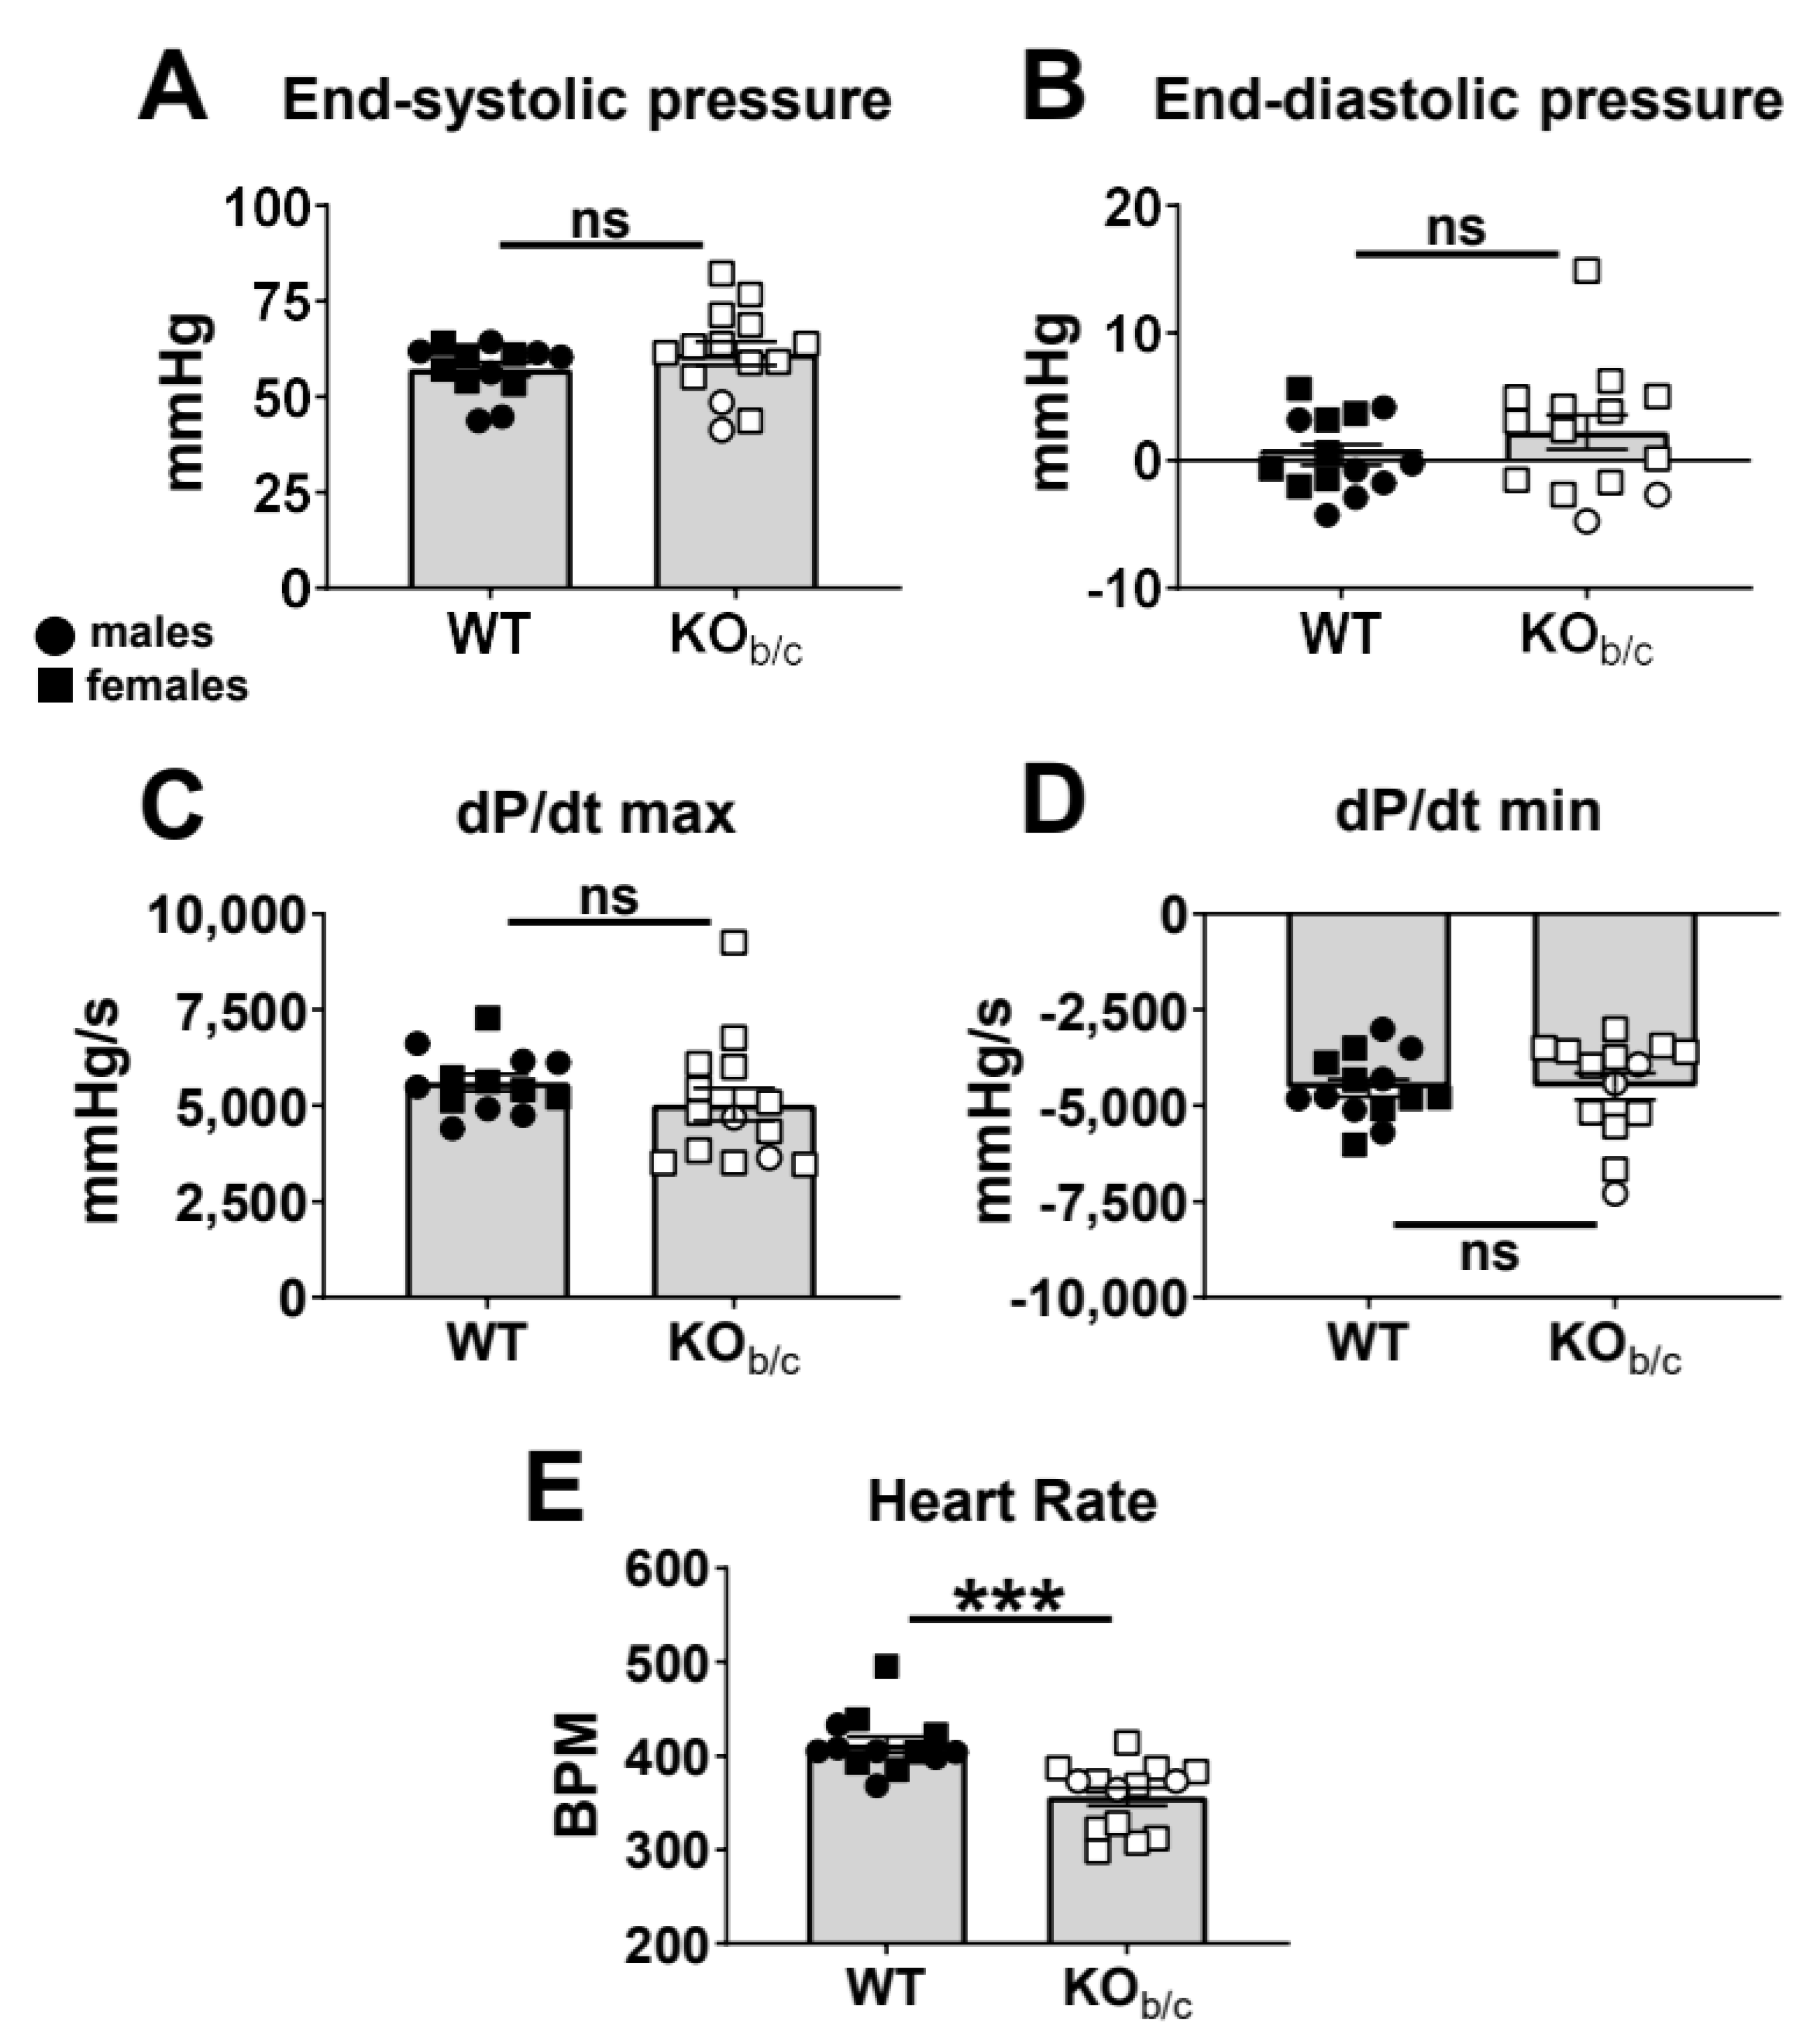
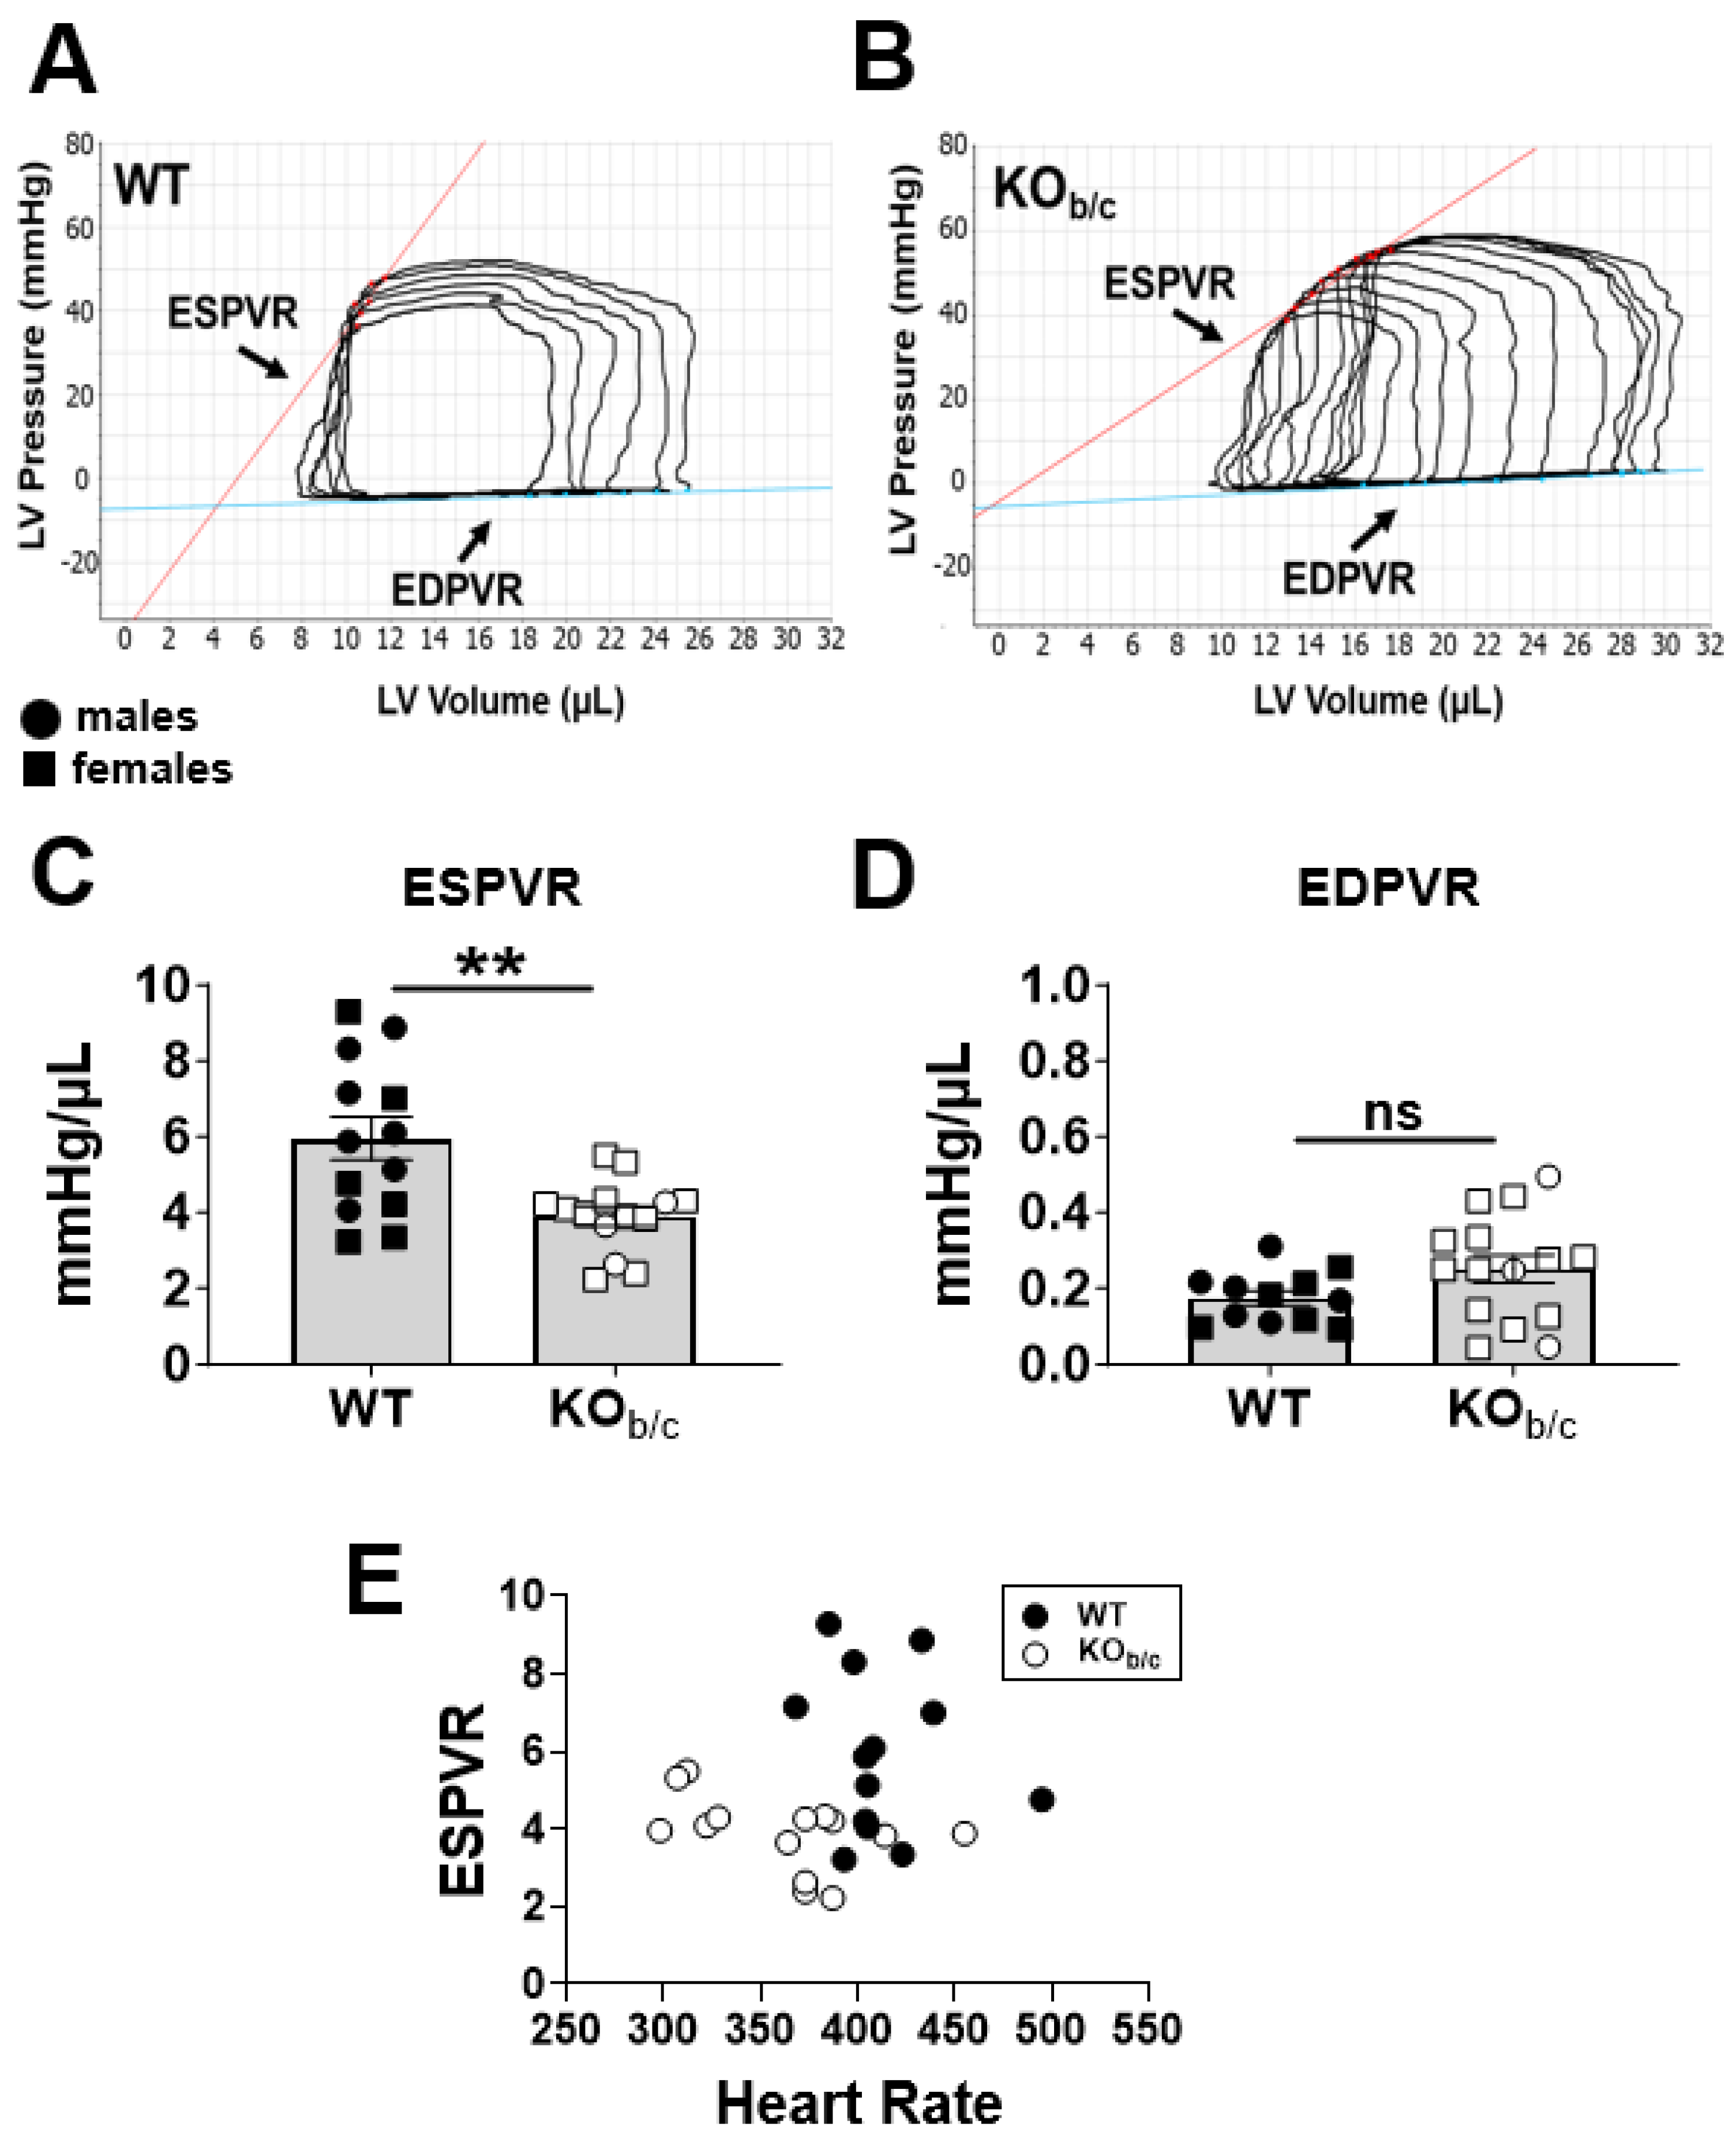
2.1. Reduced Ejection Fraction with Diminished Systolic Function in KOb/c Mice

Echocardiography was used to assess cardiac function in WT and KOb/c mice while under isoflurane anesthesia, with representative M-mode images obtained in WT and KOb/c mice shown in Figure 2A. The heart rate of each mouse was maintained between ~400–500 BPM via titration of isoflurane (WT: 449 ± 10 BPM, KOb/c: 438 ± 7 BPM, p = 0.450, n = 14 and 11, respectively). The left ventricle internal diameters during diastole and systole (LVIDd and LVIDs) were both significantly greater in KOb/c mice (LVIDd–WT: 3.0 ± 0.1 mm, KOb/c: 3.7 ± 0.2. mm, p = 0.010, n = 13 and 11, respectively; LVIDs–WT: 1.9 ± 0.1 mm, KOb/c: 2.8 ± 0.2 mm, p = 0.001, n = 13 and 11; Figure 2C). Using the LVIDd and LVIDs to calculate the end-diastolic volume (EDV) and the end-systolic volume (ESV), we further determined that the EDV and ESV were significantly greater in KOb/c mice (EDV–WT: 38 ± 4 µL, KOb/c: 59 ± 6 µL, p = 0.011, n = 13 and 11, respectively; ESV–WT: 13 ± 2 µL, KOb/c: 30 ± 5 µL, p = 0.003, n = 13 and 11, respectively; Figure 2D). However, there was no significant difference in stroke volume between WT and KOb/c mice (WT: 25 ± 2 µL, KOb/c: 27 ± 3 µL, p = 0.442, n = 13 and 10, respectively; Figure 2E). Finally, the fractional shortening (FS) and the ejection fraction (EF) were significantly reduced in KOb/c mice (FS–WT: 38 ± 2%, KOb/c: 26 ± 2%, p = 0.001, n = 13 and 10, respectively; EF–WT: 67 ± 2%, KOb/c: 52 ± 4%, p = 0.003, n = 12 and 10, respectively; Figure 2F,G).
To assess for possible structural abnormalities between WT and KOb/c mice, we measured the width of the left ventricular anterior and posterior walls during diastole and during systole using M-mode echocardiography (Figure 3A–D). During diastole, there was no significant difference between the width of the left ventricular anterior or posterior walls (anterior wall width diastole—WT: 0.56 ± 0.03 mm, KOb/c: 0.57 ± 0.02 mm, p = 0.770, n = 13 and 11, respectively; posterior wall width diastole—WT: 0.68 ± 0.04 mm, KOb/c: 0.68 ± 0.04 mm, p = 0.935, n = 13 and 12, respectively; Figure 3A,B). Similarly, during systole, there was no significant difference between the width of the left ventricular anterior or posterior walls (anterior wall width systole—WT: 0.98 ± 0.03 mm, KOb/c: 0.85 ± 0.05 mm, p = 0.053, n = 14 and 11, respectively; posterior wall width systole—WT: 0.85 ± 0.06 mm, KOb/c: 1.02 ± 0.10 mm, p = 0.173, n = 13 and 12, respectively; Figure 3C,D). Additionally, we compared the blood pressure between WT and KOb/c mice (Figure 3E) and found no significant difference between systolic pressure (WT: 121 ± 5 mmHg, KOb/c: 132 ± 7 mmHg, p = 0.214, n = 11 and 7, respectively), diastolic pressure (WT: 97 ± 5 mmHg, KOb/c: 102 ± 8 mmHg, p = 0.543, n = 11 and 7, respectively), or mean arterial pressure (WT: 105 ± 4 mmHg, KOb/c: 112 ± 7 mmHg, p = 0.401, n = 11 and 7, respectively). Together, these data suggest that the reduced ejection fraction observed in KOb/c mice is not attributable to structural changes or increased systemic vascular resistance.
Next, we assessed systolic and diastolic function of WT and KOb/c mice by obtaining left intraventricular pressure–volume (PV) measurements. Figure 4 presents the results of baseline PV measurements (i.e., load-dependent parameters). We found no significant difference between baseline left ventricular end-systolic or end-diastolic pressures of WT and KOb/c mice (baseline end-systolic pressure—WT: 51 ± 7 mmHg, KOb/c: 61 ± 3 mmHg, p = 0.277, n = 13 and 14, respectively; baseline end-diastolic pressure—WT: 0 ± 1 mmHg, KOb/c: 2 ± 1 mmHg, p = 0.264, n = 14 for both groups; Figure 4A,B). Similarly, we found no significant difference in the dP/dt maximum or minimum (load-dependent measures of systole and diastole, respectively) between WT and KOb/c mice (dP/dt maximum—WT: 5604 ± 220 mmHg/s, KOb/c: 5030 ± 434 mmHg/s, p = 0.260, n = 13 and 14, respectively; dP/dt minimum—WT: −4546 ± 228 mmHg/s, KOb/c: −4503 ± 346 mmHg/s, p = 0.918, n = 14 for both groups; Figure 4C,D).
However, because of the invasive nature and depth of anesthesia required during this experiment (necessitating the lack of pedal reflex in individual mice), KOb/c mice had a significantly lower heart rate than WT mice (WT: 412 ± 9 BPM, KOb/c: 356 ± 10 BPM, p < 0.001, n = 13 and 14, respectively). Since a slower heart rate leads to greater diastolic filling (preload) and can impact load-dependent cardiac parameters (such as those reported in Figure 4), we next compared load-independent parameters between WT and KOb/c mice. Specifically, inferior vena cava (IVC) occlusion was used as a preload reduction maneuver to assess load-independent parameters of contraction and relaxation (the slopes of the end-systolic pressure–volume relationship [ESPVR] and the end-diastolic pressure–volume relationship [EDPVR], respectively).
Figure 5A,B illustrate representative PV loops obtained in WT and KOb/c mice during IVC occlusion. Here, we observed a significant reduction in the slope of the ESPVR in KOb/c mice (WT: 6.0 ± 0.6 mmHg/µL, KOb/c: 3.9 ± 0.3 mmHg/µL, p = 0.003, n = 13 and 14, respectively; Figure 6C), whereas there was no significant difference from WT mice in the slope of the EDPVR (WT: 0.18 ± 0.07 mmHg/µL, KOb/c: 0.25 ± 0.04 mmHg/µL, p = 0.097, n = 12 and 15, respectively; Figure 5D). Since the animals used to produce the data in Figure 5 were the same as those used to produce the data in Figure 4—and thus the KOb/c mice have a slower heart rate in both data sets—we confirmed that this difference in heart rate did not account for the observed reduction in KOb/c ESPVR by plotting the ESPVR against heart rate for individual mice (Figure 5E). For example, we can see that KOb/c mice with the lowest heart rates (left on the x-axis) have some of the highest ESPVR values among the KOb/c group, thus supporting the idea that the reduced ESPVR in KOb/c mice is not attributable to their overall slower heart rate. Overall, the data presented in Figure 5 indicate that KOb/c mice have diminished left ventricular load-independent contractility.

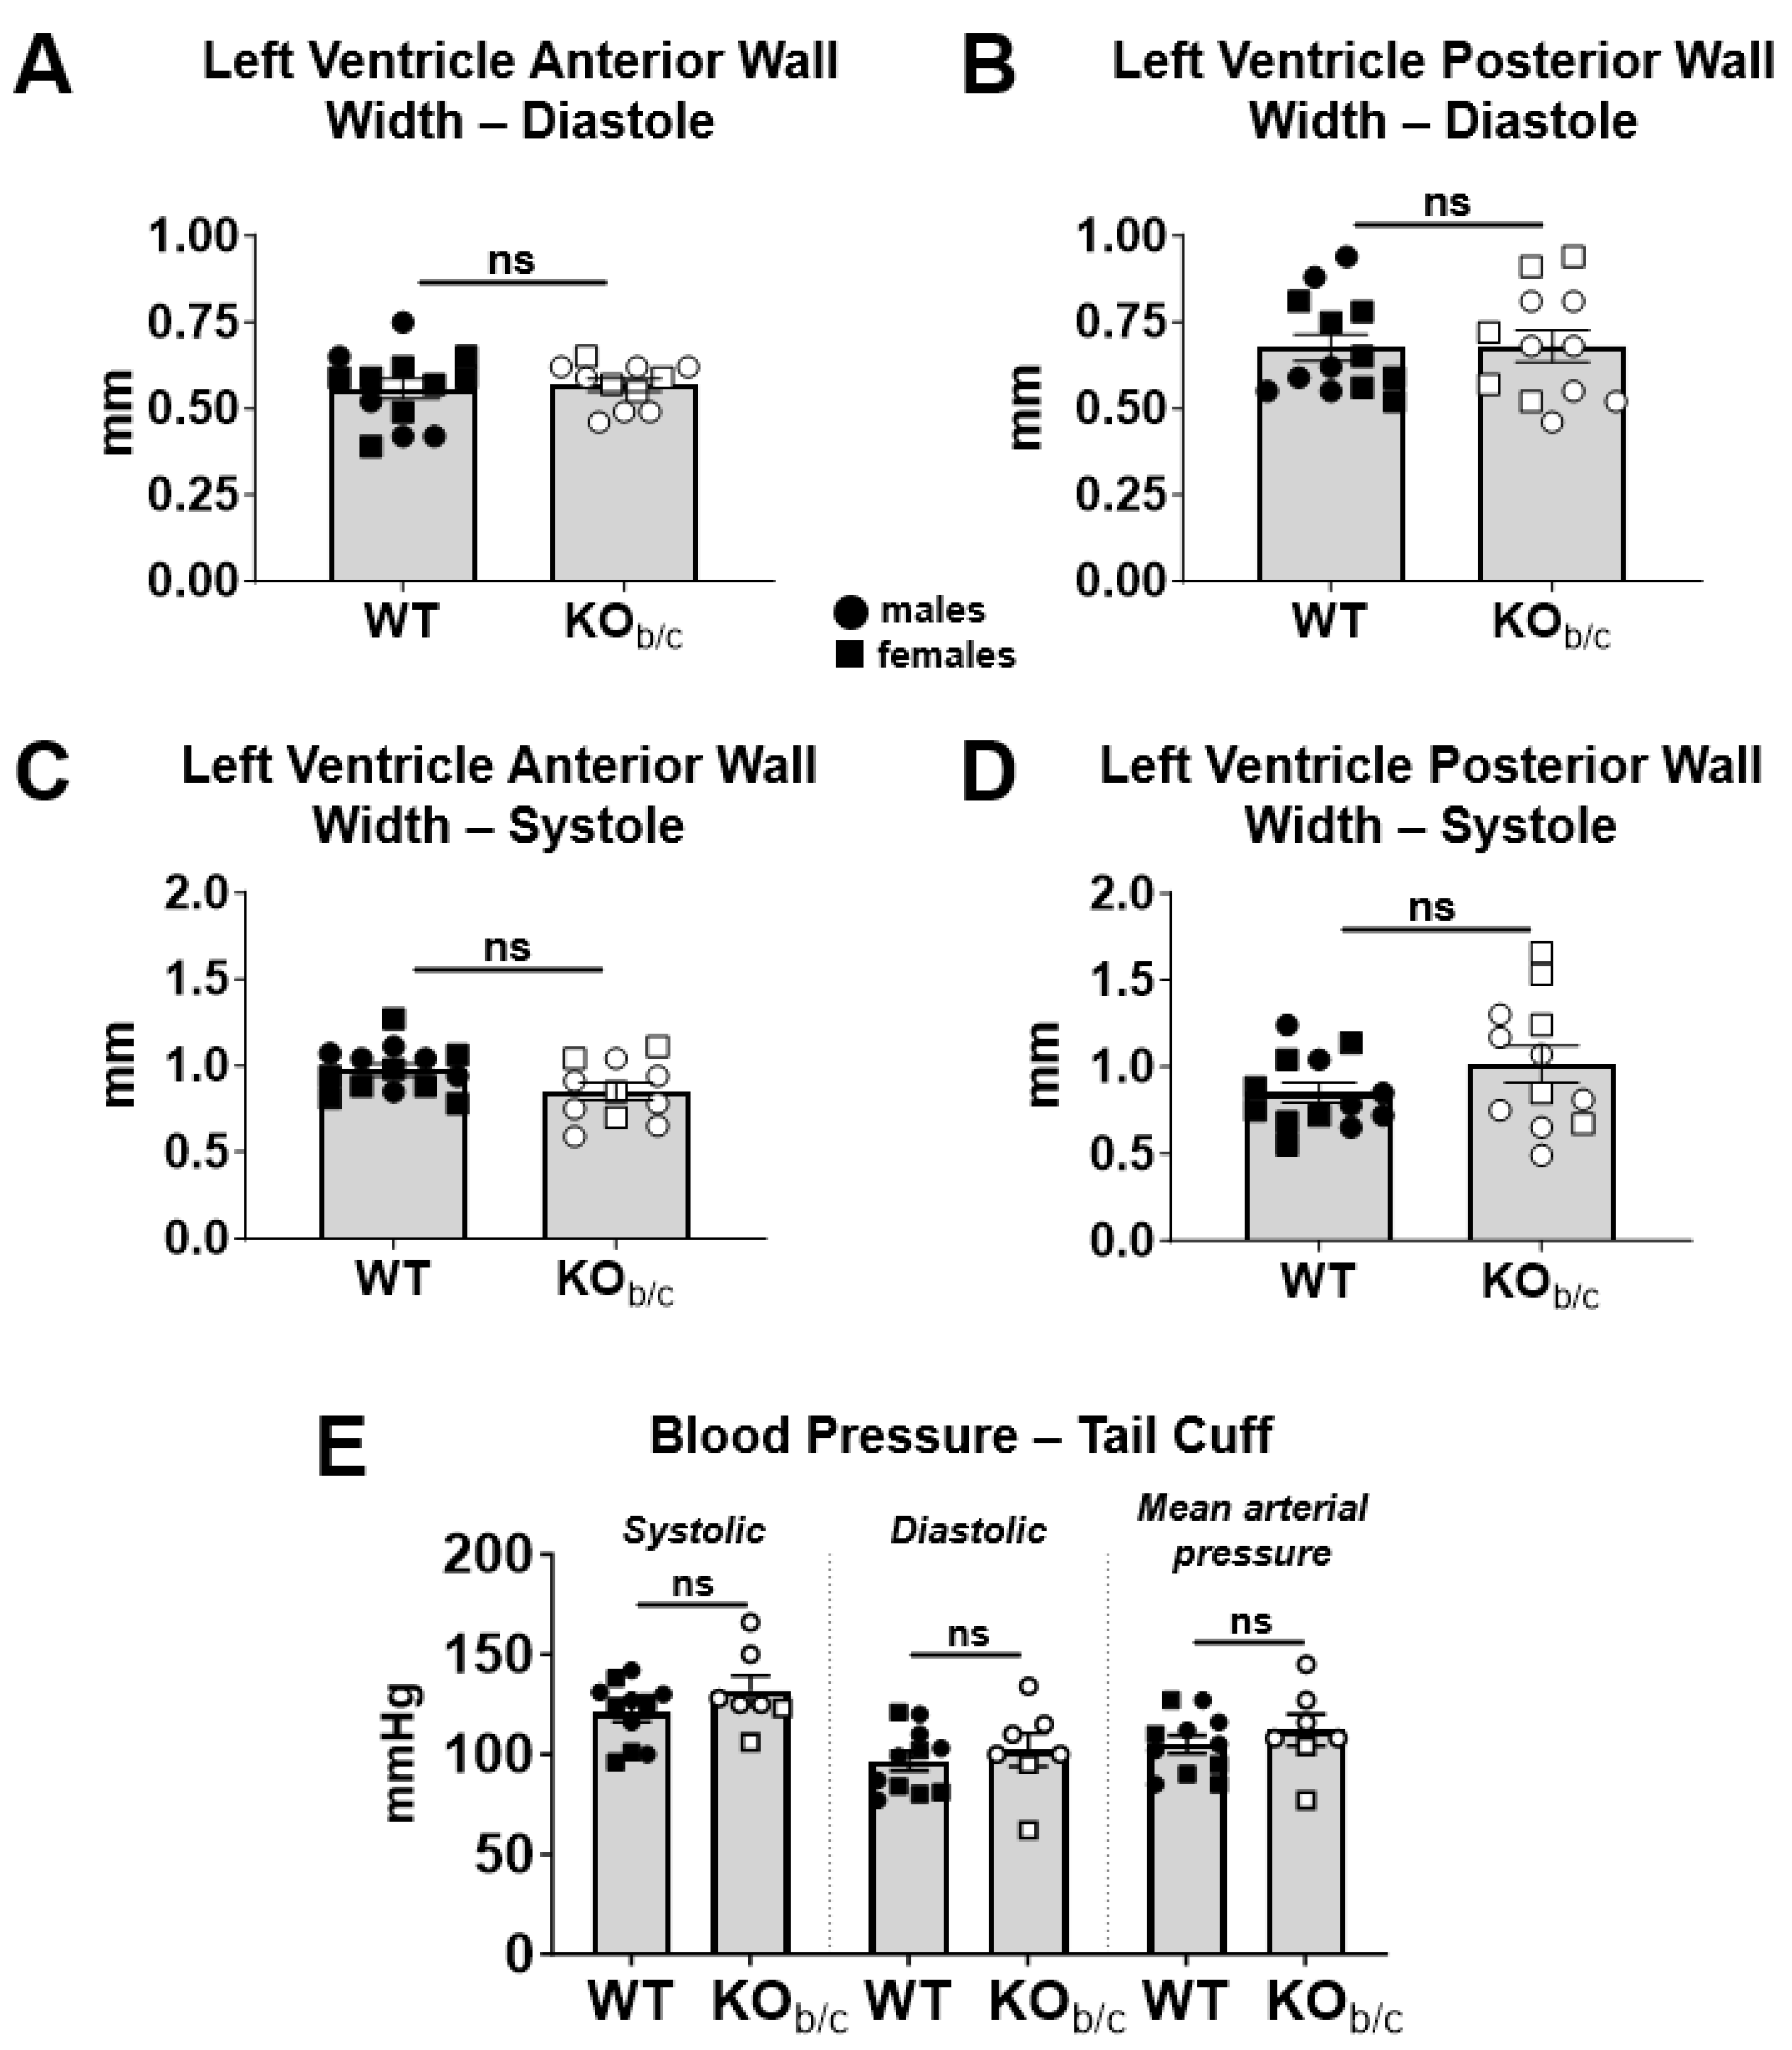
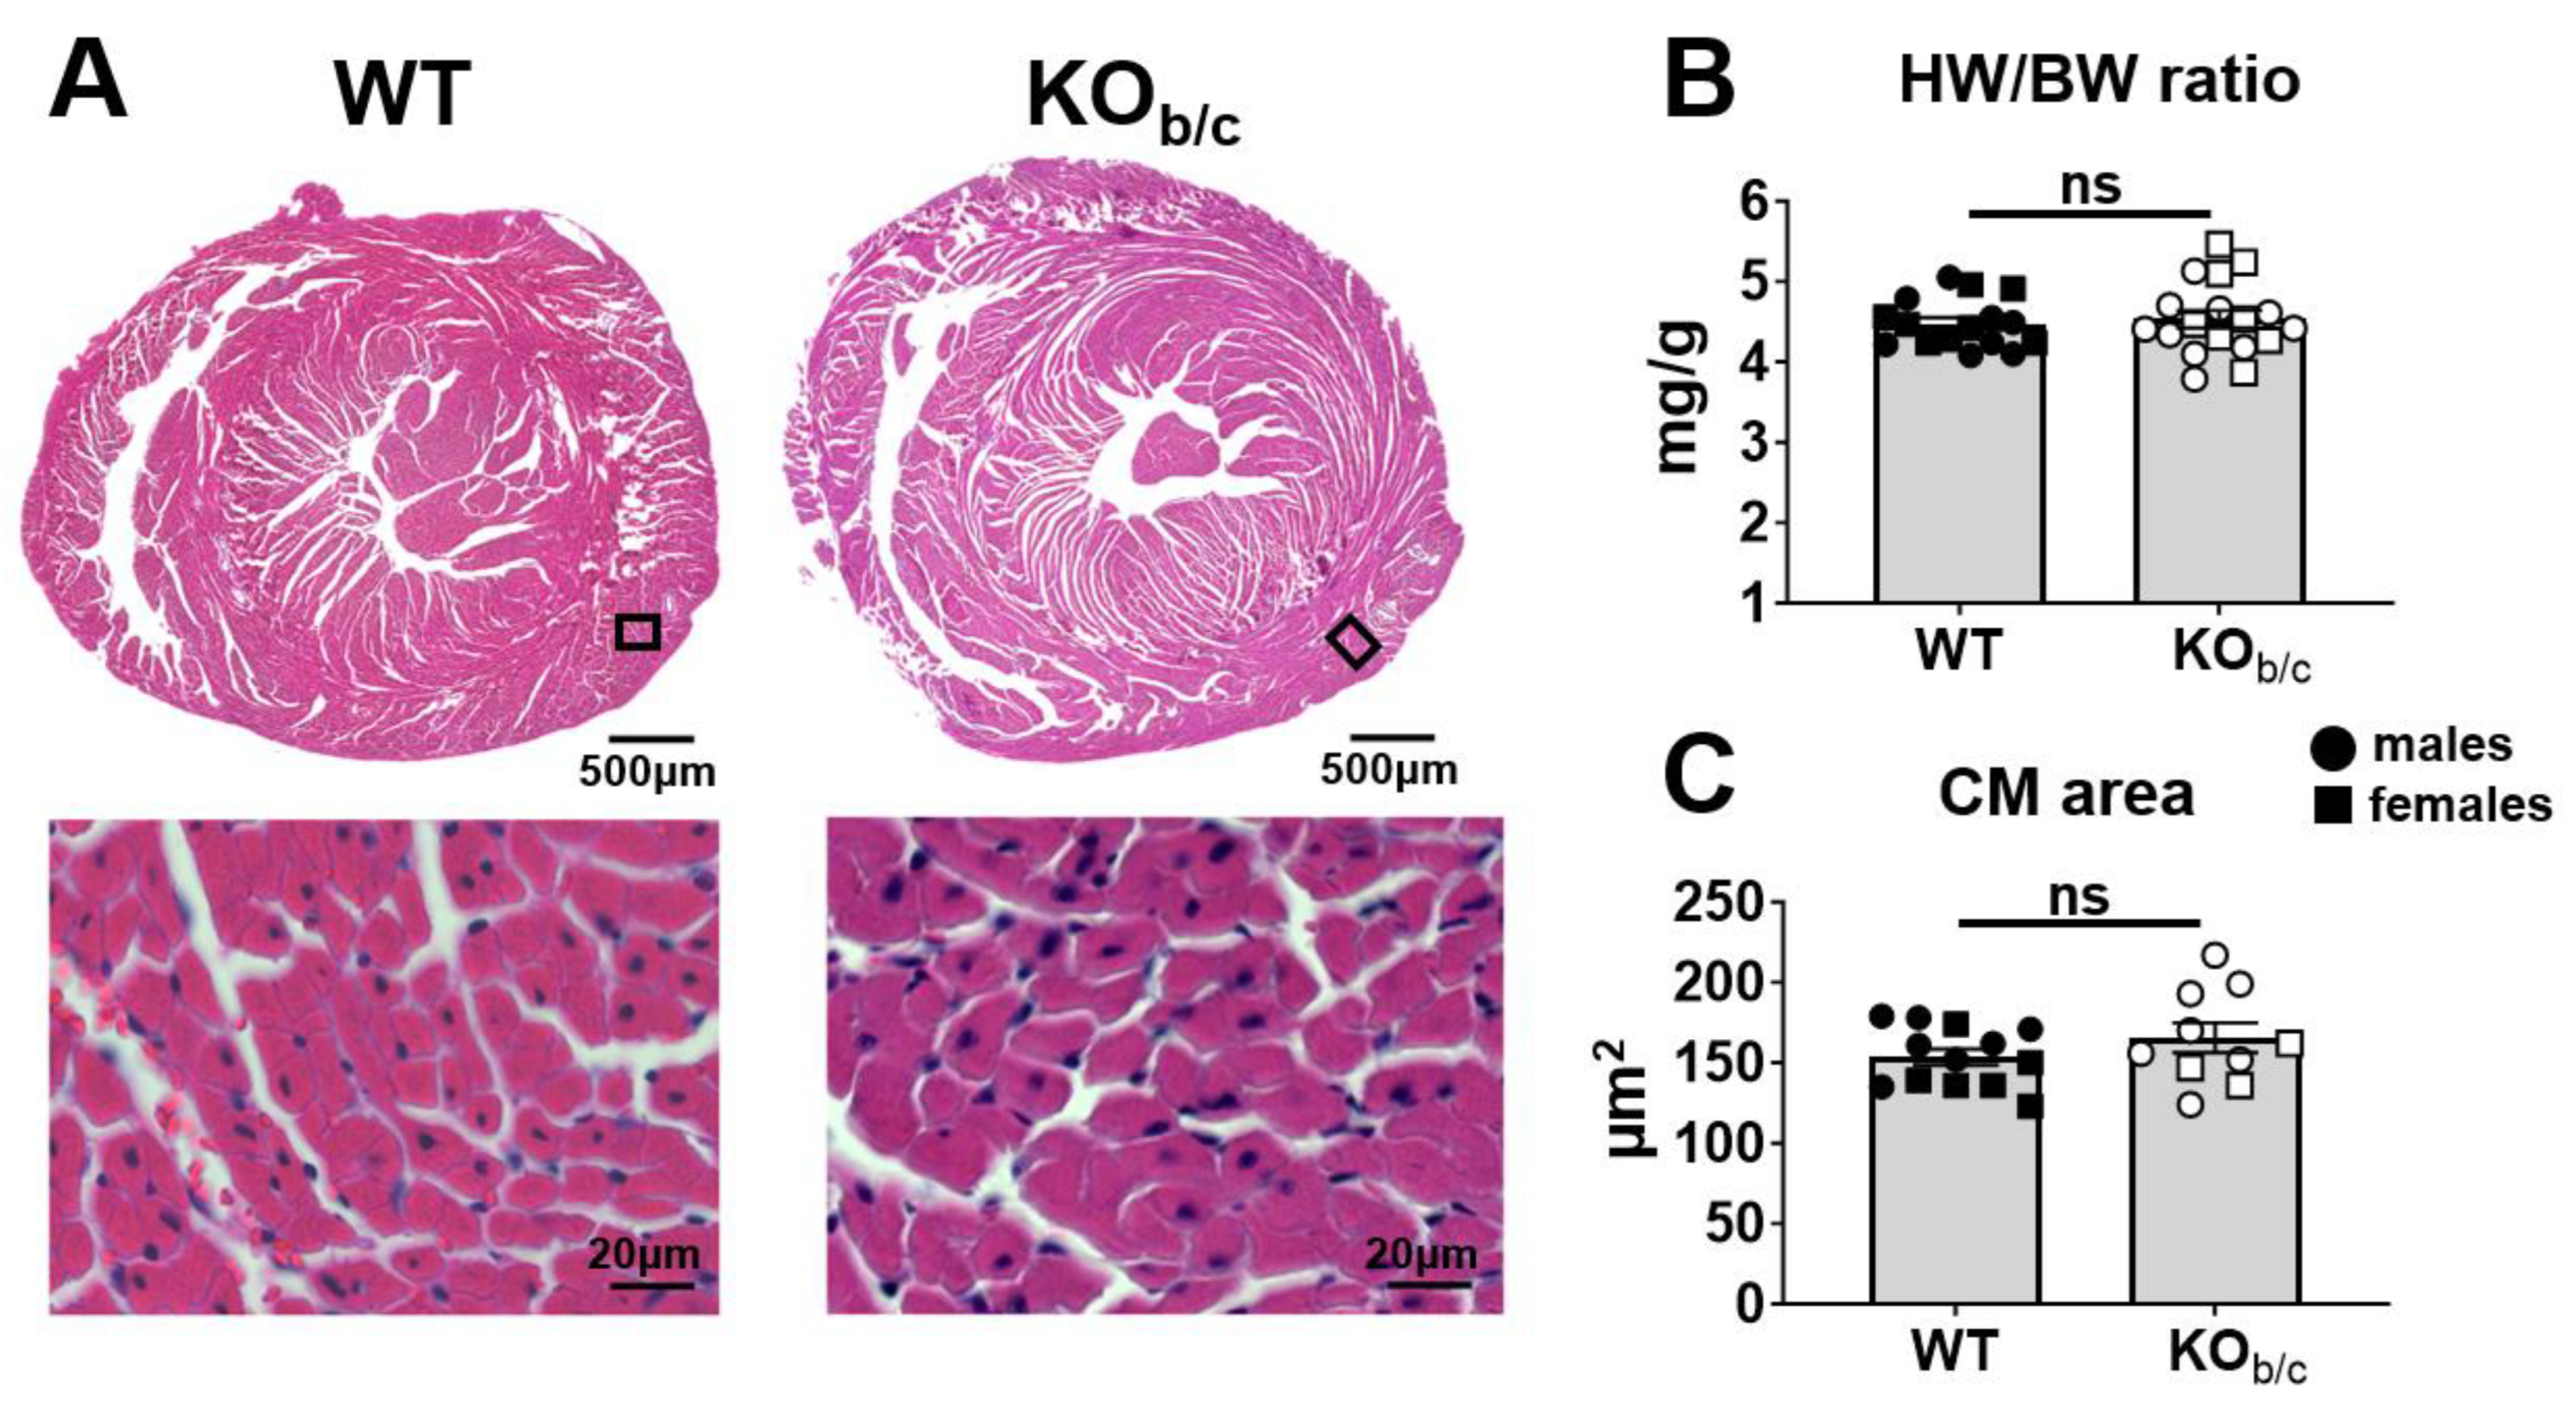
2.2. KOb/c Hearts Are Not Hypertrophic at 4–5 Weeks of Age

To assess for hypertrophy in KOb/c mice, we compared WT and KOb/c heart-weight-to-body-weight ratios (HW/BW) and the cross-sectional area of cardiomyocytes within H&E-stained heart sections. Figure 6A shows representative tiled images and higher-magnification regions of interest taken of WT and KOb/c H&E-stained heart sections. There was no significant difference between the HW/BW ratio of WT and KOb/c mice (WT: 4.48 ± 0.07 mg/g, KOb/c: 4.53 ± 0.10 mg/g, p = 0.680, n = 16 and 18, respectively; Figure 6B). Additionally, we assessed the size of individual cardiomyocytes by measuring the cross-sectional area of 25–29 cardiomyocytes around the left ventricle from individual mice, with the average cardiomyocyte area for each individual mouse shown in Figure 6C. We found no significant difference between WT and KOb/c cardiomyocyte area (WT: 154 ± 6 µm2, KOb/c: 166 ± 9 µm2, p = 0.243, n = 13 and 10, respectively). Together, these results suggest that cardiac hypertrophy is not present in 4–5-week-old KOb/c mice.

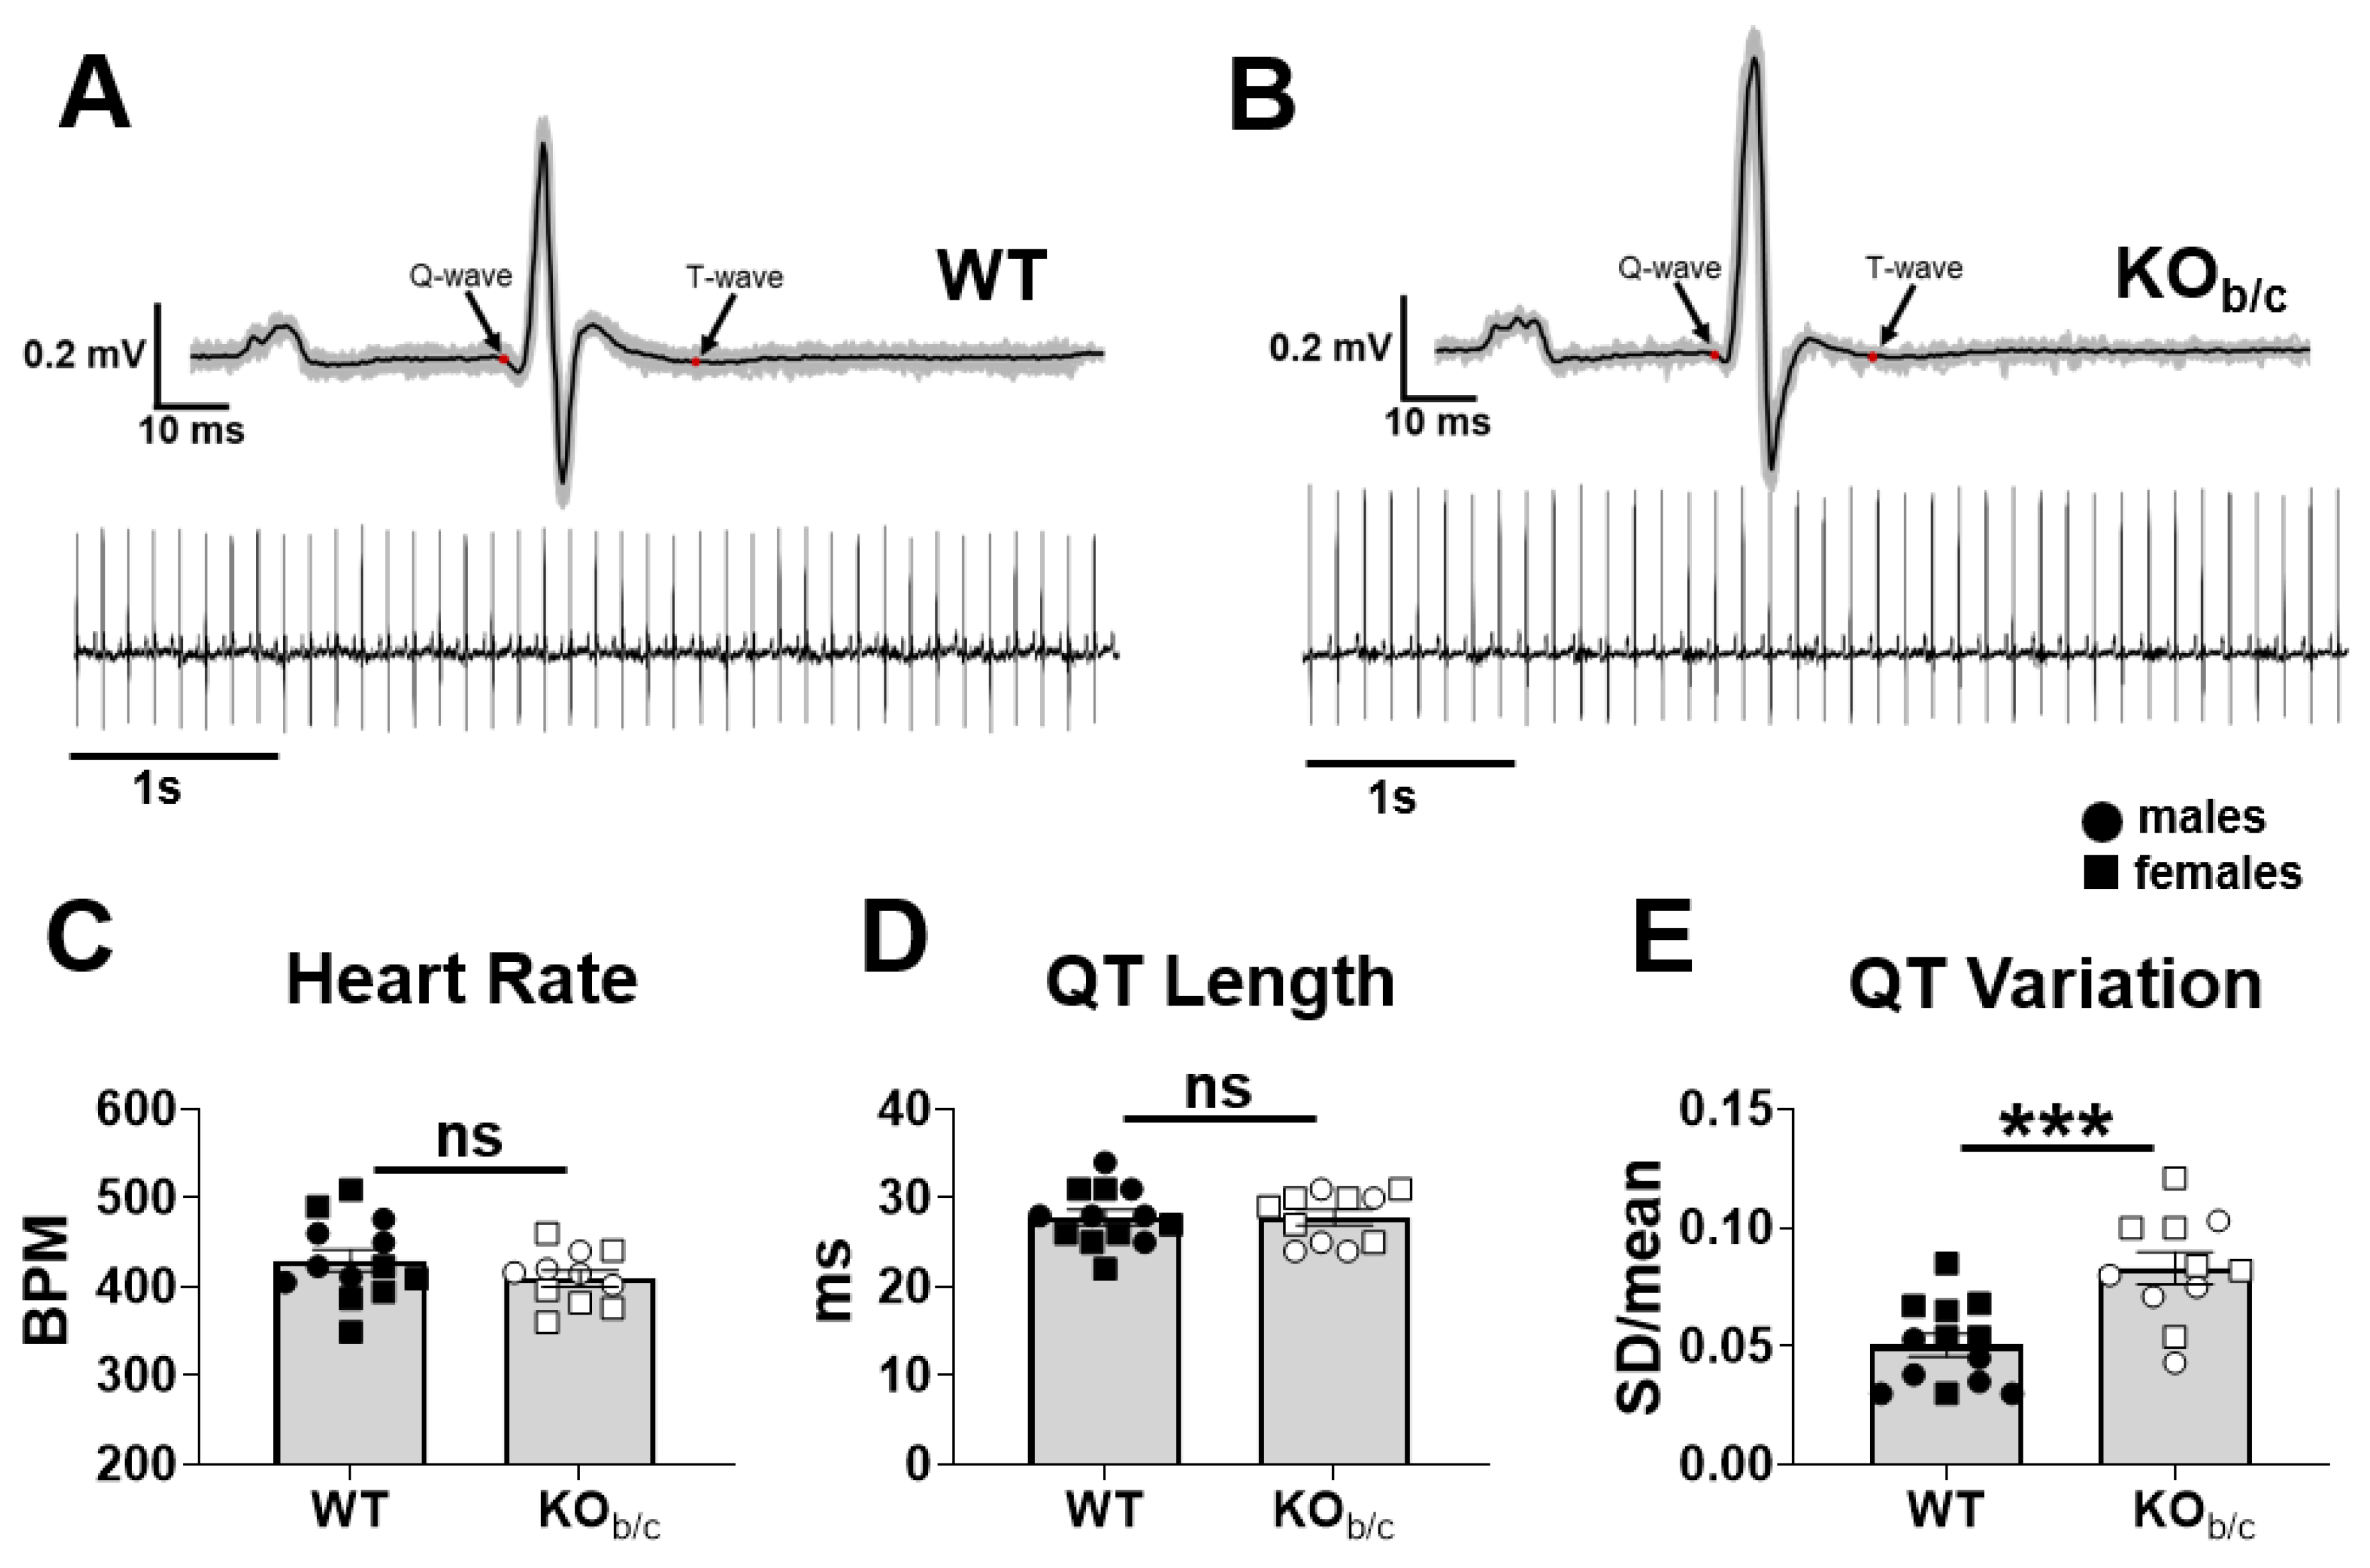
2.3. KOb/c Mice Have No Difference in QT Length but Have Increased QT Length Variation

To test the hypothesis that the absence of NBCe1-B prolongs the QT interval, 30 s ECGs were recorded in anesthetized WT and KOb/c mice while heart rates were maintained between ~350–500 BPM via titration of isoflurane (WT: 430 ± 13 BPM, KOb/c: 410 ± 9 BPM, p = 0.228, n = 13 and 11, respectively; Figure 7C). The QT interval was then calculated from an averaged ECG cycle calculated across the 30 s Lead-I recordings for each mouse. As an example, Figure 7A,B illustrate an averaged ECG cycle (black line) across a 5 s segment of Lead-I recordings from WT and KOb/c mice (underlying grey lines represent an overlay of all the individual cycles in the 5 s traces shown below). We found no significant difference in QT interval length between WT and KOb/c mice (WT: 27.8 ± 0.9 ms, KOb/c: 27.7 ± 0.8 ms, p = 0.937, n = 13 and 11, respectively; Figure 7D). However, we also assessed QT length variation by calculating the coefficient of variation (SD/mean) across 5 s intervals from a continuous 30 s ECG trace (i.e., 6 × 5 s intervals). Using this method, we found that the QT length variation in individual KOb/c mice was significantly greater than that of WT mice (WT: 0.050 ± 0.005, KOb/c: 0.083 ± 0.007, p < 0.001, n = 13 and 11, respectively; Figure 7E).

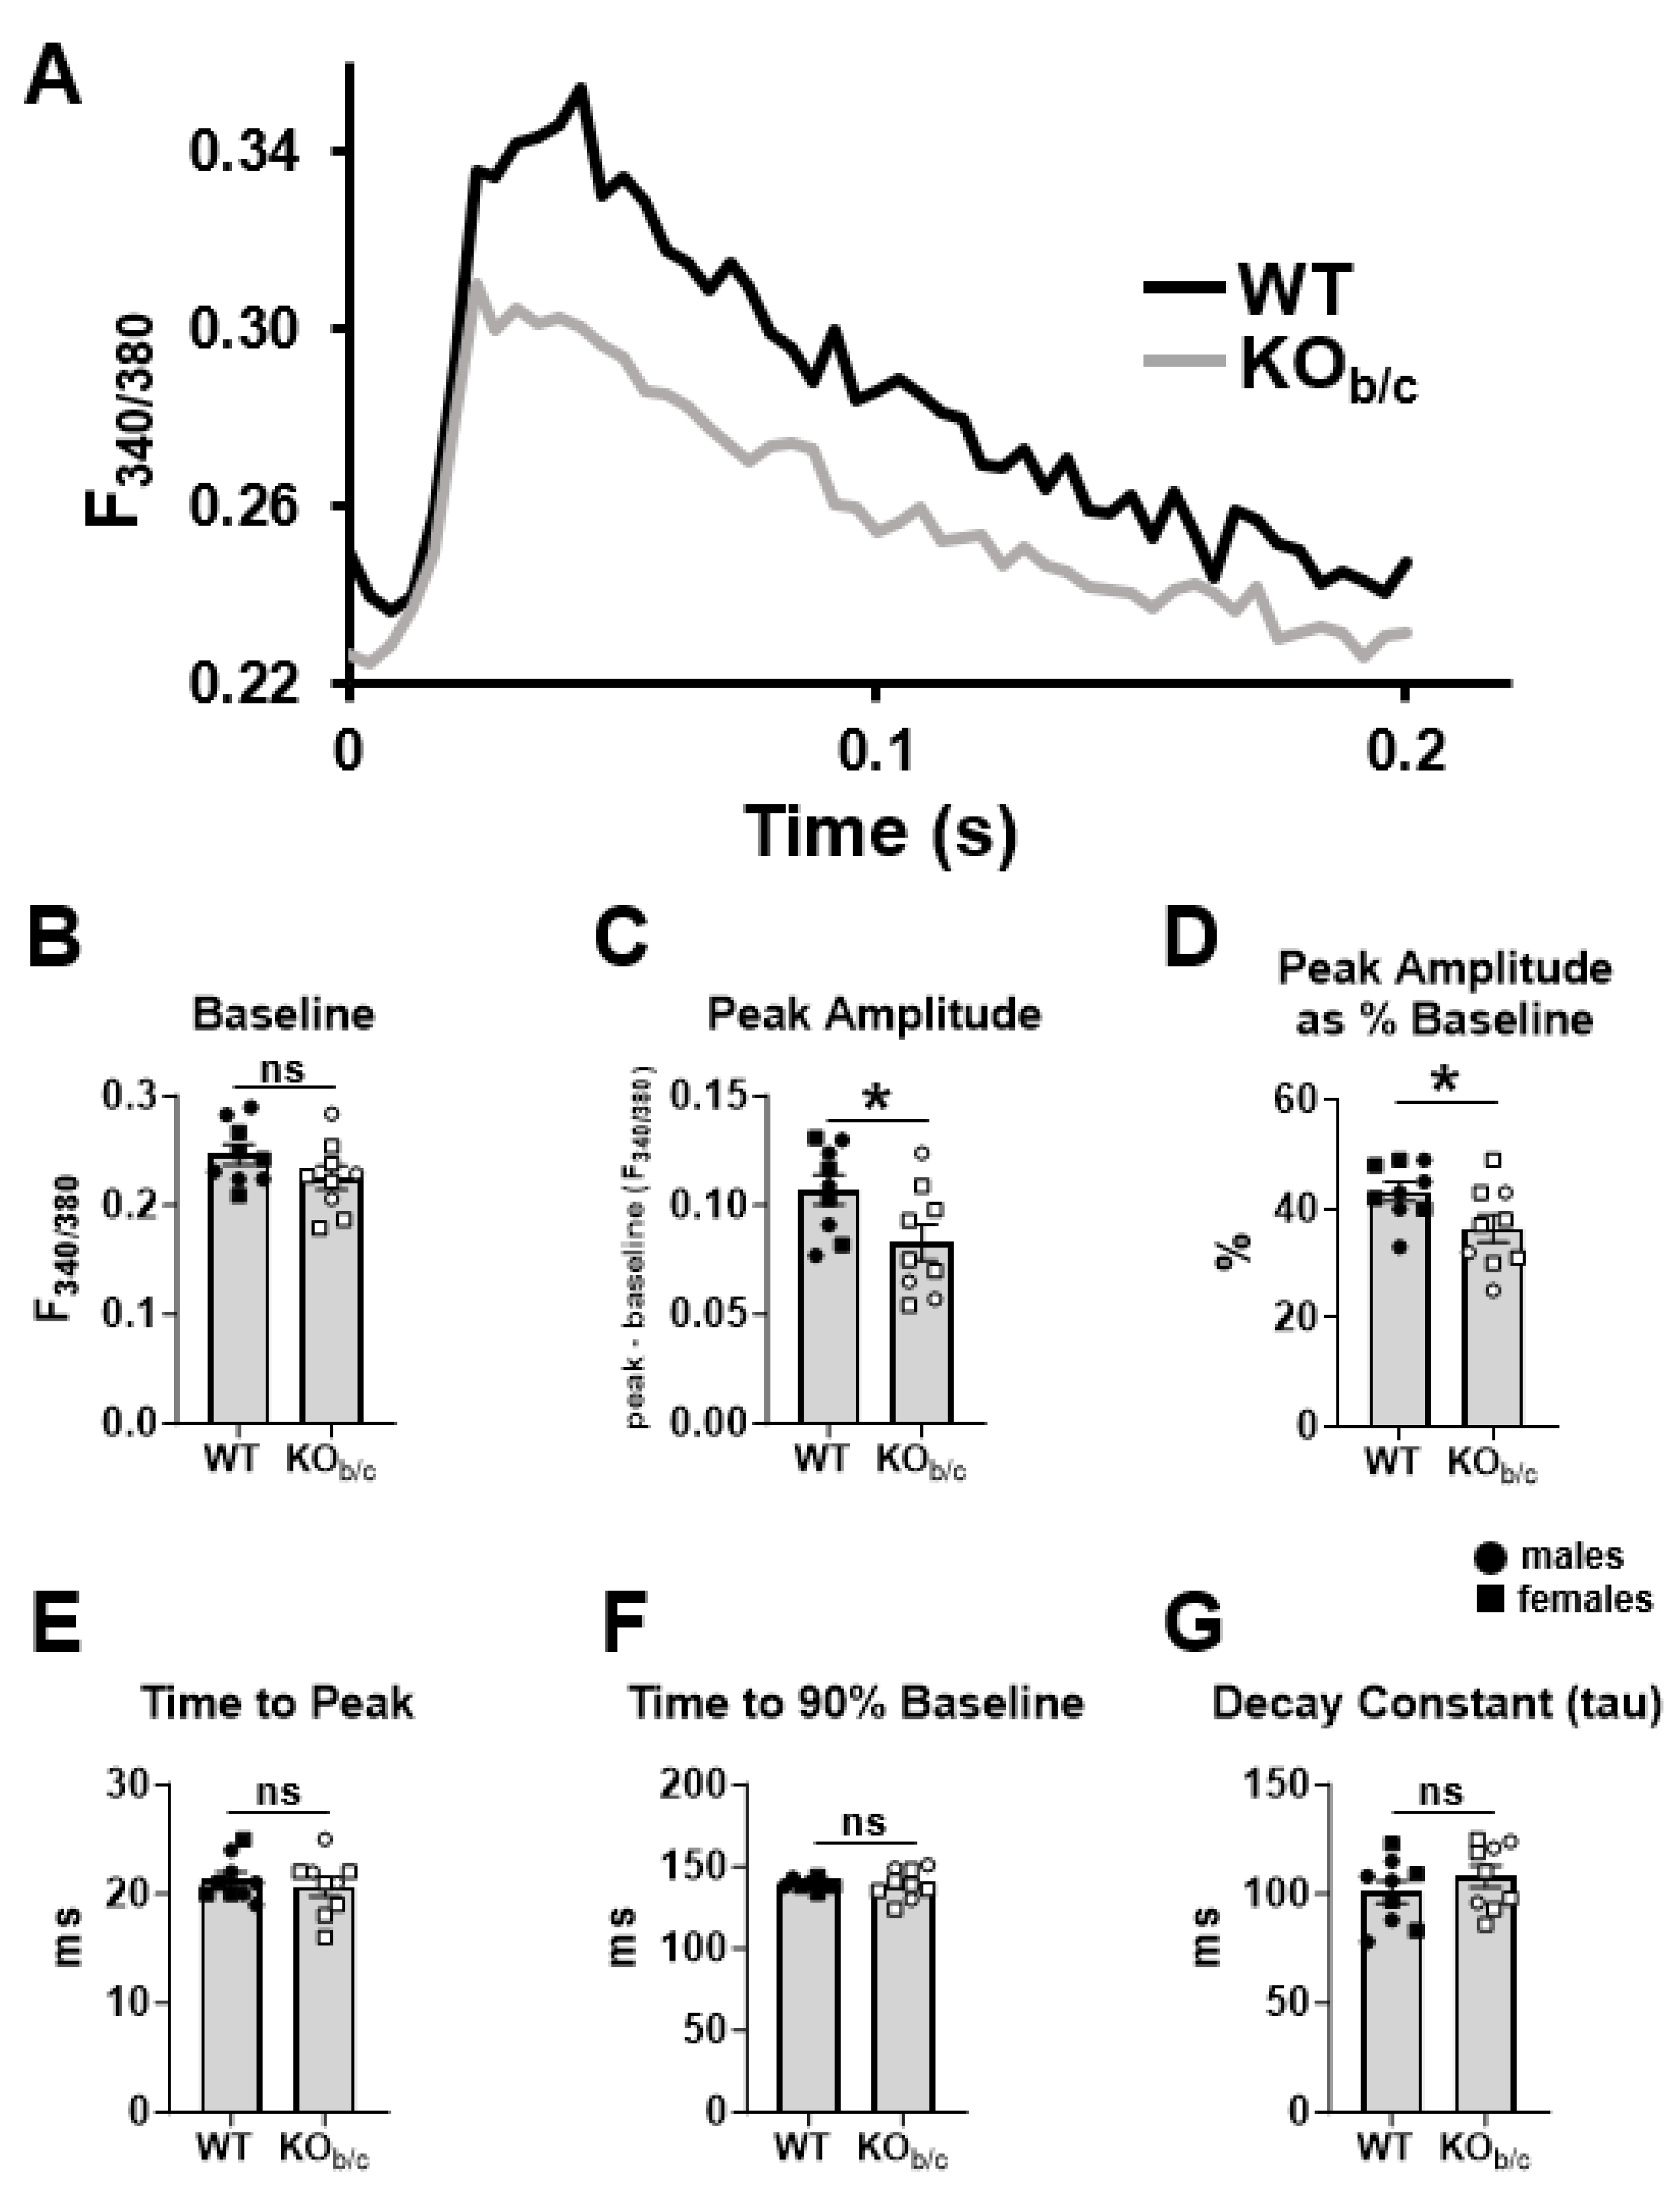
2.4. Cardiomyocytes from KOb/c Mice Have Diminished Ca2+-Transient Amplitude

We tested the effect of congenital NBCe1-B absence on cardiomyocyte Ca2+ dynamics by measuring Ca2+ transients in freshly isolated cardiomyocytes from WT and KOb/c mice loaded with Fura-2 AM and paced at 5 Hz. Figure 8A shows representative WT (black) and KOb/c (gray) average transients obtained from individual cardiomyocytes. We found no significant difference in ‘baseline’ F340/380 between WT and KOb/c cardiomyocytes (WT: 0.246 ± 0.009 F340/380, KOb/c: 0.225 ± 0.011 F340/380, p = 0.146, n = 9 for both groups; Figure 8B). However, we found that the F340/380 ‘peak amplitude’, which represents the magnitude of Ca2+ influx into the sarcoplasm, was significantly decreased in KOb/c cardiomyocytes (WT: 0.107 ± 0.007 F340/380, KOb/c: 0.083 ± 0.008 F340/380, p = 0.034, n = 9 for both groups; Figure 8C). Similarly, peak amplitude as a percentage of the baseline (‘peak amplitude as % baseline’), a parameter that reflects the percent change in the Ca2+ transient from its baseline, was also significantly reduced in KOb/c cardiomyocytes (WT: 43 ± 2%, KOb/c: 36 ± 3%, p = 0.040, n = 9 for both groups; Figure 8D). On the other hand, there was no significant difference in the F340/380 ‘time to peak’ between WT and KOb/c cardiomyocytes (WT: 21 ± 1 ms, KOb/c: 21 ± 1 ms, p = 0.516, n = 9 for both groups; Figure 8E), suggesting that the kinetics of Ca2+ release are not impaired in KOb/c cardiomyocytes. There was also no significant difference in either ‘time to 90% baseline’ (WT: 139 ± 1 ms, KOb/c: 139 ± 3 ms, p = 0.960, n = 8 and 9, respectively; Figure 8F) or in the exponential decay constant ‘tau’ (WT: 101 ± 5 ms, KOb/c: 108 ± 5 ms, p = 0.262, n = 9 for both groups; Figure 8G), both of which reflect Ca2+ removal from the sarcoplasm of cardiomyocytes.

3. Discussion

The first key finding of this study is that 4–5-week-old KOb/c mice have left ventricular systolic dysfunction with reduced ejection fraction, which to our knowledge is the first demonstration of a mechanical cardiac impairment resulting from the absence of NBCe1-B. Specifically, the echocardiographic and IVC occlusion data (Figure 2 and Figure 5) together suggest that KOb/c mice have a reduced ejection fraction due to a reduction in load-independent contractility. This is likely a result of a diminished systolic phase [Ca2+]i peak within individual cardiomyocytes, as we observed a significant reduction in F340/380 transient peak amplitude in paced KOb/c cardiomyocytes (Figure 8C,D). That is, since the contractile force generated by a cardiomyocyte is a function of the magnitude of rise in [Ca2+]i [35], the reduction in Ca2+-transient amplitude within individual KOb/c cardiomyocytes likely underlies the overall decrease in contractility of the KOb/c heart, ultimately resulting in a reduced ejection fraction. Additionally, we found no signs of hypertrophy or impaired relaxation in KOb/c mice, supporting that the impaired contractility is intrinsic to cardiomyocyte function and not a result of pathologic cardiac remodeling.
The second key finding is that while we did not observe QT interval prolongation in KOb/c mice, we did find an increase in QT length variation (Figure 7D,E). This suggests that KOb/c mice are at increased risk for arrhythmia, which is supported by a position statement published in the European Society of Cardiology summarizing evidence that increased QT variation is predictive of arrhythmia and sudden cardiac death [36]. Variation in QT duration at a constant heart rate is a consequence of variability in ventricular repolarization, which itself is affected by variations in the pattern of ventricular activation, conduction velocity, and/or action potential duration (APD) (reviewed in [36]). The latter is the most likely explanation for our findings in the KOb/c mouse, since previous studies have demonstrated a prolonged APD in cardiomyocytes with reduced NBCe1-B expression [32,33]. However, APD is also affected by Ca2+, such that a spontaneous release of Ca2+ from the sarcoplasmic reticulum during diastole can prolong the APD [37]. Thus, a possible unifying mechanism connecting the absence of NBCe1-B to both systolic dysfunction and increased QT length variation may be the presence of a diastolic Ca2+ leak from the sarcoplasmic reticulum.
This possibility of a diastolic Ca2+ leak resulting from NBCe1-B loss is further supported by a recent study in which cardiac NBCe1-B expression was partially (~30%) reduced in adult rats using an adenoviral vector [32]. In particular, the authors report no change in stimulated Ca2+-transient parameters in isolated cardiomyocytes; however, the frequency of diastolic Ca2+ waves were increased in unstimulated cardiomyocytes, a result indicative of spontaneous sarcoplasmic reticulum Ca2+ release. Thus, alongside our observations in KOb/c mice of reduced Ca2+-transient amplitude in cardiomyocytes and increased QT length variation, these results together suggest that NBCe1-B loss may lead to a diastolic sarcoplasmic reticulum Ca2+ leak [38,39,40,41,42,43], a hypothesis that awaits further investigation.
Important differences exist between the previous study of rats with partial reduction in cardiac NBCe1-B and this study of KOb/c mice. Namely, the authors of the previous study provide evidence of cardiac hypertrophy, prolongation of the QT interval, and prolongation of the APD in isolated cardiomyocytes, resulting from the partial reduction in cardiac NBCe1-B [32]. However, no change in cardiac function was found in these rats when assessed by echocardiography [32]. Similarly, in a third study, in which Cre-Lox gene targeting was used to selectively disrupt cardiac NBCe1-B expression in mice (~70% reduction in NBCe1-B mRNA), a significant protective effect of NBCe1-B reduction was found during ischemia–reperfusion injury [44]. However, there was no change in cardiac function found when assessed by intraventricular pressure measurements.
Differences in species, age, as well as complete (this study) versus partial loss (previous studies [32,44]) of NBCe1-B expression may contribute to the differences in study results. Notably, the previous study in rats did not specify sex [32], and the previous study in mice only used males [44]. Important sex differences may exist, as previous studies demonstrate that cardiac NBCe1 activity is diminished in female rats after ovariectomy [45], suggesting that the loss of NBCe1 may play a larger role in female cardiomyocytes. Thus, it is possible that cardiac NBCe1 loss may be more detrimental to females than males. Our data were not sufficiently robust to determine whether sex was an influential factor for our observations, and thus, it remains possible that the features of the group are not reflective of the features of both sexes. Regarding the compensatory upregulation of NBCn1 and NHE1 observed by others in NBCe1 knockdown models, we did not discern a significant difference in their abundance between WT and KOb/c hearts using quantitative PCR (NBCn1: 2ΔΔCt = 0.98, p = 0.65; NHE1: 2ΔΔCt = 1.03, p = 0.74; n = 3 females,) but cannot discount the possibility that these transporters are post-transcriptionally activated in our model. We note that, according to RNAseq (GEO repository accession GSE223324), ~1500 genes are significantly differentially expressed between WT and KOb/c hearts. Thus, the mechanisms underlying the observed phenotype are likely to be complex.
It is important to note that we were restricted to using animals between 4–5 weeks of age since the early mortality in KOb/c mice (50% mortality at 5 weeks) made it impractical to use adult KOb/c mice [29]. Therefore, it is possible that we observed KOb/c mice at an early stage of heart failure, where there is adequate compensation such that structural changes have yet to develop. Furthermore, the small size of the mice necessitated an invasive approach to intraventricular catheterization, which restricted our ability to titrate the heart rates of WT and KOb/c mice like we did for the less invasive echocardiographic and ECG assessments. Specifically, for the intraventricular catheterization experiments, anesthetic depth was determined to be reached once the pedal reflex was absent. This level of anesthesia apparently had a greater effect on this particular cohort of KOb/c mice (although this was not the case in general), as we observed a significantly slower heart rate in KOb/c mice during these intraventricular catheterization experiments. Intriguingly, however, despite the slower heart rate, we observed no significant difference between WT and KOb/c volume-dependent parameters (Figure 4). Moreover, KOb/c stroke volume was maintained (Figure 2E) at the expense of a greater EDV (Figure 2D), which all together suggests that the Frank–Starling mechanism is adequately compensating for the innate impairment in myocardial contractility.
Thus, we believe that the intrinsic reduction in KOb/c cardiac contractility, due to a decreased cardiomyocyte Ca2+-transient amplitude, requires an elevated EDV to maintain adequate end-diastolic pressure, stroke volume, and overall cardiac output. We cannot rule out the possibility that, if KOb/c mice could grow older, this compensation may start to fail, leading to greater elevations in end-diastolic volume and pressure that could lead to structural changes such as concentric and eccentric hypertrophic remodeling. However, the absence of hypertrophy (or to be clear, the absence of detectable signs of hypertrophy within the short lifespan of these mice), is unexpected only inasmuch as it is different from observation of the virally induced NBCe1-knockdown rat model [32]. As an observation in itself, it is not unusual that left ventricular dysfunction (or even heart failure) can develop without hypertrophy when the pathology is unrelated to pressure and/or volume overload.
The literature relating NBCe1 to cardiac hypertrophy is complicated. Some studies correlate pressure-induced hypertrophy with increased NBCe1 expression (e.g., [46]). Cardiac hypertrophy has not been reported in humans with NBCe1 loss. In that context, it is perhaps the observation of hypertrophy in the NBCe1-knockdown rat model, without pressure overload, which is unexpected. In that model, 28 days of virally induced NBCe1 knockdown in adult rats is consistent with an increase in frequency of spontaneous Ca2+ release from the SR (without a change in peak amplitude) and an increase in RNA for NBCn1 and NHE1 that could compromise NCX activity and cause a hypertrophic elevation in intracellular Ca2+ [32]. Those authors are careful to note that this is just a hypothesis and that the actual cause may be far more complex. In contrast, our mice lack NBCe1-B congenitally and barely survive 28 days. We report a reduced peak amplitude of Ca2+ release and no change in the abundance of RNA for NBCn1 or NHE1. Thus, our mice do not clearly conform to the rat model/hypothesis regarding hypertrophy. The reasons for the disparity are unknown. Evidently, these two models of NBCe1 ablation have very different cellular effects but ought not be taken as evidence that KOb/c mice are resistant to hypertrophy.
In summary, we have described a phenotype of left ventricular systolic dysfunction in KOb/c mice that is likely a result of diminished Ca2+-transient amplitude in cardiomyocytes. Additionally, the congenital absence of NBCe1-B led to increased QT length variation. Overall, this study adds to the growing body of literature in rodent models supporting the notion that alterations in acid-base transporter expression/activity can be central drivers of cardiac pathophysiology. However, it is critical to take view these observations in context: these data report the cardiac phenotype of KOb/c mice rather than the effects of NBCe1-B loss from the heart. This is a crucial distinction because NBCe1-B and NBCe1-C are expressed in locations throughout the body including the central and peripheral nervous systems as well as various endocrine glands and throughout the gastrointestinal system. To assess the cardiac-specific role of NBCe1-B, confirmatory studies will need to be performed in mice with a cardiomyocyte-specific deletion of NBCe1-B. It is only in a cardiomyocyte-specific deletion model that mechanistic studies elucidating the role of NBCe1-B in the heart can be performed with full confidence that the data will not influenced by unmeasured neuronal, endocrine, or nutritional disturbances. Our data suggest that the cardiac function of individuals with NBCe1 loss ought to be carefully monitored and reported in future, both to ensure that development of heart failure is not missed and to assess the translational usefulness of our model.

4. Materials and Methods

4.1. Mice

The generation and genotyping of the KOb/c mouse on a C57BL/6J background have been previously reported [29], with mice genotyped at 2 weeks of age. For this study, heterozygous parents were produced by backcrossing heterozygous mice with verified wild-type (WT) C57BL/6J mice (Jackson Laboratory, Bar Harbor, ME, USA). Heterozygous progeny (F6 to F17 generation, making them at least 99% genetically identical) were crossed to produce experimental WT and KOb/c mice for this study. As previously reported, KOb/c mice exhibit increased mortality (50% at 5 weeks [29]) so we were constrained to working with mice between 4–5 weeks of age in order to maximize the likelihood of survival during study. The total number of WT mice used was 38 and the total number of KOb/c mice used was 37.

4.2. Blood Pressure

Non-invasive blood pressure measurements were taken using the CODA monitor tail-cuff system (Kent Scientific, Torrington, CT, USA). The mice were placed in a restraint that allows free access to the tail and placed on a heating pad (37 °C). The mice were left for 10 min to thermoregulate and acclimatize to the restraint before their blood pressure was taken.

4.3. Echocardiography

The mice were anesthetized with 1% isoflurane, and their heart rate was maintained between 300–500 BPM (beats per minute) with 0.5–1% isoflurane. The mice were kept on a warming pad (37 °C), secured in a supine position, and their chest hair was removed using calcium hydroxide cream (Nair). A 14 MHz probe (GE Vivid E9) was used to image the left ventricle in the short axis. Two-dimensional M-mode recordings of the left ventricle were obtained at the papillary muscle level and used for analysis of cardiac function. The width of the left ventricular anterior and posterior walls (LVAW and LVPW) and the left ventricular internal diameter (LVID) during systole (s) and diastole (d) were manually measured from the M-mode images. Fractional shortening (FS) was calculated as FS = [(LVIDd − LVIDs)/LVIDd] × 100%. End-systolic volume (ESV) and end-diastolic volume (EDV) were calculated from the LVIDs and LVIDd using the method established by Teichholz et al. [47,48]: ESV = 7/[2.4 + LVIDs] × [LVIDs]3 and EDV = 7/[2.4 + LVIDd] × [LVIDd]3. Stroke volume (SV) was calculated as SV = EDV − ESV. Ejection fraction was calculated as EF = SV/EDV × 100%.

4.4. Electrocardiogram (ECG) Recording and Analysis

The mice were anesthetized with 1% isoflurane, and their heart rate was maintained between 300–500 BPM with 0.5–1% isoflurane. The mice were kept on a warming pad and secured in a supine position on a Mouse Monitor S (Indus Instruments, Webster, TX, USA) and recorded for 30 s according to the recommended manufacturer’s settings. Voltage and time parameters from Lead I were exported to MATLAB R2020b (version 9.9.0) and analyzed using the ‘Signal Analyzer App’ from the Signal Processing Toolbox (available through MATLAB Add-On Explorer) and BioSigKit [49] (available at https://github.com/hooman650/BioSigKit; accessed on 22 March 2019) modified in-house to calculate QT intervals (code available upon request). In particular, the T-wave was identified using a modification of the method demonstrated by Zhang et al. [50]; here, the T-wave was defined as the point after the J-wave where the derivative of the average trace equals zero. This enabled reliable identification of entirely positive T-waves (i.e., those that do not return to the isoelectric baseline) as well as T-waves with a negative undershoot. QT length variation was calculated as the coefficient of variation (SD/mean) across 5 s intervals from a continuous 30 s ECG trace (i.e., 6 × 5 s intervals) from Lead I.

4.5. Intraventricular Admittance Catheter-Derived Pressure–Volume (PV) Analysis

The mice were anesthetized using 1% isoflurane and were maintained at a surgical plane of anesthesia (1–2% isoflurane) as assessed by the absence of pedal reflex (toe pinch). The mice were kept on warming pad (37 °C), secured in a supine position, and their chest and abdominal hair was removed using calcium hydroxide cream (Nair). The trachea was intubated using a 22 g polyethylene catheter and ventilated with room air supplemented with O2 (1 L/min) at a rate of 150–200 strokes/min and tidal volume of 200–500 µL using a small animal ventilator (Inspira ASV, Harvard apparatus, Holliston, MA, USA). The chest cavity was accessed by making a horizontal surgical incision below the xyphoid process, and the diaphragm was bluntly dissected to expose the heart apex. Cautery was used to minimize bleeding. A 27 g needle was used to puncture the apex of the myocardium to advance a 1.2 F microtip PV catheter (Transonic Systems, Ithaca, NY, USA) into the left ventricular cavity. PV signals were continuously recorded using an ADV500 PC conductance system (Transonic Systems) coupled to a PowerLab/8SP analog-to-digital converter (AD Instruments, Colorado Springs, CO, USA). PV loop data were analyzed using LabChart (v8, AD Instruments). To obtain load-independent measures of contractility, preload reduction was accomplished by threading silk suture around the inferior vena cava (IVC) and gently pulling up for ~5 s to briefly reduce blood flow to the right atrium (i.e., IVC occlusion). The end-systolic and end-diastolic PV relationships were assessed by fitting a linear equation to end-systolic/diastolic PV points of 5–16 cardiac cycles. Additional points from cardiac cycles that resulted in a negative slope were attributed to volume/pressure reduction impairing cardiac perfusion and were excluded.

4.6. Histological Analysis

The mice were euthanized by isoflurane (5%) inhalation overdose followed by cervical dislocation. Their hearts were excised and placed in a 1 M KCl solution (prepared in PBS: 46-013-CM, Corning Life Sciences, Corning, NY, USA) to arrest the heart in diastole. The hearts were sectioned into 500 µm transverse sections through the left ventricle using a metal scaffold to ensure the slices occurred in similar locations between hearts. The tissue was immediately placed in 4% paraformaldehyde for 24 h at 4 °C and then stored in a 70% ethanol solution at 4 °C until embedding. The tissue was then embedded in paraffin blocks using standard embedding procedures. Briefly, the tissue was dehydrated through incubations in 80% and 95% ethanol, 45 min each, followed by 3 changes of 100% ethanol, 1 h each. The tissue was cleared through 2 changes of xylene, 1 h each, and placed in molten paraffin overnight (H-PF, General Data, Cincinnati, OH, USA), followed by embedding in paraffin blocks. The gross heart sections were further sectioned at a thickness of 5 μm, mounted on frosted slides, and dried at 37 °C overnight. For hematoxylin and eosin staining (H&E), sections were deparaffinized, rinsed with DI water, and stained with H&E according to manufacturer’s instructions (Abcam, Waltham, MA, USA; hematoxylin ab220365, eosin ab246824). Sections were dehydrated with graded ethanol solutions and xylene and mounted for light microscopy. High-magnification (40×; Leica DM 6B upright microscope; Leica Microsystems, Deerfield, IL, USA.) images were taken around the left ventricle (5 images per section), and the cross-sectional area of 25–29 cardiomyocytes per mouse, in which the nucleus could clearly be visualized in the center of the cell, was measured using FIJI software (ImageJ; https://fiji.sc/; accessed 27 August 2019).

4.7. Cardiomyocyte Isolation

Cardiomyocytes were isolated from fresh heart tissue using a Langendorff-free method based on the methods described by Ackers et al. [51] and Farrugia et al. [52]. Briefly, mice were euthanized by an intraperitoneal injection of Fatal-Plus (sodium pentobarbital, 0.3 mg/g) and after reaching proper anesthetic depth (assessed by absence of pedal reflex) the thoracic cavity was opened. The descending aorta and inferior vena cava were cut, and the right ventricle was rapidly perfused with 10 mL of ice-cold EDTA buffer solution over ~3 min (in mM: 130 NaCl, 5 KCl, 0.5 NaH2PO4, 10 HEPES, 10 Glucose, 10 BDM, 10 Taurine, 5 EDTA). The ascending aorta was then clamped, and the heart was excised to a dish containing warm (37 °C) EDTA buffer, and 15 mL of pre-warmed EDTA buffer was injected into the left ventricle. The heart was then transferred to a Petri dish containing pre-warmed (37 °C) collagenase buffer (enzymes [in mg/mL: 0.5 Collagenase II, 0.5 Collagenase IV, 0.05 Protease XIV; Worthington Biochemical] prepared in magnesium buffer [in mM: 130 NaCl, 5 KCl, 0.5 NaH2PO4, 10 HEPES, 10 Glucose, 10 BDM, 10 Taurine, 1 MgCl2]), and the left ventricle was perfused with 25–40 mL of pre-warmed collagenase buffer until digested. The left ventricle was separated and moved to a new dish of pre-warmed collagenase buffer and teased apart to release individual cardiomyocytes. The cell suspension was then incubated in 5 mL of collagenase buffer for 5 min at 37 °C, gently mixed, and incubated for another 5 min before filtering with 100 µm mesh into 5 mL of 5% fetal bovine solution (FBS, Thermo Fisher Scientific, Grand Island, NY, USA; prepared in magnesium buffer) in order to stop the digestion. The cell suspension was then centrifuged at 51 G for 2 min to loosely pellet the cells and then resuspended in 10 mL of fresh 5% FBS. Reintroduction of Ca2+ took place over 4 changes of supernatant each with a 10 min incubation (pelleting cells in between each change), increasing the [Ca2+] with each change (in mM: 0.07, 0.27, 0.68, 1.35) resulting in a final [Ca2+] of 1.35 mM. The Ca2+ reintroduction solutions were prepared by diluting Ca2+-containing HCO3 buffer (in mM: 118 NaCl, 5 KCl, 10 Glucose, 5 HEPES, 20 NaHCO3, 0.8 MgCl2, 1.35 CaCl2, 1.2 MgSO4; aerated with 5% CO2, 21% O2, and 74% N2, pH 7.4) with magnesium buffer to obtain the correct [Ca2+].

4.8. Ca2+ Transient Recordings and Analysis

A total of 5 µL of Pluronic F-127 (20% w/v prepared in DMSO; ThermoFisher, P6867) and 1 µL Fura-2 AM (1 mM prepared in DMSO; Abcam, ab120873) were added to a 1 mL aliquot of the cell suspension, leading to final concentrations of 0.1% and 1 µM, respectively, and incubated for 20 min protected from light. The cells were then loaded into a perfusion chamber (IonOptix, Westwood, MA, USA) and perfused with the Ca2+-containing HCO3 buffer at 3 mL/min maintained at 30 °C. The cells were perfused for 10 min to allow for desertification of the Fura-2 AM before the start of the experiment. The cardiomyocytes were stimulated using platinum wires positioned on opposite sides of the chamber with a 4 ms positive waveform at a frequency of 5 Hz using the MyoPacer stimulator (IonOptix). The voltage was adjusted until ~50% of the cell field was contracting, generally between 10–20 V. Evoked Ca2+ transients were recorded using a dual-excitation spectrophotometer (IonOptix). Specifically, the 510 nm emission at alternating excitation wavelengths of 340 nm and 380 nm was recorded in individual cardiomyocytes for ~60 s followed by ~20 s focused on an empty field of view to record the background. The recording sampling frequency was set to 250 Hz. The background was subtracted from the 340 nm and 380 nm emission recordings, and the resulting 340/380 ratio (F340/380) waveform was analyzed using IonWizard software (IonOptix, version 7.3.0). For each cell, the F340/380 waveform was averaged into a single transient for analysis (~100 individual transients).

4.9. Real-Time PCR

Hearts from female WT and KOb/c mice (n = 3 per group) were excised and stored in RNAlater (Thermo Fisher Scientific) until homogenization and RNA purification using the RNeasy Micro Kit (Qiagen, Germantown, MD, USA). Resulting total-RNA was quantified using a Nanodrop 2000 (ThermoFisher). Real-time PCR was performed according to the manufacturers’ recommendations using PrimePCR SYBR green assays (BioRad, Hercules, CA, USA) for mouse NBCn1 (Slc4a7: qMmuCID0021763), NHE1 (Slc9a1: qMmuCID0010387) and the control genes Gapdh (assay qMmuCED0027497) and Pol2ra (assay qMmuCID0005230). NBCn1 and NHE1 transcript abundance was normalized for the combined average abundance of Gapdh and Pol2ra [53] using the Livak equation.4.10. Statistical Analysis
The results are presented as mean ± SEM, with n referring to the number of animals studied. After exploratory data collection to n = 6 for each experiment, the ultimate sample size required for 80% power and a significance threshold of α = 0.05 for the difference between means and their common standard deviation was guided using an online calculator hosted by the University of British Columbia (StatSpace, https://www.stat.ubc.ca/~rollin/stats/ssize/n2.html, accessed 1 September 2019). Outliers for any individual parameter were defined a priori as any point >2 standard deviations from the mean and were excluded from analysis (amounting to no more than 2 data points excluded per group). The number (n) of outliers for any given parameter is reported in the appropriate figure legend. In all the analyses, the threshold of p < 0.05 was used to determine statistical significance. Normality of the data was tested in GraphPad (v9.0) using the D’Agostino–Pearson omnibus test. Statistical significance between WT and KOb/c groups was calculated using Student’s T-test (2-tailed). For cell-based studies (Figure 6C and Figure 8), we performed hierarchical statistical analyses (nested T-tests) to account for inter-subject variability and dependence between samples. Due to the low fertility and high mortality of KOb/c mice, we were obliged to use male and female mice non-discriminately throughout this study based on availability at the time of each experiment. As a consequence, we find that our data are not sufficiently robust to assess the importance of sex as a biological variable [54]. All the analyses were performed in Microsoft Excel, Prism GraphPad version 9, G × Power (http://www.gpower.hhu.de, accessed 25 July 2024), or IBM SPSS (v29). The figures were prepared using Microsoft PowerPoint v2408, Microsoft Excel v2408, Prism GraphPad version 9, and BioRender.com.

Author Contributions

C.T.B., B.R.W., J.K.L., M.E.D. and M.D.P. conceived and designed research. C.T.B., A.M., L.A.E., T.M.P. and J.K.L. performed experiments. C.T.B., T.M.P., J.K.L. and M.D.P. analyzed data. C.T.B., B.R.W., J.K.L., M.E.D. and M.D.P. interpreted the results of experiments. C.T.B. prepared figures. C.T.B. drafted the manuscript. C.T.B., T.M.P., B.R.W., J.K.L. and M.D.P. edited and revised the manuscript. All authors have read and agreed to the published version of the manuscript.

Funding

This work was supported by an F30 grant from the NIH National Institute of Diabetes and Digestive and Kidney Diseases (DK126330, C.T.B.), a Stephen Besch Scholarship through the University at Buffalo (C.T.B.), an R01 grant from the NIH National Eye Institute (EY028580, M.D.P.), and a grant from the US Department of Veterans Affairs (IK2BX004097, J.K.L.).

Institutional Review Board Statement

All procedures involving animals were approved by and performed in accordance with the rules and recommendations of the Institutional Animal Care and Use Committee of the University at Buffalo.

Data Availability Statement

The original contributions presented in this study are included in this article, further inquiries can be directed to the corresponding authors.

Acknowledgments

We are grateful for the assistance of the veterinary staff of the Laboratory Animal Facility at JSMBS. We also thank Bianca Quade, Regina Cooper, and Myles Pearson at the University at Buffalo for helpful discussions.

Conflicts of Interest

The authors declare no conflicts of interest.

References

  1. Liu, Y.; Sheng, W.; Wu, J.; Zheng, J.; Zhi, X.; Zhang, S.; Gu, C.; Guo, D.; Wang, W. Case Report: Altered Pre-mRNA Splicing Caused by Intronic Variant c.1499 + 1G > A in the SLC4A4 Gene. Front. Pediatr. 2022, 10, 890147. [Google Scholar] [CrossRef]
  2. Gil-Perotín, S.; Jaijo, T.; Verdú, A.G.; Rubio, P.; Mazón, M.; Gasqué-Rubio, R.; Díaz, S. Epilepsy, Status Epilepticus, and Hemiplegic Migraine Coexisting with a Novel SLC4A4 Mutation. Neurol. Sci. 2021, 42, 3647–3654. [Google Scholar] [CrossRef]
  3. Yan, L.; Wenhong, W.; Meifang, L.; Wenyu, C. Severe proximal renal tubular acidosis with ocular abnormalities caused by SLC4A4 gene variation: A case report. Chin. J. Pediatr. 2020, 58, 241–242. [Google Scholar] [CrossRef]
  4. Khan, A.O.; Basamh, O.S. Pediatric Primary Calcific Band Keratopathy with or without Glaucoma from Biallelic SLC4A4 Mutations. Ophthalmic Genet. 2018, 39, 425–427. [Google Scholar] [CrossRef] [PubMed]
  5. Horita, S.; Simsek, E.; Simsek, T.; Yildirim, N.; Ishiura, H.; Nakamura, M.; Satoh, N.; Suzuki, A.; Tsukada, H.; Mizuno, T.; et al. SLC4A4 Compound Heterozygous Mutations in Exon–Intron Boundary Regions Presenting with Severe Proximal Renal Tubular Acidosis and Extrarenal Symptoms Coexisting with Turner’s Syndrome: A Case Report. BMC Med. Genet. 2018, 19, 103. [Google Scholar] [CrossRef]
  6. Patel, N.; Khan, A.O.; Al-Saif, M.; Moghrabi, W.N.; AlMaarik, B.M.; Ibrahim, N.; Abdulwahab, F.; Hashem, M.; Alshidi, T.; Alobeid, E.; et al. A Novel Mechanism for Variable Phenotypic Expressivity in Mendelian Diseases Uncovered by an AU-Rich Element (ARE)-Creating Mutation. Genome Biol. 2017, 18, 144. [Google Scholar] [CrossRef]
  7. Myers, E.J.; Yuan, L.; Felmlee, M.A.; Lin, Y.; Jiang, Y.; Pei, Y.; Wang, O.; Li, M.; Xing, X.; Marshall, A.; et al. A Novel Mutant Na+/HCO3 Cotransporter NBCe1 in a Case of Compound-heterozygous Inheritance of Proximal Renal Tubular Acidosis. J. Physiol. 2016, 594, 6267–6286. [Google Scholar] [CrossRef]
  8. Kari, J.A.; Desoky, S.M.E.; Singh, A.K.; Gari, M.A.; Kleta, R.; Bockenhauer, D. The Case | Renal Tubular Acidosis and Eye Findings. Kidney Int. 2014, 86, 217–218. [Google Scholar] [CrossRef] [PubMed]
  9. Lo, Y.-F.; Yang, S.-S.; Seki, G.; Yamada, H.; Horita, S.; Yamazaki, O.; Fujita, T.; Usui, T.; Tsai, J.-D.; Yu, I.-S.; et al. Severe Metabolic Acidosis Causes Early Lethality in NBC1 W516X Knock-in Mice as a Model of Human Isolated Proximal Renal Tubular Acidosis. Kidney Int. 2011, 79, 730–741. [Google Scholar] [CrossRef]
  10. Suzuki, M.; Paesschen, W.V.; Stalmans, I.; Horita, S.; Yamada, H.; Bergmans, B.A.; Legius, E.; Riant, F.; Jonghe, P.D.; Li, Y.; et al. Defective Membrane Expression of the Na+-HCO3 Cotransporter NBCe1 Is Associated with Familial Migraine. Proc. Natl. Acad. Sci. USA 2010, 107, 15963–15968. [Google Scholar] [CrossRef]
  11. Suzuki, M.; Vaisbich, M.H.; Yamada, H.; Horita, S.; Li, Y.; Sekine, T.; Moriyama, N.; Igarashi, T.; Endo, Y.; Cardoso, T.P.; et al. Functional Analysis of a Novel Missense NBC1 Mutation and of Other Mutations Causing Proximal Renal Tubular Acidosis. Pflug. Arch. Eur. J. Physiol. 2008, 455, 583–593. [Google Scholar] [CrossRef]
  12. Toye, A.M.; Parker, M.D.; Daly, C.M.; Lu, J.; Virkki, L.V.; Pelletier, M.F.; Boron, W.F. The Human NBCe1-A Mutant R881C, Associated with Proximal Renal Tubular Acidosis, Retains Function but Is Mistargeted in Polarized Renal Epithelia. Am. J. Physiol.-Cell Physiol. 2006, 291, C788–C801. [Google Scholar] [CrossRef]
  13. Demirci, F.Y.; Chang, M.; Mah, T.S.; Romero, M.E.F.; Gorin, M.B. Proximal Renal Tubular Acidosis and Ocular Pathology: A Novel Missense Mutation in the Gene (SLC4A4) for Sodium Bicarbonate Cotransporter Protein (NBCe1). Mol. Vis. 2006, 12, 324–330. [Google Scholar]
  14. Horita, S.; Yamada, H.; Inatomi, J.; Moriyama, N.; Sekine, T.; Igarashi, T.; Endo, Y.; Dasouki, M.; Ekim, M.; Al-Gazali, L.; et al. Functional Analysis of NBC1 Mutants Associated with Proximal Renal Tubular Acidosis and Ocular Abnormalities. JASN 2005, 16, 2270–2278. [Google Scholar] [CrossRef]
  15. Inatomi, J.; Horita, S.; Braverman, N.; Sekine, T.; Yamada, H.; Suzuki, Y.; Kawahara, K.; Moriyama, N.; Kudo, A.; Kawakami, H.; et al. Mutational and Functional Analysis of SLC4A4 in a Patient with Proximal Renal Tubular Acidosis. Pflug. Arch. Eur. J. Physiol. 2004, 448, 438–444. [Google Scholar] [CrossRef]
  16. Dinour, D.; Chang, M.-H.; Satoh, J.; Smith, B.L.; Angle, N.; Knecht, A.; Serban, I.; Holtzman, E.J.; Romero, M.F. A Novel Missense Mutation in the Sodium Bicarbonate Cotransporter (NBCe1/SLC4A4) Causes Proximal Tubular Acidosis and Glaucoma through Ion Transport Defects. J. Biol. Chem. 2004, 279, 52238–52246. [Google Scholar] [CrossRef]
  17. Igarashi, T.; Inatomi, J.; Sekine, T.; Seki, G.; Shimadzu, M.; Tozawa, F.; Takeshima, Y.; Takumi, T.; Takahashi, T.; Yoshikawa, N.; et al. Novel Nonsense Mutation in the Na+/HCO3− Cotransporter Gene (SLC4A4) in a Patient with Permanent Isolated Proximal Renal Tubular Acidosis and Bilateral Glaucoma. JASN 2001, 12, 713–718. [Google Scholar] [CrossRef]
  18. Deda, G.; Ekim, M.; Gfven, A.; Karagöl, U.; Tümer, N. Hypopotassemic Paralysis: A Rare Presentation of Proximal Renal Tubular Acidosis. J. Child. Neurol. 2001, 16, 770–771. [Google Scholar] [CrossRef]
  19. Shiohara, M.; Igarashi, T.; Mori, T.; Komiyama, A. Genetic and Long-Term Data on a Patient with Permanent Isolated Proximal Renal Tubular Acidosis. Eur. J. Pediatr. 2000, 159, 892–894. [Google Scholar] [CrossRef]
  20. Igarashi, T.; Inatomi, J.; Sekine, T.; Cha, S.H.; Kanai, Y.; Kunimi, M.; Tsukamoto, K.; Satoh, H.; Shimadzu, M.; Tozawa, F.; et al. Mutations in SLC4A4 Cause Permanent Isolated Proximal Renal Tubular Acidosis with Ocular Abnormalities. Nat. Genet. 1999, 23, 264–266. [Google Scholar] [CrossRef]
  21. Parker, M.D.; Boron, W.F. The Divergence, Actions, Roles, and Relatives of Sodium-Coupled Bicarbonate Transporters. Physiol. Rev. 2013, 93, 803–959. [Google Scholar] [CrossRef]
  22. Lee, H.-W.; Osis, G.; Harris, A.N.; Fang, L.; Romero, M.F.; Handlogten, M.E.; Verlander, J.W.; Weiner, I.D. NBCe1-A Regulates Proximal Tubule Ammonia Metabolism under Basal Conditions and in Response to Metabolic Acidosis. JASN 2018, 29, 1182–1197. [Google Scholar] [CrossRef]
  23. Brady, C.T.; Marshall, A.; Zhang, C.; Parker, M.D. NBCe1-B/C-Knockout Mice Exhibit an Impaired Respiratory Response and an Enhanced Renal Response to Metabolic Acidosis. Front. Physiol. 2023, 14, 1201034. [Google Scholar] [CrossRef]
  24. Choi, I.; Romero, M.F.; Khandoudi, N.; Bril, A.; Boron, W.F. Cloning and Characterization of a Human Electrogenic Na+-HCO3 Cotransporter Isoform (hhNBC). Am. J. Physiol.-Cell Physiol. 1999, 276, C576–C584. [Google Scholar] [CrossRef]
  25. Alsufayan, T.A.; Myers, E.J.; Quade, B.N.; Brady, C.T.; Marshall, A.; Haque, N.; Duffey, M.E.; Parker, M.D. Revisiting the Role of Ser982 Phosphorylation in Stoichiometry Shift of the Electrogenic Na+/qHCO3; Cotransporter NBCe1. Int. J. Mol. Sci. 2021, 22, 12817. [Google Scholar] [CrossRef]
  26. Bevensee, M.O.; Schmitt, B.M.; Choi, I.; Romero, M.F.; Boron, W.F. An Electrogenic Na+-HCO3 Cotransporter (NBC) with a Novel COOH-Terminus, Cloned from Rat Brain. Am. J. Physiol.-Cell Physiol. 2000, 278, C1200–C1211. [Google Scholar] [CrossRef]
  27. Virreira, M.; Jin, L.; Djerbib, S.; De Deken, X.; Miot, F.; Massart, C.; Svoboda, M.; Van Sande, J.; Beauwens, R.; Dumont, J.-E.; et al. Expression, Localization, and Regulation of the Sodium Bicarbonate Cotransporter NBCe1 in the Thyroid. Thyroid 2019, 29, 290–301. [Google Scholar] [CrossRef]
  28. Gawenis, L.R.; Bradford, E.M.; Prasad, V.; Lorenz, J.N.; Simpson, J.E.; Clarke, L.L.; Woo, A.L.; Grisham, C.; Sanford, L.P.; Doetschman, T.; et al. Colonic Anion Secretory Defects and Metabolic Acidosis in Mice Lacking the NBC1 Cotransporter. J. Biol. Chem. 2007, 282, 9042–9052. [Google Scholar] [CrossRef]
  29. Salerno, E.E.; Patel, S.P.; Marshall, A.; Marshall, J.; Alsufayan, T.; Mballo, C.S.A.; Quade, B.N.; Parker, M.D. Extrarenal Signs of Proximal Renal Tubular Acidosis Persist in Nonacidemic Nbce1b/c-Null Mice. JASN 2019, 30, 979–989. [Google Scholar] [CrossRef]
  30. De Giusti, V.C.; Ciancio, M.C.; Orlowski, A.; Aiello, E.A. Modulation of the Cardiac Sodium/Bicarbonate Cotransporter by the Renin Angiotensin Aldosterone System: Pathophysiological Consequences. Front. Physiol. 2014, 4, 411. [Google Scholar] [CrossRef]
  31. Lee, S.-K.; Occhipinti, R.; Moss, F.J.; Parker, M.D.; Grichtchenko, I.I.; Boron, W.F. Distinguishing among HCO3, CO3=, and H+ as Substrates of Proteins That Appear To Be “Bicarbonate” Transporters. JASN 2022, 34, 40–54. [Google Scholar] [CrossRef]
  32. Di Mattia, R.A.; Diaz-Zegarra, L.A.; Blanco, P.G.; Valverde, C.A.; Gonano, L.A.; De Giusti, C.J.; Portiansky, E.L.; Vila-Petroff, M.G.; Aiello, E.A.; Orlowski, A. The specific inhibition of the cardiac electrogenic sodium/bicarbonate cotransporter leads to cardiac hypertrophy. Life Sci. 2023, 312, 121219. [Google Scholar] [CrossRef]
  33. Orlowski, A.; Ciancio, M.C.; Caldiz, C.I.; Giusti, D.C.V.; Aiello, E.A. Reduced Sarcolemmal Expression and Function of the NBCe1 Isoform of the Na+–HCO3 Cotransporter in Hypertrophied Cardiomyocytes of Spontaneously Hypertensive Rats: Role of the Renin–Angiotensin System. Cardiovasc. Res. 2014, 101, 211–219. [Google Scholar] [CrossRef]
  34. Virani, S.S.; Alonso, A.; Benjamin, E.J.; Bittencourt, M.S.; Callaway, C.W.; Carson, A.P.; Chamberlain, A.M.; Chang, A.R.; Cheng, S.; Delling, F.N.; et al. Heart Disease and Stroke Statistics—2020 Update: A Report From the American Heart Association. Circulation 2020, 141, e139–e596. [Google Scholar] [CrossRef]
  35. Eisner, D.A.; Caldwell, J.L.; Kistamás, K.; Trafford, A.W. Calcium and Excitation-Contraction Coupling in the Heart. Circ. Res. 2017, 121, 181–195. [Google Scholar] [CrossRef]
  36. Baumert, M.; Porta, A.; Vos, M.A.; Malik, M.; Couderc, J.-P.; Laguna, P.; Piccirillo, G.; Smith, G.L.; Tereshchenko, L.G.; Volders, P.G.A. QT Interval Variability in Body Surface ECG: Measurement, Physiological Basis, and Clinical Value: Position Statement and Consensus Guidance Endorsed by the European Heart Rhythm Association Jointly with the ESC Working Group on Cardiac Cellular Electrophysiology. EP Eur. 2016, 18, 925–944. [Google Scholar] [CrossRef]
  37. Johnson, D.M.; Heijman, J.; Bode, E.F.; Greensmith, D.J.; van der Linde, H.; Abi-Gerges, N.; Eisner, D.A.; Trafford, A.W.; Volders, P.G.A. Diastolic Spontaneous Calcium Release From the Sarcoplasmic Reticulum Increases Beat-to-Beat Variability of Repolarization in Canine Ventricular Myocytes After β-Adrenergic Stimulation. Circ. Res. 2013, 112, 246–256. [Google Scholar] [CrossRef]
  38. Alim, C.C.; Ko, C.Y.; Mira Hernandez, J.; Shen, E.Y.; Baidar, S.; Chen-Izu, Y.; Bers, D.M.; Bossuyt, J. Nitrosylation of Cardiac CaMKII at Cys290 Mediates Mechanical Afterload-Induced Increases in Ca2+ Transient and Ca2+ Sparks. J. Physiol. 2022, 600, 4865–4879. [Google Scholar] [CrossRef]
  39. van Oort, R.J.; McCauley, M.D.; Dixit, S.S.; Pereira, L.; Yang, Y.; Respress, J.L.; Wang, Q.; De Almeida, A.C.; Skapura, D.G.; Anderson, M.E.; et al. Ryanodine Receptor Phosphorylation by Calcium/Calmodulin-Dependent Protein Kinase II Promotes Life-Threatening Ventricular Arrhythmias in Mice With Heart Failure. Circulation 2010, 122, 2669–2679. [Google Scholar] [CrossRef]
  40. Uchinoumi, H.; Yang, Y.; Oda, T.; Li, N.; Alsina, K.M.; Puglisi, J.L.; Chen-Izu, Y.; Cornea, R.L.; Wehrens, X.H.T.; Bers, D.M. CaMKII-Dependent Phosphorylation of RyR2 Promotes Targetable Pathological RyR2 Conformational Shift. J. Mol. Cell Cardiol. 2016, 98, 62–72. [Google Scholar] [CrossRef]
  41. Ai, X.; Curran, J.W.; Shannon, T.R.; Bers, D.M.; Pogwizd, S.M. Ca2+/Calmodulin–Dependent Protein Kinase Modulates Cardiac Ryanodine Receptor Phosphorylation and Sarcoplasmic Reticulum Ca2+ Leak in Heart Failure. Circ. Res. 2005, 97, 1314–1322. [Google Scholar] [CrossRef]
  42. Díaz, M.E.; Graham, H.K.; O’Neill, S.C.; Trafford, A.W.; Eisner, D.A. The Control of Sarcoplasmic Reticulum Ca Content in Cardiac Muscle. Cell Calcium 2005, 38, 391–396. [Google Scholar] [CrossRef]
  43. Belevych, A.E.; Terentyev, D.; Terentyeva, R.; Nishijima, Y.; Sridhar, A.; Hamlin, R.L.; Carnes, C.A.; Györke, S. The Relationship between Arrhythmogenesis and Impaired Contractility in Heart Failure: Role of Altered Ryanodine Receptor Function. Cardiovasc. Res. 2011, 90, 493–502. [Google Scholar] [CrossRef]
  44. Vairamani, K.; Prasad, V.; Wang, Y.; Huang, W.; Chen, Y.; Medvedovic, M.; Lorenz, J.N.; Shull, G.E. NBCe1 Na+-HCO3 Cotransporter Ablation Causes Reduced Apoptosis Following Cardiac Ischemia-Reperfusion Injury in Vivo. World J. Cardiol. 2018, 10, 97–109. [Google Scholar] [CrossRef]
  45. Ibañez, A.M.; Espejo, M.S.; Zavala, M.R.; Villa-Abrille, M.C.; Lofeudo, J.M.; Aiello, E.A.; De Giusti, V.C. Regulation of Intracellular pH Is Altered in Cardiac Myocytes of Ovariectomized Rats. JAHA 2019, 8, e011066. [Google Scholar] [CrossRef]
  46. Yamamoto, T.; Shirayama, T.; Sakatani, T.; Takahashi, T.; Tanaka, H.; Takamatsu, T.; Spitzer, K.W.; Matsubara, H. Enhanced activity of ventricular Na+-HCO3 cotransport in pressure overload hypertrophy. Am. J. Physiol. Heart Circ. Physiol. 2007, 293, H1254–H1264. [Google Scholar] [CrossRef]
  47. Teichholz, L.E.; Cohen, M.V.; Sonnenblick, E.H.; Gorlin, R. Study of Left Ventricular Geometry and Function by B-Scan Ultrasonography in Patients with and without Asynergy. N. Engl. J. Med. 1974, 291, 1220–1226. [Google Scholar] [CrossRef]
  48. Dele-Michael, A.O.; Fujikura, K.; Devereux, R.B.; Islam, F.; Hriljac, I.; Wilson, S.R.; Lin, F.; Weinsaft, J.W. Left Ventricular Stroke Volume Quantification by Contrast Echocardiography-Comparison of Linear and Flow-Based Methods to Cardiac Magnetic Resonance. Echocardiography 2013, 30, 880–888. [Google Scholar] [CrossRef]
  49. Sedghamiz, H. BioSigKit: A Matlab Toolbox and Interface for Analysis of BioSignals. JOSS 2018, 3, 671. [Google Scholar] [CrossRef]
  50. Zhang, Y.; Wu, J.; King, J.H.; Huang, C.L.-H.; Fraser, J.A. Measurement and Interpretation of Electrocardiographic QT Intervals in Murine Hearts. Am. J. Physiol. Heart Circ. Physiol. 2014, 306, H1553–H1557. [Google Scholar] [CrossRef]
  51. Ackers-Johnson, M.; Li, P.Y.; Holmes, A.P.; O’Brien, S.-M.; Pavlovic, D.; Foo, R.S. A Simplified, Langendorff-Free Method for Concomitant Isolation of Viable Cardiac Myocytes and Nonmyocytes From the Adult Mouse Heart. Circ. Res. 2016, 119, 909–920. [Google Scholar] [CrossRef] [PubMed]
  52. Farrugia, G.E.; McLellan, M.A.; Weeks, K.L.; Matsumoto, A.; Cohen, C.D.; Krstevski, C.; Gaynor, T.L.; Parslow, A.C.; McMullen, J.R.; Pinto, A.R. A Protocol for Rapid and Parallel Isolation of Myocytes and Non-Myocytes from Multiple Mouse Hearts. STAR Protoc. 2021, 2, 100866. [Google Scholar] [CrossRef] [PubMed]
  53. Li, Q.; Hu, T.; Chen, L.; Sun, J.; Xie, J.; Li, R.; Xu, B. Selection of reference genes for normalization of quantitative polymerase chain reaction data in mouse models of heart failure. Mol. Med. Rep. 2015, 11, 393–399. [Google Scholar] [CrossRef] [PubMed]
  54. Diester, C.M.; Banks, M.L.; Neigh, G.N.; Negus, S.S. Experimental design and analysis for consideration of sex as a biological variable. Neuropsychopharmacology 2019, 44, 2159–2162. [Google Scholar] [CrossRef] [PubMed]
Figure 1. Structure and expression of NBCe1 major isoforms. (A) An illustration of NBCe1-B protein topology. All NBCe1 isoforms have 14 transmembrane spans (TM1–14), with soluble N-terminal and C-terminal (Nt and Ct) domains located within the cytoplasm. A glycosylated extracellular loop joins TMs 5 and 6. (B) An illustration of sequence differences between NBCe1 isoforms. Due to an alternative upstream promoter that controls NBCe1-B translation, there is a different 85-amino acid (aa) Nt sequence in NBCe1-B (shown in blue) that replaces the first 41 aa residues of NBCe1-A (shown in red). NBCe1-C is identical to NBCe1-B except that the last 46 aa residues of the Ct sequence in NBCe1-B (shown in yellow) are replaced by a different 61 aa sequence (shown in grey) as a consequence of alternative splicing. (C) An illustration of the expression pattern of NBCe1 protein isoforms. The figure was created using BioRender.com.
Ijms 25 09610 g001
Figure 2. Echocardiography demonstrates impaired left ventricular function in KOb/c mice. (A) Representative cross-sectional M-mode images of the left ventricle of WT and KOb/c mice between 4–5 weeks of age. (B) Heart rates were titrated to between ~400–500 BPM via isoflurane anesthesia. (C) KOb/c mice were found to have significantly greater left ventricle internal diameters during diastole (LVIDd) and systole (LVIDs). (D) KOb/c mice also had significantly greater end-diastolic volume (EDV) and end-systolic volume (ESV) than WT mice as calculated from LVID measurements. (E) There was no significant difference in stroke volume between WT and KOb/c mice. (F) The fractional shortening of KOb/c mice was significantly less than that of WT mice. (G) The ejection fraction of KOb/c mice was significantly less than that of WT mice. Data presented as mean ± SEM, n = 11–14 per group. Outliers were defined a priori as any point >2 standard deviations from the mean and were excluded from analysis. WT outliers (n) were excluded from LVIDd (1), LVIDs (1), EDV (1), ESV (1), SV (1), FS (1), and EF (2) data sets. KOb/c outliers (n) were excluded from heart rate (1), LVIDd (1), LVIDs (1), EDV (1), ESV (1), SV (2), FS (2), and EF (2) data sets. A significant difference between WT and KOb/c groups is indicated in the figure by * p < 0.05, ** p < 0.01, and *** p < 0.001 calculated using Student’s unpaired 2-tailed T-test; ns (non-significant).
Ijms 25 09610 g002
Figure 3. Impaired left ventricular function in KOb/c mice is not attributable to differences in left ventricle wall thickness or systemic vascular resistance. During diastole there was no significant difference between the width of the WT and KOb/c left ventricle anterior (A) or posterior (B) wall. Similarly, during systole, there was no significant difference between the width of the WT and KOb/c left ventricle anterior (C) or posterior (D) wall. (E) There was no significant difference in systolic, diastolic, or mean arterial pressures of awake WT and KOb/c. Data presented as mean ± SEM, n = 11–14 per group (panels AD) or 7–11 per group (panel E). Outliers were defined a priori as any point >2 standard deviations from the mean and were excluded from analysis. WT outliers (n) were excluded from LVAWd (1), LVPWd (1), and LVPWs (1) data sets. KOb/c outliers (n) were excluded from LVAWd (1) and LVAWs (1) data sets. Statistical significance calculated using Student’s unpaired 2-tailed T-test; ns (non-significant).
Ijms 25 09610 g003
Figure 4. Left intraventricular pressure–volume (PV) assessment reveals no significant difference between WT and KOb/c mice in load-dependent measures of contractility or relaxation. There was no significant difference between WT and KOb/c left ventricular end-systolic pressure (A) or end-diastolic pressure (B). There was no significant difference between WT and KOb/c mice in their left ventricular maximum rate of pressure change (dP/dt max, representing load-dependent contractility) (C) or in their minimum rate of pressure change (dP/dt min, representing load-dependent relaxation) (D). Heart rates were titrated to between ~300–500 BPM via isoflurane anesthesia (E). Data presented as mean ± SEM, n = 13–14 per group. Outliers were defined a priori as any point >2 standard deviations from the mean and were excluded from analysis. WT outliers (n) were excluded from end-systolic pressure (1), dP/dt max (1), and heart rate (1) data sets. KOb/c outliers (n) were excluded from end-systolic pressure (1), end-diastolic pressure (1), dP/dt max (1), dP/dt min (1), and heart rate (1) data sets. A significant difference between WT and KOb/c groups is indicated in the figure by *** p < 0.001 calculated using Student’s unpaired 2-tailed T-test; ns (non-significant).
Ijms 25 09610 g004
Figure 5. Left intraventricular pressure–volume (PV) assessment during IVC occlusion reveals diminished load-independent contractility in KOb/c mice. Representative PV loops obtained in WT (A) and KOb/c (B) mice during IVC occlusion used as a preload reduction maneuver to assess load-independent contractility (slope of the end-systolic pressure volume relationship [ESPVR]) and relaxation (slope of the end-diastolic pressure volume relationship [EDPVR]). (C) The slope of the ESPVR was significantly reduced in KOb/c mice. (D) The slope of the EDPVR was not significantly different between WT and KOb/c mice. (E) Plotting ESPVR against heart rate for individual mice illustrates that ESPVR is independent of heart rate, supporting that although KOb/c mice have a slower heart rate than WT during this experiment, this does not account for the observed reduction in their ESPVR. Data presented as mean ± SEM, n = 12–15 per group. Outliers were defined a priori as any point >2 standard deviations from the mean and were excluded from analysis. A single WT outlier was excluded from the EDPVR data set. A single KOb/c outlier was excluded from the ESPVR data set. A significant difference between WT and KOb/c groups is indicated in the figure by ** p < 0.01 calculated using Student’s unpaired 2-tailed T-test; ns (non-significant).
Ijms 25 09610 g005
Figure 6. Absence of cardiac hypertrophy in KOb/c hearts. (A) Representative low-magnification tiled images, with higher magnified regions of interest (black boxes in low-magnification images), taken of WT and KOb/c heart sections stained with H&E. (B) The HW/BW ratio, an index of heart size, was not significantly different between WT and KOb/c mice. (C) There was also no significant difference in cross-sectional area between genotypes. Data presented as mean ± SEM, n = 16–18 per group (panel B) or 13–10 per group (panel C). Outliers were defined a priori as any point >2 standard deviations from the mean and were excluded from analysis. A single WT outlier was excluded from the HW/BW ratio data set. A single KOb/c outlier was excluded from the HW/BW ratio data set. For panel (B), the statistical significance was calculated using Student’s unpaired 2-tailed T-test. For panel (C), the cross-sectional area of 25–29 cardiomyocytes was measured across 5 images taken around the left ventricle and averaged for each individual mouse, with the statistical significance calculated using hierarchal statistical analysis (nested T-test). ns (non-significant).
Ijms 25 09610 g006
Figure 7. Increased QT length variation in KOb/c mice. Representative average ECG cycles of WT (A) and KOb/c (B) mice were created from 5 s segments of Lead-I recordings. The black line represents the average trace, with underlying grey lines representing each individual cycle. This method was applied to 30 s Lead-I recordings of WT and KOb/c mice from which QT length and QT length variation were assessed. QT length variation was calculated as the coefficient of variation (SD/mean) across 5 s intervals from a continuous 30 s ECG trace (i.e., 6 × 5 s intervals). (C) Heart rates were titrated to between ~350–500 BPM via isoflurane anesthesia. (D) There was no significant difference between the length of the QT interval in WT and KOb/c mice. (E) The QT length variation in KOb/c was significantly greater than in WT mice. Data presented as mean ± SEM, n = 11–13 per group. A significant difference between WT and KOb/c groups is indicated in the figure by *** p < 0.001 calculated using Student’s unpaired 2-tailed T-test; ns (non-significant).
Ijms 25 09610 g007
Figure 8. KOb/c cardiomyocytes have reduced Ca2+-transient amplitude. (A) Representative Ca2+ transients recorded in individual cardiomyocytes isolated from WT and KOb/c mice loaded with the intracellular Ca2+ indicator Fura-2 AM. Traces represent the average of ~100 consecutive transients recorded in a single cardiomyocyte while paced at 5 Hz. (B) There was no significant difference between WT and KOb/c ‘baseline’ F340/380 ratio. (C) The ‘peak amplitude’ was significantly decreased in KOb/c cardiomyocytes. (D) The ‘peak amplitude as % baseline’ (describing the % change from baseline of the Ca2+ transient) was also significantly decreased in KOb/c cardiomyocytes. (E) There was no significant difference between WT and KOb/c in ‘time to peak’. (F) There was no significant difference between WT and KOb/c in ‘time to 90% baseline’. (G) There was no significant difference between WT and KOb/c the Ca2+ exponential ‘decay constant (tau)’. Data presented as mean ± SEM, n = 8–9 per group with each point representing the mean of 9–12 cells. Outliers were defined a priori as any point >2 standard deviations from the mean and were excluded from analysis. A single WT outlier was excluded from the ‘time to 90% baseline’ data set. A significant difference between WT and KOb/c groups is indicated in the figure by * p < 0.05 calculated using hierarchal statistical analysis (nested T-test); ns (non-significant).
Ijms 25 09610 g008
Disclaimer/Publisher’s Note: The statements, opinions and data contained in all publications are solely those of the individual author(s) and contributor(s) and not of MDPI and/or the editor(s). MDPI and/or the editor(s) disclaim responsibility for any injury to people or property resulting from any ideas, methods, instructions or products referred to in the content.

