
Solanesol Ameliorates Anxiety-like Behaviors via the Downregulation of Cingulate T Cell-Restricted Intracellular Antigen-1 in a Complete Freund’s Adjuvant-Induced Mouse Model


Abstract
1. Introduction
2. Results
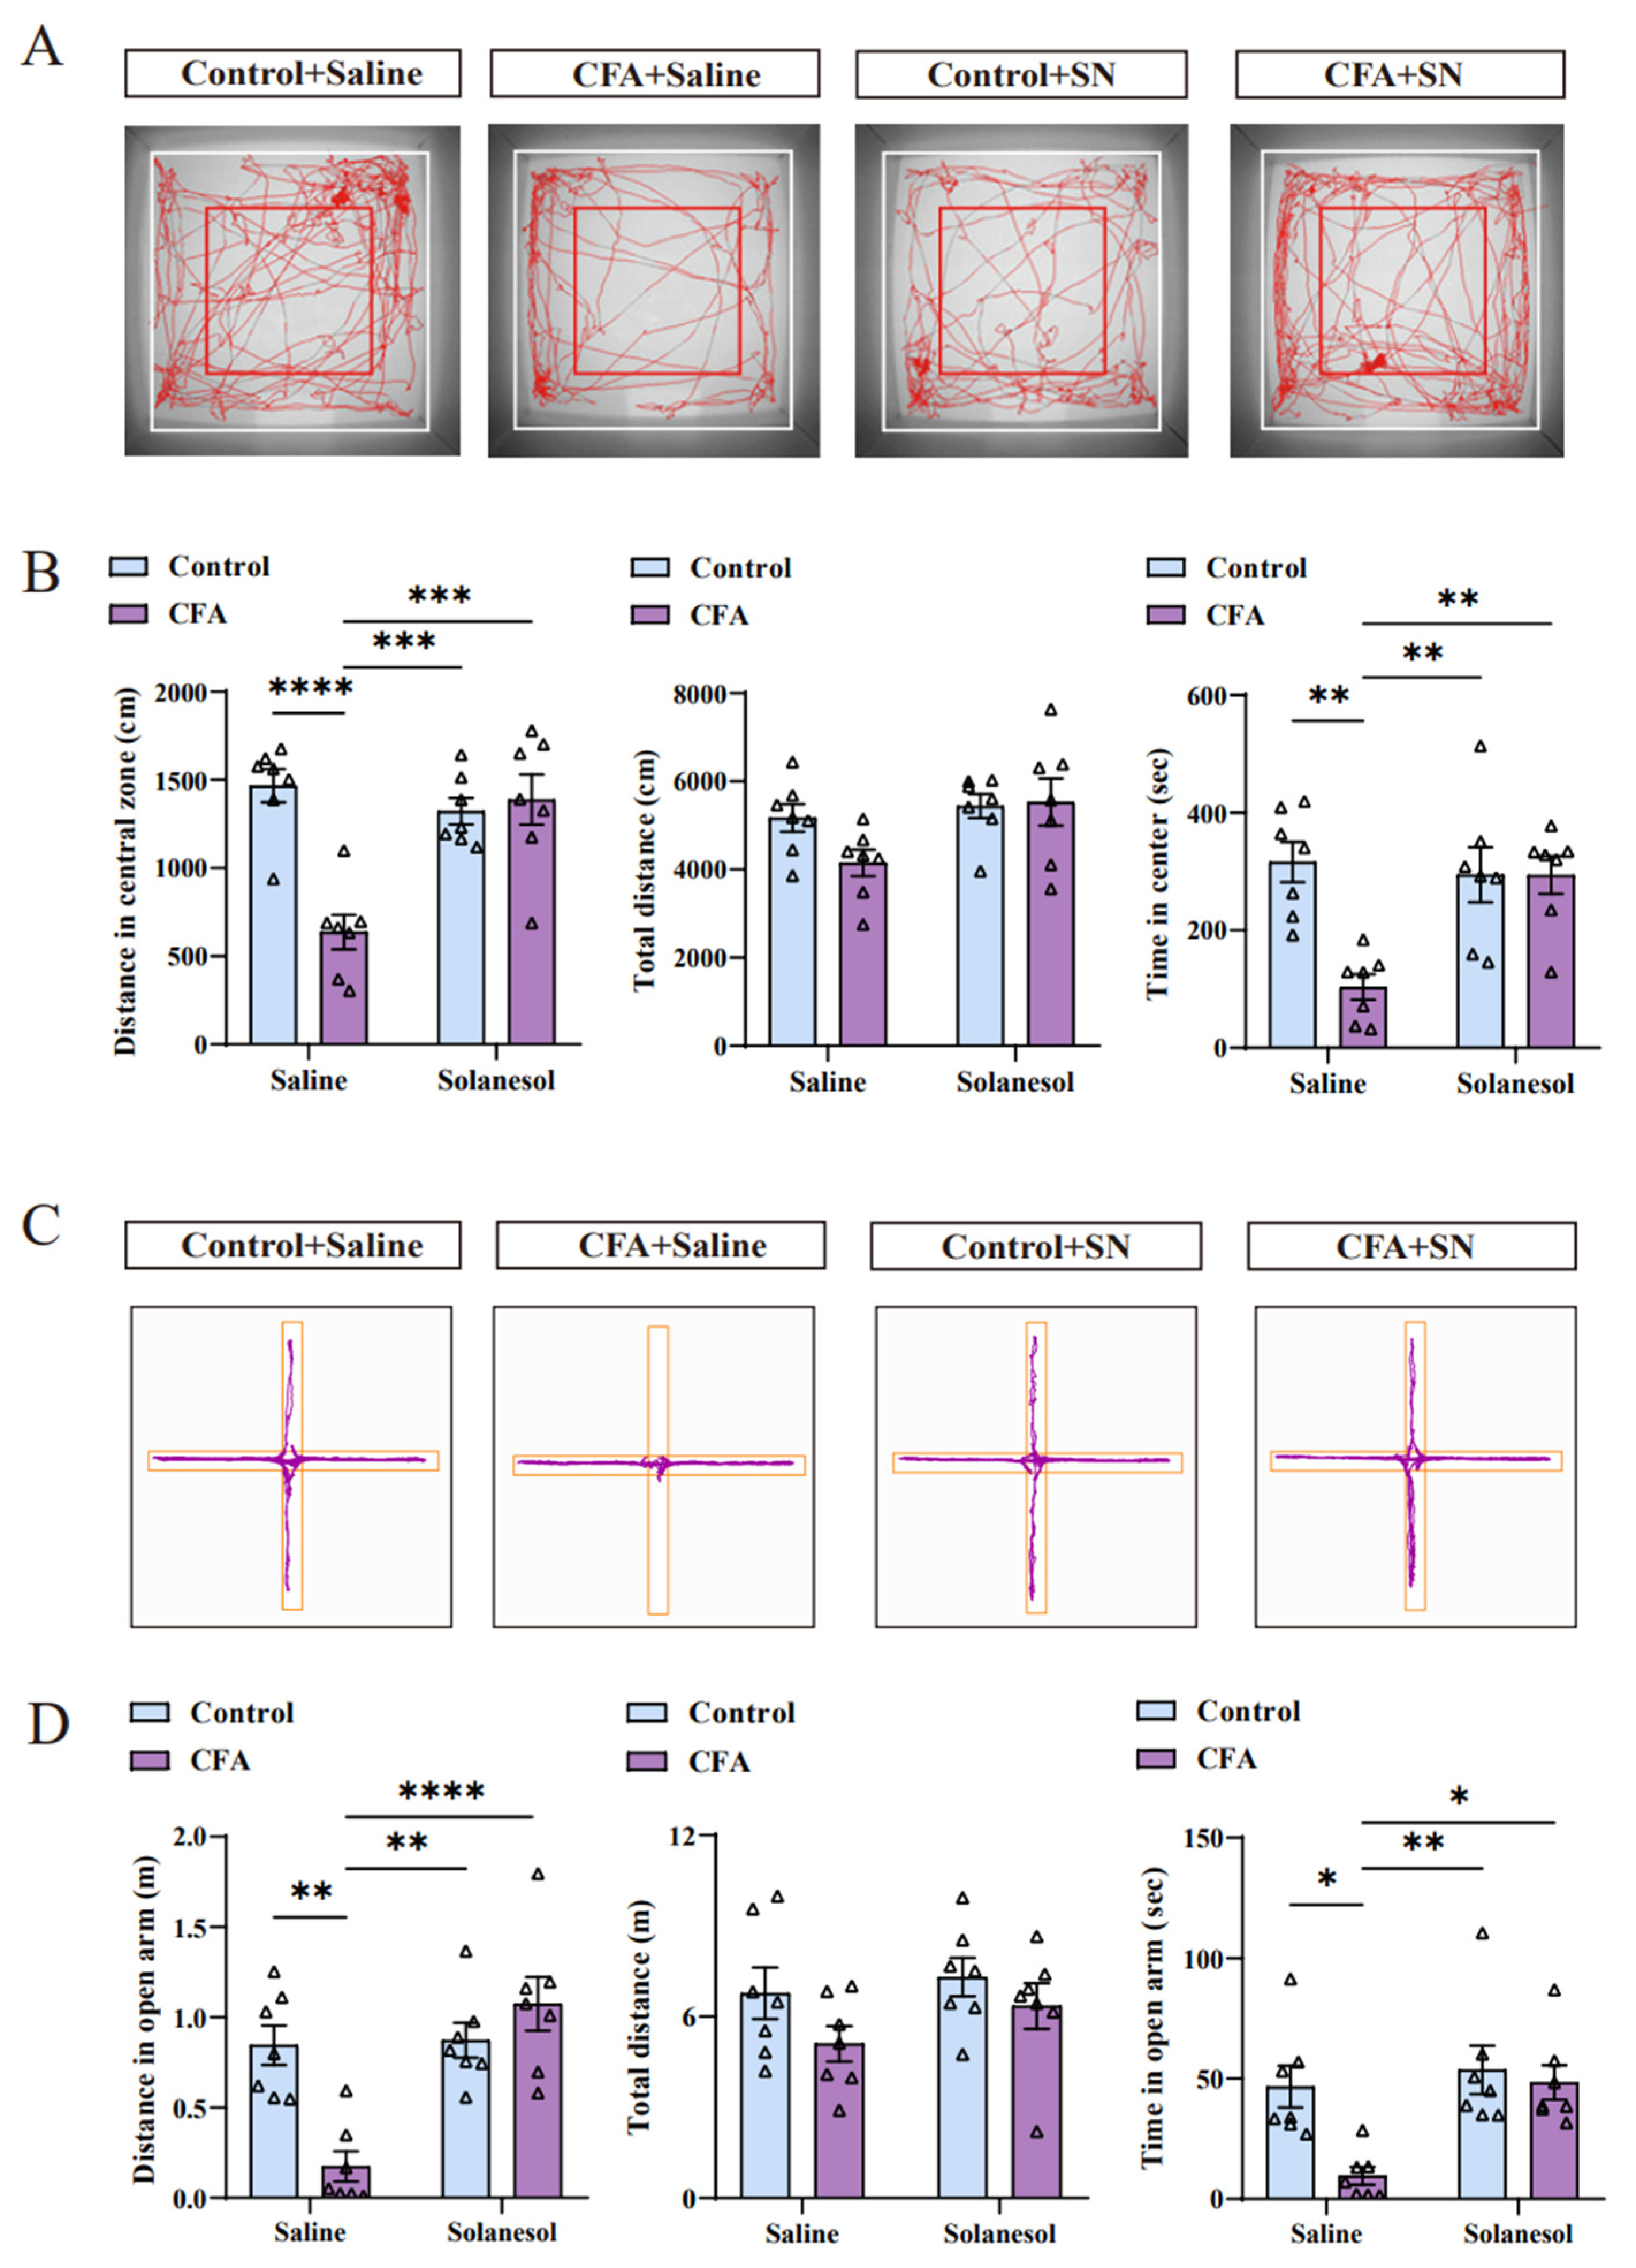
2.1. Solanesol Ameliorated Anxiety-like Behaviors in Mice
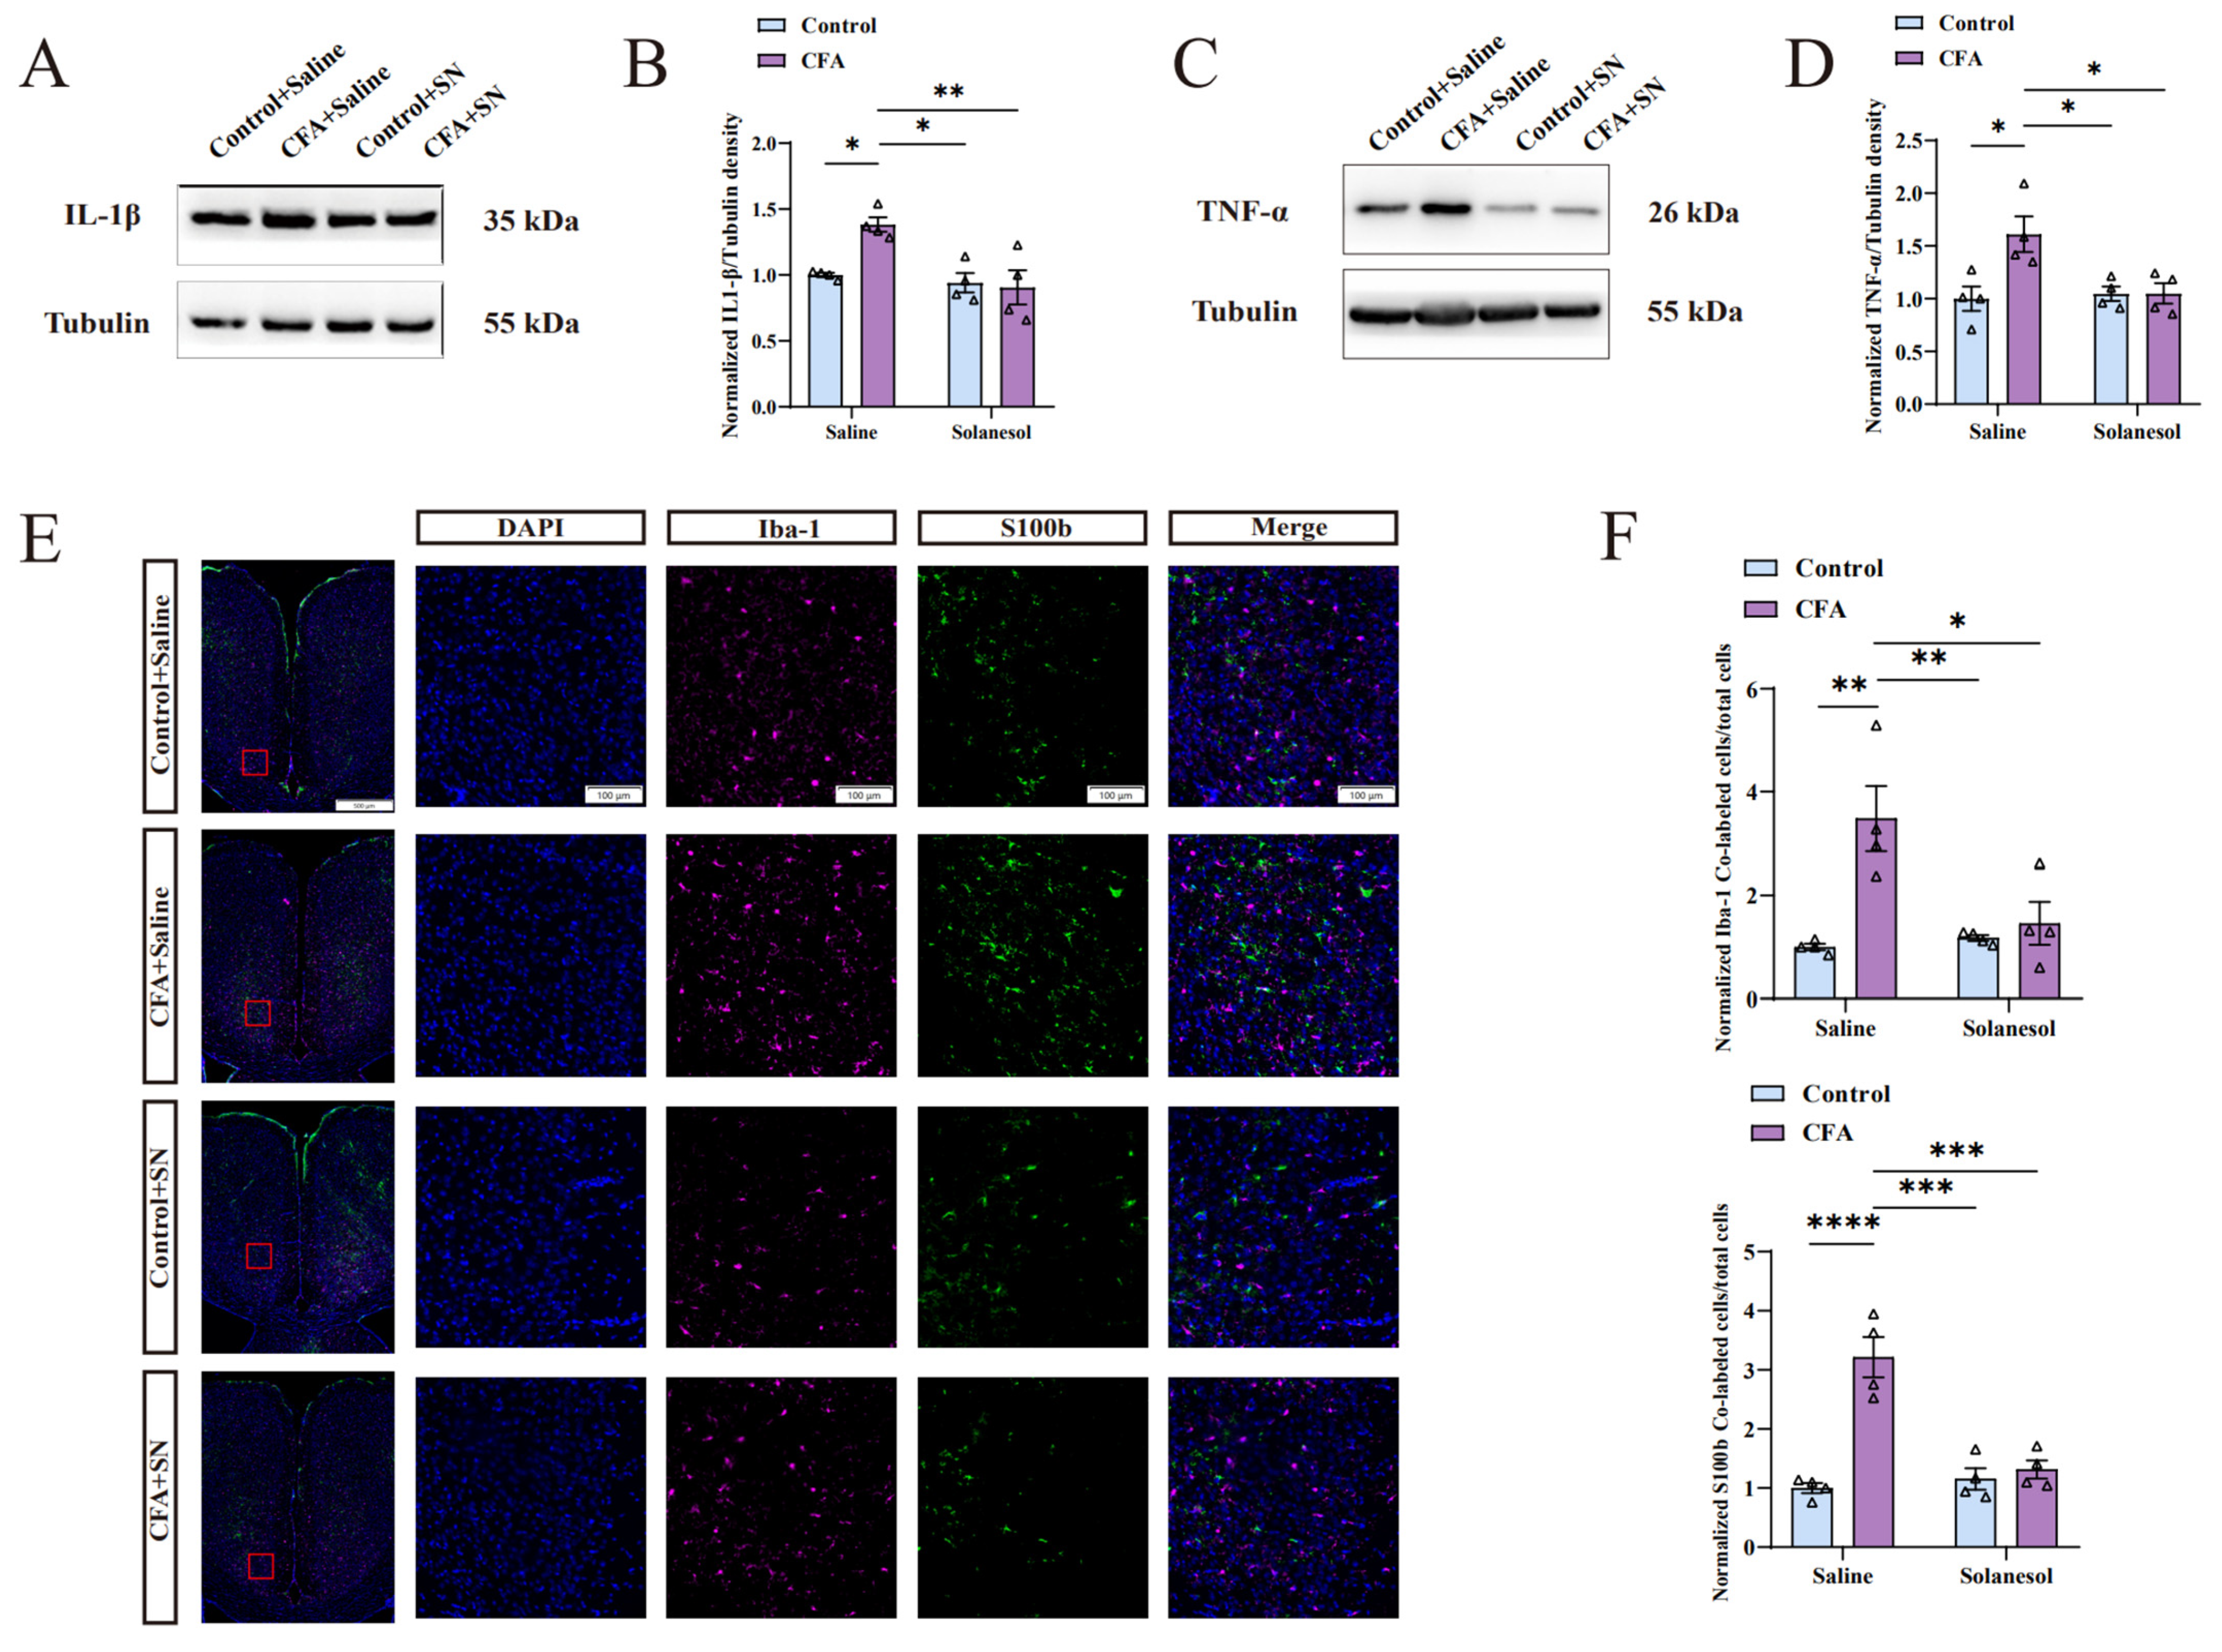
2.2. Solanesol Inhibited the Neuro-Inflammation Response in the ACC
2.3. Solanesol Treatment Inhibited Microglial and Astrocytic Activation in the ACC of CFA-Injected Mice
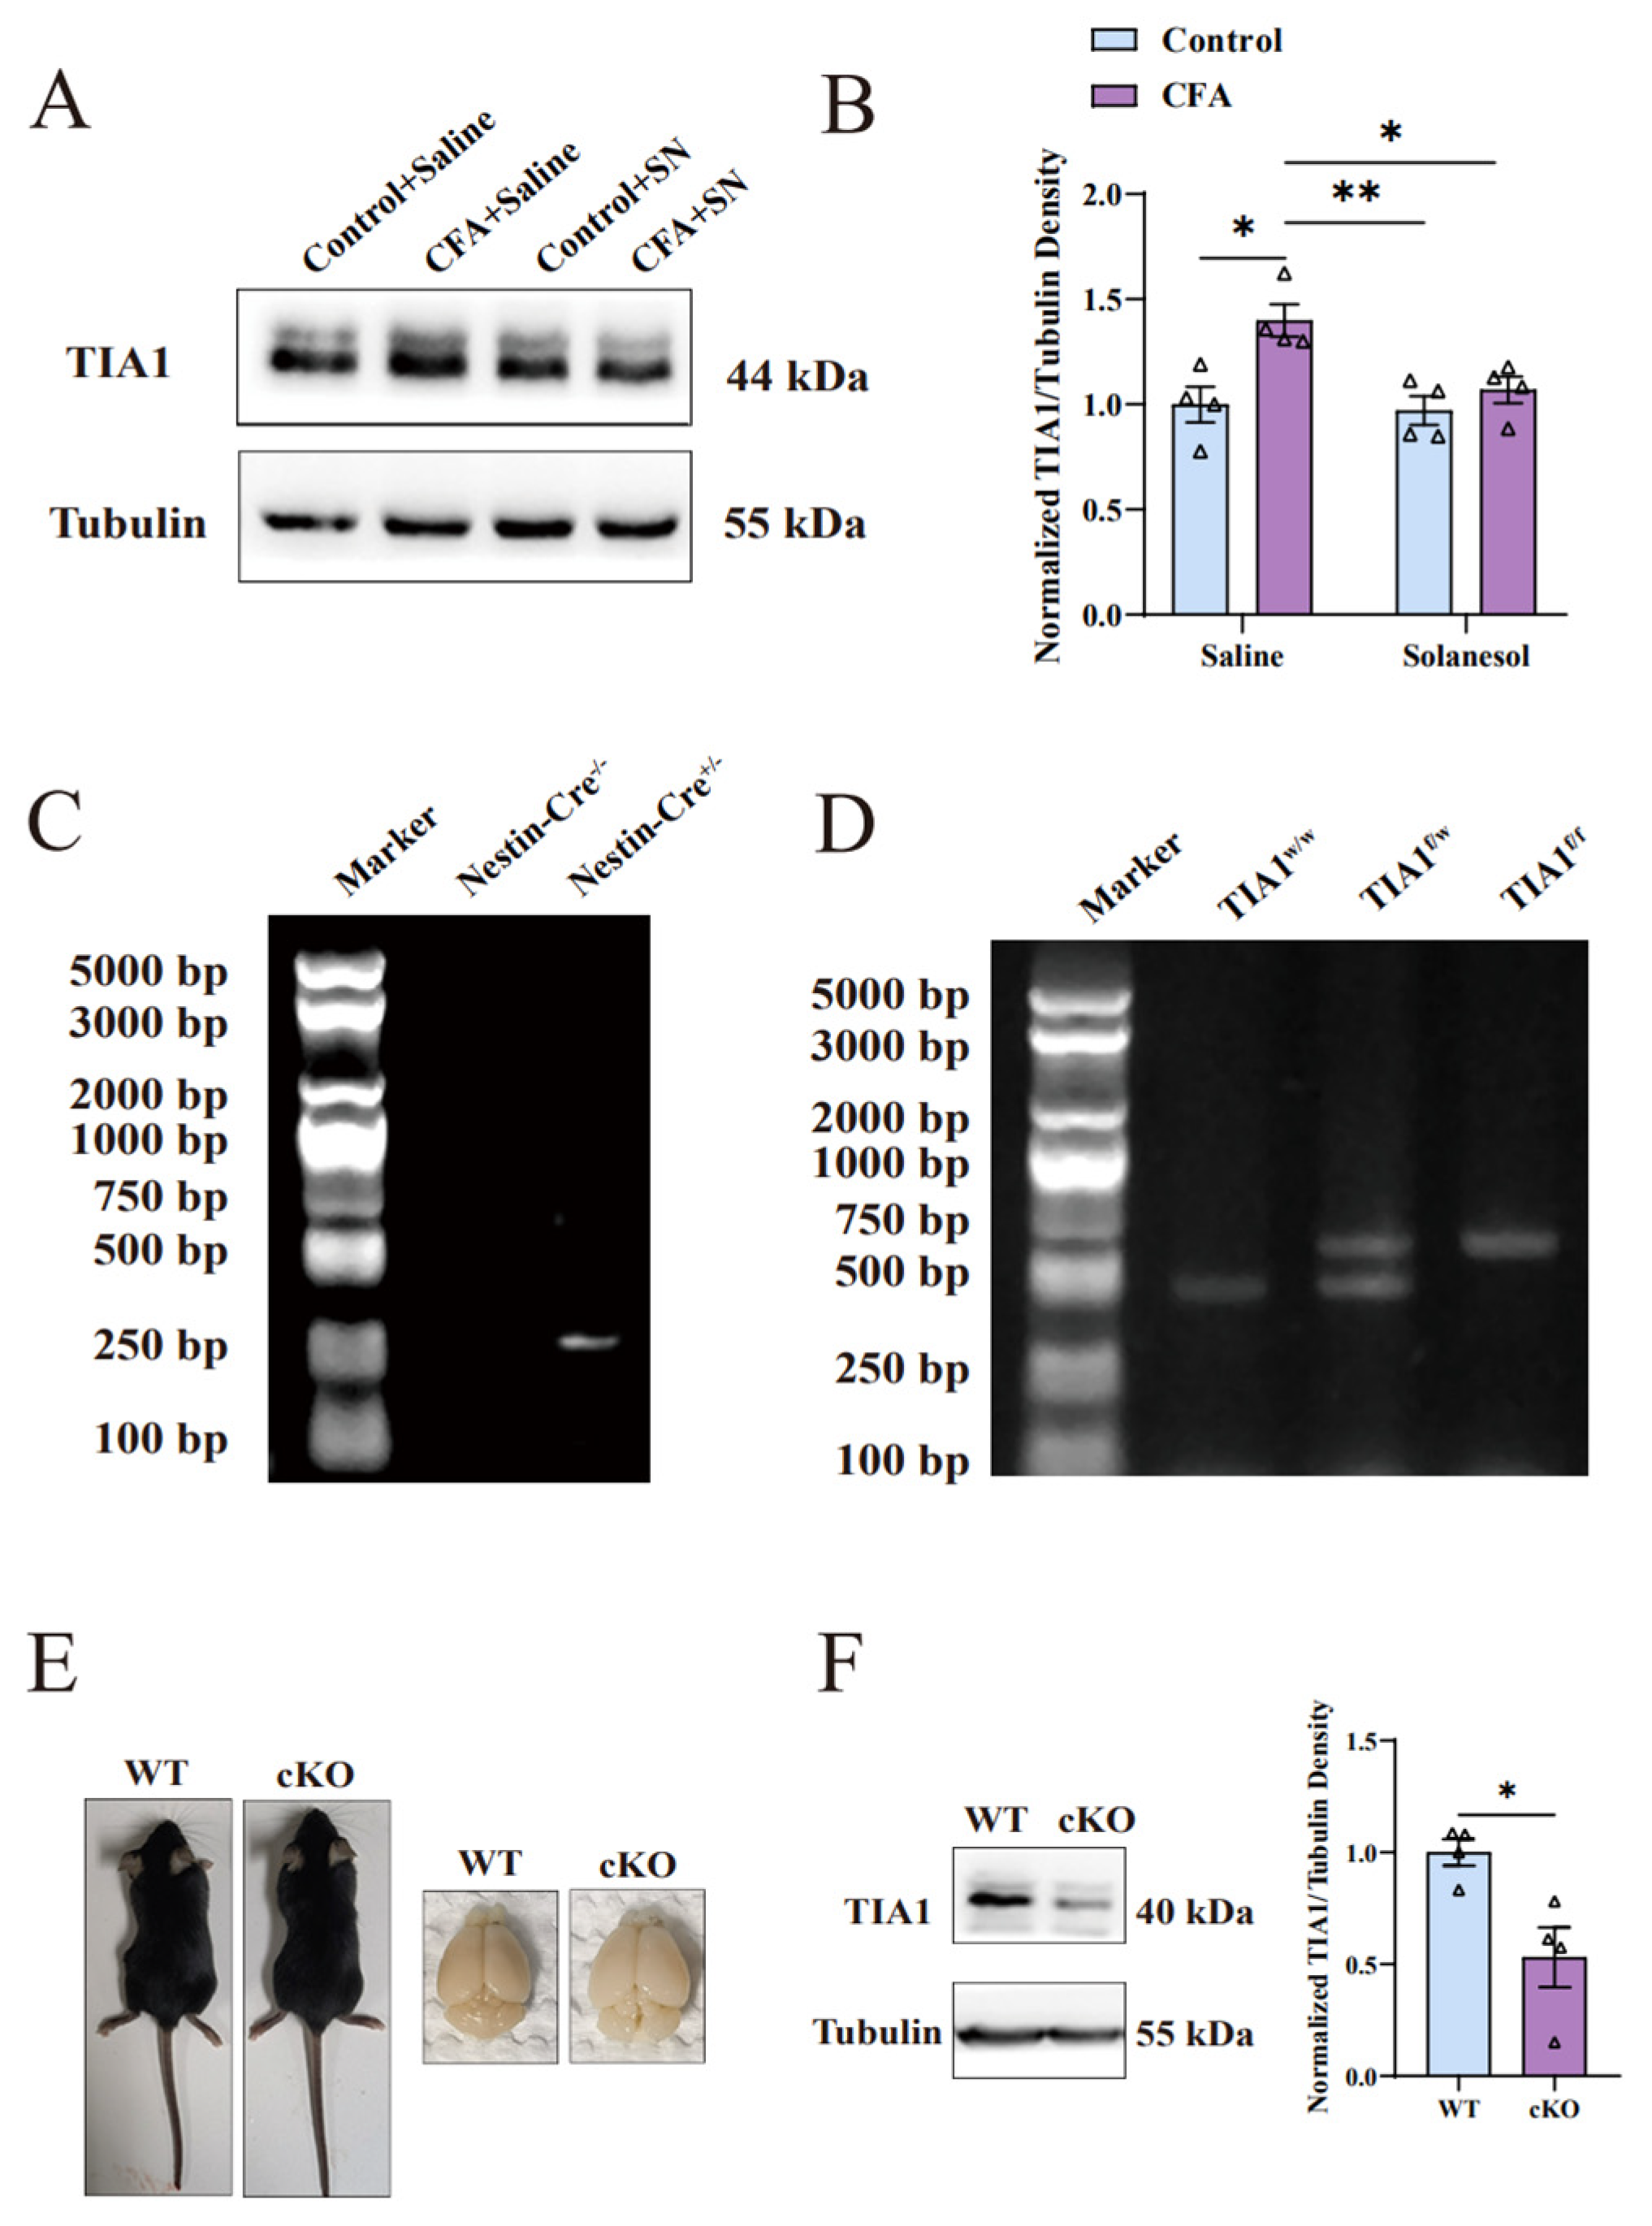
2.4. Solanesol Mitigated the Neuro-Inflammation Response in the ACC by Downregulating TIA1
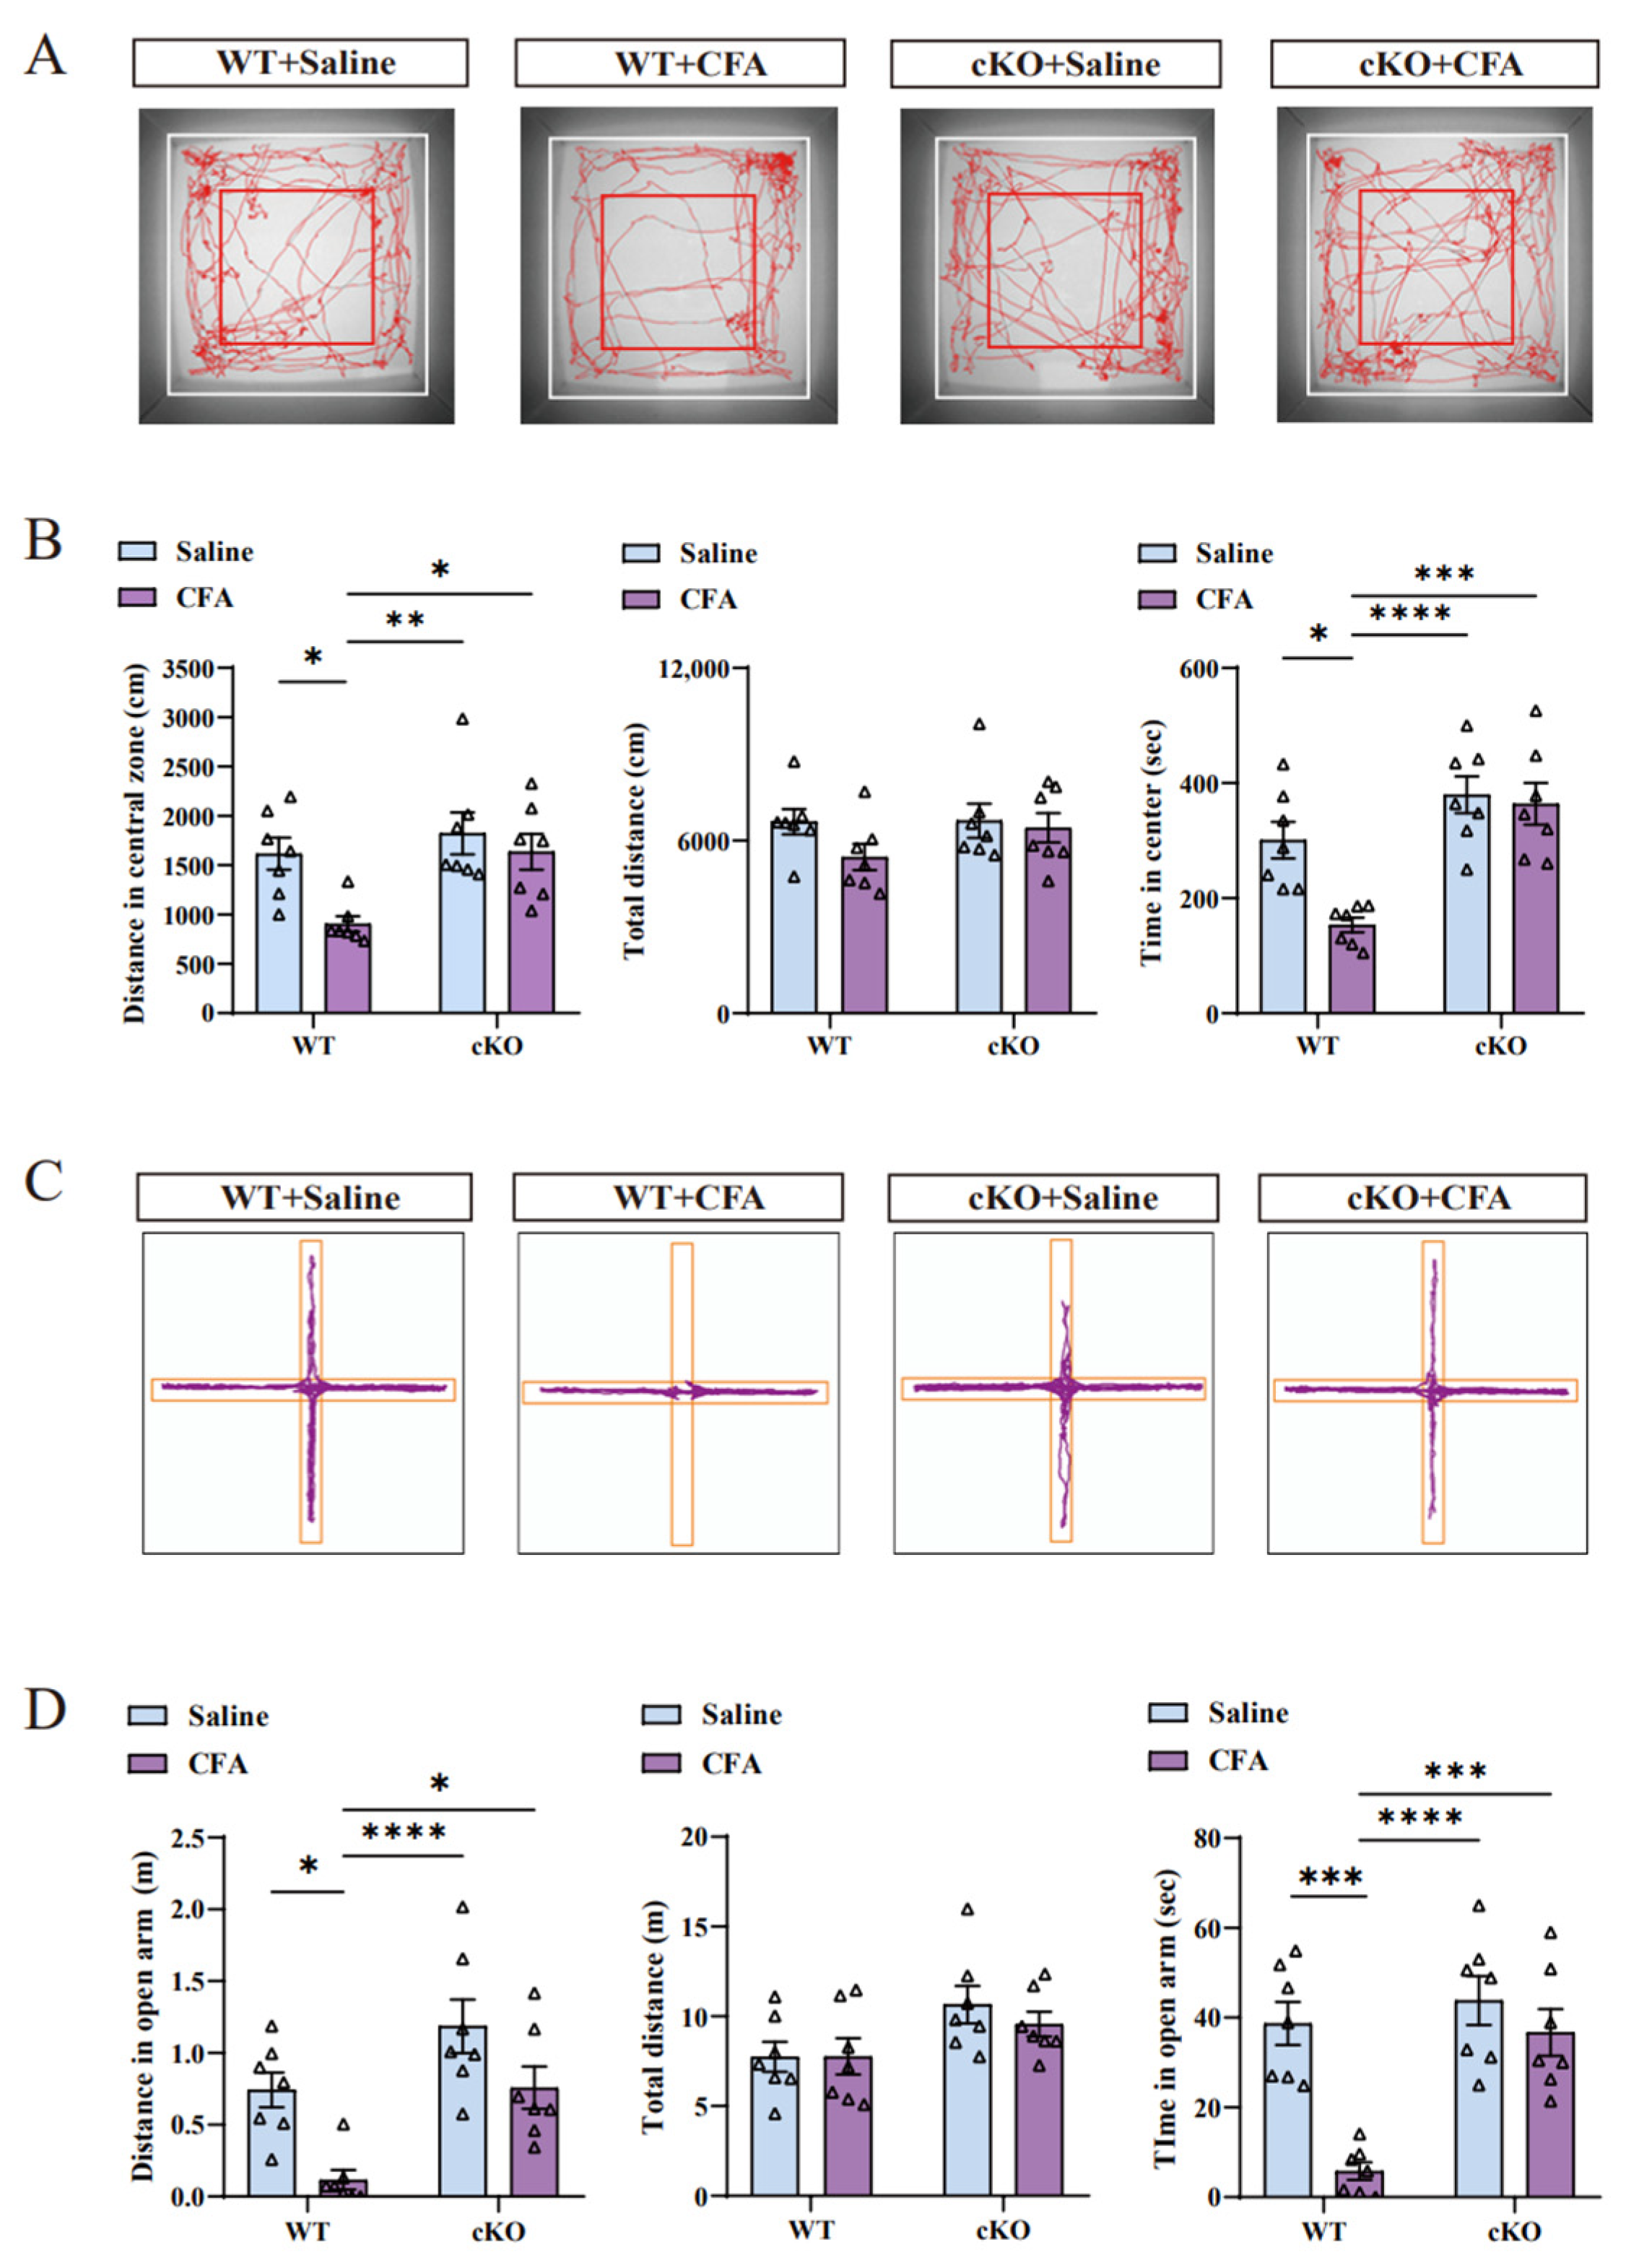
2.5. TIA1 cKO Mice Did Not Exhibit Anxiety-like Behaviors after CFA Injection
2.6. Decreased Activation of Microglia and Astrocytes Was Observed in the ACC of cKO Mice after CFA Injection
2.7. cKO Mice Exhibited a Decreased Neuro-Inflammation Response in the ACC after CFA Injection
3. Discussion
4. Materials and Methods
4.1. Animals
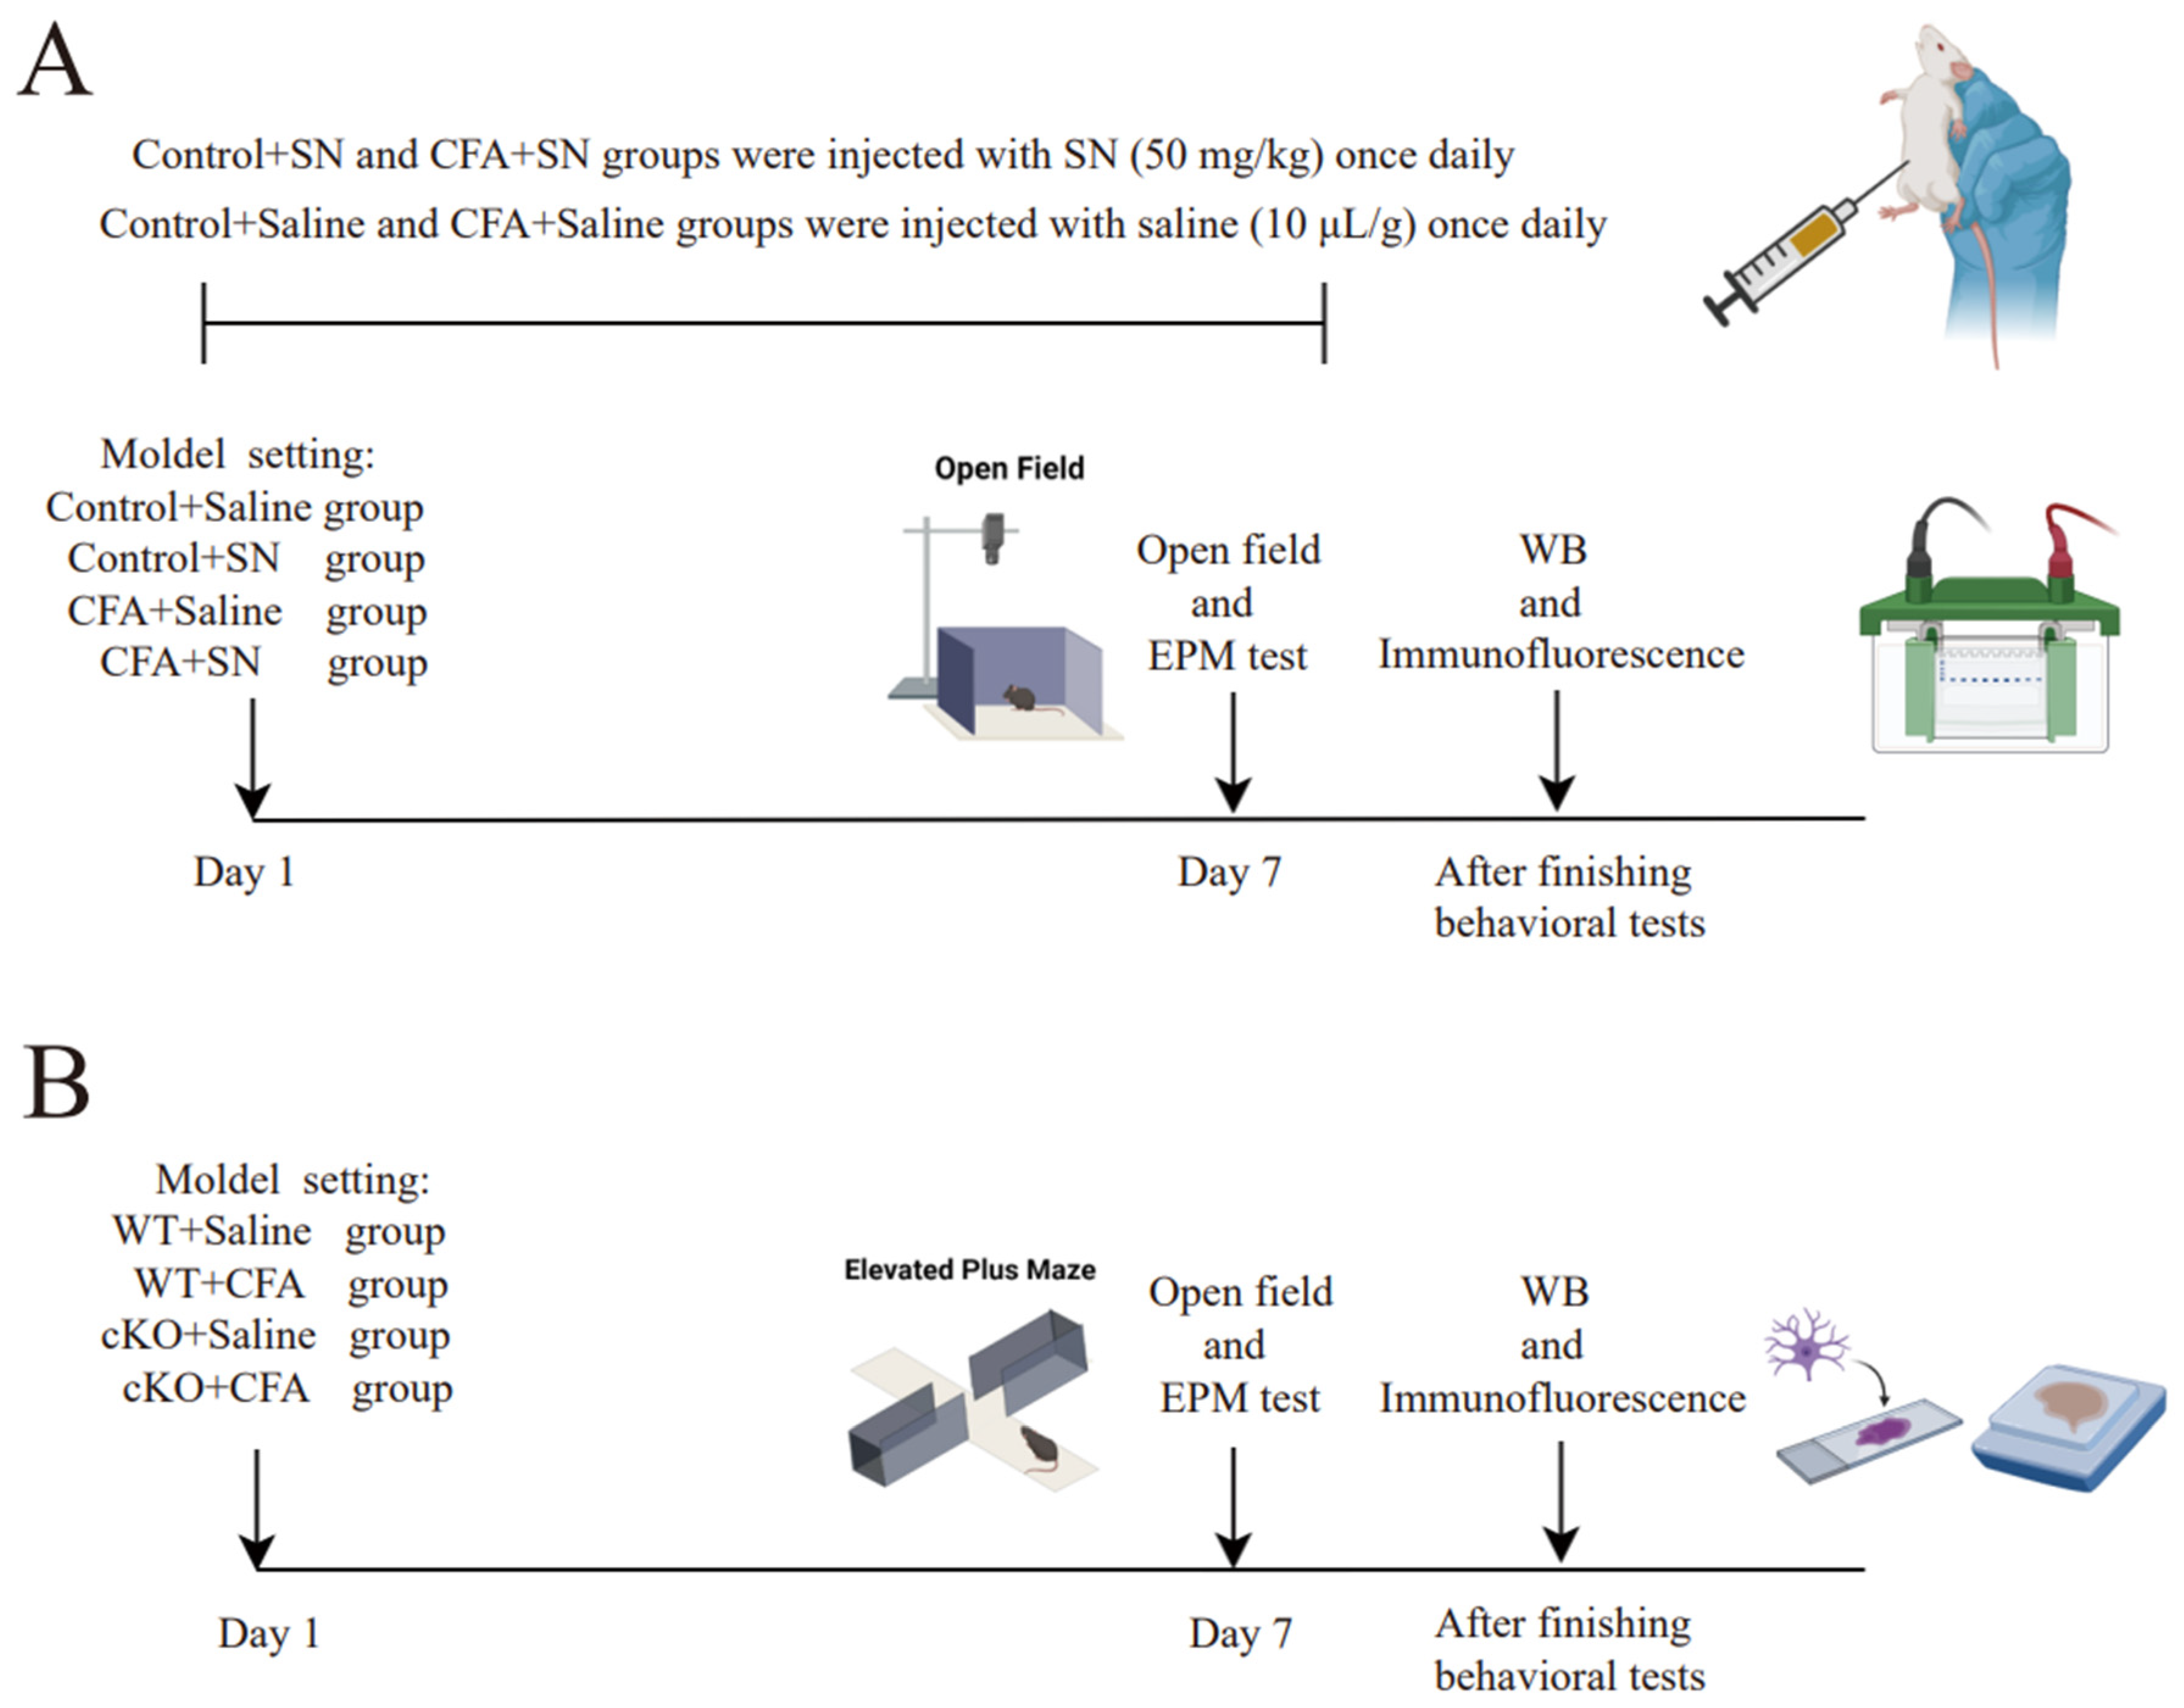
4.2. CFA Injection and Solanesol Treatment
4.3. Open Field Test
4.4. Elevated Plus-Maze Test
4.5. Western Blot Analysis
4.6. Immunofluorescence
4.7. Statistical Analysis
Author Contributions
Funding
Institutional Review Board Statement
Informed Consent Statement
Data Availability Statement
Conflicts of Interest
References
- Mellman, T.A. Sleep and anxiety disorders. Sleep Med. Clin. 2008, 3, 261–268. [Google Scholar] [CrossRef] [PubMed]
- Celano, C.M.; Daunis, D.J.; Lokko, H.N.; Campbell, K.A.; Huffman, J.C. Anxiety disorders and cardiovascular disease. Curr. Psychiatry Rep. 2016, 18, 101. [Google Scholar] [CrossRef] [PubMed] [PubMed Central]
- Combs, H.; Markman, J. Anxiety disorders in primary care. Med. Clin. N. Am. 2014, 98, 1007–1023. [Google Scholar] [CrossRef] [PubMed]
- Craske, M.G.; Stein, M.B. Anxiety. Lancet 2016, 388, 3048–3059. [Google Scholar] [CrossRef] [PubMed]
- Offidani, E.; Guidi, J.; Tomba, E.; Fava, G.A. Efficacy and tolerability of benzodiazepines versus antidepressants in anxiety disorders: A systematic review and meta-analysis. Psychother. Psychosom. 2013, 82, 355–362. [Google Scholar] [CrossRef] [PubMed]
- Ballenger, J.C. Benzodiazepine receptors agonists and antagonists. In Kaplan & Sadock’s Comprehensive Textbook of Psychiatry, 7th ed.; Sadock, V.A., Sadock, B.J., Kaplan, H.I., Eds.; Lippincott Williams & Wilkins: Philadelphia, PA, USA, 2000; pp. 2317–2323. ISBN 978-0-683-30128-1. [Google Scholar]
- Araki, T.; Ikegaya, Y.; Koyama, R. The effects of microglia- and astrocyte-derived factors on neurogenesis in health and disease. Eur. J. Neurosci. 2021, 54, 5880–5901. [Google Scholar] [CrossRef] [PubMed] [PubMed Central]
- Subhramanyam, C.S.; Wang, C.; Hu, Q.; Dheen, S.T. Microglia-mediated neuroinflammation in neurodegenerative diseases. Semin. Cell Dev. Biol. 2019, 94, 112–120. [Google Scholar] [CrossRef] [PubMed]
- Yan, N.; Liu, Y.; Gong, D.; Du, Y.; Zhang, H.; Zhang, Z. Solanesol: A review of its resources, derivatives, bioactivities, medicinal applications, and biosynthesis. Phytochem. Rev. 2015, 14, 403–417. [Google Scholar] [CrossRef]
- Sharma, R.; Rahi, S.; Mehan, S. Neuroprotective potential of solanesol in intracerebroventricular propionic acid induced experimental model of autism: Insights from behavioral and biochemical evidence. Toxicol. Rep. 2019, 6, 1164–1175. [Google Scholar] [CrossRef] [PubMed] [PubMed Central]
- Rajdev, K.; Siddiqui, E.M.; Jadaun, K.S.; Mehan, S. Neuroprotective potential of solanesol in a combined model of intracerebral and intraventricular hemorrhage in rats. IBRO Rep. 2020, 8, 101–114. [Google Scholar] [CrossRef] [PubMed] [PubMed Central]
- Moylan, S.; Eyre, H.A.; Maes, M.; Baune, B.T.; Jacka, F.N.; Berk, M. Exercising the worry away: How inflammation, oxidative and nitrogen stress mediates the beneficial effect of physical activity on anxiety disorder symptoms and behaviours. Neurosci. Biobehav. Rev. 2013, 37, 573–584. [Google Scholar] [CrossRef] [PubMed]
- Dinarello, C.A. Proinflammatory cytokines. Chest 2000, 118, 503–508. [Google Scholar] [CrossRef] [PubMed]
- Won, E.; Kim, Y.K. Neuroinflammation-associated alterations of the brain as potential neural biomarkers in anxiety disorders. Int. J. Mol. Sci. 2020, 21, 6546. [Google Scholar] [CrossRef] [PubMed] [PubMed Central]
- Fernández-Gómez, A.; Izquierdo, J.M. The multifunctional faces of T-cell intracellular antigen 1 in health and disease. Int. J. Mol. Sci. 2022, 23, 1400. [Google Scholar] [CrossRef] [PubMed] [PubMed Central]
- Block, M.L.; Zecca, L.; Hong, J.S. Microglia-mediated neurotoxicity: Uncovering the molecular mechanisms. Nat. Rev. Neurosci. 2007, 8, 57–69. [Google Scholar] [CrossRef] [PubMed]
- Brás, J.P.; Bravo, J.; Freitas, J.; Barbosa, M.A.; Santos, S.G.; Summavielle, T.; Almeida, M.I. TNF-alpha-induced microglia activation requires miR-342: Impact on NF-kB signaling and neurotoxicity. Cell Death Dis. 2020, 11, 415. [Google Scholar] [CrossRef] [PubMed] [PubMed Central]
- Wang, Y.L.; Han, Q.Q.; Gong, W.Q.; Pan, D.H.; Wang, L.Z.; Hu, W.; Yang, M.; Li, B.; Yu, J.; Liu, Q. Microglial activation mediates chronic mild stress-induced depressive- and anxiety-like behavior in adult rats. J. Neuroinflamm. 2018, 15, 21. [Google Scholar] [CrossRef] [PubMed] [PubMed Central]
- Craske, M.G.; Rauch, S.L.; Ursano, R.; Prenoveau, J.; Pine, D.S.; Zinbarg, R.E. What is an anxiety disorder? Focus 2011, 9, 369–388. [Google Scholar] [CrossRef]
- Drevets, W.C.; Savitz, J.; Trimble, M. The subgenual anterior cingulate cortex in mood disorders. CNS Spectr. 2008, 13, 663–681. [Google Scholar] [CrossRef] [PubMed] [PubMed Central]
- Towbin, H.; Staehelin, T.; Gordon, J. Electrophoretic transfer of proteins from polyacrylamide gels to nitrocellulose sheets: Procedure and some applications. Proc. Natl Acad. Sci. USA 1979, 76, 4350–4354. [Google Scholar] [CrossRef] [PubMed] [PubMed Central]
- Ghosh, R.; Gilda, J.E.; Gomes, A.V. The necessity of and strategies for improving confidence in the accuracy of western blots. Expert Rev. Proteom. 2014, 11, 549–560. [Google Scholar] [CrossRef] [PubMed] [PubMed Central]
- Michopoulos, V.; Powers, A.; Gillespie, C.F.; Ressler, K.J.; Jovanovic, T. Inflammation in fear- and anxiety-based disorders: PTSD, GAD, and beyond. Neuropsychopharmacology 2017, 42, 254–270. [Google Scholar] [CrossRef] [PubMed] [PubMed Central]
- Kwon, H.S.; Koh, S.H. Neuroinflammation in neurodegenerative disorders: The roles of microglia and astrocytes. Transl. Neurodegener. 2020, 9, 42. [Google Scholar] [CrossRef] [PubMed] [PubMed Central]
- Zheng, Z.H.; Tu, J.L.; Li, X.H.; Hua, Q.; Liu, W.Z.; Liu, Y.; Pan, B.X.; Hu, P.; Zhang, W.H. Neuroinflammation induces anxiety- and depressive-like behavior by modulating neuronal plasticity in the basolateral amygdala. Brain Behav. Immun. 2021, 91, 505–518. [Google Scholar] [CrossRef] [PubMed]
- Jha, M.K.; Jeon, S.; Suk, K. Glia as a link between neuroinflammation and neuropathic pain. Immune Netw. 2012, 12, 41–47. [Google Scholar] [CrossRef] [PubMed] [PubMed Central]
- Sun, M.; You, H.; Hu, X.; Luo, Y.; Zhang, Z.; Song, Y.; An, J.; Lu, H. Microglia-astrocyte Interaction in neural development and neural pathogenesis. Cells 2023, 12, 1942. [Google Scholar] [CrossRef] [PubMed] [PubMed Central]
- Li, Q.Y.; Chen, S.X.; Liu, J.Y.; Yao, P.W.; Duan, Y.W.; Li, Y.Y.; Zang, Y. Neuroinflammation in the anterior cingulate cortex: The potential supraspinal mechanism underlying the mirror-image pain following motor fiber injury. J. Neuroinflamm. 2022, 19, 162. [Google Scholar] [CrossRef] [PubMed] [PubMed Central]
- Shao, F.B.; Fang, J.F.; Wang, S.S.; Qiu, M.T.; Xi, D.N.; Jin, X.M.; Liu, J.G.; Shao, X.M.; Shen, Z.; Liang, Y.; et al. Anxiolytic effect of GABAergic neurons in the anterior cingulate cortex in a rat model of chronic inflammatory pain. Mol. Brain 2021, 14, 139. [Google Scholar] [CrossRef] [PubMed] [PubMed Central]
- Matisz, C.E.; Gruber, A.J. Neuroinflammatory remodeling of the anterior cingulate cortex as a key driver of mood disorders in gastrointestinal disease and disorders. Neurosci. Biobehav. Rev. 2022, 133, 104497. [Google Scholar] [CrossRef] [PubMed]
- Piecyk, M.; Wax, S.; Beck, A.R.; Kedersha, N.; Gupta, M.; Maritim, B.; Chen, S.; Gueydan, C.; Kruys, V.; Streuli, M.; et al. TIA-1 is a translational silencer that selectively regulates the expression of TNF-alpha. EMBO J. 2000, 19, 4154–4163. [Google Scholar] [CrossRef] [PubMed] [PubMed Central]
- Sánchez-Jiménez, C.; Izquierdo, J.M. T-cell intracellular antigens in health and disease. Cell Cycle 2015, 14, 2033–2043. [Google Scholar] [CrossRef] [PubMed] [PubMed Central]
- Mocellin, S.; Provenzano, M.; Lise, M.; Nitti, D.; Rossi, C.R. Increased tia-1 gene expression in the tumor microenvironment after locoregional administration of tumor necrosis factor-α to patients with soft tissue limb sarcoma. Int. J. Cancer 2003, 107, 317–322. [Google Scholar] [CrossRef] [PubMed]
- Rong, Z.; Yang, L.; Chen, Y.; Qin, Y.; Cheng, C.-Y.; Zhao, J.; Li, L.-F.; Ma, X.; Wu, Y.-M.; Liu, S.-B.; et al. Sophoridine alleviates hyperalgesia and anxiety-like behavior in an inflammatory pain mouse model induced by complete freund’s adjuvant. Molecular Pain 2023, 19. [Google Scholar] [CrossRef] [PubMed]
- Luo, L.; Sun, T.; Yang, L.; Liu, A.; Liu, Q.Q.; Tian, Q.Q.; Wang, Y.; Zhao, M.G.; Yang, Q. Scopoletin ameliorates anxiety-like behaviors in complete Freund’s adjuvant-induced mouse model. Mol. Brain 2020, 13, 15. [Google Scholar] [CrossRef] [PubMed]
- Wang, Y.Y.; Li, Y.F.; Zhou, Z.F. Solanesol alleviates CFA-induced chronic inflammatory pain via inhibition of proinflammatory cytokines in spinal glial cells. Heliyon 2024, 10, e34870. [Google Scholar] [CrossRef] [PubMed] [PubMed Central]


Disclaimer/Publisher’s Note: The statements, opinions and data contained in all publications are solely those of the individual author(s) and contributor(s) and not of MDPI and/or the editor(s). MDPI and/or the editor(s) disclaim responsibility for any injury to people or property resulting from any ideas, methods, instructions or products referred to in the content. |
© 2024 by the authors. Licensee MDPI, Basel, Switzerland. This article is an open access article distributed under the terms and conditions of the Creative Commons Attribution (CC BY) license (https://creativecommons.org/licenses/by/4.0/).
Share and Cite
Ding, S.; Li, Y.; Chen, Z.; Hu, J.; Li, J.; Li, J.; Wang, Y. Solanesol Ameliorates Anxiety-like Behaviors via the Downregulation of Cingulate T Cell-Restricted Intracellular Antigen-1 in a Complete Freund’s Adjuvant-Induced Mouse Model. Int. J. Mol. Sci. 2024, 25, 10165. https://doi.org/10.3390/ijms251810165
Ding S, Li Y, Chen Z, Hu J, Li J, Li J, Wang Y. Solanesol Ameliorates Anxiety-like Behaviors via the Downregulation of Cingulate T Cell-Restricted Intracellular Antigen-1 in a Complete Freund’s Adjuvant-Induced Mouse Model. International Journal of Molecular Sciences. 2024; 25(18):10165. https://doi.org/10.3390/ijms251810165
Chicago/Turabian StyleDing, Shufan, Yifan Li, Zhichao Chen, Jingnan Hu, Jiayi Li, Junlan Li, and Yongjie Wang. 2024. "Solanesol Ameliorates Anxiety-like Behaviors via the Downregulation of Cingulate T Cell-Restricted Intracellular Antigen-1 in a Complete Freund’s Adjuvant-Induced Mouse Model" International Journal of Molecular Sciences 25, no. 18: 10165. https://doi.org/10.3390/ijms251810165
APA StyleDing, S., Li, Y., Chen, Z., Hu, J., Li, J., Li, J., & Wang, Y. (2024). Solanesol Ameliorates Anxiety-like Behaviors via the Downregulation of Cingulate T Cell-Restricted Intracellular Antigen-1 in a Complete Freund’s Adjuvant-Induced Mouse Model. International Journal of Molecular Sciences, 25(18), 10165. https://doi.org/10.3390/ijms251810165