Article

The Genome-Wide Identification of the Dihydroflavonol 4-Reductase (DFR) Gene Family and Its Expression Analysis in Different Fruit Coloring Stages of Strawberry

1
State Key Laboratory of Aridland Crop Science, Gansu Agricultural University, Lanzhou 730070, China
2
College of Horticulture, Gansu Agricultural University, Lanzhou 730070, China
*
Author to whom correspondence should be addressed.
These authors contributed equally to this work.
Int. J. Mol. Sci. 2024, 25(18), 9911; https://doi.org/10.3390/ijms25189911 (registering DOI)
Submission received: 10 August 2024 / Revised: 9 September 2024 / Accepted: 12 September 2024 / Published: 13 September 2024
(This article belongs to the Section Molecular Plant Sciences)

Abstract

:
Dihydroflavonol 4-reductase (DFR) significantly influences the modification of flower color. To explore the role of DFR in the synthesis of strawberry anthocyanins, in this study, we downloaded the CDS sequences of the DFR gene family from the Arabidopsis genome database TAIR; the DFR family of forest strawberry was compared; then, a functional domain screen was performed using NCBI; the selected strawberry DFR genes were analyzed; and the expression characteristics of the family members were studied by qRT-PCR. The results showed that there are 57 members of the DFR gene family in strawberry, which are mainly expressed in the cytoplasm and chloroplast; most of them are hydrophilic proteins; and the secondary structure of the protein is mainly composed of α-helices and random coils. The analysis revealed that FvDFR genes mostly contain light, hormone, abiotic stress, and meristem response elements. From the results of the qRT-PCR analysis, the relative expression of each member of the FvDFR gene was significantly different, which was expressed throughout the process of fruit coloring. Most genes had the highest expression levels in the full coloring stage (S4). The expression of FvDFR30, FvDFR54, and FvDFR56 during the S4 period was 8, 2.4, and 2.4 times higher than during the S1 period, indicating that the DFR gene plays a key role in regulating the fruit coloration of strawberry. In the strawberry genome, 57 members of the strawberry DFR gene family were identified. The higher the DFR gene expression, the higher the anthocyanin content, and the DFR gene may be the key gene in anthocyanin synthesis. Collectively, the DFR gene is closely related to fruit coloring, which lays a foundation for further exploring the function of the DFR gene family.

1. Introduction

Fragaria vesca, commonly known as the woodland strawberry, stands out not only for its exquisite taste but also for its remarkable nutritional profile, boasting a rich array of vitamins. Revered as the “queen of fruit”, it has been traditionally acknowledged for its digestive, heat-alleviating, and thirst-quenching properties. Beyond its culinary appeal, this fruit also has powerful health benefits. Anthocyanins, abundant in Fragaria vesca, contribute to its vibrant color and exhibit robust antioxidant properties, playing a pivotal role in preventing and treating various chronic diseases [1]. DFR is a key enzyme in the anthocyanin biosynthesis pathway, which enables dihydroflavonol to produce colorless anthocyanins [2], and was initially isolated in maize and goldfish by Reilly et al. in 1985 [3]. Positioned as the foremost enzyme in the anthocyanins biosynthetic pathway, DFR significantly influences the modification of flower color [4]. DFR exhibits catalytic prowess in transforming colorless dihydroflavonol substrates such as dihydroquercetin (DHQ), dihydroacricetin (DHM), and dihydrokaempferol (DHK) into distinct pigments, contributing to the diversity of colors observed in plants like Centaurea cyanus Linn. (Cornflower), Consolida ajacis (L.) Schur (Delphinidin), and Pelargonium hortorum Bailey (Pelargonium) [5,6,7]. These colored anthocyanins serve as precursors to anthocyanins, and their content plays a role in influencing the production of anthocyanins to some extent [8].
The involvement of DFR is not limited to anthocyanin production and is intricately linked to the synthesis of flavonoids. Flavonoids are mainly found in plants in the form of glycosides, which can not only make plants appear in different colors such as blue, red, pink, etc., but also have the functions of protecting plants from ultraviolet rays, resisting biotic and abiotic stresses, and regulating the secretion and transport of plant hormones [9]. The multifaceted role of flavonoids encompasses vital functions in plant growth, development, disease resistance, stress resilience, and the formation of high-quality produce [10,11]. Furthermore, the health benefits associated with flavonoids extend beyond their presence in plants, demonstrating promising potential in suppressing tumors and preventing cardiovascular diseases [12].
Notably, studies on the LaDFR1 gene in Lycoris albiflora have revealed an increase in expression with the extension of flowering time. This pattern aligns with changes in flower color phenotype and the overall trend of total anthocyanin content during flowering [13]. Qin et al. found that HvDFR was constitutively expressed in all tissues and expressed highly in flower as well as was positively correlated with anthocyanin content [14]. The expression of MaDFR1, MaDFR2a, and MaDFR2b in Muscari spp. was higher, and these findings suggest that the DFR gene expression pattern is consistent with the coloration of floral organs [15].
It is essential to note that the expression of the DFR gene and its intensity are pivotal factors in anthocyanin synthesis in fruit. At different stages of fruit development, the expression level of the DFR gene is higher in black currants than that in red and white currants [16]. As the fruit diameter increases and the skin color deepens, the expression of the DFR gene in black currants shows an upward trend. In red strawberries, the gene expression level of the DFR regulatory gene is significantly higher than that in white strawberries [17]. In mango studies, the expression of the DFR gene was different in different colored mango peels, with higher expression in green peels and lower expression in yellow peels [18]. This suggests that the DFR gene may be involved in the regulation of anthocyanin synthesis, thus affecting fruit color.
Although the function of the DFR gene in regulating color formation has been studied in many plants, the identification of DFR gene family members and their expression characteristics in different coloration stages of forest strawberry have not been reported. The expression of the DFR gene family in strawberry was studied by real-time fluorescence quantitative PCR, and the key candidate family members involved in the regulation of strawberry anthocyanins were identified, which provided a basis for subsequent functional identification.

2. Results

2.1. Sequence Characteristics of the Strawberry DFR Gene Family

A homologous alignment search of strawberry databases obtained 57 strawberries from the DFR gene family, which were named FvDFR1–FvDFR57. According to the physicochemical properties of the strawberry DFR proteins (Table 1), the number of amino acids is between 69 and 1253, where the FvDFR16 amino acid sequence is the shortest and FvDFR49 the longest. The molecular weight is 7686.98–136,295.17 Da. The theoretical isoelectric point is 4.69–9.43. The average hydrophilicity is between −0.231 and 0.249. The instability coefficient FvDFR36 has the smallest value of 14.46, and FvDFR56 has a value of 46.13.
TBtools (v.1.113) software was used for chromosome localization analysis. In total, 57 FvDFR gene members were distributed on six chromosomes of strawberry: 6 genes were distributed on chromosome 2, 7 genes were distributed on chromosome 3, 3 genes were distributed on chromosome 4, 13 genes were distributed on chromosome 5, and 4 genes were distributed on chromosome 6. There are 24 genes on chromosome 7 and no genes on chromosome 1. Among them, the gene members distributed on chromosome 7 were the most, accounting for 42.1%, and the gene members distributed on chromosome 4 were the least, accounting for 5.2% (Figure 1).

2.2. Subcellular Localization and Secondary Structure Analysis of the Strawberry DFR Gene Family

The subcellular localization expression of the strawberry DFR gene family was mainly concentrated in the cytoplasm and chloroplasts (Table 2). Secondly, it is expressed in the nucleus, cell membrane, and mitochondria. It is slightly expressed in the peroxisome, with only eight genes located in the peroxisome. The expression of each gene in different organelles is related to the structure and function of this gene. A secondary structure analysis of the strawberry DFR gene family (Table 3) showed that the gene family was mainly composed of alpha helices (23.19–51.59%) and random coils (23.89–44.29%) in the 57 coding proteins, followed by extended strands (11.8–31.88%) and less beta turns (3.27–11.01%).

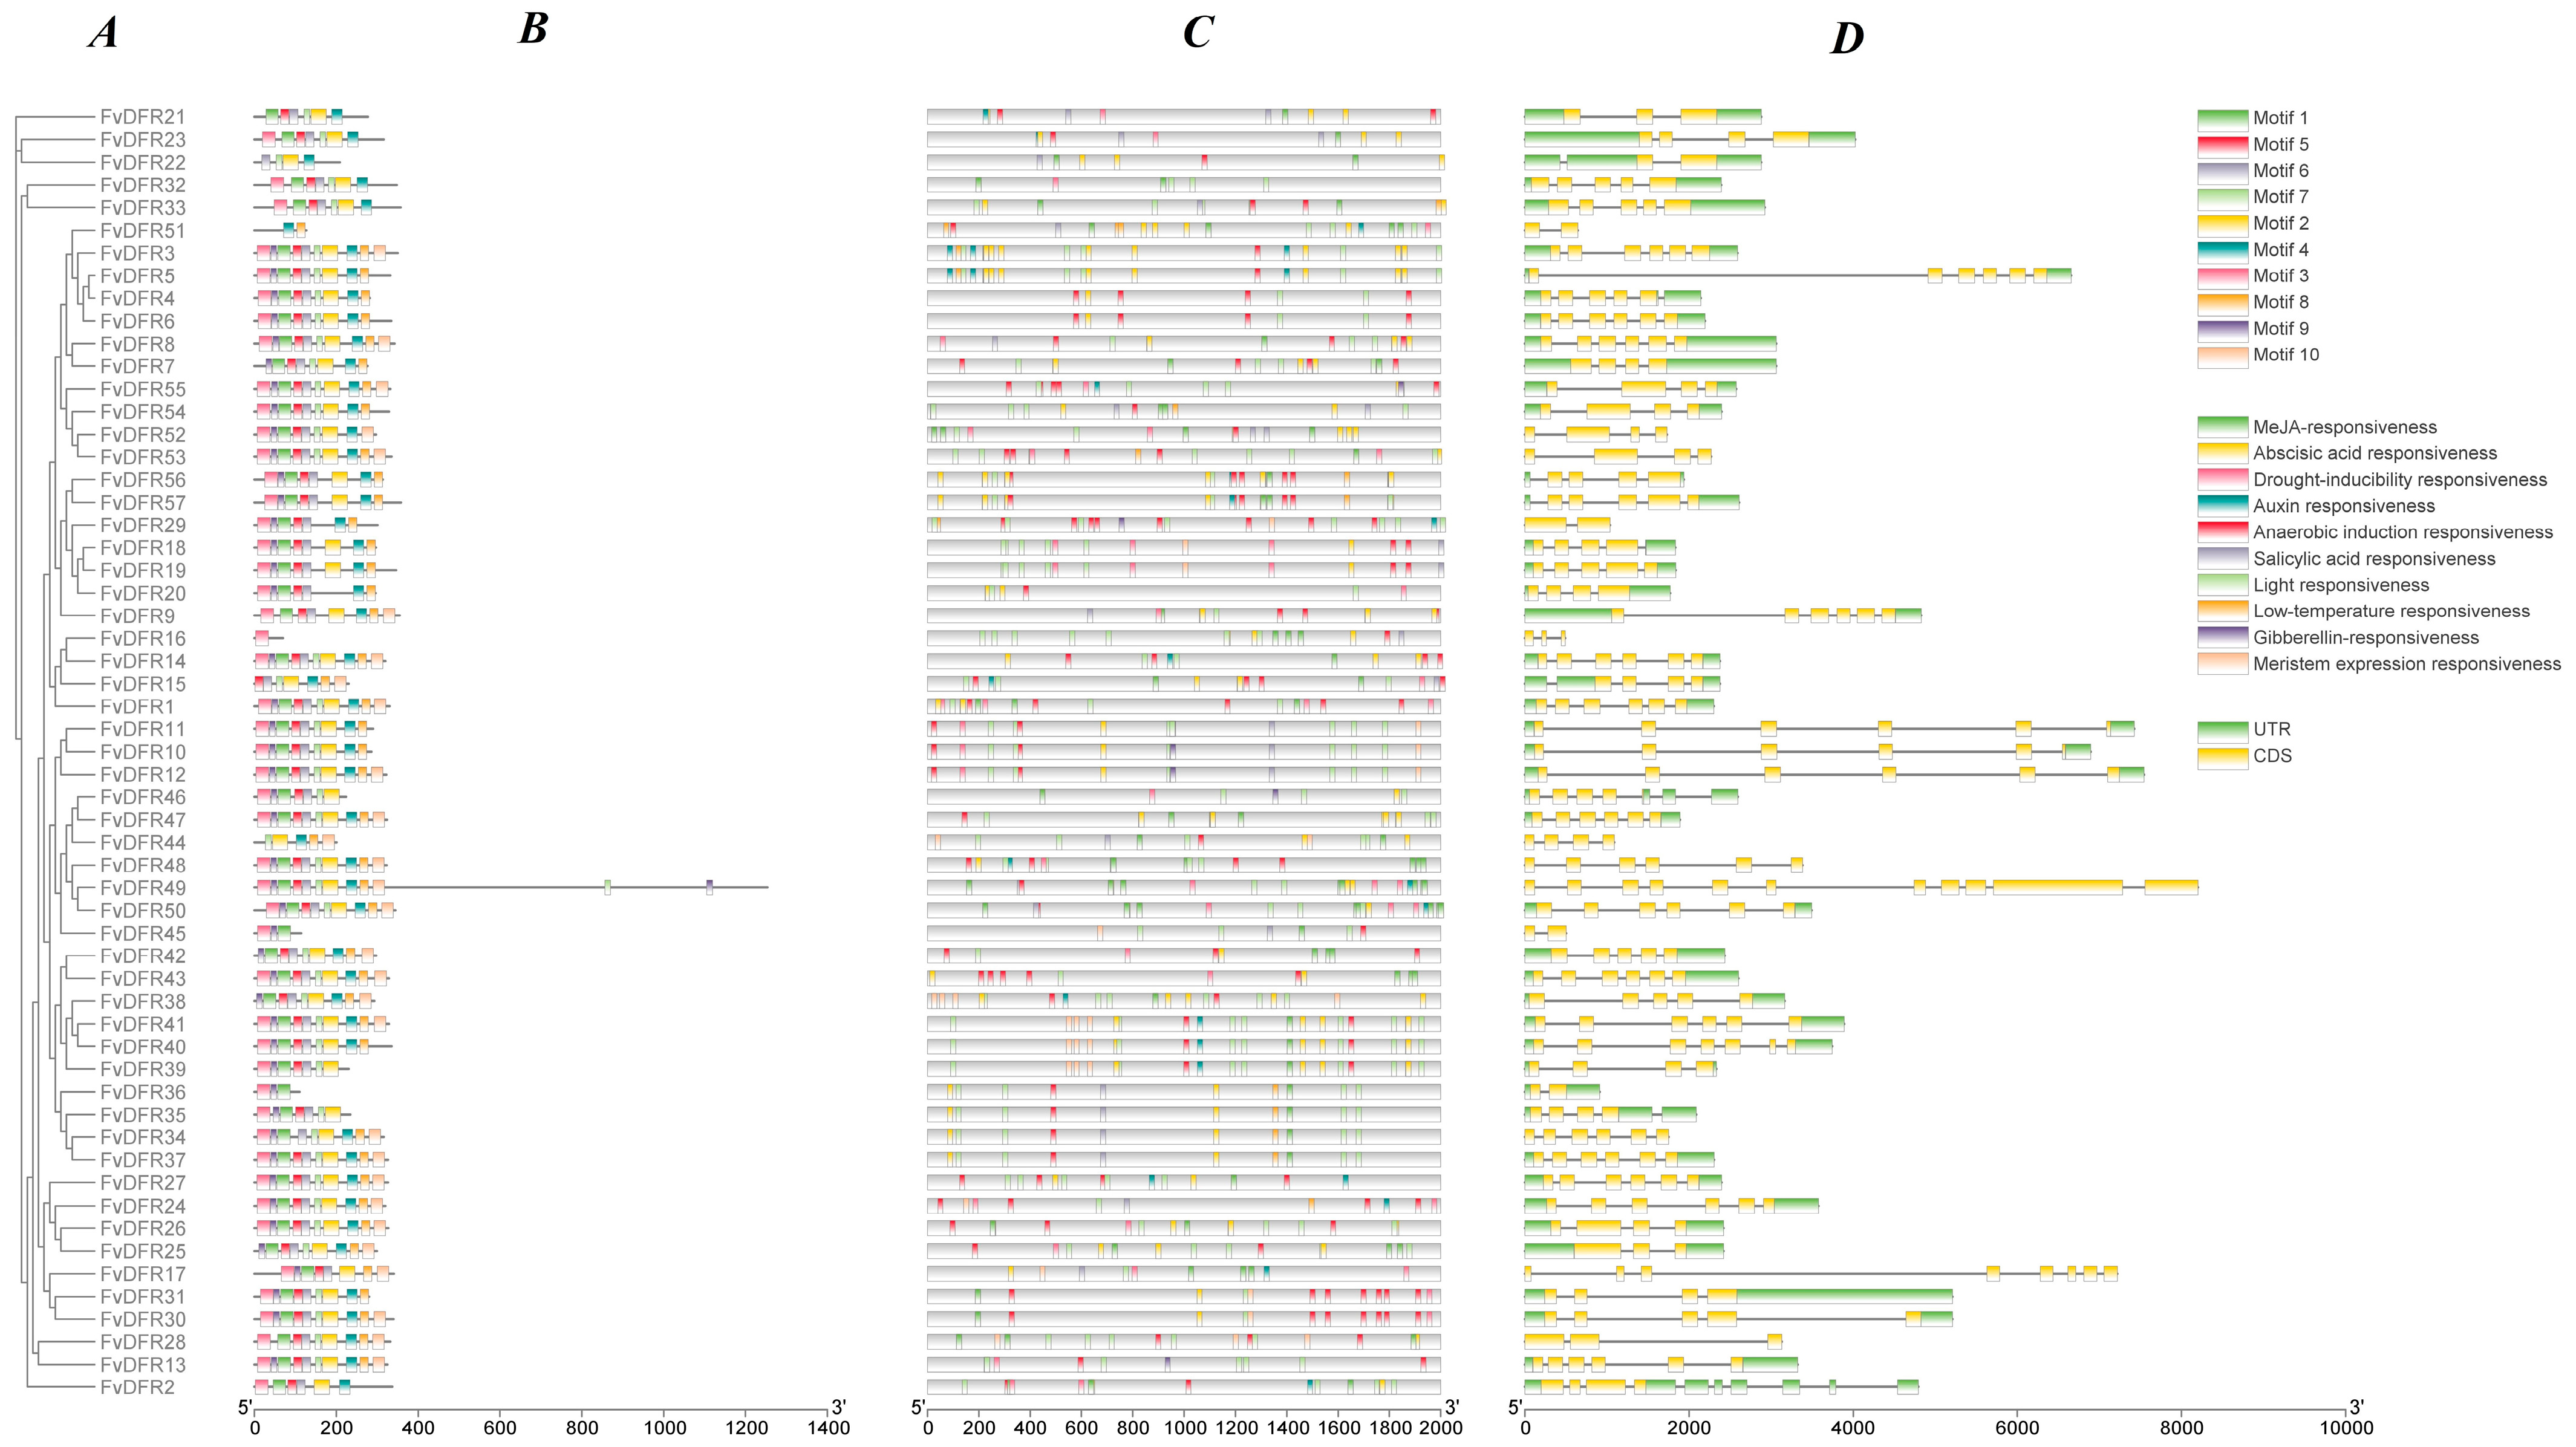
2.3. Analysis of Gene Structure, Motif, and cis-Acting Elements of Strawberry DFR Gene Family

MEME online (http://meme-suite.org/tools/meme, accessed on 4 June 2024) software was used to predict the strawberry family protein motifs for 10 motifs (Table 4). FvDFR16 contains only motif3, and FvDFR51 contains only two motifs, motif4 and motif8. The N terminus of most sequences is motif3, and the C termini are all motif10, of which FvDFR36 and FvDFR45 share the same motif and contain only motif1, motif3, and motif9. A total of 18 genes in FvDFR1, FvDFR3, FvDFR8, FvDFR12, FvDFR13, FvDFR14, FvDFR24, FvDFR26, FvDFR27, FvDFR30, FvDFR37, FvDFR41, FvDFR43, FvDFR47, FvDFR48, FvDFR50, FvDFR53, and FvDFR55 had the same motif (Figure 2A).
The FvDFR gene mainly contained light, hormone, abiotic stress, and meristem response elements, and the hormone response elements contained auxin, gibberelin, abscisic acid, salicylic acid, and methyl jasmonate response elements. The abiotic stress response elements contained low temperature, drought, and anaerobic induction. After analysis, we found that all except FvDFR21, FvDFR22, and FvDFR23 contained light response. All contained abscisic acid response elements except for FvDFR13, FvDFR24, FvDFR29, FvDFR32, and FvDFR45. And, the gibberellin response element appeared in the six genes FvDFR10, FvDFR12, FvDFR13, FvDFR29, FvDFR46, and FvDFR55 (Figure 2C).
According to the structure of the 57 genes in the strawberry DFR family (Figure 2D), the number of exons is between 2 and 11, and most genes contain 6 exons. The maximum number of FvDFR49 exons was 11, and the minimum number of exons in FvDFR29, FvDFR45, and FvDFR51 was 2. FvDFR16, FvDFR17, FvDFR28, FvDFR29, FvDFR34, FvDFR44, FvDFR45, FvDFR48, FvDFR49, FvDFR51, FvDFR52, and FvDFR53 had no upstream and downstream gene sequences. Other genes were structurally intact, and the gene structure of genes close to kinship has the same distribution and length.

2.4. Phylogenetic Tree Construction of the Strawberry DFR Family

According to this study, the strawberry DFR gene family is divided into six subfamilies according to a phylogenetic analysis (Figure 3). To further understand the evolutionary relationship between FvDFR and other species, this study performed a phylogenetic analysis of 7 species and 57 protein sequences in Arabidopsis thaliana, tomato, potato, grape, wheat, wild tobacco, and walnut. Subfamilies A, B, C, and D contain only strawberry DFR genes. FvDFR2 and FvDFR51 are separate subgroups A and B. The F subfamily contains only the NaDFR2 gene. There are 7 species genes of Arabidopsis thaliana, tomato, potato, grape, wheat, wild tobacco, and walnut in subfamily E, indicating that the DFR family gene of strawberry in subfamily E is closely related to other species.

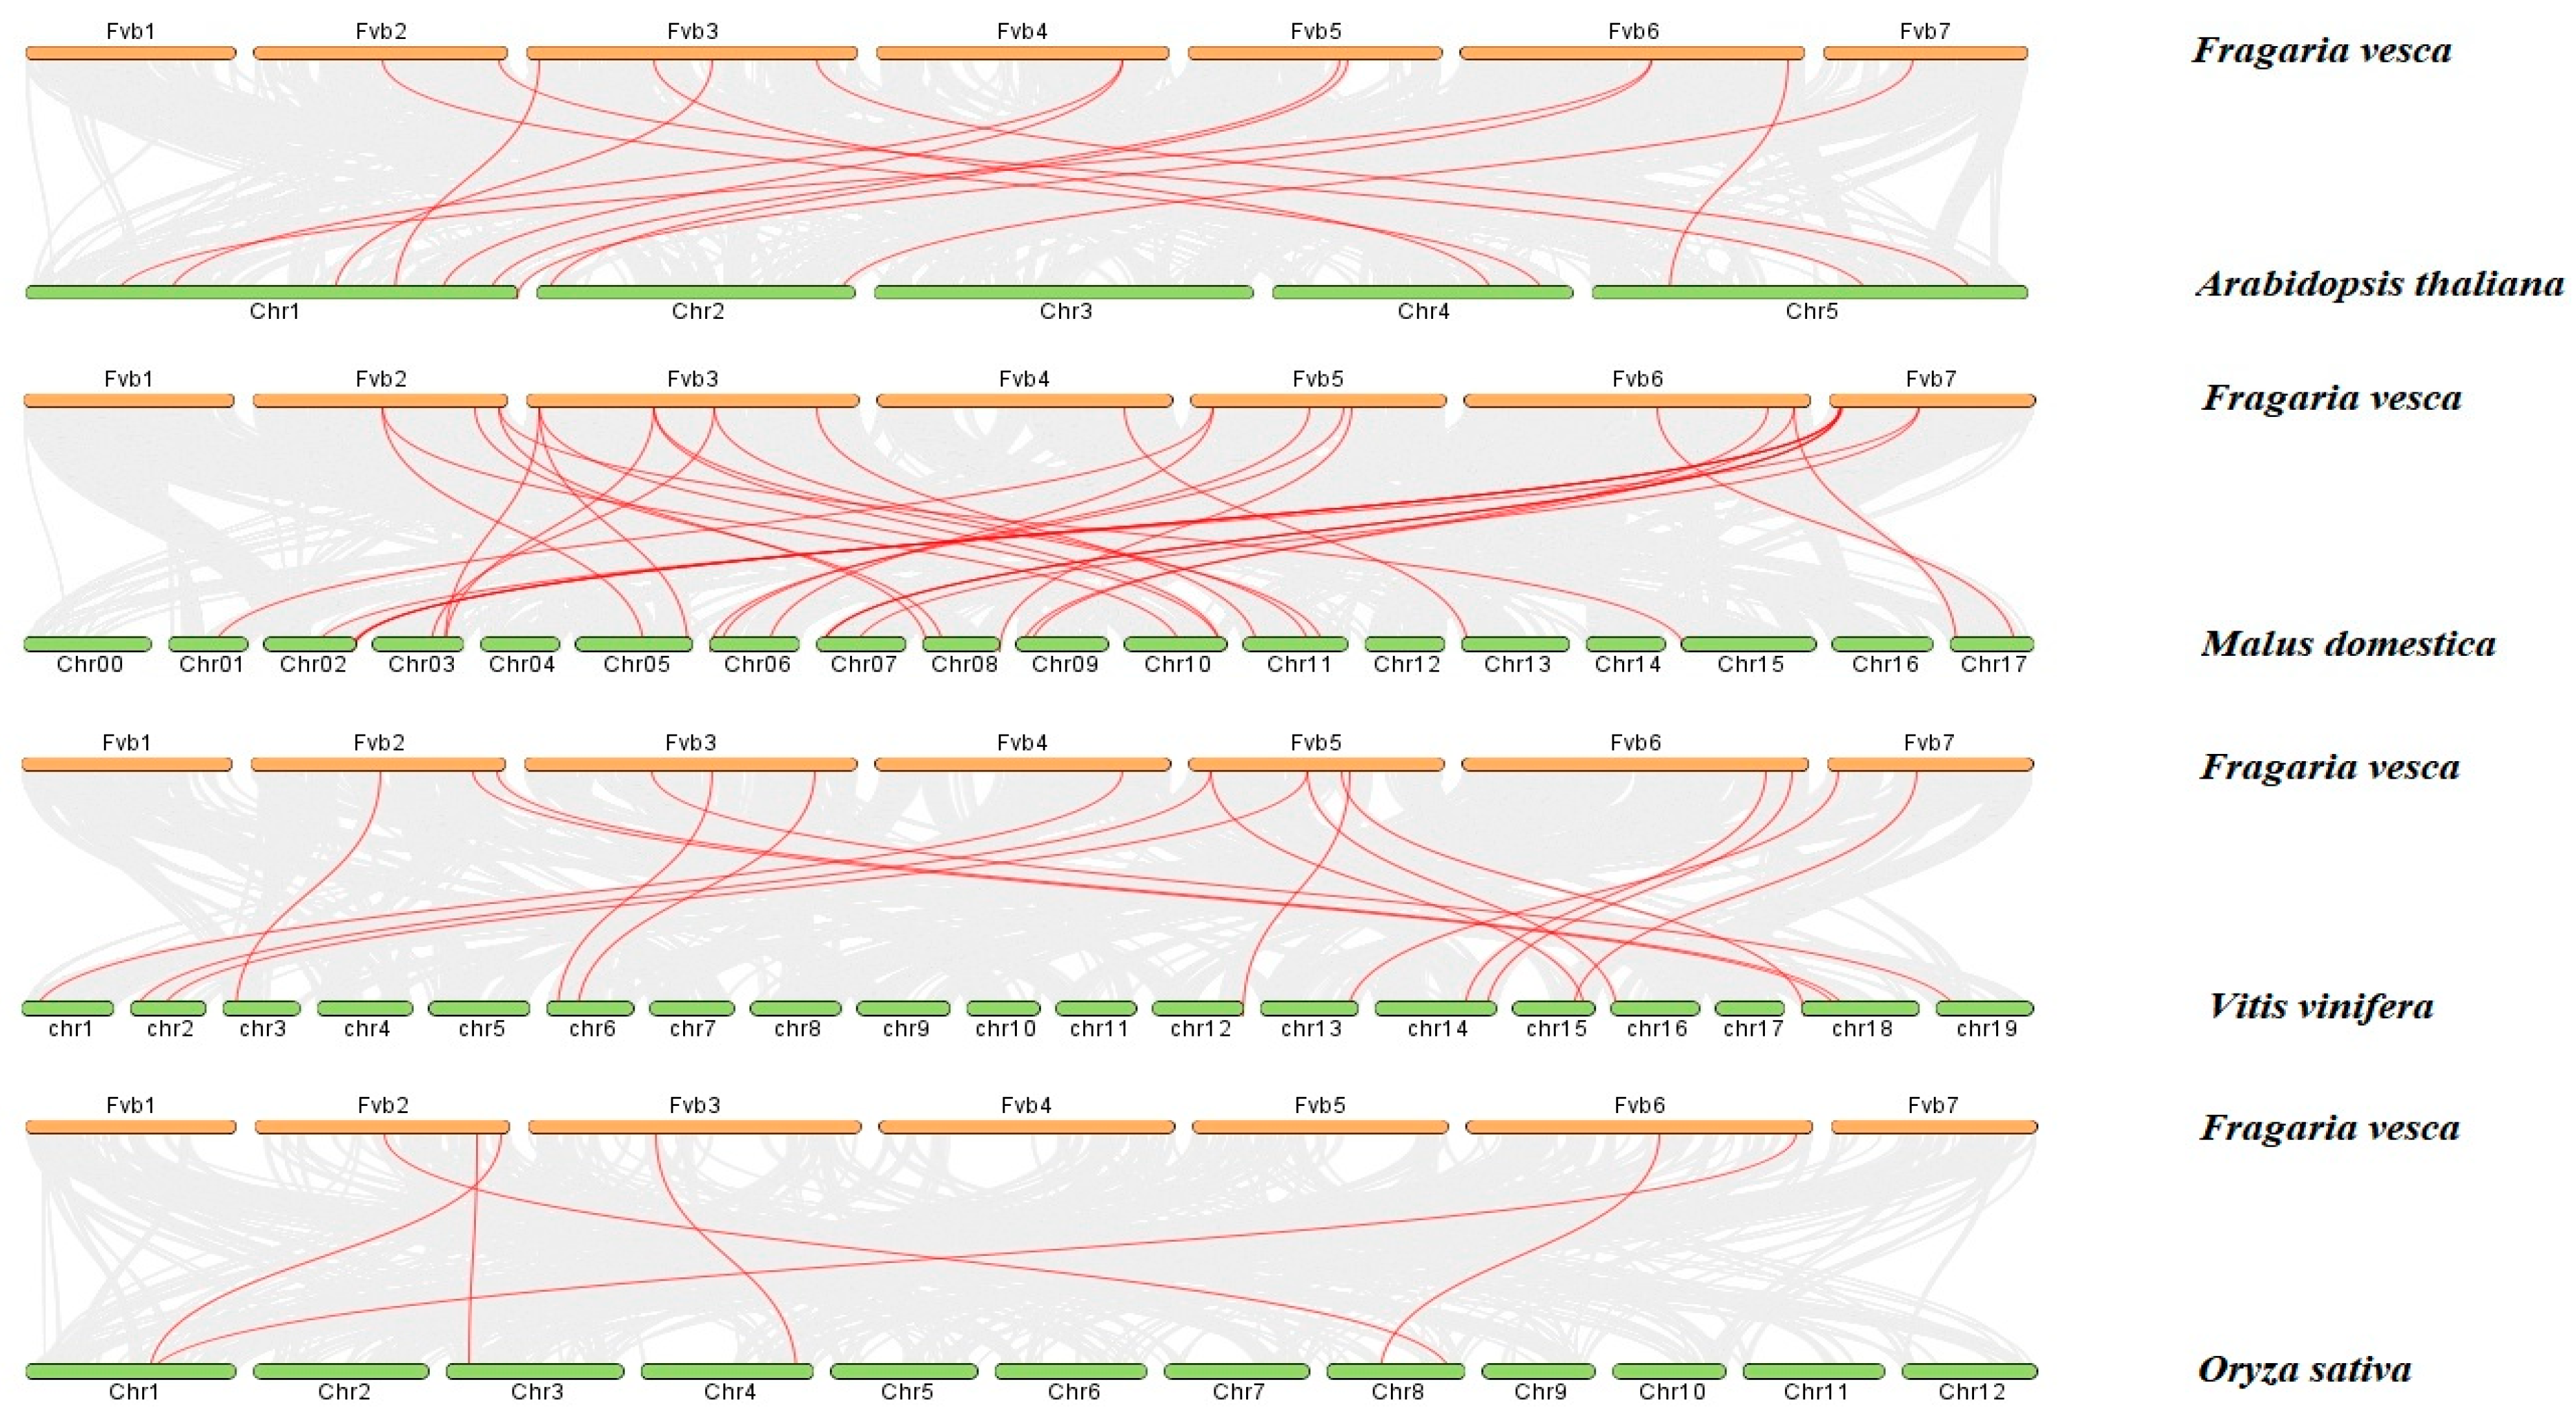
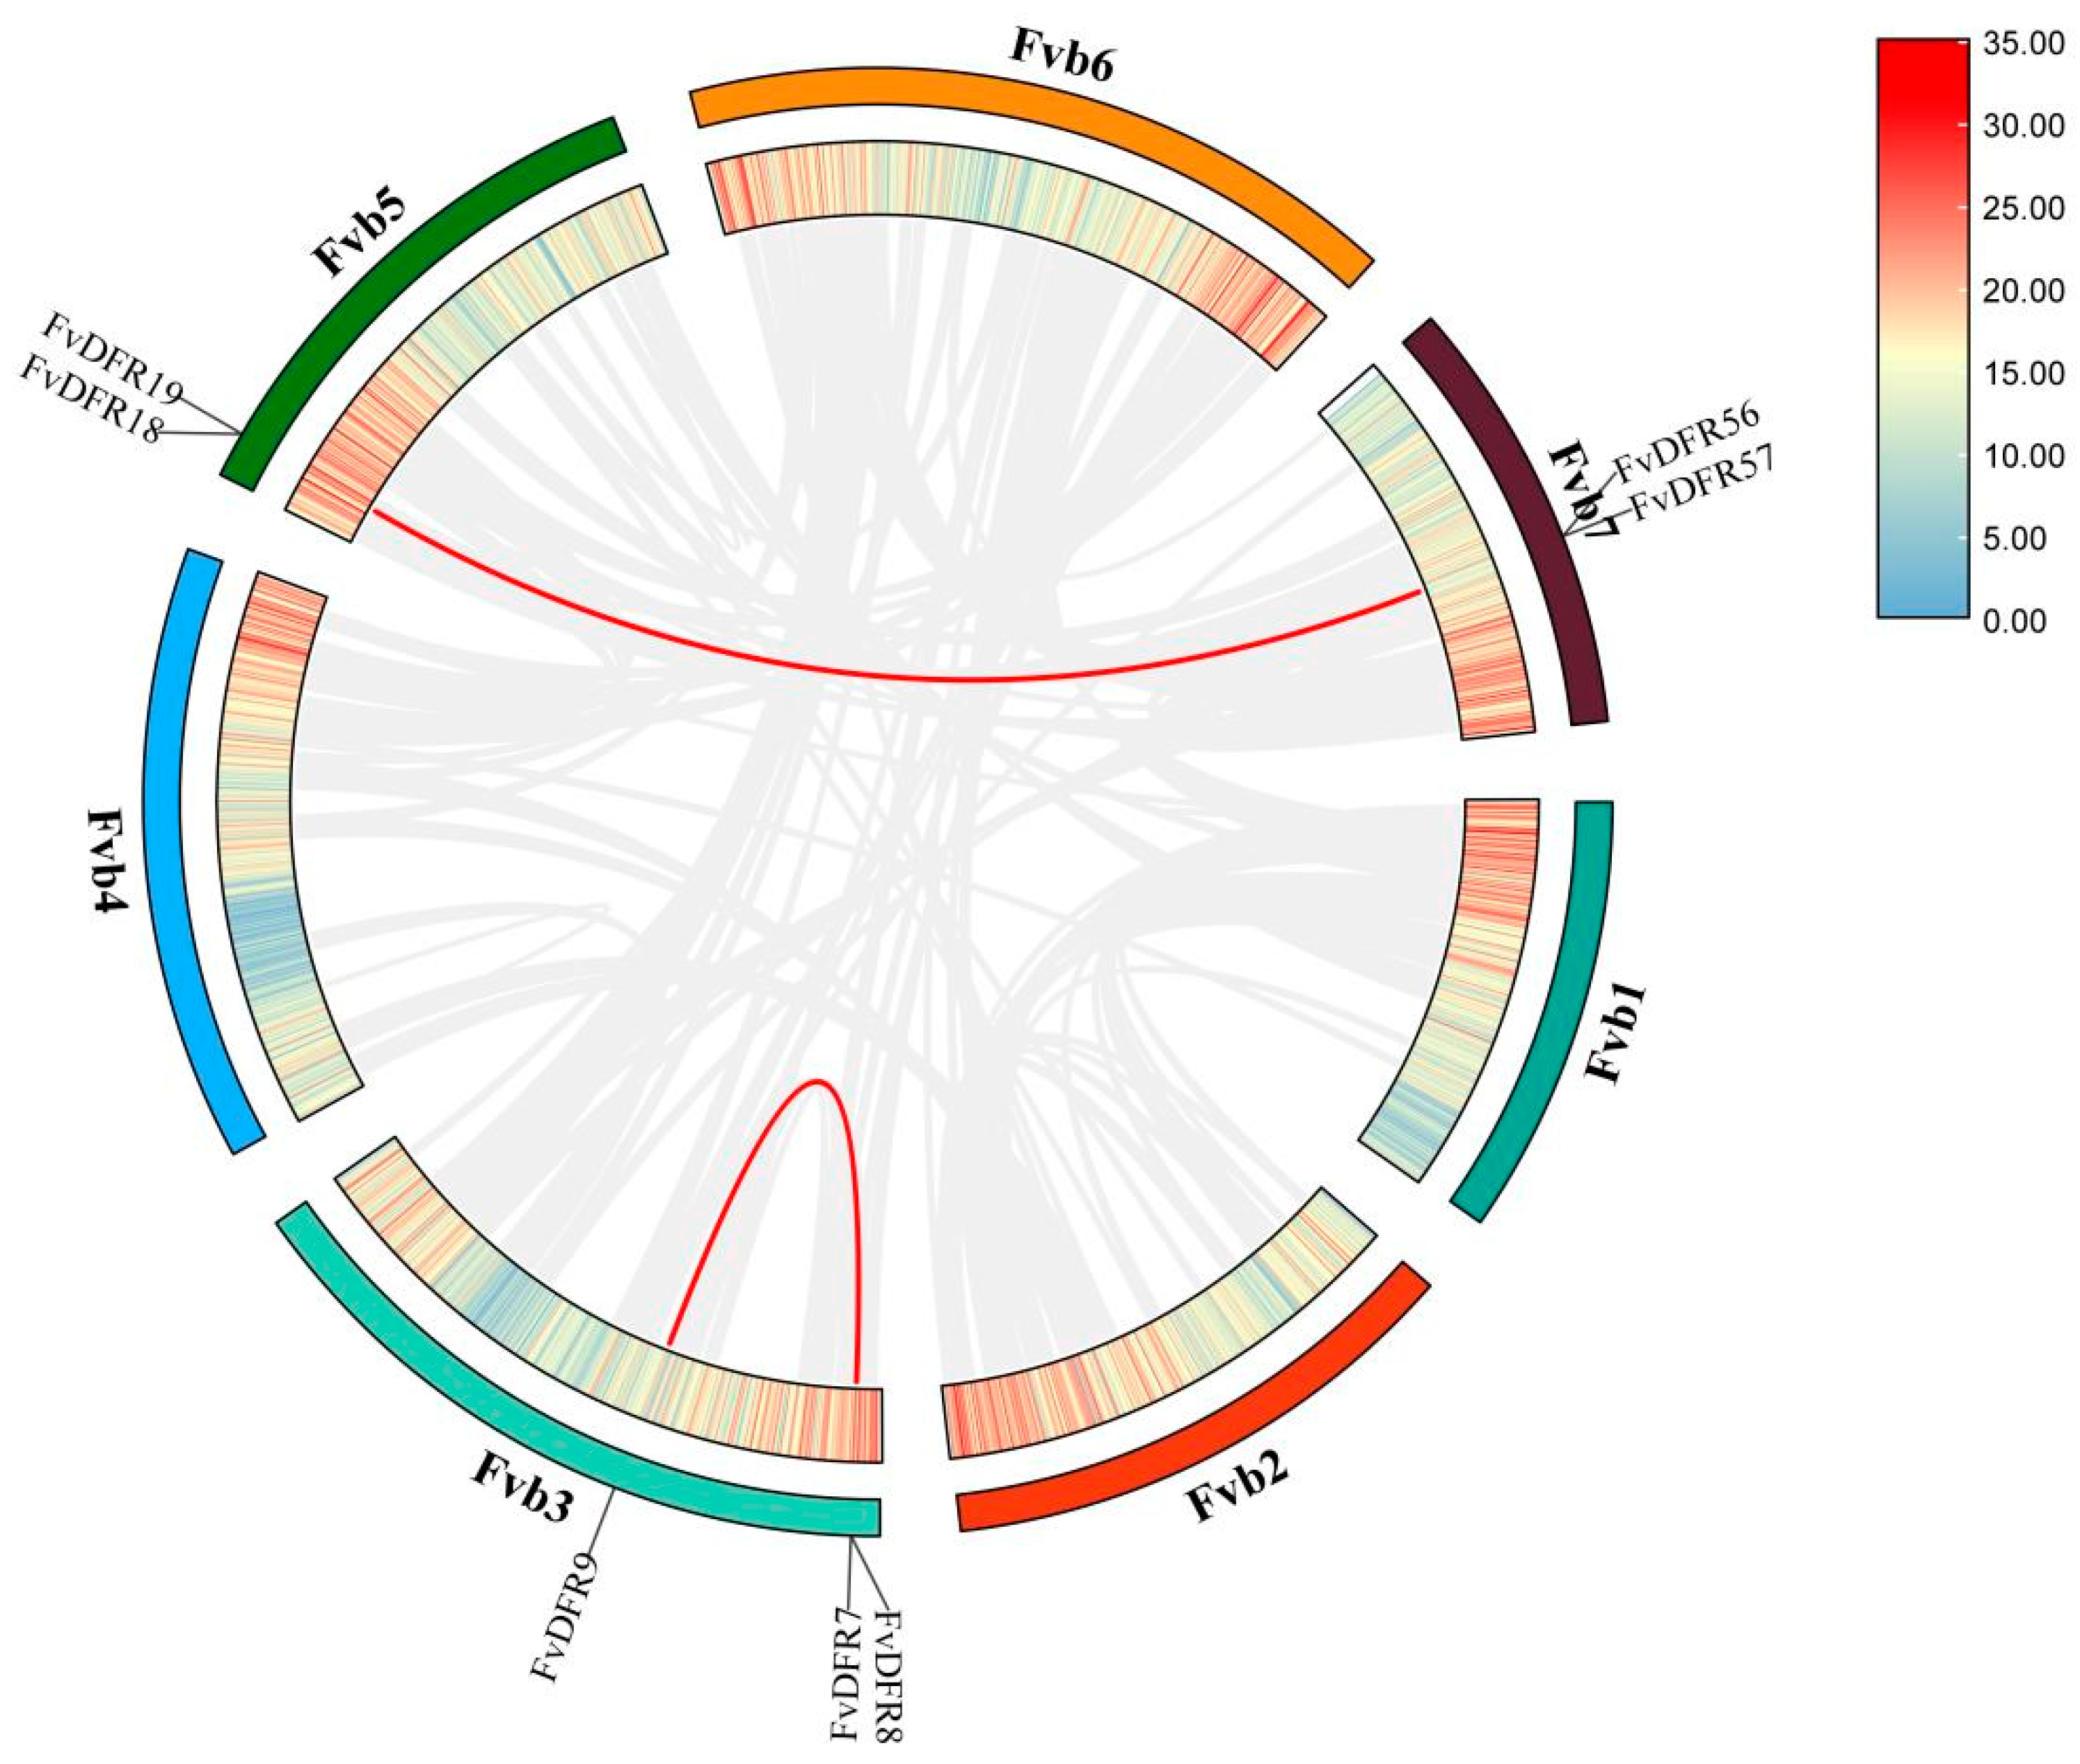
2.5. Collinearity Analysis of the Strawberry DFR Family

Through the analysis of the commonness among the DFR gene families of Arabidopsis apple, grape, and rice (Figure 4), it was found that strawberry and apple had 28 collinear gene pairs, which constituted the most pairs. It was followed by Arabidopsis and grape, with 14 and 17 gene pairs, respectively. There were the least six pairs of collinear genes in rice. The results showed that there were more homologous genes in strawberry and dicotyledon than in monocotyledon. A total of four collinearity relationships were found within the DFR gene family species (Figure 5). Located on chromosomes 3, 5, and 7, they are FvDFR19/FvDFR57, FvDFR18/FvDFR56, FvDFR9/FvDFR8, and FvDFR9/FvDFR7, respectively. The results suggest that some FvDFR genes may be produced by gene replication, and these genes may have similar functions.

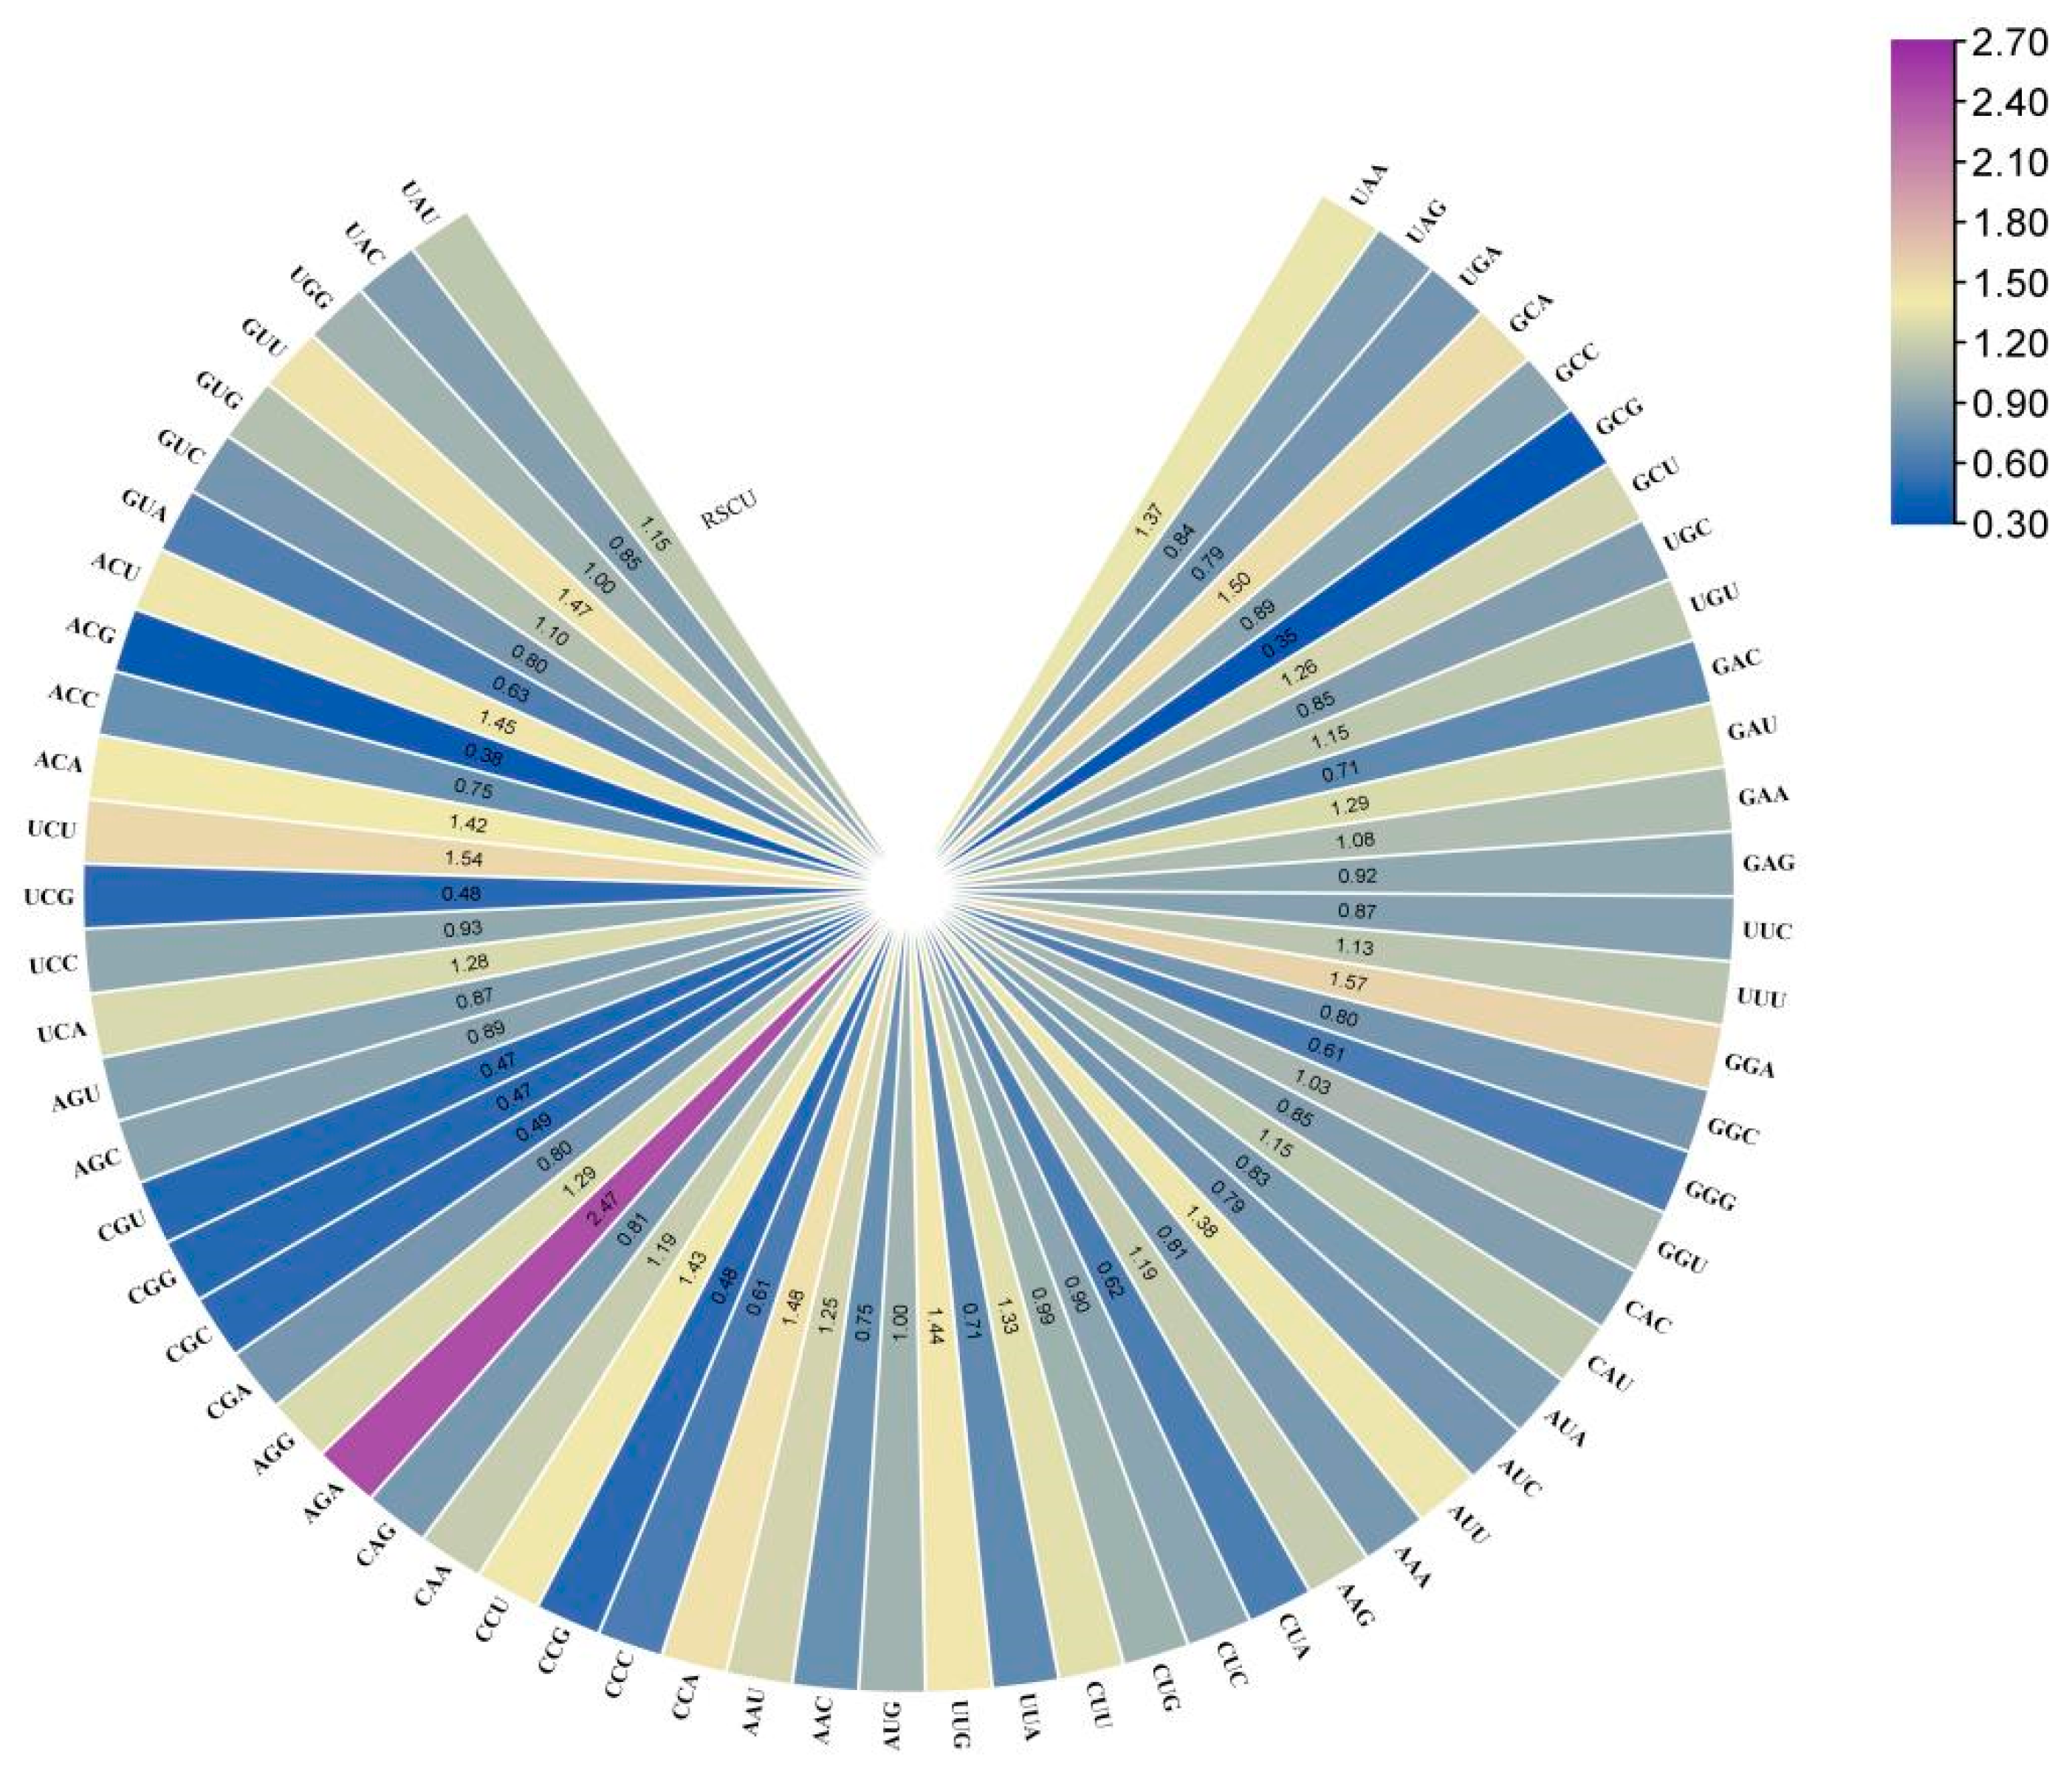
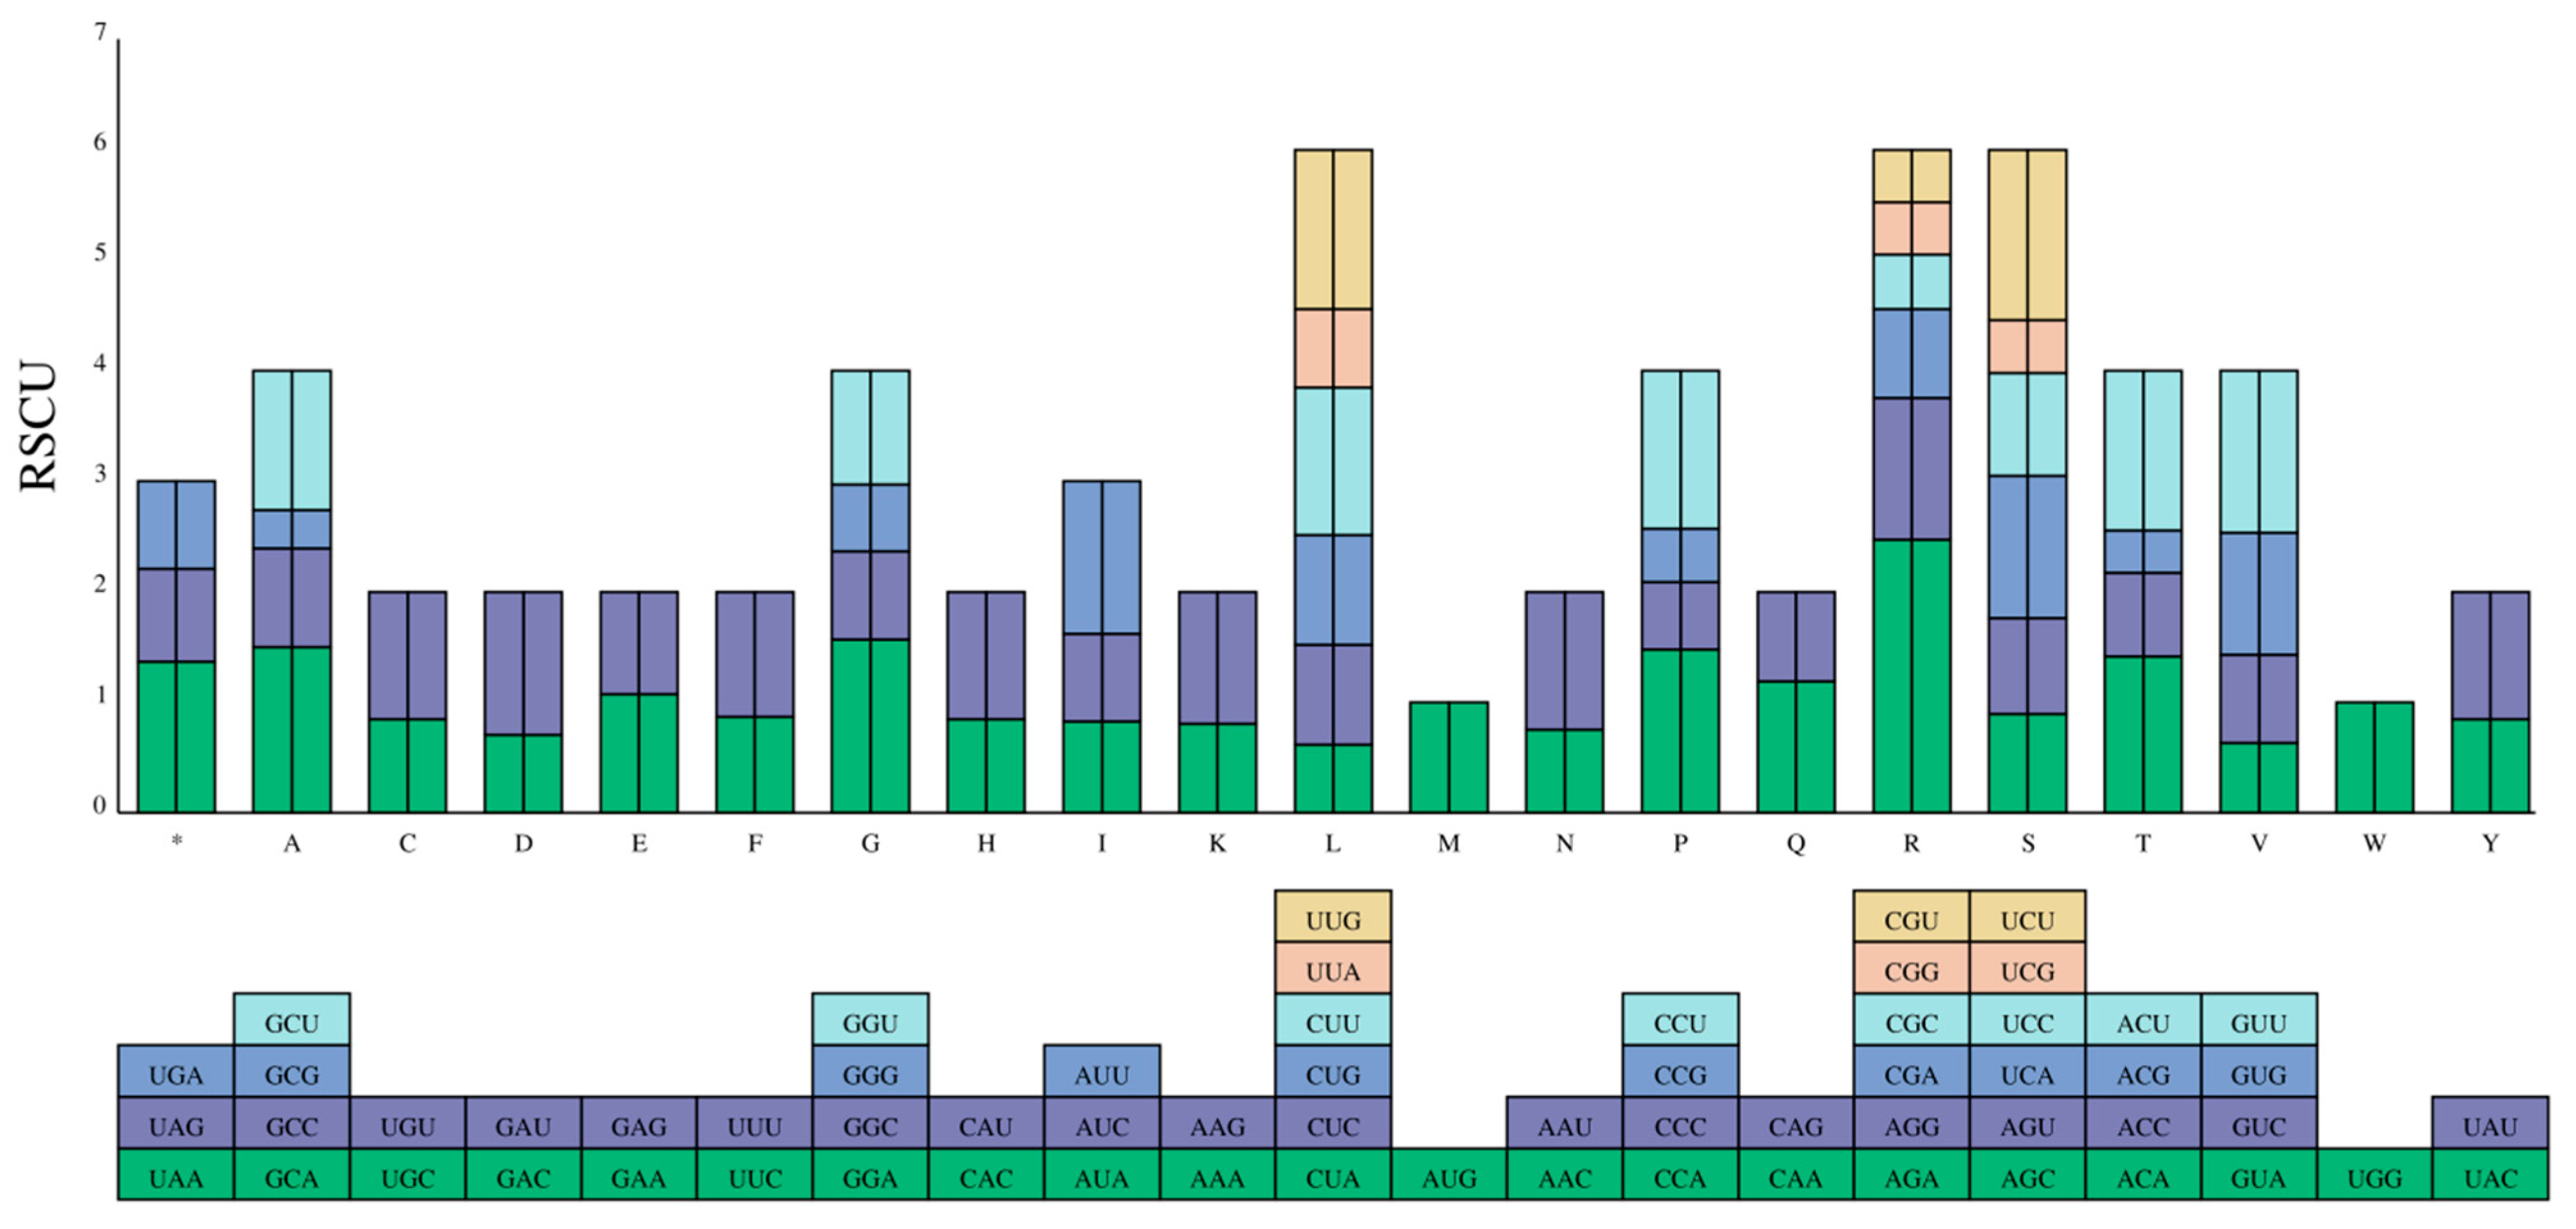
2.6. Codon Preference Analysis of the Strawberry DFR Family

By calculating the RSCU value of 57 CDS sequences in the strawberry DFR family, there were 27 high-frequency codons (RSCU > 1) in the strawberry sucrose phosphate synthetase CDS sequence, including two codons with RSCU = 1 and one codon with RSCU > 2 (Figure 6), indicating that there is a highly preferred codon in the strawberry DFR gene. The AGA codon used the highest frequency, at 2.4712, and the translated alanine GCG was the lowest, at 0.3464 (Figure 7).

2.7. Analysis of the Expression Patterns of the DFR Gene Family in Strawberry

The expression levels of the DFR family in different plant organs were significantly different. FvDFR1 is almost not expressed in many tissues and is only expressed in late anther development. The expression levels of FvDFR10, FvDFR11, and FvDFR12 were higher in the late stage of seed and anther development. The expression level of FvDFR32 was higher in mature seeds. The expression levels of FvDFR30, FvDFR31, and FvDFR55 were higher in flesh and peel during ripening, but lower in other periods. The contents of FvDFR3, FvDFR4, FvDFR5, and FvDFR6 in pericarp and seeds were higher in the mid-ripening stage. These genes may be involved in pigment synthesis (Figure 8).

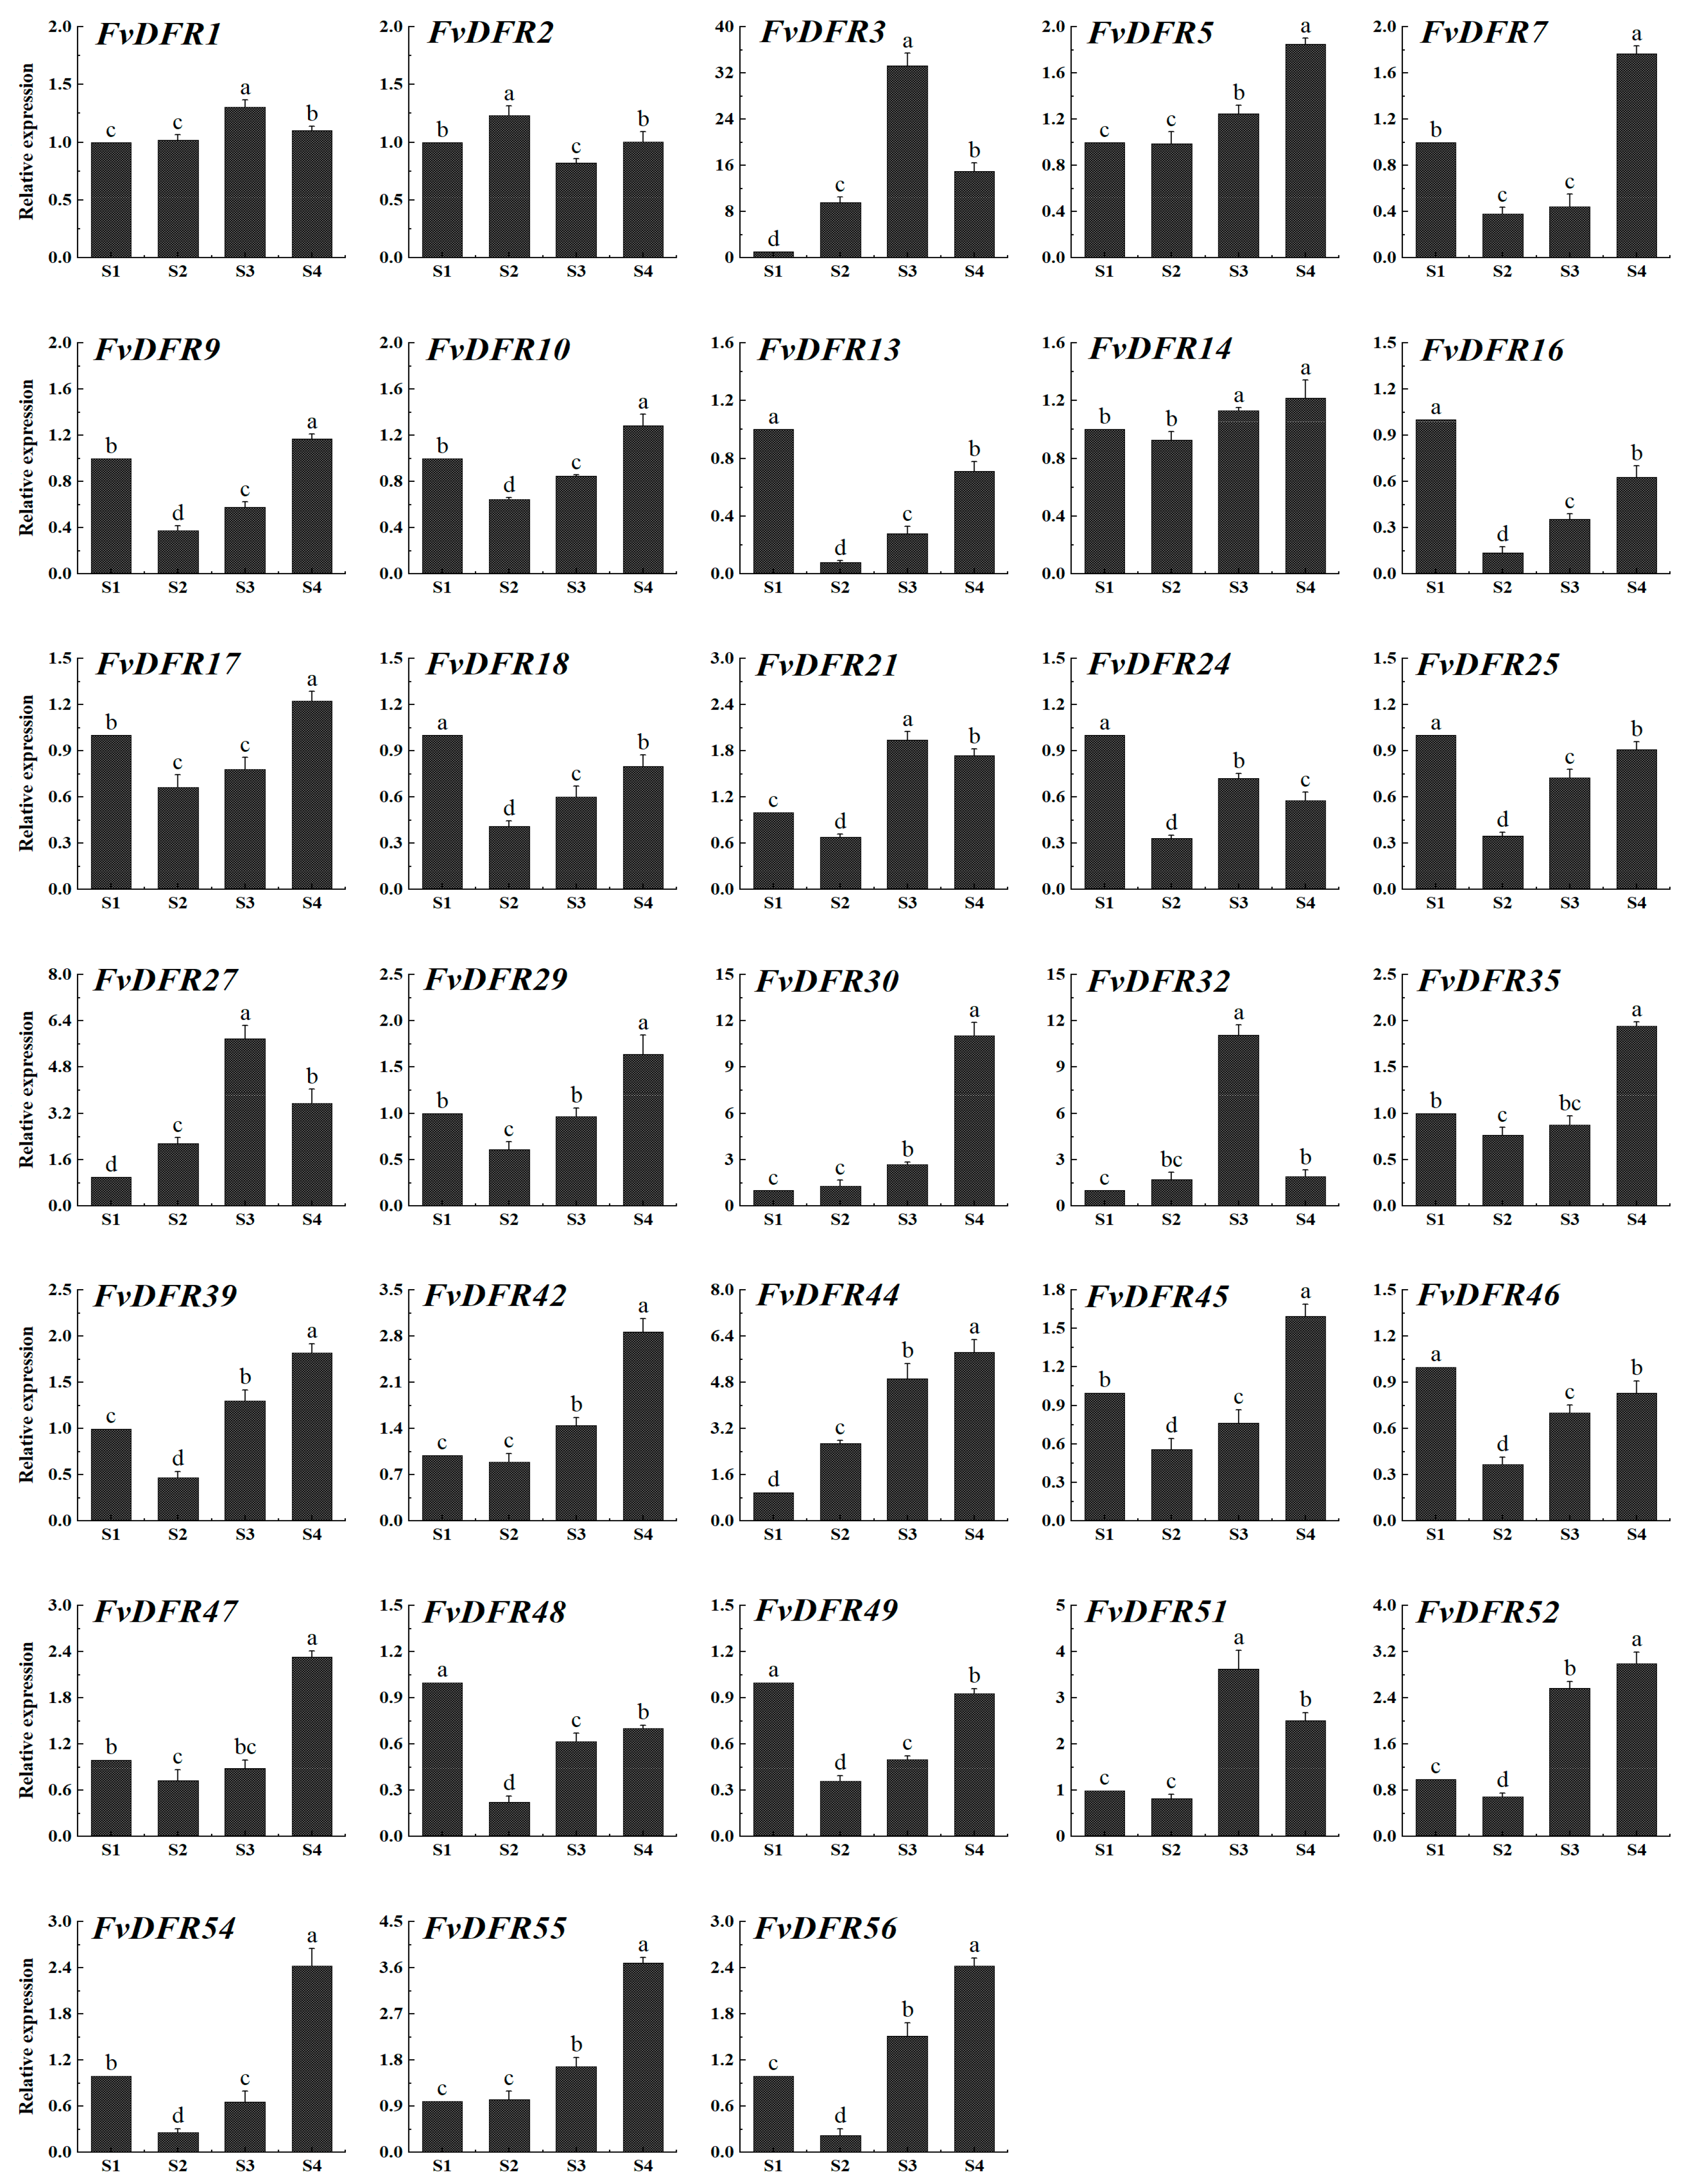
2.8. Quantitative Fluorescence Analysis of Strawberry DFR Gene Family and Determination of Anthocyanin Content in Strawberry Fruit

From S1 to S4, there are different coloring stages of strawberries. According to the determination of anthocyanin content (Figure 9), the content of anthocyanin kept increasing and the content of S4 period reached 40 times that of S1 period. With the increase in fruit coloring, the content of anthocyanin gradually increased. Thus, the higher the anthocyanin content, the darker the strawberry color.
The qRT-PCR results (Figure 10) verified the transient expression levels of strawberry fruit in different periods and analyzed the significant relative expression differences between treatments. The analysis found that most of the members had the highest gene expression in the S4 period, and the expression of DFR genes in early fruit color stages was mostly lower than in the middle and later color stages. Among them, the expression levels of five genes, FvDFR5, FvDFR30, FvDFR42, FvDFR44, and FvDFR55, showed an increasing trend in general, which was consistent with the trend of anthocyanin content. The expression levels in S4 were 2, 8, 3, 7, and 4 times higher than those in S1. FvDFR13, FvDFR16, FvDFR18, FvDFR24, FvDFR25, FvDFR46, FvDFR48, and FvDFR49 showed the highest gene expression in the S1 period. However, there was an upward trend from S2 to S4. These results suggest that this gene promotes anthocyanin accumulation in the S2, S3, and S4 phases and may be involved in anthocyanin regulation. In addition, FvDFR1, FvDFR3, FvDFR21, FvDFR27, FvDFR32, and FvDFR51 showed the highest gene expression levels in the S3 period. Overall, the expression level increased first and then decreased. The expression levels of these six genes in S3 were 1.3, 34, 2, 7, 7 and 3.5 times of those in S1, respectively. This suggests that the gene is highly expressed during the rapid accumulation of fruit pigment and may regulate anthocyanin synthesis.

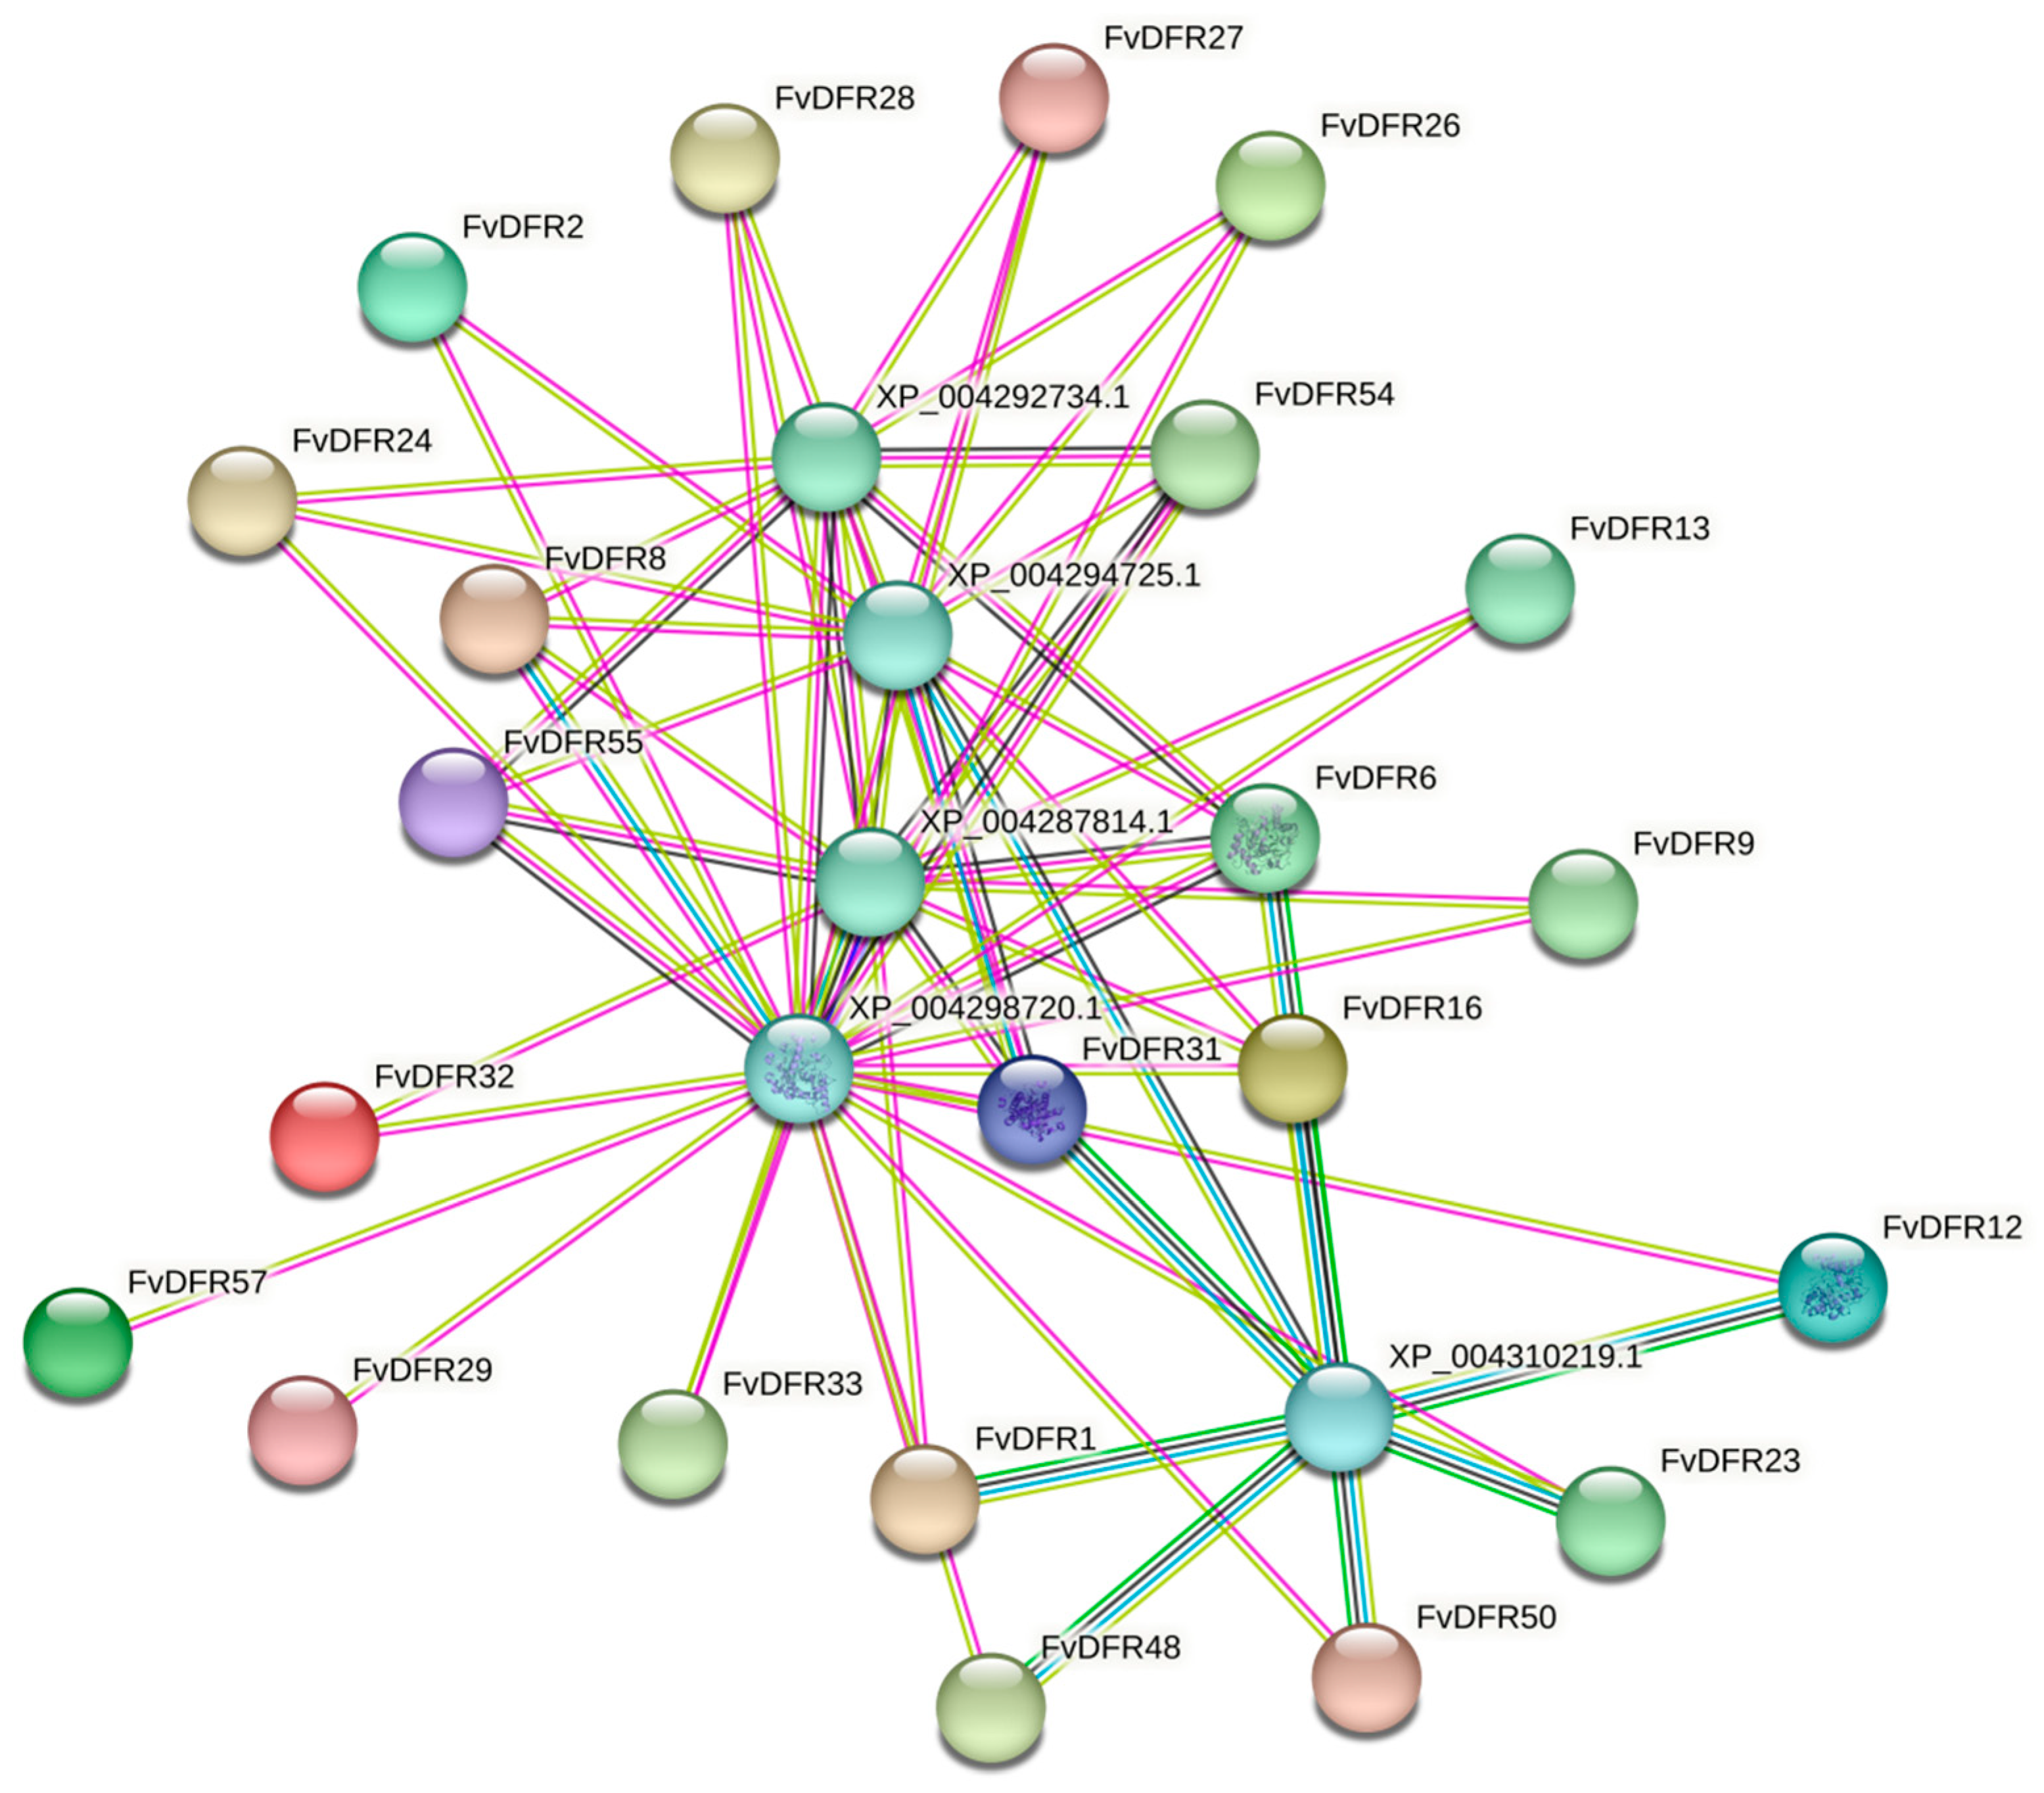
2.9. Protein Interaction Network Analysis and Prediction of Strawberry DFR Gene Family

The interactions between the 57 FvDFR proteins were predicted by the STRING website. The results display, FvDFR1, FvDFR2, FvDFR6, FvDFR8, FvDFR9, FvDFR12, FvDFR13, FvDFR16, FvDFR23, FvDFR24, FvDFR26, FvDFR27, FvDFR28, FvDFR29, FvDFR31, FvDFR32, FvDFR33, FvDFR48, FvDFR50, FvDFR54, FvDFR55, and FvDFR57; these 22 FvDFR proteins were identified by 4-hydroxycoumarin synthase (XP_004292734.1), trans-cinnamate 4-monooxygenase (XP_004294725.1), naringenin (XP_004287814.1), leucoanthocyanidin dioxygenase (XP_004298720.1), and 4-coumarate-CoA (XP_004310219.1) ligase interact to form a protein interaction network (PPI network) (Figure 11).

3. Discussion

At present, there is still a gap in the research on the DFR gene in strawberry at home and abroad. In this study, qRT-PCR was used to study the expression characteristics of this family member. The results showed that there were 57 members of the DFR gene family in strawberry, which were mainly expressed in the cytoplasm and chloroplast; most of them were hydrophilic proteins; and the secondary structure of the protein was mainly composed of α-helices and random coils. The analysis revealed that FvDFR genes mostly contain light, hormone, abiotic stress, and meristem response elements. From the results of the qRT-PCR analysis, the relative expression of each member of the FvDFR gene was significantly different, which was expressed throughout the process of fruit coloring. Most genes had the highest expression levels in the full coloring stage (S4).
Dihydroflavonol-4-reductase (DFR) catalyzes the first reaction leading to anthocyanins, and it is considered a key regulatory enzyme of anthocyanin biosynthesis in plants [9]. The DFR gene family has been identified in multiple species, such as the Brassica rapa [19], grapes [20], turnip [21], turnip radish [22], and lily [23]. The DFR gene family may also be present in other plants. In this study, 57 members of the DFR gene family were identified in a strawberry genome database using the bioinformatics method. However, compared with the 26 members of rape [24] and the 96 members of apple [25], the number of DFR gene families in strawberry is larger, reflecting the large differences between different species. The physicochemical properties, subcellular localization, and cis-acting elements of the DFR gene family were then predicted and analyzed. According to the protein sequence analysis, 68.4% of DFR family members are hydrophilic proteins and 85.9% are stable proteins. In their secondary structure, α-helices and random coils are the main secondary structure elements; when compared with the study by Hu Yong [26], the study findings were consistent. This experimental subcellular localization analysis revealed that it was mainly expressed in the cytoplasm. DFR gene expression varies in different species, such as soybean GmDFR protein being mainly found in the nucleus (34.8%) and the cytoplasm (21.7%) [27], perhaps because the distant relationship between species leads to different results. But, the Paeonia delavayi DFR protein is mainly found in the cytoplasm [28], and the Ophiorrhiza japonica DFR3 protein is most likely to locate in the cytoplasm [29]. These conclusions are all consistent with the conclusions of this paper. A fhylogenetic analysis of the strawberry DFR family divided these 57 genes into six subfamilies, and other species were only found in subfamilies E and F, indicating close proximity to them. In general, genes located in the same clade can be speculated to have similar biological functions if they have sequences with high similarity to each other.
From the expression of the DFR gene family in various tissues, we showed that FvDFR9, FvDFR10, FvDFR11, FvDFR12, FvDFR14, and FvDFR15 were all high in the anther period. FvDFR3, FvDFR4, FvDFR5, FvDFR6, FvDFR7, and FvDFR8 were high in the pericarp period. It is found that DFR genes in different species are differently expressed in different tissues at different periods. For example, the AcDFR gene in aconite is mainly expressed in flowers, and it is hardly expressed in roots, stems, and leaves [29]; with the initial DFR gene in the calyx to the full bud period, the relative expression of DFR is increasing, especially from the initial flowering period to the full flowering period [30], consistent with the findings presented here.
Dihydroflavonol-4-reductase (DFR) is a key enzyme in the third phase of anthocyanin synthesis that catalyzes the formation of colorless anthocyanin by dihydroflavonols [31]. According to the qRT-PCR results, most genes had the highest expression during the S4 period. In the determination of anthocyanin content, the anthocyanin content was the highest in the S4 period and the deepest fruit color in this period. In combination with the tissue expression, FvDFR5, FvDFR7, FvDFR17, FvDFR44, and FvDFR45 all showed the highest expression in the fruit, and the higher the DFR gene expression, the higher the anthocyanin content. Different species and content of anthocyanin are found in different tissues of the DFR gene, with the higher content of anthocyanin in darker parts [32]. Based on the analysis of anthocyanin content in blueberry, the DFR gene was responsible for catalyzing the production of anthocyanins, which played a significant positive role in regulating anthocyanin synthesis. The higher the gene expression level, the higher the total anthocyanin content [33]. These results are consistent with the results of this study. It is speculated that the DFR gene may be the key gene in anthocyanin synthesis.
An analysis of the results showed that the seven genes, FvDFR1, FvDFR3, FvDFR21, FvDFR27, FvDFR32, FvDFR48, and FvDFR51, showed the highest expression in the S3 period, and the anthocyanin content showed a trend of the first increasing and then decreasing. In eggplant fruit, the relative content of anthocyanins first increased and then decreased, and the DFR expression of purple eggplant was consistent with the change in the relative content of anthocyanins [34], consistent with the research results of this paper. These seven DFR genes are highly expressed during the rapid accumulation of fruit pigment. The lowest expression of the eight genes, FvDFR29, FvDFR32, FvDFR39, FvDFR45, FvDFR51, FvDFR52, FvDFR54, and FvDFR56, was found in the fruit turn period. In safflower strawberry, the expression of four structural genes, FpDFR1, FpDFR2, FpDFR3 and FpANS1, in L (bud stage), Z (color turning stage), and D (big bud stage) was the highest in the lowest bud period, but the lowest in the color turning period [35], consistent with the research results of this paper. We preliminarily showed that the DFR gene plays a key role in regulating the fruit coloring of strawberry.

4. Materials and Methods

4.1. Plant Materials

“Monterey” strawberry fruit was selected as the research material, and fruits from the green fruit stage (S1), 20% coloring stage (S2), 50% coloring stage (S3), and fully colored stage (S4) were collected. A total of 15 fruit samples were collected at different coloring stages, and every fifth fruit was a duplicated, accurately weighed, quickly frozen with liquid nitrogen, and stored at −80◦C for subsequent experiments.

4.2. Identification of the Strawberry DFR Gene Family

The CDS sequence of the DFR gene family was downloaded from the Arabidopsis genome database TAIR (https://www.arabidopsis.org/, accessed on 14 May 2024), and the forest strawberry annotation group file was downloaded using phytozome13 (https://phytozome-next.jgi.doe.gov/, accessed on 16 May 2024) [36]. The DFR family of forest strawberry was compared with the downloaded Arabidopsis thaliana using TBtools software, and 64 candidate genes were selected. Then, NCBI (https://www.ncbi.nlm.nih.gov/cdd/, accessed on 17 May 2024) was used for functional domain screening, and the candidate genes that did not contain the specific domain of the DFR gene (FR_SDR_e, NADP) were excluded. A total of 57 members of the strawberry DFR gene family were obtained after screening. The ExPASy (https://web.expasy.org/protparam/, accessed on 21 May 2024) [37] online website ProtParam tool was used to analyze the molecular weight, amino acid number, isoelectric point. and fat coefficient of the strawberry DFR gene after selection.

4.3. Chromosome Localization, Subcellular Localization, and Secondary Structure Analysis of the Strawberry DFR Gene Family

Gene Location Visualize from GTF/GFF in TBtools software was used to analyze and visualize the strawberry genome data. PRABI (https://npsa-prabi.ibcp.fr/cgi-bin/npsa_automat.pl?page=npsa_sopma.html, accessed on 25 May 2024) was used to analyze the secondary structure of the DFR gene family proteins, and WoLF PSORT (https://wolfpsort.hgc.jp/, accessed on 27 May 2024) was used to predict the subcellular localization of the strawberry DFR gene family [38].

4.4. Analysis of Gene Structure, Motif, and cis-Acting Elements of Strawberry DFR Gene Family

A promoter cis-acting element analysis was performed using PlantCARE (http://bioinformatics.psb.ugent.be/webtools/plantcare/html/, accessed on 30 May 2024) [39]. MEME (http://meme-suite.org/tools/meme, accessed on 4 June 2024) was used for a protein motif analysis. Gene Structure View (Advanced) in TBtools software was used for a gene structure analysis.

4.5. Phylogenetic Tree Construction and Collinearity Analysis of the Strawberry DFR Family

Annotated group files for Arabidopsis thaliana, grape, rice, and apple were downloaded via phytozome13 (https://phytozome-next.jgi.doe.gov/, accessed on 10 June 2024). The annotated genomic information of Arabidopsis thaliana, grape, rice, and apple was imported using TBtools for a comparative analysis among species. The annotation information of the strawberry genome was compared within species using MCScanX in TBtools [40]. The adjacency method (NJ) was used to construct a phylogenetic tree through One Step Build a ML Tree in TBtools, and the iTOL tool (https://itol.embl.de/, accessed on 14 June 2024) was used to beautify the tree.

4.6. Protein Interaction Network Analysis and Codon Preference Analysis of Strawberry DFR Gene Family

The strawberry DFR family protein sequence was used to construct the protein interaction network through the STRING database (https://cn.string-db.org/, accessed on 18 June 2024) [41]. The codon preference of the FvDFR gene was analyzed using Genepioneer (http://112.86.217.82:9919/#/, accessed on 20 June 2024). The RSCU file was then downloaded to process the data and draw the relative synonymous codon usage (RSCU) bar chart. TBtools software was used to visualize the RSCU heat map.

4.7. Tissue-Specific Expression Profile of the Strawberry DFR Gene Family

The tissue-specific expression profile was analyzed using Strawberry EFP Browser in BAR (https://bar.utoronto.ca/, accessed on 23 June 2024). The Primary Gene ID of strawberry was used for data analysis, and TBtools software was used for visualization.

4.8. Determination of Anthocyanin Content in Strawberry Fruits in Different Time Periods

A total of 1.0 g of strawberry fruit was ground in liquid nitrogen in a 10 mL centrifuge tube, washed with 1% HCl methanol solution, transferred to a test tube for scaling, mixed well, and extracted at 4 °C away from light for 20 min. It was then shaken several times throughout the period. With a 0.2 µm polyethersulfone filter membrane (Krackeler Scientific, Inc., Albany, NY, USA), the solution was filtered and the filtrate was collected. The TU-1900 double beam UV-visible spectrophotometer (Beijing Purkinje General Instrument Co., Ltd., Beijing, China) was then used to determine the absorbance value at 530 nm and 600 nm three times. The anthocyanin content (U) is represented as the difference between absorbance values at 530 nm and 600 nm per gram of fresh pericarp peel tissue, namely U = (OD530 − OD600)/gFW.

4.9. Quantitative RT-PCR (qRT-PCR) Analysis

The total RNA from strawberry fruit was extracted by CTAB and cDNA synthesized using the Prime Script RT reagent Kit (TaKaRa). Using the website of Biological Bioengineering (Shanghai) Co., Ltd. (https://www.sangon.com/new Primer Design, accessed on 25 June 2024), the primer was designed and synthesized for 33 strawberry DFR genes (Table 5). With the Light Cycler® 96 Real-time PCR System (Roche, Basel, Switzerland), real-time quantitative PCR was performed with strawberry GAPDH as the reference gene. The amplification reaction system totalled 20 μL: ddH2O 7 μL, cDNA 1 μL, 1 μL of each of the upstream and downstream primers, and SYBR Premix Ex Taq 10 μL. The reaction procedure was 95 °C predenaturing for 30 s, 95 °C denaturing for 10 s, 60 °C annealing for 30 s, and 72 °C extension for 30 s, with a total of 50 cycles. The test was repeated three times. Relative gene expression was calculated using the 2−ΔΔCt method [42,43] and plotted using SPSS 26 and Origin 2021.

5. Conclusions

In this study, 57 members of the strawberry DFR gene family were identified on six different chromosomes. The analysis found that most of the DFR gene family were hydrophilic proteins, and the protein secondary structure was dominated by α-helices and random coils. The results of qRT-PCR showed that the FvDFR3, FvDFR27, FvDFR32, and FvDFR51 expression levels were the highest in the rapid fruit coloring stage. The expression levels of FvDFR30, FvDFR54, and FvDFR56 were the highest in the complete fruit coloring stage. These genes can be used as candidate genes for further functional studies and are of great significance for further studies on the function of strawberry DFR family members.

Author Contributions

Z.-H.M. and Y.-J.H. designed the experiment; A.-Y.W. and Y.-Q.F. carried out the experiment; H.-L.Q. and X.L. performed the data analysis; X.-C.T. and L.-Z.C. wrote the manuscript. All authors contributed to this article and approved the version submitted. All authors have read and agreed to the published version of the manuscript.

Funding

This study was supported by the Student Research Training Program (SRTP) of Gansu Agricultural University (202312017), the National Natural Science Foundation of China (32160685), the Fuxi Young Talents Project of Gansu Agricultural University (GAUfx-04Y05), the Innovation Fund of Higher Education (2021B-142), and the Gansu Youth Talent Lifting Project (GXH202220530-06).

Institutional Review Board Statement

Not applicable.

Informed Consent Statement

Not applicable.

Data Availability Statement

The data that support the finding of this study are available from the corresponding author upon reasonable request.

Conflicts of Interest

The authors declare no conflicts of interest.

References

  1. Winkel-Shirley, B. Flavonoid biosynthesis. A colorful model for genetics, biochemistry, cell biology, and biotechnology. Plant Physiol. 2001, 126, 485–493. [Google Scholar] [CrossRef] [PubMed]
  2. Xie, S.; Zhao, T.; Zhang, Z.W.; Meng, J.F. Chemistry: Reduction of dihydrokaempferol by Vitis vinfera dihydroflavonol 4-reductase to produce orange pelargonidin-type anthocyanins. J. Agric. Food 2018, 66, 3524–3532. [Google Scholar] [CrossRef] [PubMed]
  3. O’Reilly, C.; Shepherd, N.S.; Pereira, A.; Schwarz-sommer, Z.; Bertram, I.; Robertson, D.S.; Peterson, P.A.; Saedler, H. Molecular cloning of the al locus in Zea mays using the transposable elements En and Mu1. Embo J. 1985, 4, 877–882. [Google Scholar] [CrossRef] [PubMed]
  4. Liu, J.; Feng, Q.; Zhang, J. Dihydroflavonol 4-Reductase Gene (DFR) and Flower Color Modulation. Plant Physiol. J. 2005, 41, 715–719. [Google Scholar]
  5. Yu, T.; Ni, X.; Gao, L.; Han, G.; Zhu, C.; Sheng, Y. Advances in Study of Dihydroflavonol 4-reductase (DFR) Genes of Higher Plants. Bull. Bot. Res. 2018, 38, 632–640. [Google Scholar]
  6. Tian, J.; Han, Z.; Zhang, J.; Hu, Y.; Song, T.; Yao, Y. The Balance of Expression of Dihydroflavonol 4-reductase and Flavonol Synthase Regulates Flavonoid Biosynthesis and Red Foliage Coloration in Crabapples. Sci. Rep. 2015, 5, 12228. [Google Scholar] [CrossRef]
  7. Petit, P.; Granier, T.; d’Estaintot, B.L.; Manigand, C.; Bathany, K.; Schmitter, J.M.; Lauvergeat, V.; Hamdi, S.; Gallois, B. Crystal structure of grape dihydroflavonol 4-reductase, a key enzyme in flavonoid biosynthesis. J. Mol. Biol. 2007, 368, 1345–1357. [Google Scholar] [CrossRef]
  8. Matsui, K.; Hisano, T.; Yasui, Y.; Mori, M.; Walker, A.R.; Morishita, T.; Kats, K. Isolation and characterization of genes encoding leucoanthocyanidin reductase (FeLAR) and anthocyanidin reductase (FeANR)in buckwheat (Fagopyrum esculentum). J. Plant Physiol. 2016, 205, 41–47. [Google Scholar] [CrossRef]
  9. Ni, J.; Ruan, R.; Wang, L.; Jiang, Z.; Gu, X.; Chen, L.; Xu, M. Functional and correlation analyses of dihydroflavonol-4-reductase genes indicate their roles in regulating anthocyanin changes in Ginkgo biloba. Ind. Crops Prod. 2020, 152, 112546. [Google Scholar] [CrossRef]
  10. Dzhanfezova, T.; Barba-Espín, G.; Müller, R.; Joernsgaard, B.; Hegelund, J.M.; Madsen, B.; Larsen, D.H.; Vega, M.M.; Toldam-Andersen, T.B. Anthocyanin profile, antioxidant activity and total phenolic content of a strawberry (Fragaria × ananassa Duch) genetic resource collection. Food Biosci. 2020, 36, 100620. [Google Scholar] [CrossRef]
  11. Harakava, R. Genes encoding enzymes of the lignin in biosynthesis pathway in Eucalyptus. Genet. Mol. Biol. 2005, 28, 601–607. [Google Scholar] [CrossRef]
  12. Zou, H. Progress of studies on anti-inflammation, immunodulatory and anti-senility effects of total flavones. J. Anhui Health Vocat. Tech. Coll. 2003, 2, 48–50. [Google Scholar]
  13. Zhu, Y.; Xue, H.; Zhou, Q.; Zong, J.; Gao, Y. Cloning and Function Study of LaDFR1 Gene and Promoter from Lycoris albiflora. J. Agric. Biotechnol. 2003, 31, 1396–1404. [Google Scholar]
  14. Qin, S.; Liu, Y.; Cui, B.; Cheng, J.; Liu, S.; Liu, H. Isolation and functional diversification of dihydroflavonol 4-Reductase gene HvDFR from Hosta ventricosa indicate its role in driving anthocyanin accumulation. Plant Signal Behav. 2022, 17, 2010389. [Google Scholar] [CrossRef]
  15. Jiao, S.; Liu, Y.; Lou, Q. Cloning and Expression Analysis of Dihydroflavonol 4-reductase Gene (DFR) from Grape Hyacinth (Muscari armeniacum). J. Agric. Biotechnol. 2014, 22, 529–540. [Google Scholar]
  16. Xu, L.; Feng, Q.; Yang, L.; Xu, Q. Cloning and expression of dfr in Ribes L. during fruit maturation. Chin. J. Biotechnol. 2020, 36, 620–1628. [Google Scholar]
  17. Duan, W.; Sun, P.; Li, J. Expression of genes involved in the anthocyanin biosynthesis pathway in white and red fruits of Fragaria pentaphylla and genetic variation in the dihydroflavonol-4-reductase gene. Biochem. Syst. Ecol. 2017, 72, 40–46. [Google Scholar] [CrossRef]
  18. Zhang, B.; Zhao, Z.; Gao, A. Cloning and Expression Analysis of DFR Gene from Mango (Mangiferaindica). Mol. Plant Breed. 2015, 13, 816–821. [Google Scholar]
  19. Ahmed, N.U.; Park, J.I.; Jung, H.J.; Yang, T.J.; Hur, Y.; Nou, I.S. Characterization of dihydroflavonol 4-reductase (DFR) genes and their association with cold and freezing stress in Brassica rapa. Gene 2014, 550, 46–55. [Google Scholar] [CrossRef]
  20. Wang, L.; Chen, M.; Lam, P.Y.; Dini-Andreote, F.; Dai, L.; Wei, Z. Multifaceted roles of flavonoids mediating plant-microbe interactions. Microbiome 2022, 10, 233. [Google Scholar] [CrossRef]
  21. Liu, H.; Lou, Q.; Ma, J.; Su, B.; Gao, Z.; Liu, Y. Cloning and Functional Characterization of Dihydroflavonol 4-Reductase Gene Involved in Anthocyanidin Biosynthesis of Grape Hyacinth. Int. J. Mol. Sci. 2019, 20, 4743. [Google Scholar] [CrossRef] [PubMed]
  22. Xu, Z.; Ma, J.; Cui, G.; Li, Y. Cloning and Functional Analysis of the Key Enzyme DFR Promoters in Turnip Anthocyanin Biosynthesis. Acta Hortic. Sin. 2014, 41, 1631–1641. [Google Scholar]
  23. Sun, Y.; Wang, J.; Qiu, Y.; Liu, T.; Song, J.; Li, X. Identification of ‘Xinlimei’ radish candidate genes associated with anthocyanin biosynthesis based on a transcriptome analysis. Gene 2018, 657, 81–91. [Google Scholar] [CrossRef] [PubMed]
  24. Qian, X.; Zheng, W.; Hu, J.; Ma, J.; Sun, M.; Li, Y.; Liu, N.; Chen, T.; Wang, M.; Wang, L.; et al. Identification and Expression Analysis of DFR Gene Family in Brassica napus L. Plants 2023, 12, 2583. [Google Scholar] [CrossRef] [PubMed]
  25. Li, W.; Gao, J.; Ma, Z.; Hou, Y.; Li, X.; Mao, J.; Chen, B. Molecular evolution and expression assessment of DFRs in apple. Chem. Biol. Technol. Agric. 2023, 10, 98. [Google Scholar] [CrossRef]
  26. Hu, Y. Bioinformatics analysis of the DFR gene of a garden ornamental pomegranate plant. South China Fruits 2016, 45, 95–100. [Google Scholar]
  27. Shi, Z.; Li, H.; Gao, M.; Guo, C.; Guo, D.; Bi, Y. Cloning of GmDFR gene from Soybean (Glycine max) and Identification of Its Function on Resistance to Iron Deficiency. J. Agric. Biotechnol. 2023, 30, 259–272. [Google Scholar]
  28. Ping, H.; Wang, J.; Zhang, H.; Zhang, P.; Wang, W.; Guo, X.; Du, C. Cloning and Bioinformatics Characteristics Analysis of DFR Gene in Paeonia delavay. Mol. Plant Breed. 2023, 21, 5620–5630. [Google Scholar]
  29. Feng, C.; Zhou, N.; Sun, S.; Zhou, J.; Sun, W. Cloning and Analysis of DFR3 Gene from Ophiorrhiza japonicus (OjDFR3) and Isolation and Purification of Its Coding Protein. Acta Bot. Boreali-Occident. Sin. 2021, 41, 926–932. [Google Scholar]
  30. Li, Y.; Li, W.; Wang, K.; Liu, Q.; Jiang, X.; Liu, Q. Cloning and expression analysis of DFR gene in Aconitum carmichaeli. Plant Physiol. J. 2017, 53, 2222–2228. [Google Scholar]
  31. Wang, H.; Qu, H.; Zhou, T.; Xu, Q. Cloning and Expression Analysis of Anthocyanin Biosynthesis-Associated DFR and MYB Genes in Calyx of Eggplant. Sci. Agric. Sin. 2017, 50, 2781–2792. [Google Scholar]
  32. Lei, T.; Huang, J.; Ruan, H.; Qian, W.; Fang, Z.; Gu, C.; Zhang, N.; Liang, Y.; Wang, Z.; Gao, L.; et al. Competition between FLS and DFR regulates the distribution of flavonols and proanthocyanidins in Rubus chingii Hu. Front. Plant Sci. 2023, 14, 1134993. [Google Scholar] [CrossRef] [PubMed]
  33. Zheng, J.; Wang, L.; Li, D.; Chai, Z.; Zhang, X.; Huang, W. Expression and Molecular Evolution of Genes Related to Anthocyanin Biosynthesis in Blueberries. J. Food Sci. 2022, 43, 184–191. [Google Scholar]
  34. Tan, F.; Xiao, K.; Liu, X.; Huang, Q.; Zhang, A.; Wu, X. Formation and Gene Expression of Pigments in Eggplant Pericarp. Fujian J. Agric. Sci. 2023, 38, 158–165. [Google Scholar]
  35. Holton, T.A.; Cornish, E.C. Genetics and biochemistry of anthocyanin biosynthesis. Plant Cell 1995, 7, 1071–1083. [Google Scholar] [CrossRef]
  36. Goodstein, D.M.; Shu, S.; Howson, R.; Neupane, R.; Hayes, R.D.; Fazo, J.; Mitros, T.; Dirks, W.; Hellsten, U.; Putnam, N.; et al. Phytozome: A comparative platform for green plant genomics. Nucleic Acids Res. 2012, 40, D1178–D1186. [Google Scholar] [CrossRef]
  37. Jalal, A.; Ali, Q.; Manghwar, H.; Zhu, D. Identification, Phylogeny, Divergence, Structure, and Expression Analysis of A20/AN1 Zinc Finger Domain Containing Stress-Associated Proteins (SAPs) Genes in Jatropha curcas L. Genes 2022, 13, 1766. [Google Scholar] [CrossRef]
  38. Xiong, E.; Zheng, C.Y.; Wu, X.L.; Wang, W. Protein subcellular location: The gap between prediction and experimentation. Plant Mol. Biol. Rep. 2015, 34, 52–61. [Google Scholar] [CrossRef]
  39. Li, B.; Zhao, Y.; Wang, S.; Zhang, X.; Wang, Y.; Shen, Y.; Yuan, Z. Genome-wide identification, gene cloning, subcellular location and expression analysis of SPL gene family in P. granatum L. BMC Plant Biol. 2021, 21, 400. [Google Scholar] [CrossRef]
  40. Wang, Y.; Tang, H.; Debarry, J.D.; Tan, X.; Li, J.; Wang, X.; Lee, T.H.; Jin, H.; Marler, B.; Guo, H.; et al. MCScanX: A toolkit for detection and evolutionary analysis of gene synteny and collinearity. Nucleic Acids Res. 2012, 40, e49. [Google Scholar] [CrossRef]
  41. Jalal, A.; Sun, J.; Chen, Y.; Fan, C.; Liu, J.; Wang, C. Evolutionary Analysis and Functional Identification of Clock-Associated PSEUDO-RESPONSE REGULATOR (PRRs) Genes in the Flowering Regulation of Roses. Int. J. Mol. Sci. 2022, 23, 7335. [Google Scholar] [CrossRef] [PubMed]
  42. Livak, K.J.; Schmittgen, T.D. Analysis of relative gene expression data using real-time quantitative PCR and the 2(-Delta Delta C(T)) Method. Methods 2001, 25, 402–408. [Google Scholar] [CrossRef] [PubMed]
  43. Dong, Y.; Lu, J.; Liu, J.; Jalal, A.; Wang, C. Genome-wide identification and functional analysis of JmjC domain-containing genes in flower development of Rosa chinensis. Plant Mol Biol. 2020, 102, 417–430. [Google Scholar] [CrossRef] [PubMed]
Figure 1. Chromosome distribution of the DFR genes in strawberry. The left scale indicates the chromosome length (Mb), with DFR gene markers on the right side of each chromosome. Different chromosomal colors indicate different gene densities, with red indicating the highest density and blue the lowest density.
Ijms 25 09911 g001
Figure 2. Analysis of the gene structure, motif, and cis-acting elements of the strawberry DFR gene family. (A,B) Analysis of the conserved motif of the DFR gene family in strawberry. (C) The cis-acting element analysis was performed for the first 2000 bp of the promoters of strawberry DFR gene family members. (D) The exon–intron structure of the FvDFR genes.
Ijms 25 09911 g002
Figure 3. The evolutionary analysis of the DFR gene families. The phylogenetic tree was constructed using the DFR protein sequence and using the NJ method. A white triangle represents strawberry, a yellow-green rectangle represents Nicotiana gossei 1, a red rectangle represents Nicotiana gossei 2, a yellow rectangle represents Arabidopsis thaliana, an Indian red rectangle represents tomato, a medium purple rectangle represents potato, a blue rectangle represents grape, a light sky blue rectangle represents wild tomato, a sandy brown rectangle represents walnut, a Navajo white rectangle represents wheat 1, a tomato red rectangle represent wheat 2, and a Peru brown rectangle represents wheat 3. The phylogenetic tree is named using A, B, C, D, E, and F, and these different names represent different subfamilies.
Ijms 25 09911 g003
Figure 4. Collinearity analysis of the DFR gene family in Arabidopsis, apple, grape, and rice. The gray lines in the background represent the collinearity of the Arabidopsis, apple, grape, and rice genomes, while the red lines represent the gene pairs of the strawberry DFR genes.
Ijms 25 09911 g004
Figure 5. Collinearity analysis of the strawberry DFR gene family. Red lines represent the duplicated FvDFR gene pairs.
Ijms 25 09911 g005
Figure 6. RSCU heat map analysis of the protein coding sequence of the strawberry DFR genes. The deep purple indicates a codon preference.
Ijms 25 09911 g006
Figure 7. RSCU analysis of the protein-encoding sequence of the strawberry DFR gene.
Ijms 25 09911 g007
Figure 8. Expression of strawberry DFR in different tissues. Shades of red and blue represent up-regulated or down-regulated expression levels, respectively. Metrics represent relative expression levels.
Ijms 25 09911 g008
Figure 9. The strawberry fruit used in this study is fresh fruit, calculated by fresh weight. The anthocyanin content in the four periods. S1 is the green fruit stage, S2 is the 20% colored period, S3 is the 50% colored period, and S4 is the completely colored period. These data are original to this manuscript. Different letters denote significant differences (p < 0.05).
Ijms 25 09911 g009
Figure 10. Quantitative expression analysis of the DFR gene family in strawberry. Strawberry fruits at the green fruit stage (S1), 20% coloring stage (S2), 50% coloring stage (S3), and completely colored stage (S4) were selected, and S1 was used as the control. There were 3 replicates per treatment, and the reference gene was GAPDH. Different lowercase letters indicate a significant difference at the 0.05 level, and the same lowercase letters indicate no statistical difference. According to the six subgroups of the strawberry DFR gene family and their evolutionary relationship, there are similarities in the same class during classification, so different genes were selected from the different subgroups when conducting research, so some genes were excluded. These data are original data from this paper.
Ijms 25 09911 g010
Figure 11. Protein interaction analysis of the strawberry DFR gene family. Nodes represent proteins, and lines between nodes represent interactions between proteins, with different colors corresponding to different types of interactions.
Ijms 25 09911 g011
Table 1. Physicochemical properties of the strawberry DFR gene family, including number of amino acids, molecular weight/Da, pI, instability index, aliphatic index, and grand average of hydropathicity.
Gene NameGenBank No.Number of Amino AcidsMolecular Weight/DapIInstability IndexAliphatic IndexGrand Average of Hydropathicity
FvDFR1FvH4_2g17230.t1.v4.0.a232936,554.026.2739.7797.48−0.145
FvDFR2FvH4_2g34590.t1.v4.0.a233637,093.617.7431.3595.42−0.026
FvDFR3FvH4_2g39520.t1.v4.0.a234938,956.76.0336.6582.64−0.223
FvDFR4FvH4_2g39520.t2.v4.0.a228131,308.216.7535.390.57−0.067
FvDFR5FvH4_2g39520.t5.v4.0.a233137,150.876.2838.3486.31−0.162
FvDFR6FvH4_2g39520.t3.v4.0.a233337,202.996.4337.2187.57−0.126
FvDFR7FvH4_3g02980.t2.v4.0.a227529,731.375.4323.0799.960.194
FvDFR8FvH4_3g02980.t1.v4.0.a234136,861.426.2528.0993.49−0.012
FvDFR9FvH4_3g21610.t1.v4.0.a235437,780.975.144.7597.230.063
FvDFR10FvH4_3g28560.t2.v4.0.a228531,371.087.6228.0192.67−0.081
FvDFR11FvH4_3g28560.t1.v4.0.a228931,962.828.3927.191.38−0.076
FvDFR12FvH4_3g28560.t3.v4.0.a232135,294.566.1925.3292.27−0.062
FvDFR13FvH4_3g39460.t1.v4.0.a232435,438.785.6828.1596.85−0.01
FvDFR14FvH4_4g27430.t1.v4.0.a231935,199.25.4137.9688.65−0.087
FvDFR15FvH4_4g27430.t2.v4.0.a222925,523.155.8744.2483.93−0.141
FvDFR16FvH4_4g27470.t1.v4.0.a2697686.989.4324.0993.33−0.013
FvDFR17FvH4_5g01060.t1.v4.0.a234036,937.438.638.5989.15−0.207
FvDFR18FvH4_5g04220.t2.v4.0.a229632,710.55.6342.3787.94−0.033
FvDFR19FvH4_5g04220.t1.v4.0.a234538,216.825.6842.7286.17−0.105
FvDFR20FvH4_5g04260.t1.v4.0.a229532,503.365.4941.2190.880.003
FvDFR21FvH4_5g22420.t2.v4.0.a227630,947.395.233.7187.93−0.113
FvDFR22FvH4_5g22420.t3.v4.0.a220823,072.496.4226.9491.39−0.075
FvDFR23FvH4_5g22420.t1.v4.0.a231534,963.735.837.0383.87−0.182
FvDFR24FvH4_5g26020.t1.v4.0.a231935,559.96.928.4795.61−0.213
FvDFR25FvH4_5g26030.t2.v4.0.a229833,155.865.2634.0789.9−0.208
FvDFR26FvH4_5g26030.t1.v4.0.a232636,038.115.4731.6987.85−0.206
FvDFR27FvH4_5g26090.t1.v4.0.a232536,066.57.4735.8787.51−0.231
FvDFR28FvH4_5g27181.t1.v4.0.a233135,783.645.7638.8487.79−0.063
FvDFR29FvH4_5g33950.t1.v4.0.a230033,330.226.2641.3984.2−0.172
FvDFR30FvH4_6g28680.t1.v4.0.a233937,193.486.1734.2392.57−0.206
FvDFR31FvH4_6g28680.t2.v4.0.a227930,321.635.7832.0795.02−0.045
FvDFR32FvH4_6g45521.t1.v4.0.a234738,638.315.9235.1486.83−0.178
FvDFR33FvH4_6g50850.t1.v4.0.a235639,502.167.5338.390.08−0.196
FvDFR34FvH4_7g01511.t3.v4.0.a231534,545.755.122.8498.70.003
FvDFR35FvH4_7g01511.t2.v4.0.a223325,752.745.2429.2496.610.083
FvDFR36FvH4_7g01511.t4.v4.0.a210911,760.525.6314.46100.090.117
FvDFR37FvH4_7g01511.t1.v4.0.a232535,637.985.0323.6397.750.01
FvDFR38FvH4_7g01520.t3.v4.0.a229232,2175.336.75100.17−0.047
FvDFR39FvH4_7g01520.t2.v4.0.a222924,937.866.923.09105.940.128
FvDFR40FvH4_7g01520.t4.v4.0.a233437,337.498.7529.31108.860.095
FvDFR41FvH4_7g01520.t1.v4.0.a232835,944.435.9330.99102.530.013
FvDFR42FvH4_7g01560.t2.v4.0.a229732,874.995.8733.8298.110.01
FvDFR43FvH4_7g01560.t1.v4.0.a232835,963.576.5130.5399.240.03
FvDFR44FvH4_7g01561.t1.v4.0.a220022,086.525.1327.98102.40.049
FvDFR45FvH4_7g01562.t1.v4.0.a211312,170.158.430.5103.450.249
FvDFR46FvH4_7g01563.t1.v4.0.a222324,257.096.4327.8998.740.07
FvDFR47FvH4_7g01564.t1.v4.0.a232335,549.885.2825.6596.220.021
FvDFR48FvH4_7g01580.t3.v4.0.a232235,390.696.1429.1295.68−0.039
FvDFR49FvH4_7g01580.t2.v4.0.a21253136,295.175.8532.8101.350.056
FvDFR50FvH4_7g01580.t1.v4.0.a234437,808.728.6127.7396.34−0.071
FvDFR51FvH4_7g11750.t1.v4.0.a212614,089.264.6933.68104.370.185
FvDFR52FvH4_7g11760.t1.v4.0.a229632,516.226.3235.3985.61−0.176
FvDFR53FvH4_7g11780.t1.v4.0.a233436,985.416.0839.1885.81−0.126
FvDFR54FvH4_7g11781.t1.v4.0.a232836,100.345.6439.5592.1−0.018
FvDFR55FvH4_7g11790.t1.v4.0.a233136,612.025.2532.1887.13−0.05
FvDFR56FvH4_7g16111.t2.v4.0.a231334,918.036.5146.1388.43−0.105
FvDFR57FvH4_7g16111.t1.v4.0.a235739,939.816.3245.5387.37−0.128
Table 2. Subcellular localization prediction of the strawberry DFR gene family.
ProteinCytoplasmChloroplastNucleusPlasma MembraneMitochondriaPeroxisome
FvDFR1343-1-
FvDFR2-11.5--2.5-
FvDFR34412--
FvDFR419-2--
FvDFR54422--
FvDFR61812--
FvDFR74.511.5-1-
FvDFR8271-1-
FvDFR910-2-1-
FvDFR1028-11-
FvDFR11110-11-
FvDFR1219-11-
FvDFR13391---
FvDFR14821---
FvDFR15-101-3-
FvDFR1611.5-1---
FvDFR1781--1-
FvDFR182102---
FvDFR191112---
FvDFR20-121-1-
FvDFR21102-1--
FvDFR2249---1
FvDFR239221--
FvDFR24271---
FvDFR2583--12
FvDFR2693---2
FvDFR271111--1
FvDFR2848----
FvDFR29327-1-
FvDFR30211----
FvDFR31110-11-
FvDFR3211111--
FvDFR331422--
FvDFR3411----2
FvDFR359.531---
FvDFR361211---
FvDFR37911--2
FvDFR3842----
FvDFR39191---
FvDFR403101---
FvDFR41281---
FvDFR426.511.5-2-
FvDFR4367-1--
FvDFR44102----
FvDFR45210--1-
FvDFR46-14----
FvDFR47391---
FvDFR48-9-2--
FvDFR491219--
FvDFR501.543.5-31
FvDFR517-11.5-1
FvDFR525512--
FvDFR5334212-
FvDFR5471--1-
FvDFR552412--
FvDFR5615.53-4-
FvDFR5713.5315-
Table 3. Secondary structure analysis of the DFR gene family proteins in strawberry, including alpha helices, extended strands, beta turns, and random coils.
ProteinAlpha Helix/%Extended Strand/%Beta Turn/%Random Coil/%
FvDFR142.8613.077.2936.78
FvDFR245.2413.697.1433.93
FvDFR338.9714.337.1639.54
FvDFR442.3516.376.7634.52
FvDFR538.9713.908.1638.97
FvDFR641.4414.117.8136.64
FvDFR746.1814.555.0934.18
FvDFR841.6414.966.7436.66
FvDFR940.6813.565.9339.83
FvDFR1039.6516.498.0735.79
FvDFR1139.7916.968.3034.95
FvDFR1242.0616.827.1733.96
FvDFR1345.6814.817.1032.41
FvDFR1441.6914.427.5236.36
FvDFR1541.4813.544.8040.17
FvDFR1623.1931.887.2537.68
FvDFR1742.9417.355.0034.71
FvDFR1840.2014.537.7737.50
FvDFR1940.8713.917.2537.97
FvDFR2038.9816.617.1237.29
FvDFR2144.9316.675.4332.97
FvDFR2246.6317.316.7329.33
FvDFR2344.4417.144.1334.29
FvDFR2446.7112.547.2133.54
FvDFR2548.9912.084.3634.56
FvDFR2644.7913.806.1335.28
FvDFR2746.7714.155.5433.54
FvDFR2843.8112.396.9536.86
FvDFR2938.0015.008.3338.67
FvDFR3041.8914.756.7836.58
FvDFR3143.3716.496.4533.69
FvDFR3251.5913.266.0529.11
FvDFR3349.1611.804.4934.55
FvDFR3442.8616.836.0334.29
FvDFR3541.6317.176.4434.76
FvDFR3641.2817.4311.0130.28
FvDFR3742.1515.385.8536.62
FvDFR3841.1014.386.1638.36
FvDFR3942.7917.036.9933.19
FvDFR4041.0218.866.8933.23
FvDFR4141.1614.636.1038.11
FvDFR4241.7516.846.7334.68
FvDFR4342.0716.777.0134.15
FvDFR4445.0014.505.5035.00
FvDFR4546.9018.5810.6223.89
FvDFR4642.6017.947.1732.29
FvDFR4743.9616.107.7432.20
FvDFR4843.1717.396.8332.61
FvDFR4934.8017.643.2744.29
FvDFR5043.0215.415.5236.05
FvDFR5136.5129.378.7325.40
FvDFR5242.9115.887.7733.45
FvDFR5341.6214.978.9834.43
FvDFR5442.9915.557.3234.15
FvDFR5537.7614.507.5540.18
FvDFR5640.2615.657.6736.42
FvDFR5740.6214.577.2837.54
Table 4. Amino acid-conserved sequences of the strawberry DFR gene family.
Conserved MotifLength/bpAmino Acid-Conserved Sequence
Motif131RLHLFKADLLDEGSFDSAIDGCEGVFHTASP
Motif238SKTLAEQAAWKFAKENGJDLVTINPGLVIGPLLQPTLN
Motif332VVCVTGASGFIASWLVKLLLZRGYTVKATVRB
Motif426YRFVHVDDVASAHIFAFENPSASGRY
Motif521DPZAELIDPAVKGTLNVLKSC
Motif621KSPTVKRVVLTSSIAAVAYNG
Motif715WWSDPEFCEKLKLWY
Motif821HISEIVKILRELYPEYNIPEK
Motif915NDLKKTEHLLSLDGA
Motif1029QVSKEKAQSLGVKFTPLEVTLKDTVESLK
Table 5. Primers for real-time quantification of the strawberry DFR gene family.
GeneForward PrimerReverse Primer
GAPDHCATTCATCACCACCGACTACAGAAGGGTCTTCTCATCCTTGAC
FvDFR1CATGTCACTGGAACTGTCAGAGATCTCAACTAAGTCAGCCTTCACCAATC
FvDFR2CACGCCGCCGCCTTAGTCCTTGGTCTCCCTGATCGCTCTC
FvDFR3GCTGAGCAAGAGGCATGGAAGTGAGACTCGGCGGCATAGC
FvDFR5GGACCCTGAGAACGAAGTGATAAAGCGATGCTCTTCAATGGCGACAG
FvDFR7ACCACTGCCAAGCCACCTACAGAGAAGCACCAGCCATGAGAG
FvDFR9CCACACGGTTCATGCCACAGAAACGCCATCACAGCCCTTAAC
FvDFR10CGCAACCCAAATGATCCAACAAAGAACACATTCACAGCCCTCAACAC
FvDFR13CGTCTTCCACCTCGCCTCTCGCCGCCGTCAGAACATTCAG
FvDFR14CGGAGAAAGATGCGTGGAGAATCGTGCTTGTAGGTTGTGGTGCTAG
FvDFR16CGAGACCCAGCCATAGCCTTCCCTTGGTGTGCATGAAACTTCCC
FvDFR17ATATTTGTGGTGGTAGGAGGAGGAGTCGTCGGTGGCTATGTCTGTG
FvDFR18ACACAGTCCATGCCACTCTCAGAGCAGGCTTGAAGTCATTAGGATTG
FvDFR21GCGTGGGCAATGGCAATGGGATGGACAAGTCGGCGTTCAAC
FvDFR24AGGTGCTGGAGGCTTCGTTGTCTCTGATGGTTCCGTGGACTATG
FvDFR25GCAATCCACCCTAATTTCCAGTAGCTCACGAACATCCACCACAGTCC
FvDFR27AACTTGGTGCTGATGTCTCTTCTGTGTATCTGCCTCCTGCTTCTGG
FvDFR29GTTGGACACCGCTTGATGCCCCCAGTAAGTTGTGCCAGAATCC
FvDFR30GAGAGGAGTGGACTTGGTGGTGGGATGATGCTGGCGTTGATGG
FvDFR32GGAAGACCACTGCGGAGATAGCCATGTCCTTGCCACCTTTGAGATAG
FvDFR35ACAGAACACTTGCTCGCACTTGCACCTTCACATCCATCAACAACAAG
FvDFR39AAACAGAACACTTGCTTTCGCTTGAACACCATCACATCCATCAACCG
FvDFR42CGCACATCTCCGAGGCTCTGGGTCAGAAGGAAGAATACGAACAGG
FvDFR44TCTTACAGCCAACTCTGAACACAAGCGCAATCGCAACATCTCTAACATC
FvDFR45TGTGACAGGAGCATCTGGGTTCCGGACAGTGGCTTTGACAGTATAAC
FvDFR46CACCTGAGACACCTGTAATAGTTCCGCTGCCATAGAGGATGTGATAACC
FvDFR47CAGAACACCTGCTCTCACTTGAAGAGAAGTACAGAGGATGCCGTATGG
FvDFR48TGAACTAATTGACCCTGCCTTGAAGACCACCCTCTTAATAGACGGAACC
FvDFR49GTTCAATCGGGTCTCCTTTGGTTCTGGCAGCAGTCACTTCCTTCC
FvDFR51GCAAGTCAAAGCGGAATTTCAGATGATCGTCGCCACCACCAAGG
FvDFR52CTGAGAGCCTGCCTGAAGTCCATGTCTTTGTTGGTTCCGCTATGAG
FvDFR54TGCGAGCCACCGTTAGATCCTCATTGAAGGTCTCAGGGTTGTTG
FvDFR55GAGGTTCTGGGTTCATTGGTTCCCTTTCTTGTCTTCTGCTGGGTCTG
FvDFR56TTCAAAGACACTGGCAGAGAAAGAGATTCCCTCCCACAAGACCACAG
Disclaimer/Publisher’s Note: The statements, opinions and data contained in all publications are solely those of the individual author(s) and contributor(s) and not of MDPI and/or the editor(s). MDPI and/or the editor(s) disclaim responsibility for any injury to people or property resulting from any ideas, methods, instructions or products referred to in the content.

