Article

Genetic Mapping and Characterization of the Clubroot Resistance Gene BraPb8.3 in Brassica rapa

by
Liyan Kong
1,†,
Yi Yang
2,†,
Yufei Zhang
1,
Zongxiang Zhan
1,* and
Zhongyun Piao
1,*
1
Molecular Biology of Vegetable Laboratory, College of Horticulture, Shenyang Agricultural University, Shenyang 110866, China
2
Guangdong Key Laboratory for New Technology Research of Vegetables, Vegetable Research Institute, Guangdong Academy of Agricultural Sciences, Guangzhou 510640, China
*
Authors to whom correspondence should be addressed.
These authors contributed equally to this work.
Int. J. Mol. Sci. 2024, 25(19), 10462; https://doi.org/10.3390/ijms251910462 (registering DOI)
Submission received: 7 August 2024 / Revised: 24 September 2024 / Accepted: 25 September 2024 / Published: 28 September 2024
(This article belongs to the Special Issue Advances in Brassica Crop Metabolism and Genetics)

Abstract

:
Clubroot, a significant soil-borne disease, severely impacts the productivity of cruciferous crops. The identification and development of clubroot resistance (CR) genes are crucial for mitigating this disease. This study investigated the genetic inheritance of clubroot resistance within an F2 progeny derived from the cross of a resistant parent, designated “377”, and a susceptible parent, designated “12A”. Notably, “377” exhibited robust resistance to the “KEL-23” strain of Plasmodiophora brassicae, the causative agent of clubroot. Genetic analyses suggested that the observed resistance is controlled by a single dominant gene. Through Bulked Segregant Analysis sequencing (BSA-seq) and preliminary gene mapping, we localized the CR gene locus, designated as BraPb8.3, to a 1.30 Mb genomic segment on chromosome A08, flanked by the markers “333” and “sau332-1”. Further fine mapping precisely narrowed down the position of BraPb8.3 to a 173.8 kb region between the markers “srt8-65” and “srt8-25”, where we identified 22 genes, including Bra020861 with a TIR-NBS-LRR domain and Bra020876 with an LRR domain. Quantitative reverse transcription polymerase chain reaction (qRT-PCR) analyses confirmed that both Bra020861 and Bra020876 exhibit increased expression levels in the resistant parent “377” following inoculation with P. brassicae, thereby underscoring their potential as key genes implicated in BraPb8.3-mediated clubroot resistance. This study not only identifies molecular markers associated with BraPb8.3 but also enriches the genetic resources available for breeding programs aimed at enhancing resistance to clubroot.

1. Introduction

Chinese cabbage (Brassica rapa subsp. pekinensis) is a vital vegetable crop within the Brassicaceae family that holds significant economic and nutritional importance in various regions across the globe [1]. This species is widely cultivated due to its rapid growth cycle and its strong adaptability to various environmental conditions. One of the primary challenges faced during Chinese cabbage cultivation is its susceptibility to various diseases, with clubroot caused by the obligate pathogen Plasmodiophora brassicae being one of the most devastating [2,3]. Clubroot disease is characterized by the enlargement of plant roots, which impedes the absorption of water and nutrients and, in severe cases, can result in plant death [4]. The life cycle of P. brassicae is not well understood due to its obligate intracellular biotrophic nature [5]. Current management strategies for clubroot include field practices, chemical interventions, biological measures, and the development of resistant cultivars [6]. Among these, the identification of resistance genes from naturally immune plant materials and the breeding of clubroot-resistant cultivars are the most efficient and sustainable approaches to prevent the spread of the disease [7]. Traditional breeding methods have been employed to introduce resistance traits, but these can be time-consuming and labor-intensive. The advent of molecular biology and genomics has opened new avenues for the identification of genetic markers associated with disease resistance, facilitating more efficient and targeted breeding strategies [8].
Plants have evolved an immune system to defend against pathogens, comprising two primary branches: pattern-triggered immunity (PTI) and effector-triggered immunity (ETI) [9]. PTI is initiated by cell surface-localized pattern-recognition receptors (PRRs) that detect conserved microbial patterns. In contrast, ETI is activated in response to pathogen-derived effectors. Plants can develop resistance genes that recognize these effectors, triggering a robust immune response [10]. Most resistance genes encode proteins of the TIR-NBS-LRR (Toll-interleukin-1 receptor-like domain-nucleotide binding site-leucine-rich repeat) family [11]. In B. rapa, numerous CR genes have been identified, such as Crr2 [12], PbBa1.1 [13], and QS_B1.1 [14] on chromosome A01; Crc [15] and Rcr8 [16] on chromosome A02; Cra [17], Crb [18], Crd [19], Crk [15], Crr3 [20], PbBa3.1, PbBa3.2, PbBa3.3 [13], Rcr1 [21], Rcr2 [22], Rcr4 [16], Rcr10ECD01 [23], CRA3.7 [7] on chromosome A03; CrrA5 [24] on chromosome A05; Crr4 [25] on chromosome A06; qBrCR38-1 on chromosome A07 [26]; and Crr1a and Crr1b [27], CRs [28], PbBa8.1 [13], qBrCR38-2 [26], Rcr3, and Rcr9wa [29] on chromosome A08. Notably, the majority of CR loci are concentrated on chromosomes A03 and A08, with no identified loci on chromosomes A04, A09, and A10. Among these, only CRa and Crr1a have been isolated and functionally validated. These CR genes confer distinct resistance to various pathotypes of P. brassicae. For example, CRa from “T136-8” is resistant to the M85 isolate (race 2) of P. brassicae [17]; CRb from “CR Shinki” is resistant to races 2, 4, and 8 [18]; CRd from “85-74” is resistant to LAB-19 isolate (race 4) [19]; and Crr1a from “G004” confers resistance to the Ano-01 isolate [27]. Thus, identifying new CR genes or alleles with resistance to different pathotypes of P. brassicae is essential for managing clubroot disease in Chinese cabbage and addressing the pathogen’s rapid mutation, which can lead to resistance breakdown.
Molecular marker selection (MAS) is a powerful tool in plant breeding that uses DNA markers to screen for agriculturally important traits, enhancing the efficiency and effectiveness of trait selection [30]. Common molecular markers include simple sequence repeats (SSRs), inter simple sequence repeats (ISSRs), insertions and deletions (InDels), and single-nucleotide polymorphisms (SNPs) [31,32,33]. MAS has been widely applied in the improvement and breeding of various crops [34,35,36,37]. Identifying molecular markers linked to CR genes or loci can significantly speed up the breeding process of Brassica crops [38]. By combining multiple CR genes within a single cultivar, broad-spectrum resistance to clubroot can be achieved [39]. Currently, MAS is extensively used for transferring CR genes in Brassicaceae crops [38,40,41].
To identify novel clubroot resistance (CR) genes in Chinese cabbage, this study established a new segregating population from the sensitive cultivars “12A” and “377” to elucidate the genetic basis of BraPb8.3 resistance. By employing Bulked Segregant Analysis sequencing (BSA-seq) on two extreme pools, in conjunction with genetic mapping, we identified the BraPb8.3 resistance locus. The outcomes of this research provide a robust tool for the breeding of clubroot-resistant Chinese cabbage varieties.

2. Results

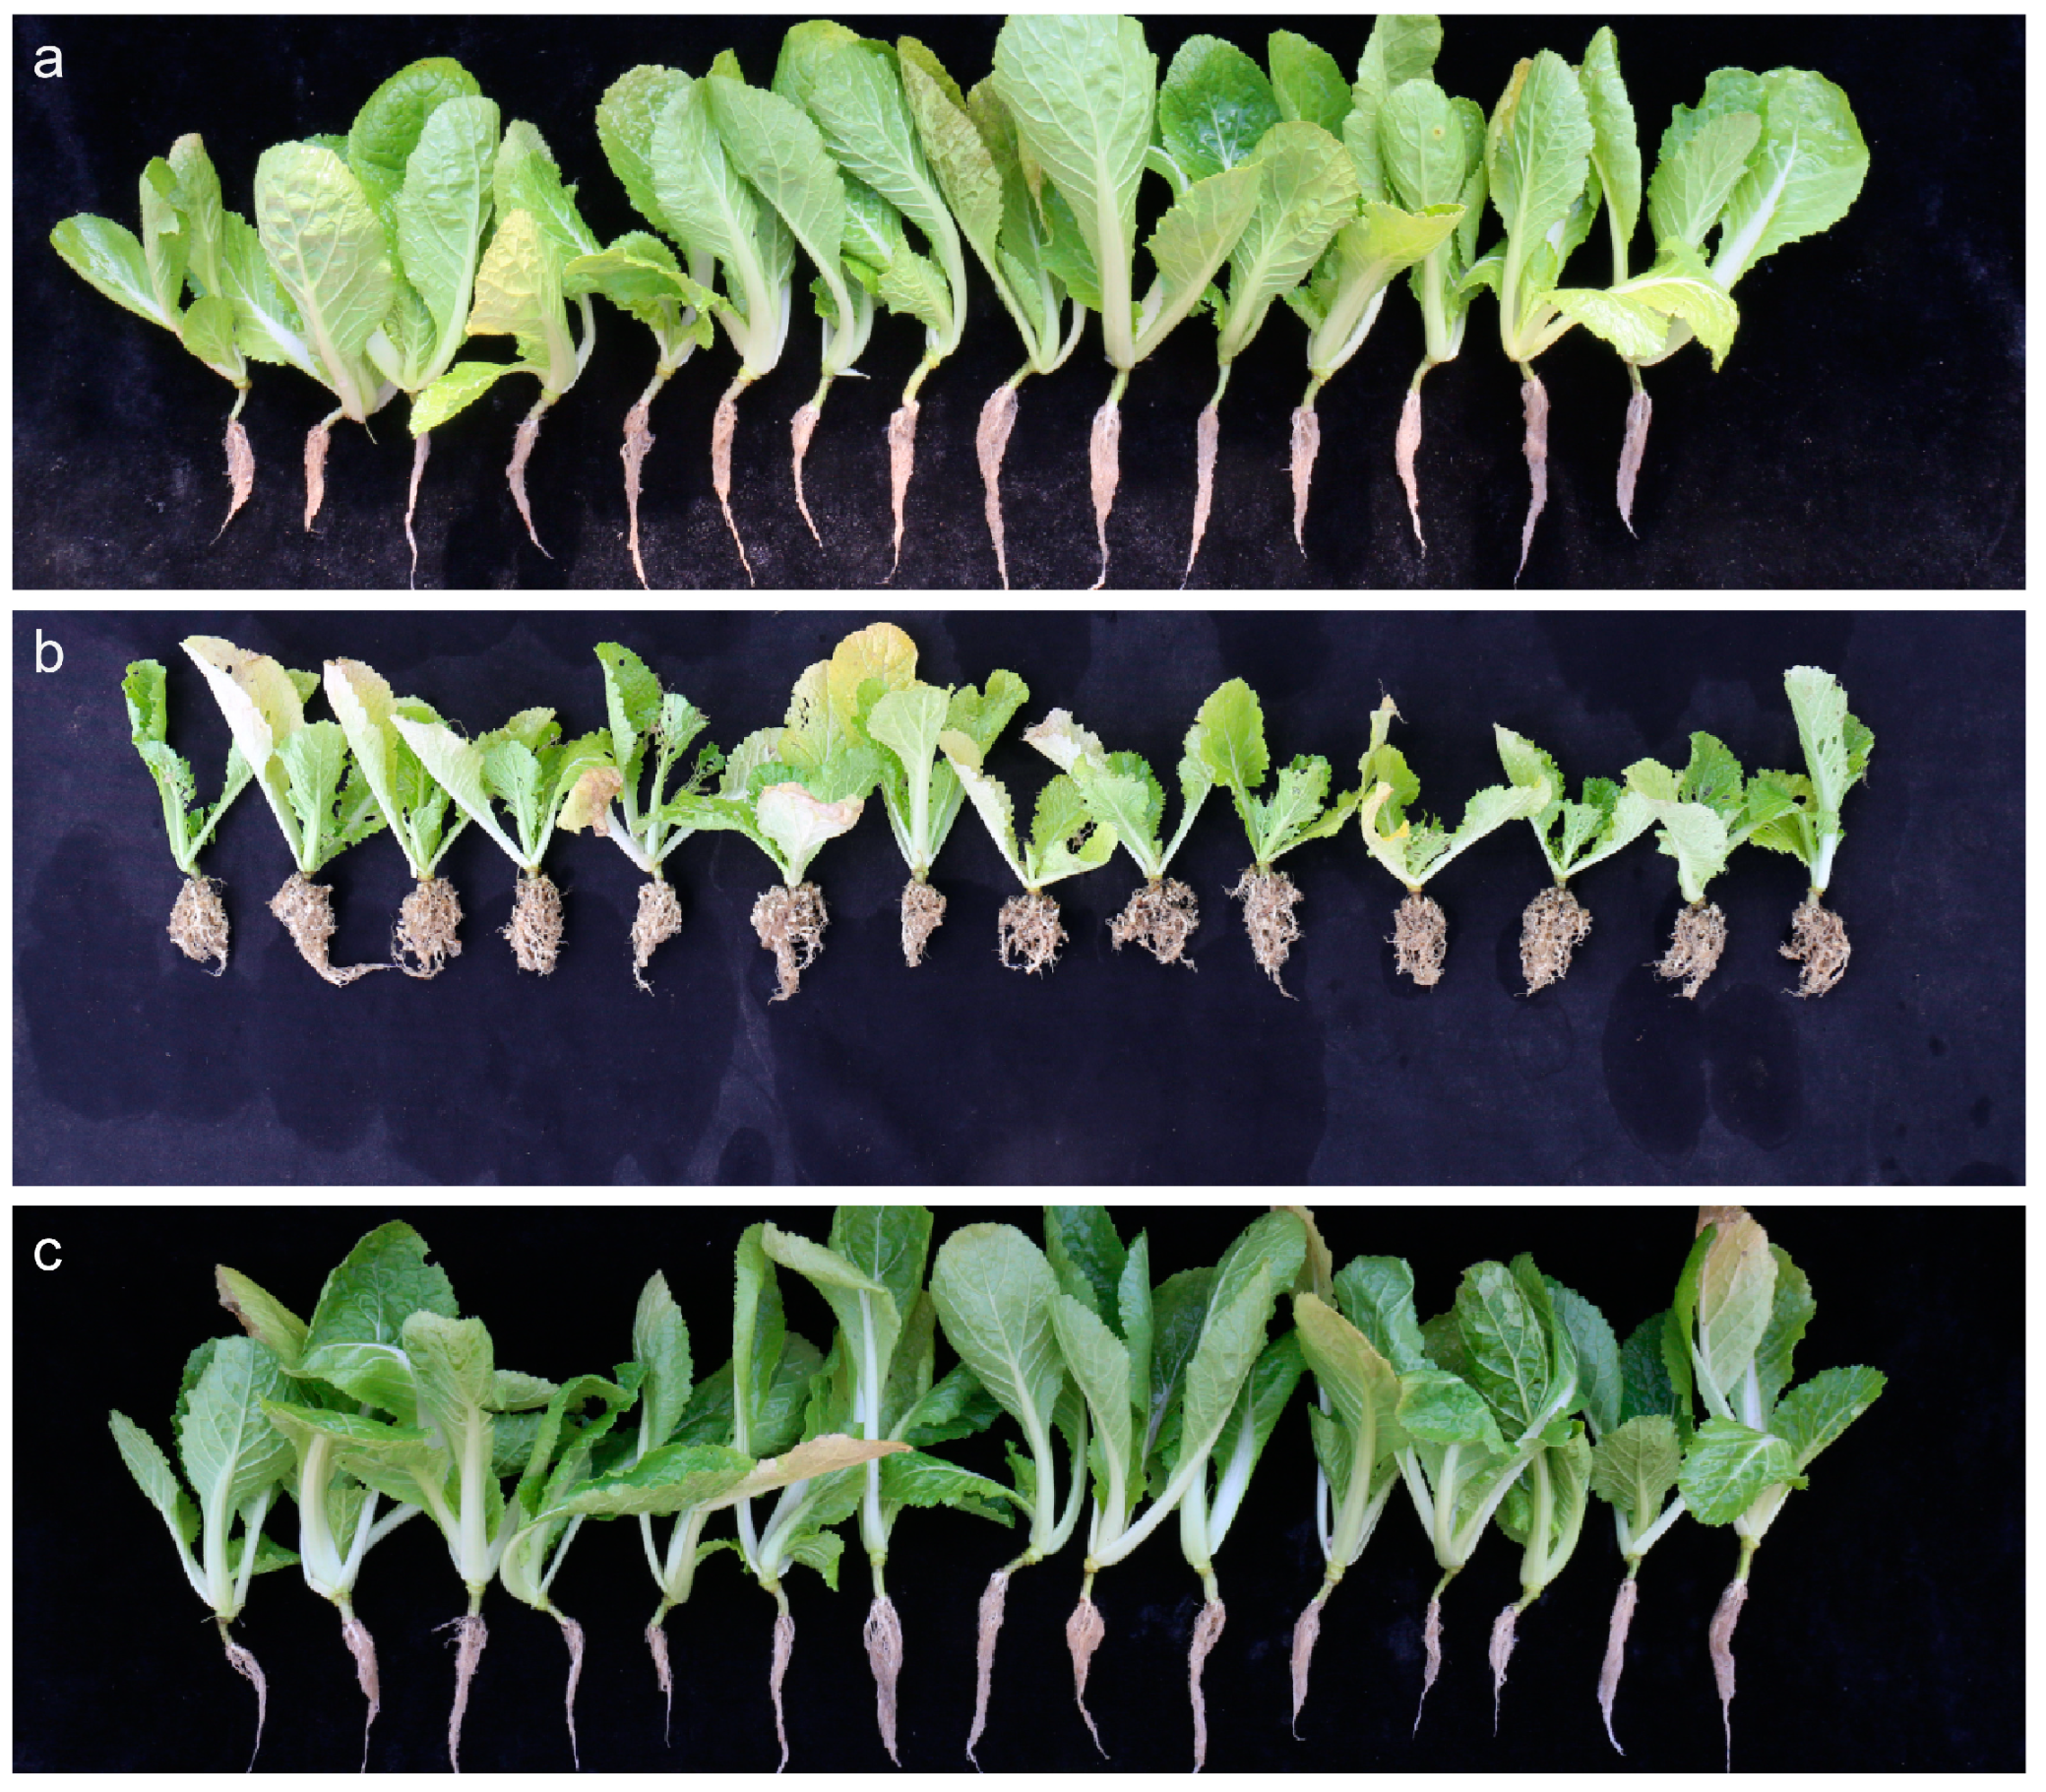
2.1. Phenotype Evaluation and Genetic Analysis

To delineate the genetic inheritance of the clubroot disease-resistance locus BraPb8.3, a cross was performed between the resistant B. rapa cultivar ‘377’ (Figure 1a) and the susceptible cultivar ‘12A’ (Figure 1b), yielding F1 and F2 progenies. Inoculation tests with P. brassicae on 28 F1 plants uniformly demonstrated resistance, with no susceptible individuals observed (Figure 1c). Within the F2 population of 470 plants, 357 showed resistance and 113 showed susceptibility, resulting in a segregation ratio of 3:1, as detailed in Table 1. The chi-square test was applied to assess the fit to Mendelian inheritance patterns, yielding a calculated χ2 value of 0.18, which is substantially lower than the critical value of 3.84 at the p = 0.05 level (χ20.05 = 3.84). These findings strongly suggest that the resistance to clubroot disease in the B. rapa cultivar ‘377’ is governed by a single dominant gene.

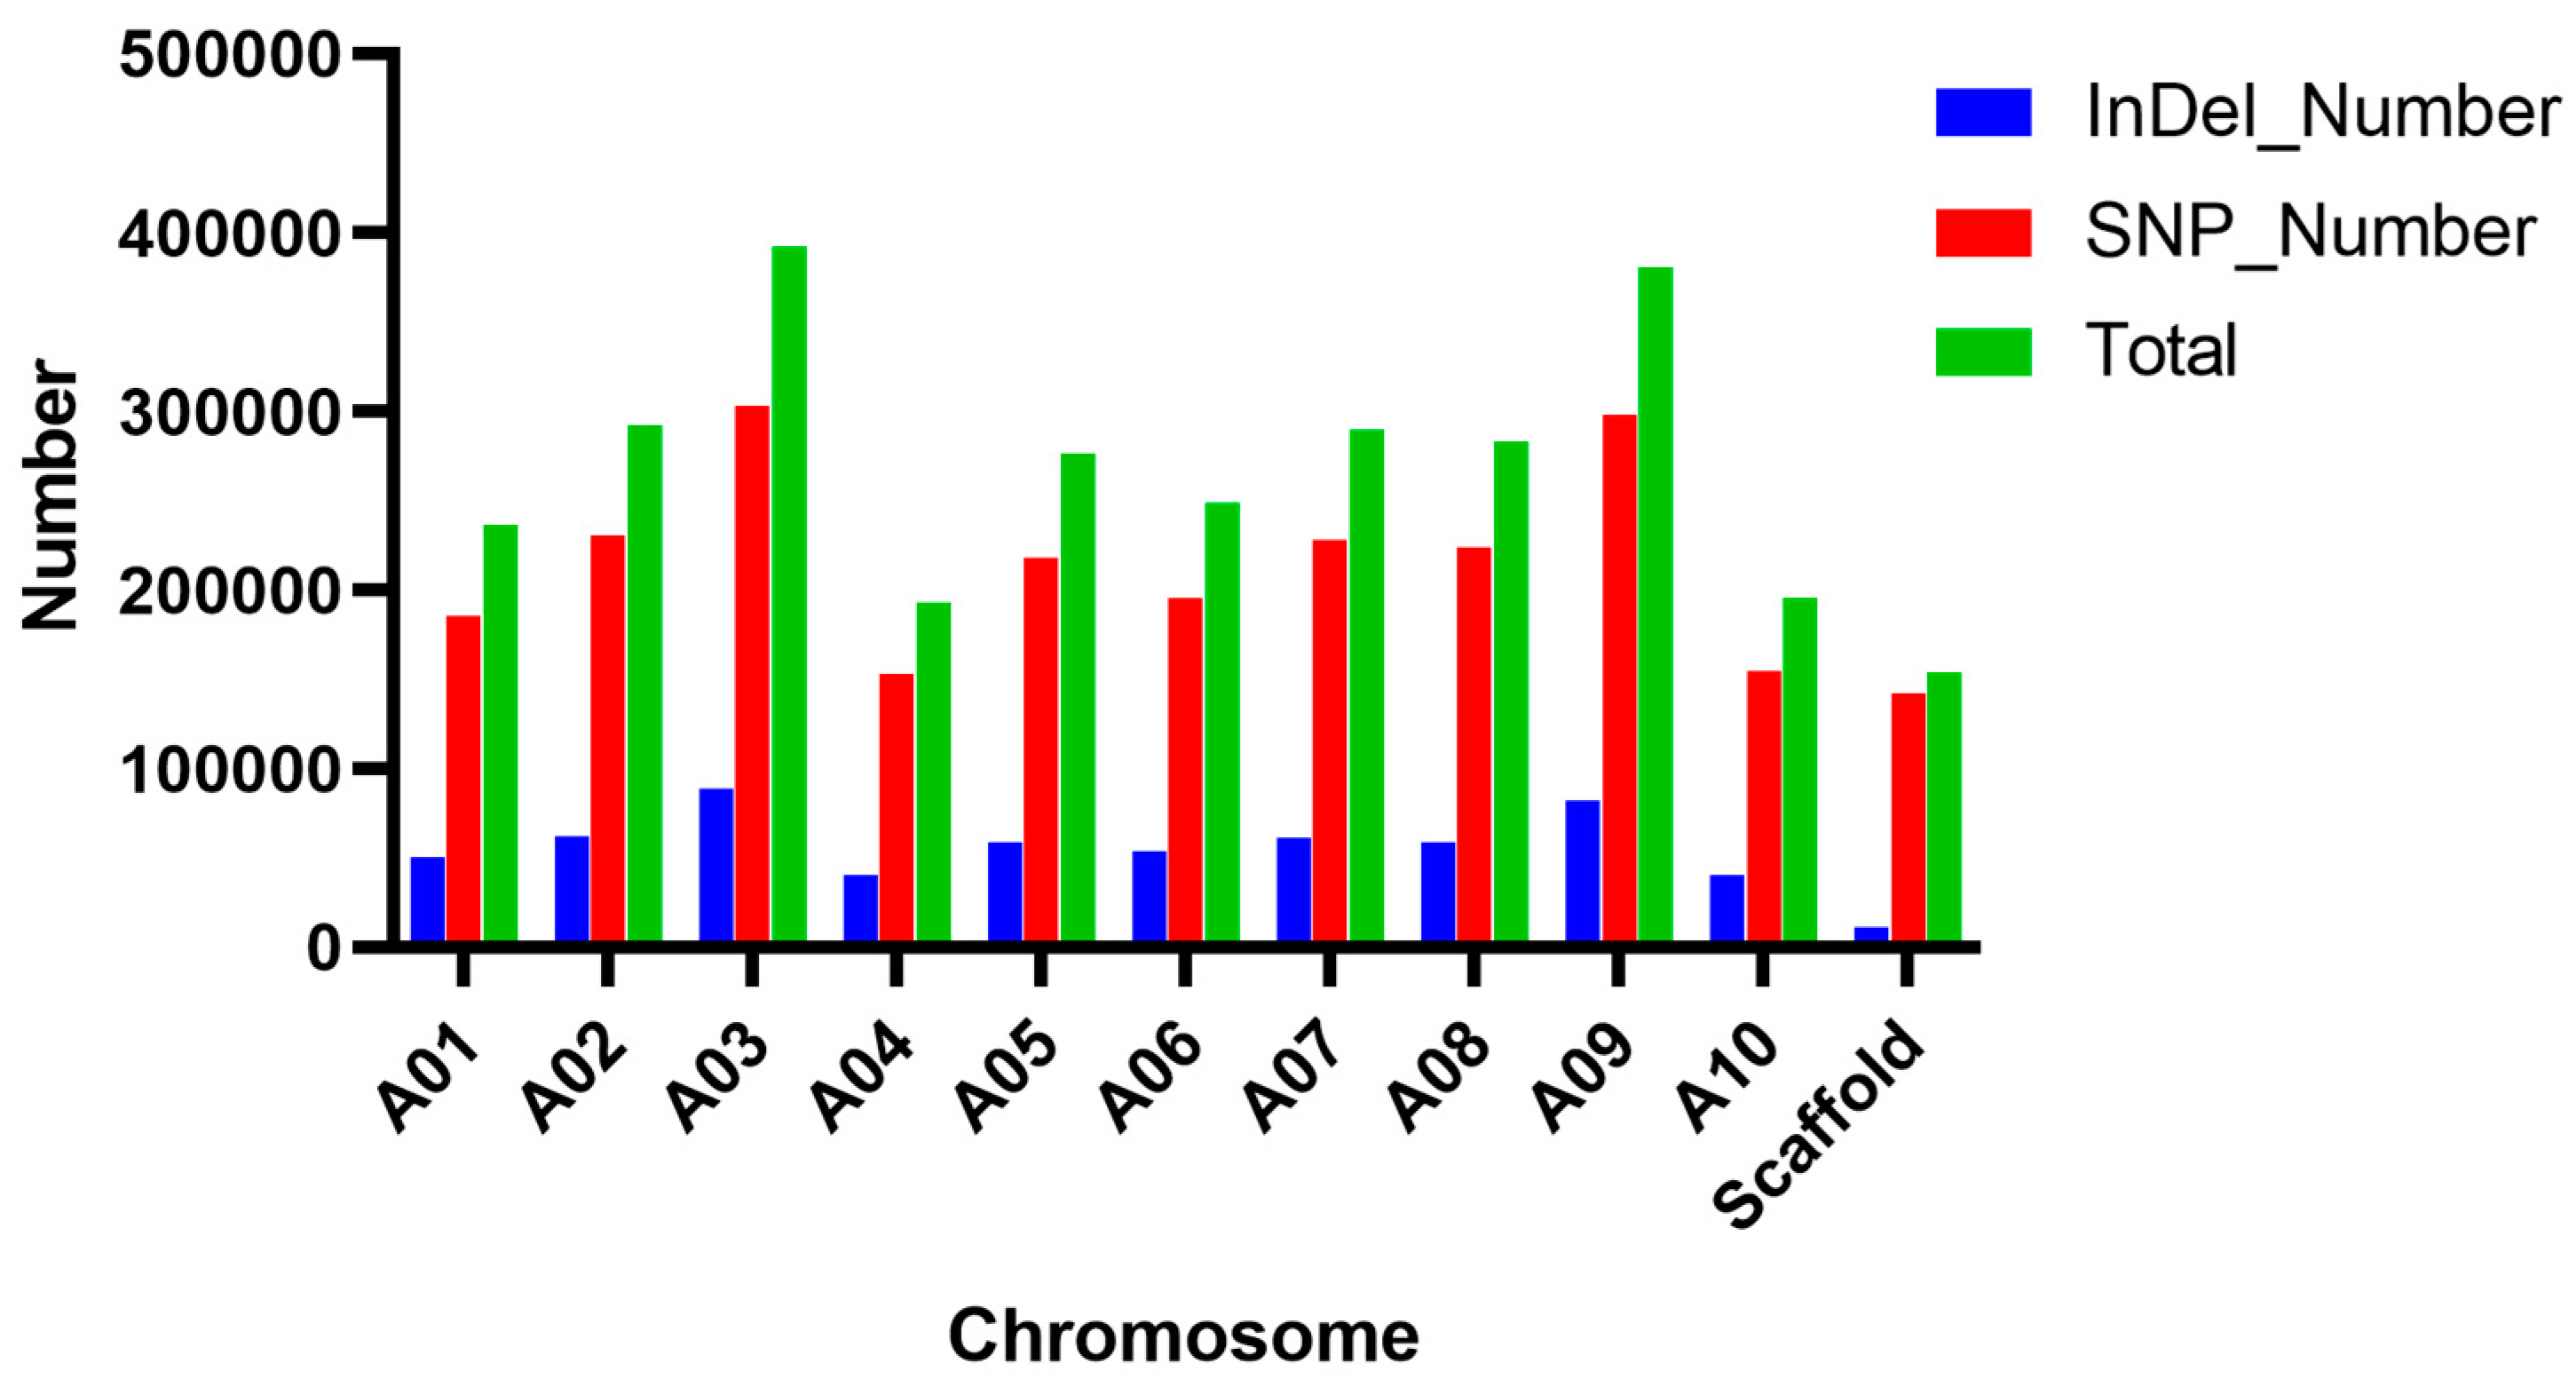
2.2. BSA-Seq Data Analysis

BSA-seq was utilized to identify the genomic region associated with clubroot resistance, with the sequence raw data deposited under the SRA accession SRX24034031 and SRX24034032. This approach involved sequencing two DNA pools: the resistant pool (R-pool) and the susceptible pool (S-pool), as detailed in Table 2. The R-pool yielded 72,065,694 clean reads, while the S-pool produced 67,798,184 clean reads, corresponding to 10,553,867,052 and 9,861,094,696 clean bases, respectively. Of these, 10,004,832,128 bases from the R-pool and 9,374,230,064 bases from the S-pool were successfully mapped to the reference genome, achieving mapping rates of 94.80% and 95.06%, respectively. The duplication rates were 17.41% for the R-pool and 17.60% for the S-pool. The high-quality base percentages were consistent at 67.00% for the R-pool and 67.46% for the S-pool. The average depth of coverage on the reference genome was 28.45 for the R-pool and 26.65 for the S-pool. Furthermore, the coverage rates, which represent the proportion of the reference genome covered at least four times, were 94.88% for the R-pool and 94.97% for the S-pool. These metrics indicate a high degree of consistency between the sequencing data of the R-pool and S-pool, providing a reliable foundation for identifying candidate genomic regions linked to clubroot disease resistance.
Analysis of SNPs and InDels across various chromosomes revealed significant genomic variation within the studied population, as illustrated in Figure 2. The total count of identified variants, including both SNPs and InDels, across all chromosomes reached 2,941,021, which is indicative of considerable genomic diversity. Notably, chromosome A03 exhibited the highest variant count, suggesting regions of enhanced genetic diversity or increased mutational activity relative to other chromosomes. Additionally, the prevalence of SNPs over InDels across most chromosomes indicated that single nucleotide changes are more common than insertion–deletion events in this population. Furthermore, there was observed variability in the count of variants among different chromosomes; for instance, chromosomes A03 and A09 showed significantly higher variant counts than others. This variability may be attributed to differences in recombination rates, selective pressures, or other genomic factors that influence mutation rates and genetic diversity.

2.3. Euclidean Distance Analysis and Prediction of Candidate Areas

The Euclidean distance (ED) analysis was conducted to assess the genetic distance between two samples based on SNP difference. Out of the 2,941,021 variants identified, a subset comprising 942,954 SNPs was selected for the calculation of the SNP index. As a result, a candidate genomic region was identified on chromosome A08, spanning from position 788 to 16,743,576, with a threshold cut-off value of 0.0079 for the ED analysis (Figure 3).

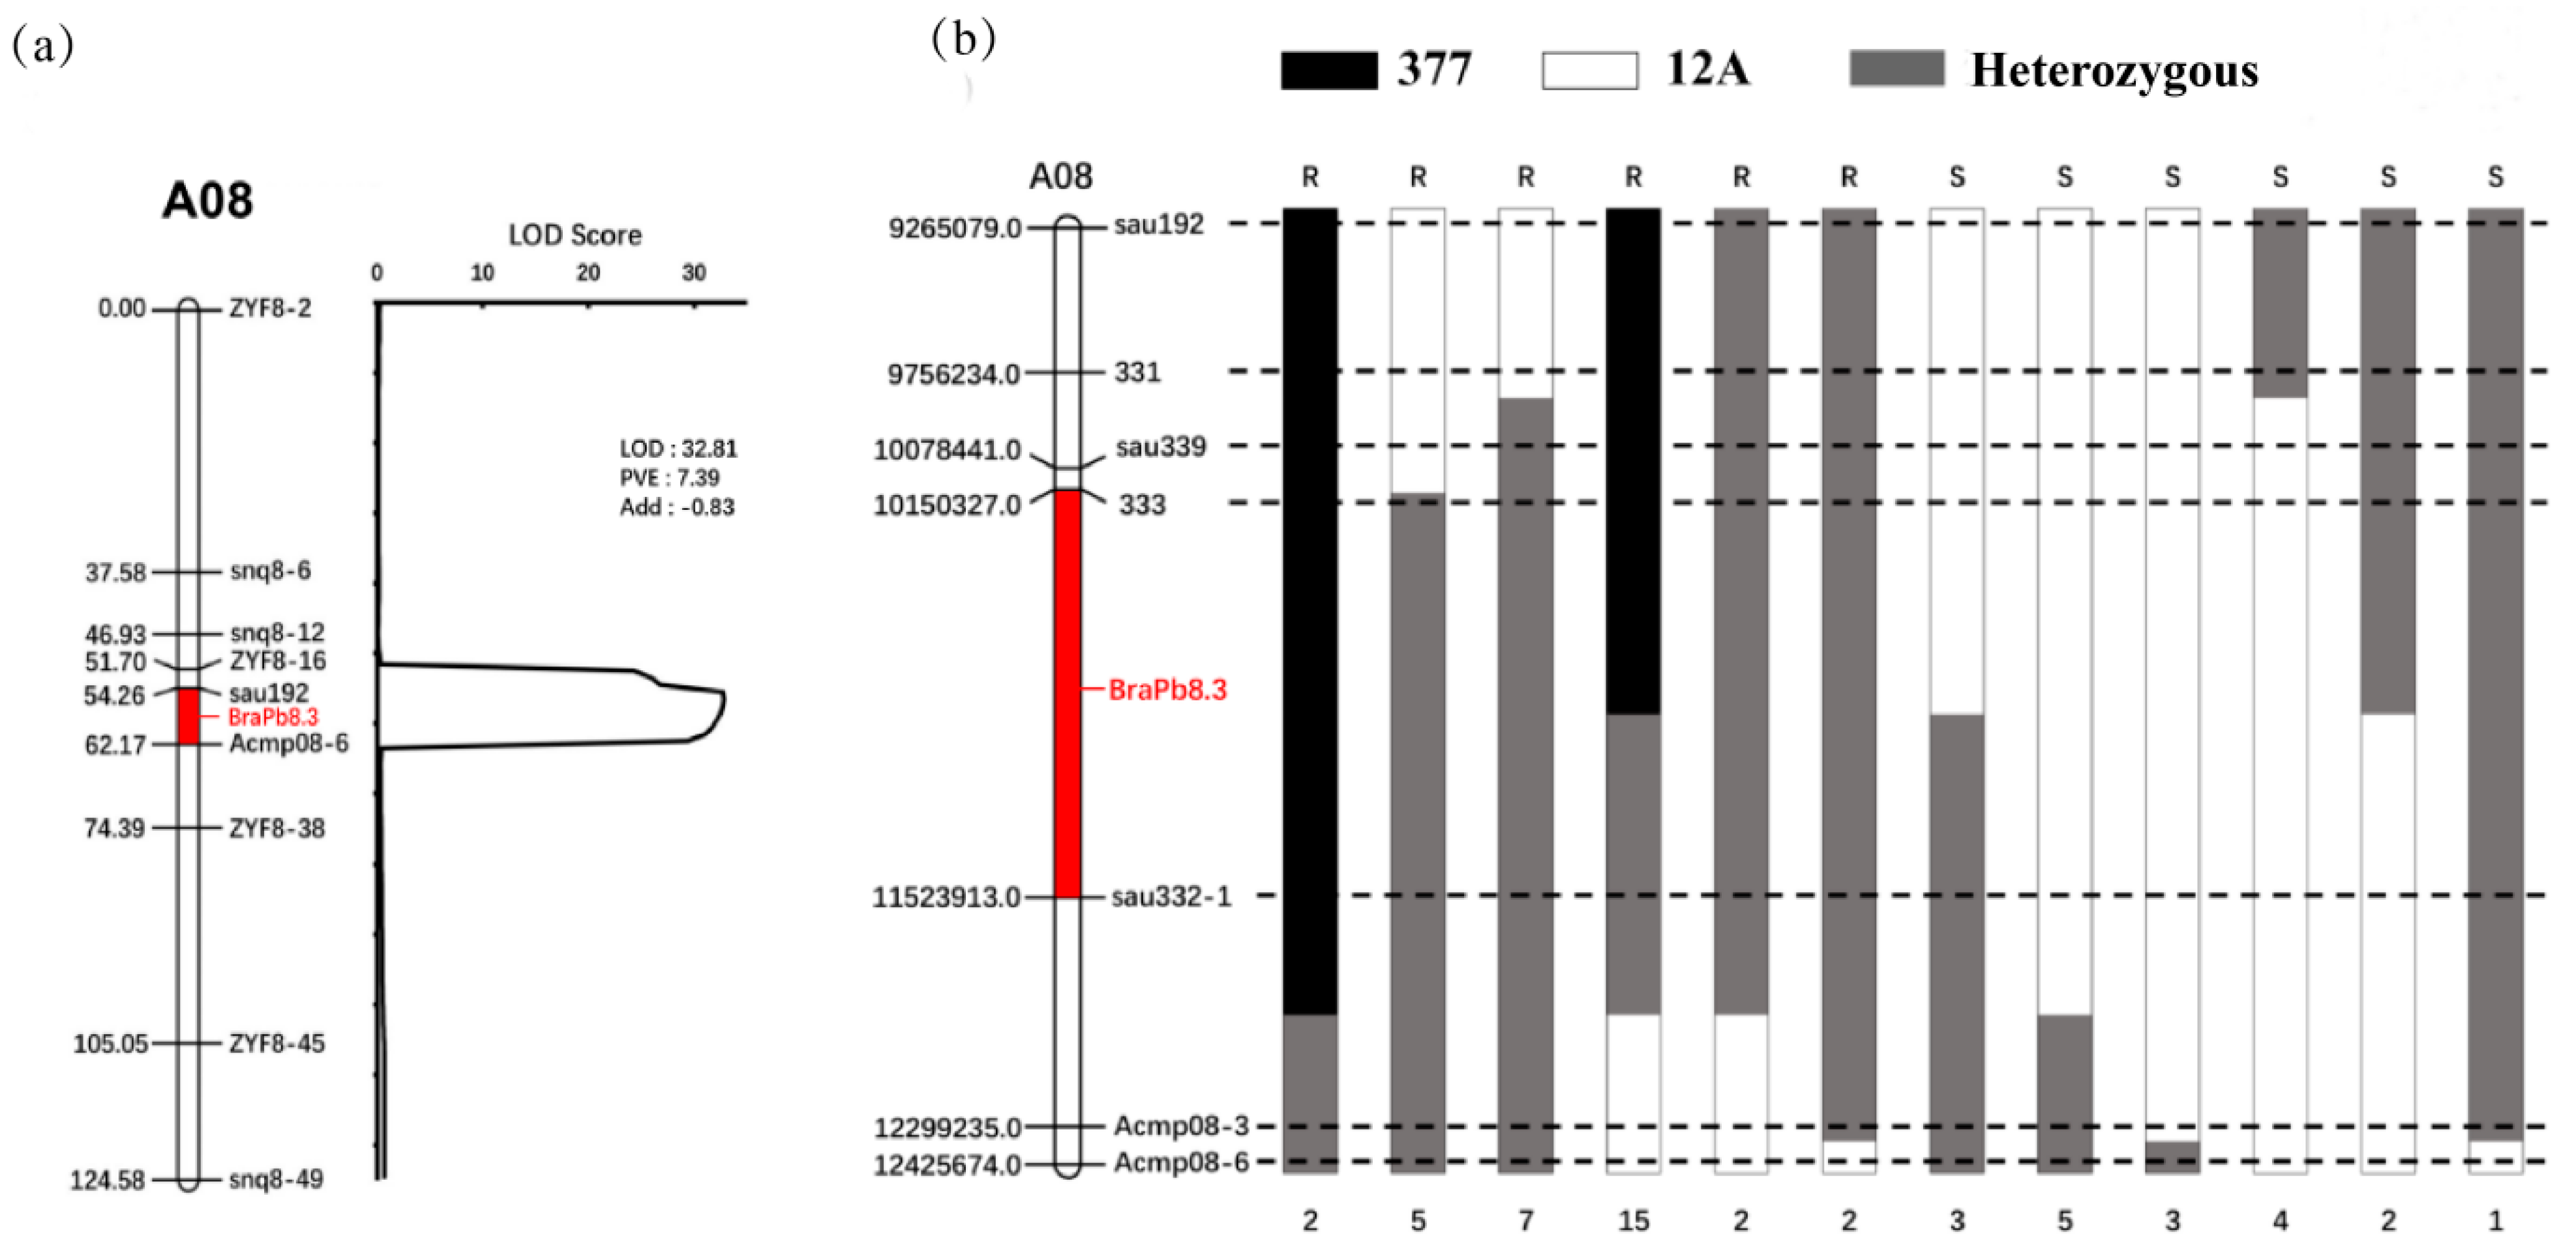
2.4. Preliminary Mapping of BraPb8.3

To accurately pinpoint the chromosomal location of the BraPb8.3 gene locus, a cohort of 470 F2 individual plants was utilized for preliminary mapping. Initially, 120 plants were randomly selected to form the mapping population. Linkage analysis, conducted using nine marker pairs in the JoinMap software, demonstrated a significant association with the target trait. The marker sequences are detailed in Table S3. Subsequent analysis, incorporating post-inoculation phenotypic evaluation of P. brassicae and quantitative trait loci (QTL) analysis with the IciMapping software, identified a significant SNP site characterized by a LODs score of 32.81, a contribution rate of 7.39%, and an additive effect of −0.83. This SNP site was located between the markers “sau192” and “Acmp08-6”, thereby mapping the BraPb8.3 gene locus to chromosome A08 (Figure 4a).
To refine the localization interval of the BraPb8.3 gene locus, the remaining 350 F2 individuals were subjected to a recombinant screening process using the flanking markers “sau192” and “Acmp08-6”. This screening identified 51 recombinant individuals. Subsequent genotyping of these individuals with a refined set of markers, including “331”, “sau339”, “333”, “sau332-1”, and “Acmp08-3”(Table S3), along with phenotypic analysis, allowed for the preliminary mapping of the BraPb8.3 locus to a 1.30 Mb interval between the markers “333” and “sau332-1” (Figure 4b).

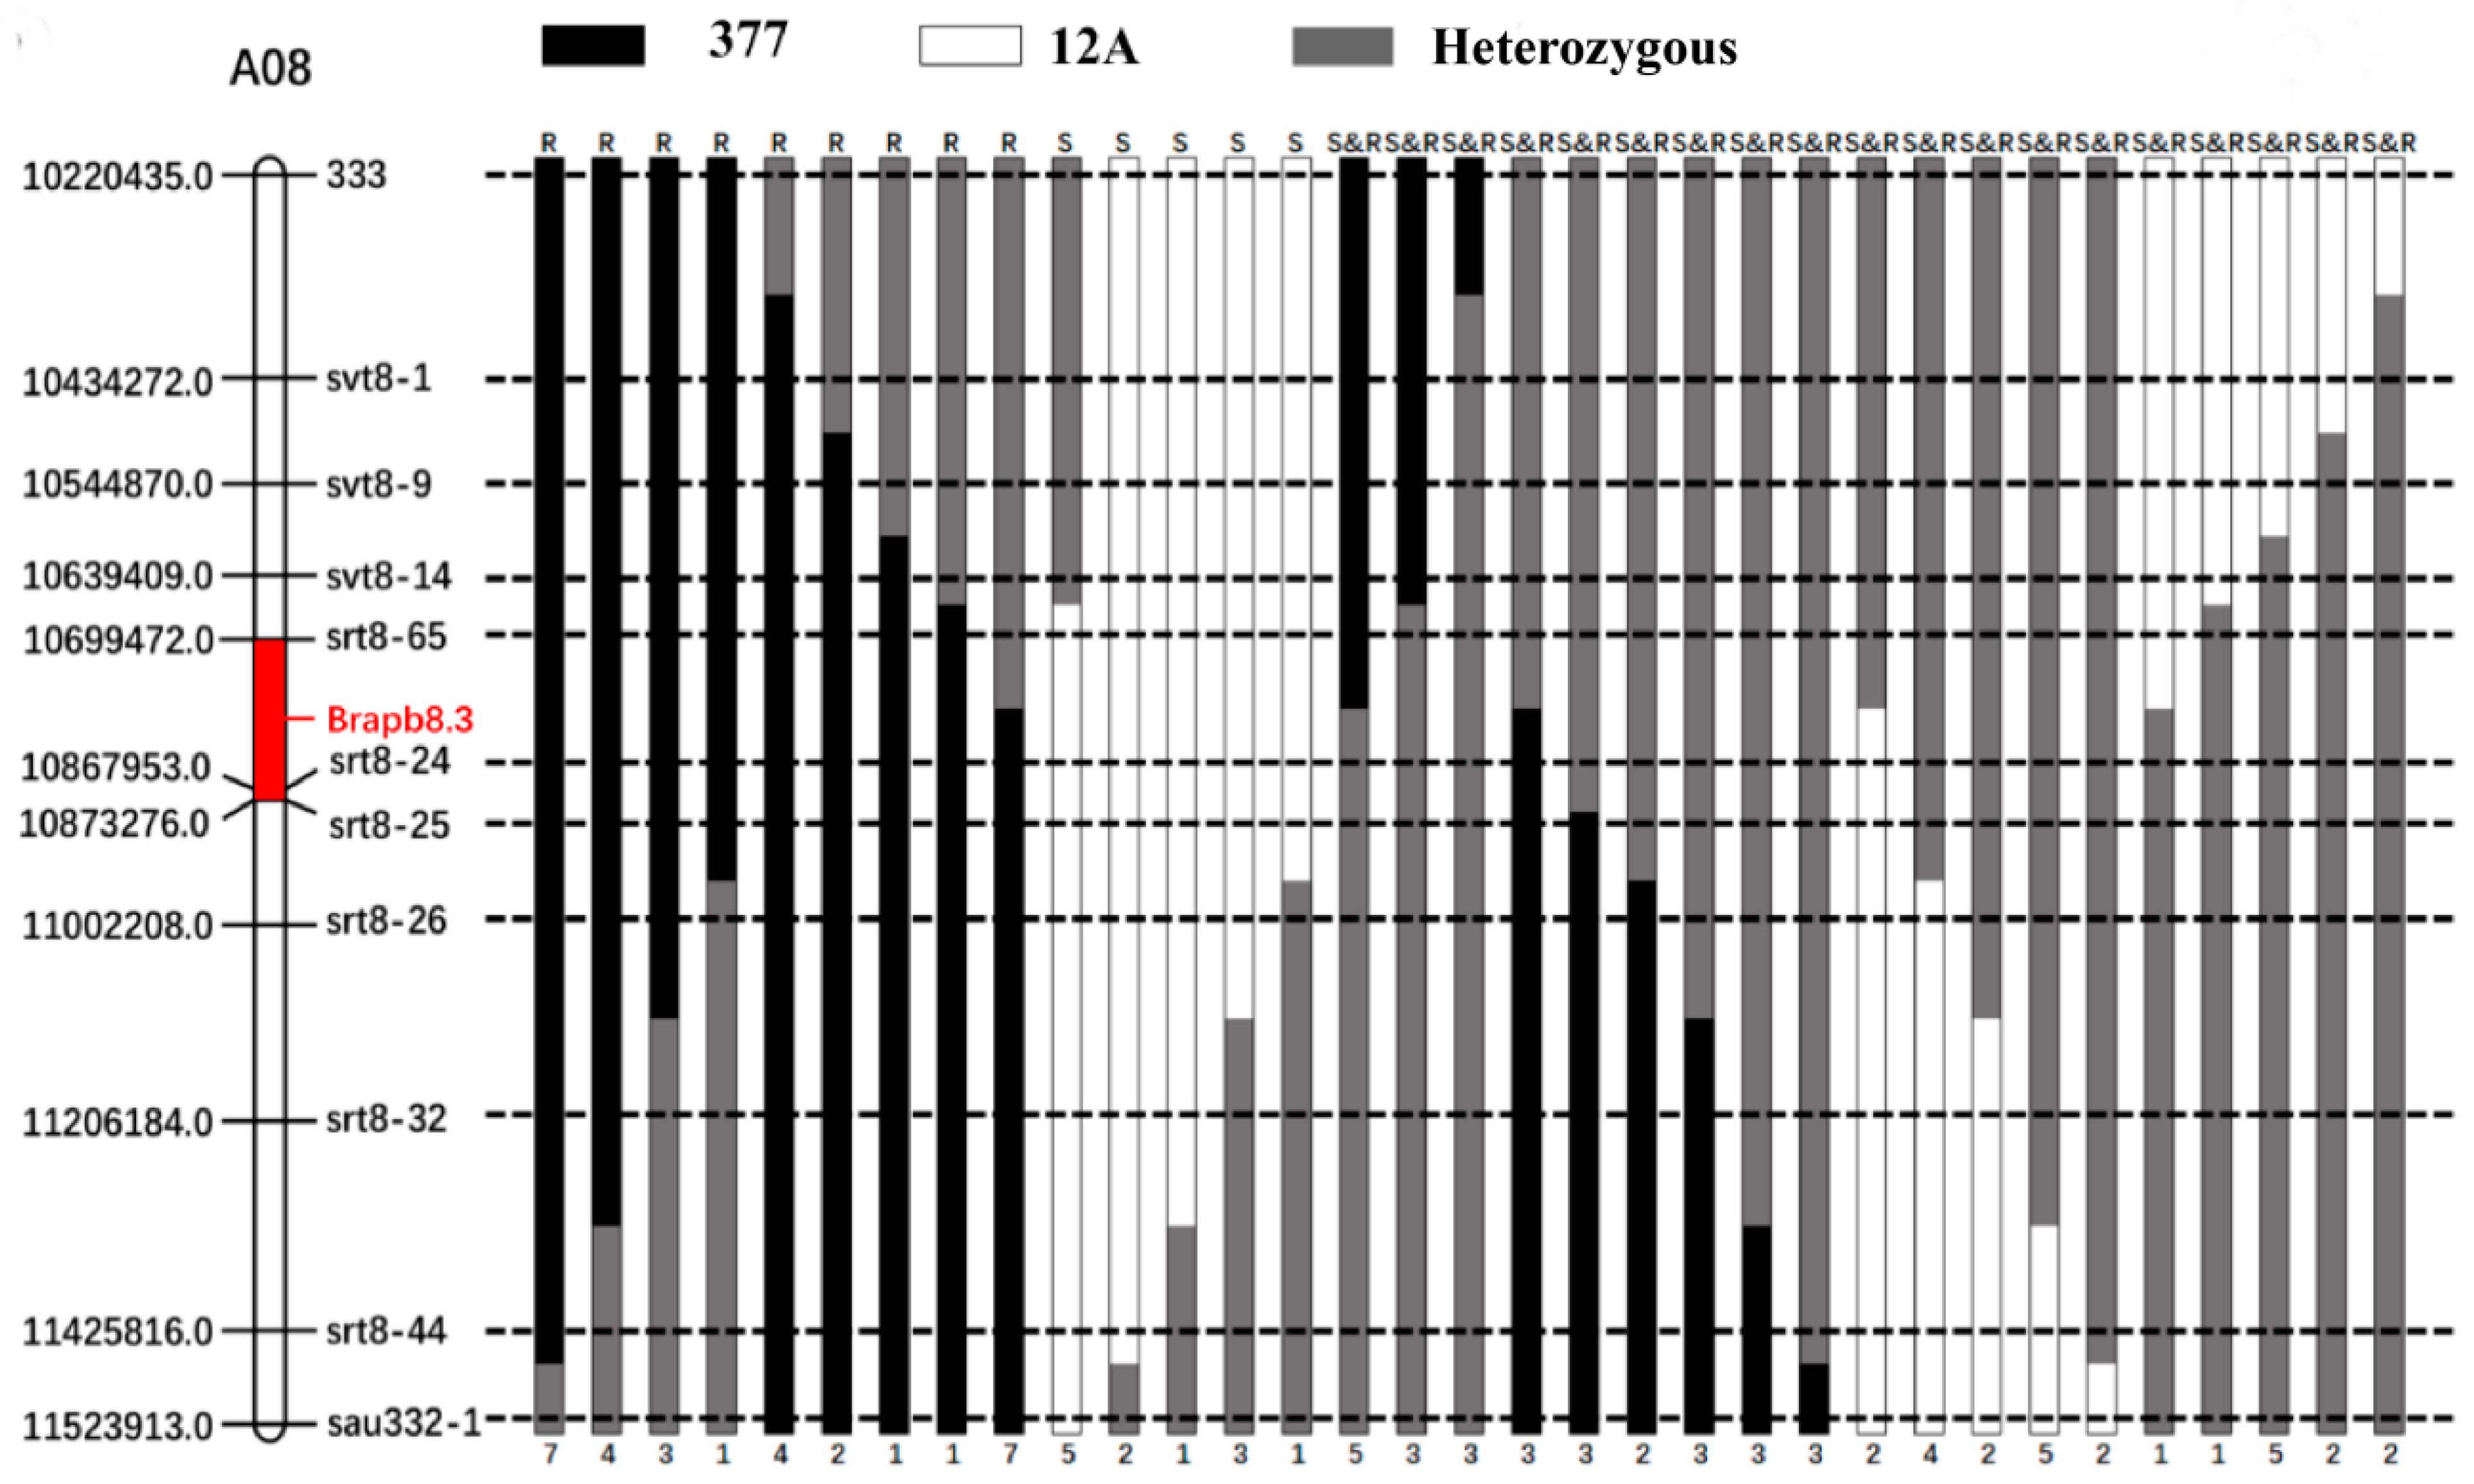
2.5. Fine Mapping of BraPb8.3

To further refine the localization interval of the BraPb8.3 gene locus, fine mapping was conducted. A cohort of 3000 F2 progenies was screened using the molecular markers “333” and “sau332-1”, which are linked to BraPb8.3, resulting in the identification of 96 recombinants. These recombinants were self-pollinated to generate F3 lineages, which were then inoculated with P. brassicae to assess resistance phenotypes. The phenotypic analysis revealed 30 families with pronounced resistance, 12 families with complete susceptibility, and 54 families showing intermediate levels of resistance. Subsequently, the 96 recombinants were genotyped using nine sets of polymorphic markers within the interval defined by “333” and “sau332-1” (Figure 5). By integrating phenotypic data from clubroot disease assessments with genotypic information, the BraPb8.3 resistance locus was precisely mapped to a 173.8 kb segment flanked by the molecular markers “srt8-65” and “srt8-25” on chromosome A08.

2.6. Candidate Genes Analysis

Upon comparison with the Chiifu-401-42 reference genome, it was determined that the 173.8 kb region containing the BraPb8.3 locus encompasses 22 genes (Table 3). Among these, the gene Bra020861 is particularly noteworthy, as it encodes a disease-resistance protein of the TIR-NBS-LRR class, which implicates its potential role in conferring resistance to clubroot disease. Additionally, the Bra020876 gene, which contains a leucine-rich repeat (LRR) domain, may also contribute to the resistance response against clubroot. Furthermore, several other genes within this region are known to be involved in stress responses, chromatin remodeling, DNA binding, and protein chaperoning. Notably, Bra020860 encodes an F-box protein, which could be implicated in the protein degradation pathways associated with disease resistance. The presence of genes associated with calcium permeability, methionine sulfoxide reduction, and RNA polymerase subunits further indicated the involvement of diverse molecular pathways in the resistance to clubroot disease. Further functional characterization of these genes could elucidate the molecular underpinnings of clubroot resistance in Chinese cabbage. In this study, Bra020861 and Bra020876 were considered as candidate genes retained for further investigation.
Following a comparative sequence analysis of the Bra020876 gene from the resistant parent “377” and the susceptible parent “12A,” seven nucleotide differences were identified. These variations included four transitions between cytosine (C) and thymine (T), two transitions between guanine (G) and adenine (A), and a single transversion from guanine (G) to thymine (T) (Supplementary Figure S1a). Moreover, the analysis revealed significant deletions in the Bra020861 gene sequence of the resistant parent “377” compared to that of the susceptible parent “12A” (Supplementary Figure S1b).

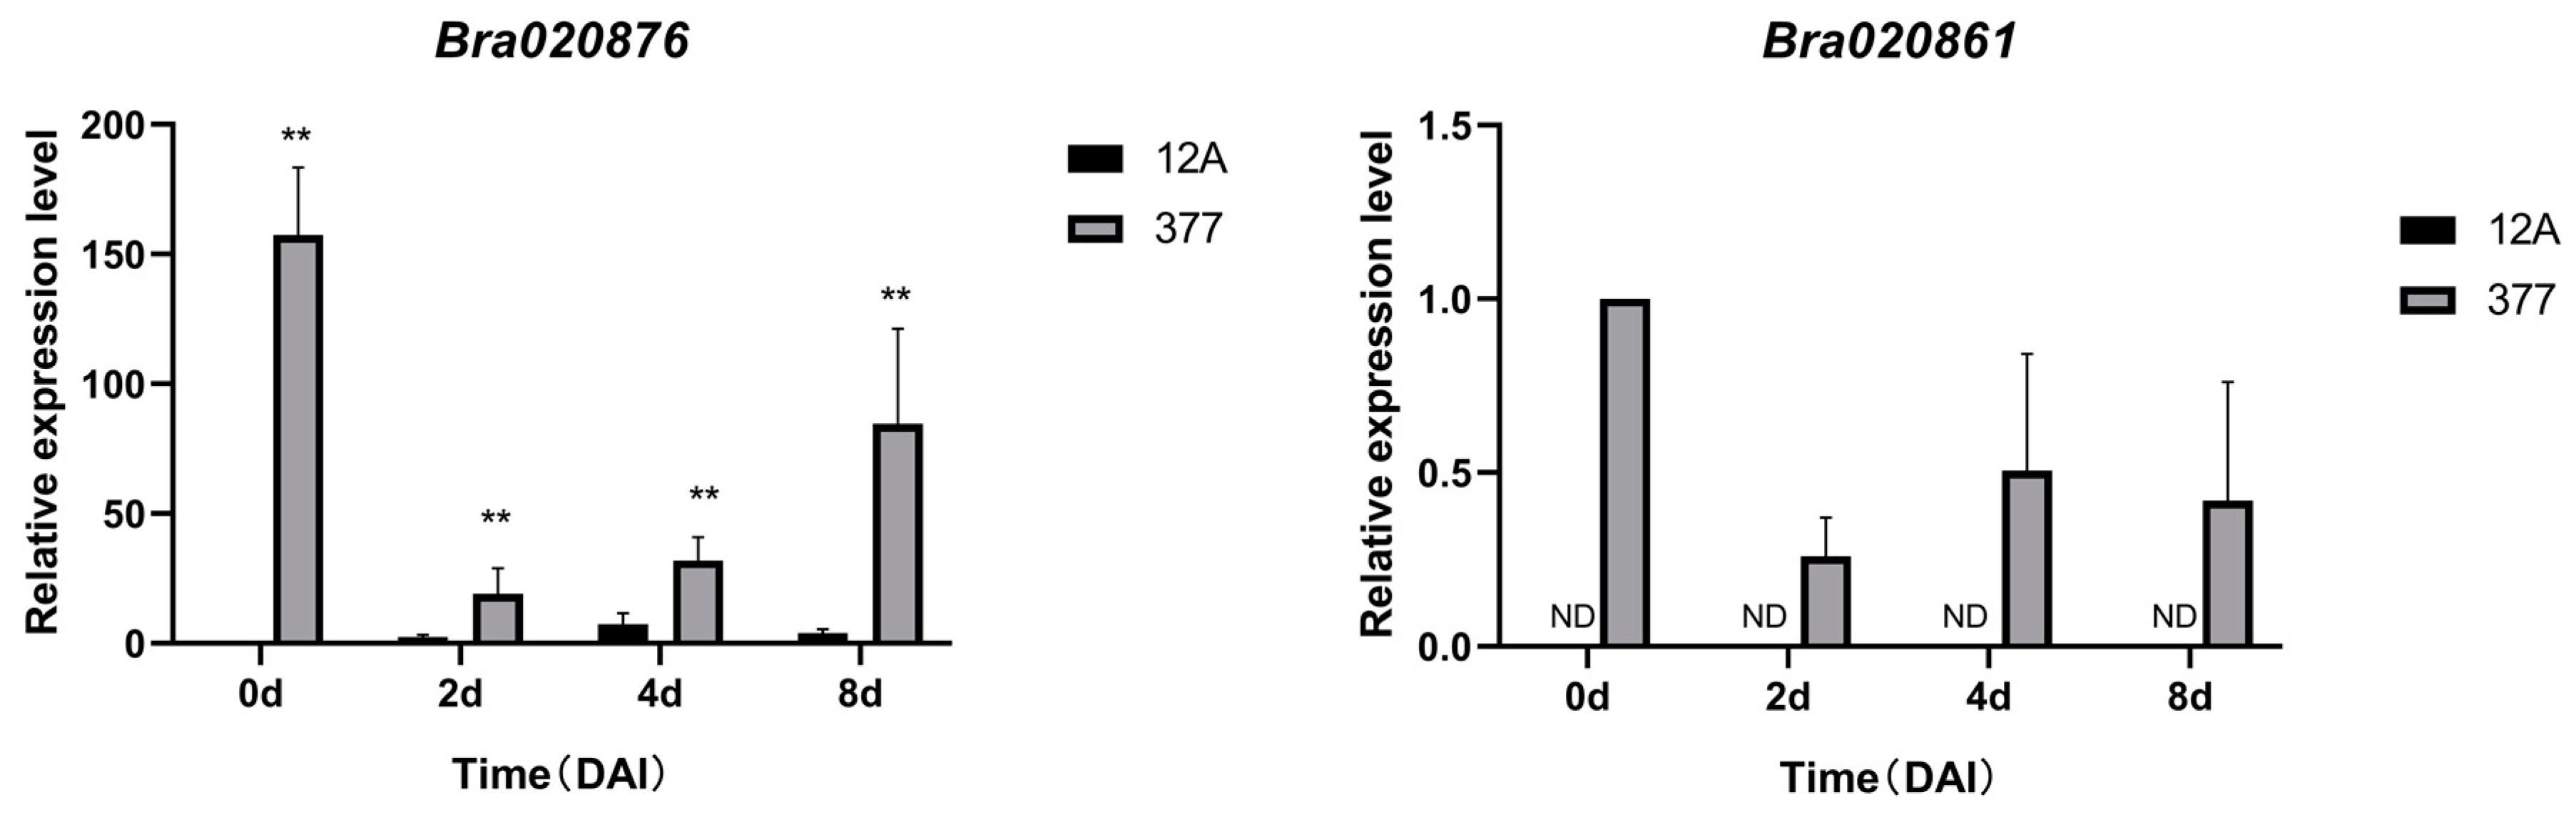
2.7. Expression Analysis of Candidate Genes

To elucidate the contribution of two candidate genes to clubroot resistance, their expression levels were quantified using quantitative reverse transcription PCR (qRT-PCR) (Figure 6). The qRT-PCR analysis revealed significantly higher expression of the Bra020876 gene in the resistant line “377” compared to the susceptible line “12A”. Additionally, expression of the Bra020861 gene was exclusively detected in the resistant line ‘377’. These findings collectively suggest that both Bra020876 and Bra020861 are likely to play a contributory role in the mediation of resistance against clubroot disease.

3. Discussion

Clubroot disease, caused by P. brassicae, poses a significant threat to cruciferous crops, impairing their ability to absorb water and nutrients [4]. The obligate biotrophic nature and intricate life cycle of P. brassicae present numerous challenges for the prevention and management of clubroot [5]. The exploration of clubroot resistance (CR) genes and the breeding for disease resistance are considered the most effective strategies for clubroot disease prevention [7,42,43]. Some resistant germplasms exhibit specificity to different pathotypes of P. brassicae [13,19,42]. Considering the frequent presence of multiple pathotypes of P. brassicae in the field, a germplasm with resistance to several pathotypes can more effectively prevent clubroot disease. The Chinese cabbage disease-resistant parent “377” utilized in this study exhibited robust resistance to pathotypes Pb2, Pb4, and Pb10 of P. brassicae, as defined by the sinitic clubroot differential set [44]. Therefore, identifying the resistant locus in “377” is of significant importance for breeding efforts against clubroot disease.
Numerous studies have shown that resistance within the A genome is commonly regulated by a major dominant locus [18,19,45]. In our study, the F1 hybrid derived from the resistant parent “377” and the susceptible parent “12A” exhibited clubroot resistance, with a segregation ratio of 3:1 for resistance and susceptibility observed in the F2 generation. This segregation pattern strongly suggests that clubroot resistance is controlled by a single dominant gene. BSA-seq is an efficient method for finely mapping the quantitative trait loci interval of target genes through the sequencing of mixed-DNA gene pools. This approach is widely employed in gene mapping studies [46,47,48,49,50]. In our research, we utilized the combination of BSA-seq with the ED algorithm to establish a threshold of 0.0079 for identifying candidate regions, which allowed us to pinpoint the clubroot-resistance gene to chromosome A08. Several studies have documented the presence of seven clubroot resistance (CR) loci on chromosome A08, spanning the 10.39–13.67 Mb region, including CRs, PbBa8.1, Rcr3, Rcr9, Crr1, Rcr9wa, and CRA8.1 [13,28,29,51,52]. In this work, BraPb8.3 was identified within the 10.69–10.87 Mb region of chromosome A08. Employing traditional preliminary and fine mapping approaches, we further refined the BraPb8.3 locus to a 173.8 kb interval flanked by the “srt8-65” and “srt8-25” markers on chromosome A08. The development of molecular markers closely associated with target genes, coupled with molecular marker-assisted breeding techniques, provides powerful tools for combating clubroot disease [41,53]. The molecular markers ‘333’ and ‘sau332-1’ have demonstrated exceptional efficacy in selecting clubroot-resistant individuals within the F2 population, indicating their close linkage to the clubroot resistance (CR) loci. Furthermore, the molecular markers ‘srt8-65’ and ‘srt8-25’ have been identified as closely linked to the BraPb8.3 locus, suggesting their potential utility in assisting breeding programs focused on enhancing clubroot resistance in Chinese cabbage
The majority of characterized disease resistance (R) genes are known to feature the TIR-NBS-LRR domains [11,41]. In our study, within the finely mapped region of the Chiifu-401-42 genome, Bra020861 was identified as a TIR-NBS-LRR type R gene, while Bra020876 was found to possess an LRR domain, highlighting their potential roles in disease resistance mechanisms. Sequence analysis revealed variations between these candidate genes in the resistant and susceptible parents. Additionally, relative gene expression analysis showed that Bra020861 was highly expressed in the disease-resistant parent “377”, in contrast to being either undetectable or expressed at very low levels in the susceptible parent “12A”. On the other hand, Bra020876 was upregulated in the resistant parent “377”. Together, these results suggest that Bra020861 and Bra020876 are likely key contributors to clubroot disease resistance.
In summary, the clubroot resistance locus BraPb8.3 has been precisely located within a 173.8 kb interval between markers “srt8-65” and “srt8-25” on chromosome A08 of B. rapa. Within this delineated region, two genes featuring the TIR-NBS-LRR or LRR domains were identified. Through sequence comparison and expression analysis, Bra020861 and Bra020876 have emerged as significant candidate genes for the BraPb8.3-mediated resistance to clubroot disease. These findings necessitate further investigation to confirm the roles of these genes in disease resistance. Importantly, our research not only identified a key clubroot resistance locus in B. rapa but also established molecular markers linked to novel CR genes. This advancement significantly contributes to our understanding of the genetics and management strategies against clubroot disease. Furthermore, our work provides valuable genetic resources that can be utilized for the control of clubroot and offers potent molecular markers to enhance breeding programs in Chinese cabbage.

4. Materials and Methods

4.1. Plant Materials and P. brassicae Inoculation

The Chinese cabbage-resistant inbred line ‘377’ was hybridized with the susceptible inbred line ‘12A’ to generate a segregating F1 generation. This F1 generation was subsequently self-pollinated to yield an F2 generation consisting of 3470 individuals. In order to pinpoint the clubroot resistance (CR) locus, the F1, F2, and F3 populations were inoculated with the P. brassicae isolate “KEL-23” (Pb4). For inoculation, P. brassicae isolates were extracted from homogenized clubbed Chinese cabbage roots and then diluted to a concentration of 1 × 10⁷ spores/mL. Following this, 1 mL of the suspension was introduced into the soil near the roots of each 2-week-old seedling. The assessment of clubroot disease resistance was conducted at five weeks post-inoculation.

4.2. BSA-Seq Analysis

DNA from “377”, “12A”, and the 3470 F2 progenies was extracted using a modified CTAB method [54]. Two DNA pools from the F2 generation, one of susceptible (S-pool) and one of resistant individuals (R-pool), each containing DNA from 20 individuals, were sequenced on an Illumina HiSeq 2500 (Annogene, Beijing, China). After cleaning and aligning the sequences to the B. rapa reference genome (http://brassicadb.cn/#/ (accessed on 23 September 2024)), we conducted a variant analysis with GATK [55], filtering for quality and depth. ANNOVAR was used for annotation [56]. SNPs and InDels were further screened, with a focus on significant variations, leveraging Euclidean distance (ED) for differential analysis [57], and we set a threshold based on the standard deviation.

4.3. Molecular Marker Development

This study utilized Bulk Segregant Analysis sequencing (BSA-seq) and employed the Chiifu-401-42 reference genome sequence, sourced from the Brassica Database (BRAD, http://brassicadb.cn/#/ (accessed on 23 September 2024)), for the purpose of developing molecular markers within the BraPb8.3 candidate region. SSR and InDel markers were designed to facilitate quantitative trait loci (QTL) mapping and fine mapping. A subset of the SSR markers was generated using SSR Hunter version 1.3 software [58], while other SSR markers have been previously established by our research team [13,59]. The development of InDel markers adhered to the methodologies outlined in recent research [7].

4.4. Construction of Genetic Linkage Map and QTL Analysis

The genetic linkage map construction was performed using the JoinMap version 4.0 software [60]. This involved integrating genotype data from the F2 population with the corresponding markers. Recombination frequencies were calculated using the Kosambi mapping function. A threshold LODs score of 3.0 was applied to guide the generation of the genetic linkage map. Simultaneously, the QTL IciMapping software version 4.0 was utilized to analyze phenotypic responses in individual F2 progenies post P. brassicae inoculation. This analysis included computing LODs scores and identifying QTL linked to disease resistance.

4.5. Fine Mapping of BraPb8.3

Two molecular markers, “333” and “sau332-1”, which are closely linked to the BraPb8.3 locus, were employed to select recombinant individuals. Following this selection process, 96 recombinant individuals were identified from an F2 population of 3000 individuals, and these individuals were subsequently self-pollinated to generate F3 families. Both parental lines and the 96 F3 family lines underwent inoculation with the P. brassicae isolate “KEL-23”. By integrating the clubroot resistance phenotype observed in the F3 families with the genotype of the recombinant individuals, the clubroot resistance gene BraPb8.3 was finely mapped.

4.6. Prediction and Analysis of Candidate Genes

Candidate genes within the BraPb8.3 fine mapping interval were predicted using the BRAD website. Subsequently, these genes were analyzed on the Pfam website (http://pfam.xfam.org/ (accessed on 23 September 2024)) to ascertain the presence of the TIR-NBS-LRR domain. Primers, outlined in Table S1 and designed based on the Chiifu-401-42 reference genome sequence, were used to amplify candidate genes from the genomic DNA of the disease-resistant parent ‘377’ and the susceptible parent ‘12A’. The PCR products were purified, ligated into the T vector (Takara, Dalian, China), then transformed into Escherichia coli strain DH5α, and selected for monoclonal colonies. These were subsequently subjected to Sanger sequencing to determine the nucleotide sequences of the cloned inserts. A comparative analysis of the sequencing data was performed to identify sequence variations potentially contributing to the observed phenotypic differences in disease resistance between the parental lines.

4.7. Total RNA Extraction and qRT-PCR

Total RNA was extracted from the roots of both parental lines using a TRIZOL reagent (Tiangen, Beijing, China), according to the manufacturer’s instructions. RNA isolation of high quality was then followed by the synthesis of first-strand complementary DNA (cDNA) using the FastKing RT Kit (Tiangen, Beijing, China). Quantitative Real-Time PCR (qRT-PCR) analysis was conducted using SuperReal PreMix Plus (Tiangen, Beijing, China). Primers for qRT-PCR were designed based on the reference genome sequence of Chiifu-401-42, with sequences provided in Table S2. The 18SrRNA gene was chosen as the internal reference for normalization in Chinese cabbage. The relative expression levels of the genes of interest were determined using the 2−ΔΔCT method [61].

Supplementary Materials

The following supporting information can be downloaded at https://www.mdpi.com/article/10.3390/ijms251910462/s1.

Author Contributions

L.K. and Y.Z. performed experiments and analyzed the data; L.K. drafted the original manuscript; Y.Y. provided technical support. Z.Z. designed the study and revised the manuscript. Z.Z. and Z.P. provided funding support and supervision for this study. All authors have read and agreed to the published version of the manuscript.

Funding

This work was supported by the National Natural Science Youth Fund of China (No. 32202480).

Institutional Review Board Statement

Not applicable

Informed Consent Statement

Not applicable

Data Availability Statement

The data supporting the results are included in this article. Additional relevant materials are available upon reasonable request from the corresponding author. The raw data from Bulked Segregant Analysis sequencing have been deposited at the NCBI Sequence Read Archive (SRA) repository under the accession numbers SRX24034031 and SRX24034032.

Conflicts of Interest

The authors declare no conflicts of interest.

References

  1. Liu, Y.; Guan, X.; Liu, S.; Yang, M.; Ren, J.; Guo, M.; Huang, Z.; Zhang, Y. Genome-Wide Identification and Analysis of TCP Transcription Factors Involved in the Formation of Leafy Head in Chinese Cabbage. Int. J. Mol. Sci. 2018, 19, 847. [Google Scholar] [CrossRef]
  2. Dixon, G.R. The Occurrence and Economic Impact of Plasmodiophora brassicae and Clubroot Disease. J. Plant Growth Regul. 2009, 28, 194–202. [Google Scholar] [CrossRef]
  3. Struck, C.; Rüsch, S.; Strehlow, B. Control Strategies of Clubroot Disease Caused by Plasmodiophora brassicae. Microorganisms 2022, 10, 620. [Google Scholar] [CrossRef] [PubMed]
  4. Javed, M.A.; Schwelm, A.; Zamani-Noor, N.; Salih, R.; Silvestre Vañó, M.; Wu, J.; González García, M.; Heick, T.M.; Luo, C.; Prakash, P.; et al. The clubroot pathogen Plasmodiophora brassicae: A profile update. Mol. Plant Pathol. 2023, 24, 89–106. [Google Scholar] [CrossRef] [PubMed]
  5. Liu, L.; Qin, L.; Zhou, Z.; Hendriks, W.; Liu, S.; Wei, Y. Refining the Life Cycle of Plasmodiophora brassicae. Phytopathology 2020, 110, 1704–1712. [Google Scholar] [CrossRef]
  6. Zhang, C.; Du, C.; Li, Y.; Wang, H.; Zhang, C.; Chen, P. Advances in Biological Control and Resistance Genes of Brassicaceae Clubroot Disease-The Study Case of China. Int. J. Mol. Sci. 2023, 24, 785. [Google Scholar] [CrossRef]
  7. Pang, W.; Zhang, X.; Ma, Y.; Wang, Y.; Zhan, Z.; Piao, Z. Fine mapping and candidate gene analysis of CRA3.7 conferring clubroot resistance in Brassica rapa. Theor. Appl. Genet. 2022, 135, 4541–4548. [Google Scholar] [CrossRef]
  8. Liu, Y.; Xu, A.; Liang, F.; Yao, X.; Wang, Y.; Liu, X.; Zhang, Y.; Dalelhan, J.; Zhang, B.; Qin, M.; et al. Screening of clubroot-resistant varieties and transfer of clubroot resistance genes to Brassica napus using distant hybridization. Breed. Sci. 2018, 68, 258–267. [Google Scholar] [CrossRef]
  9. Lu, C.; Jiang, Y.; Yue, Y.; Sui, Y.; Hao, M.; Kang, X.; Wang, Q.; Chen, D.; Liu, B.; Yin, Z.; et al. Glutathione and neodiosmin feedback sustain plant immunity. J. Exp. Bot. 2023, 74, 976–990. [Google Scholar] [CrossRef]
  10. Yuan, M.; Ngou, B.P.M.; Ding, P.; Xin, X.F. PTI-ETI crosstalk: An integrative view of plant immunity. Curr. Opin. Plant Biol. 2021, 62, 102030. [Google Scholar] [CrossRef]
  11. Bernoux, M.; Zetzsche, H.; Stuttmann, J. Connecting the dots between cell surface- and intracellular-triggered immune pathways in plants. Curr. Opin. Plant Biol. 2022, 69, 102276. [Google Scholar] [CrossRef] [PubMed]
  12. Suwabe, K.; Tsukazaki, H.; Iketani, H.; Hatakeyama, K.; Fujimura, M.; Nunome, T.; Fukuoka, H.; Matsumoto, S.; Hirai, M. Identification of two loci for resistance to clubroot (Plasmodiophora brassicae Woronin) in Brassica rapa L. Theor. Appl. Genet. 2003, 107, 997–1002. [Google Scholar] [CrossRef] [PubMed]
  13. Chen, J.; Jing, J.; Zhan, Z.; Zhang, T.; Zhang, C.; Piao, Z. Identification of novel QTLs for isolate-specific partial resistance to Plasmodiophora brassicae in Brassica rapa. PLoS ONE 2013, 8, e85307. [Google Scholar] [CrossRef] [PubMed]
  14. Pang, W.; Liang, S.; Li, X.; Li, P.; Yu, S.; Lim, Y.P.; Piao, Z. Genetic detection of clubroot resistance loci in a new population of Brassica rapa. Hortic. Environ. Biotechnol. 2014, 55, 540–547. [Google Scholar] [CrossRef]
  15. Sakamoto, K.; Saito, A.; Hayashida, N.; Taguchi, G.; Matsumoto, E. Mapping of isolate-specific QTLs for clubroot resistance in Chinese cabbage (Brassica rapa L. ssp. pekinensis). Theor. Appl. Genet. 2008, 117, 759–767. [Google Scholar] [CrossRef] [PubMed]
  16. Yu, F.; Zhang, X.; Peng, G.; Falk, K.C.; Strelkov, S.E.; Gossen, B.D. Genotyping-by-sequencing reveals three QTL for clubroot resistance to six pathotypes of Plasmodiophora brassicae in Brassica rapa. Sci. Rep. 2017, 7, 4516. [Google Scholar] [CrossRef]
  17. Matsumoto, E.; Yasui, C.; Ohi, M.; Tsukada, M. Linkage analysis of RFLP markers for clubroot resistance and pigmentation in Chinese cabbage (Brassica rapa ssp. pekinensis). Euphytica 1998, 104, 79–86. [Google Scholar] [CrossRef]
  18. Piao, Z.Y.; Deng, Y.Q.; Choi, S.R.; Park, Y.J.; Lim, Y.P. SCAR and CAPS mapping of CRb, a gene conferring resistance to Plasmodiophora brassicae in Chinese cabbage (Brassica rapa ssp. pekinensis). Theor. Appl. Genet. 2004, 108, 1458–1465. [Google Scholar] [CrossRef]
  19. Pang, W.; Fu, P.; Li, X.; Zhan, Z.; Yu, S.; Piao, Z. Identification and Mapping of the Clubroot Resistance Gene CRd in Chinese Cabbage (Brassica rapa ssp. pekinensis). Front. Plant Sci. 2018, 9, 653. [Google Scholar] [CrossRef]
  20. Saito, M.; Kubo, N.; Matsumoto, S.; Suwabe, K.; Tsukada, M.; Hirai, M. Fine mapping of the clubroot resistance gene, Crr3, in Brassica rapa. Theor. Appl. Genet. 2006, 114, 81–91. [Google Scholar] [CrossRef]
  21. Chu, M.; Song, T.; Falk, K.C.; Zhang, X.; Liu, X.; Chang, A.; Lahlali, R.; McGregor, L.; Gossen, B.D.; Peng, G.; et al. Fine mapping of Rcr1 and analyses of its effect on transcriptome patterns during infection by Plasmodiophora brassicae. BMC Genom. 2014, 15, 1166. [Google Scholar] [CrossRef] [PubMed]
  22. Huang, Z.; Peng, G.; Liu, X.; Deora, A.; Falk, K.C.; Gossen, B.D.; McDonald, M.R.; Yu, F. Fine Mapping of a Clubroot Resistance Gene in Chinese Cabbage Using SNP Markers Identified from Bulked Segregant RNA Sequencing. Front. Plant Sci. 2017, 8, 1448. [Google Scholar] [CrossRef] [PubMed]
  23. Yu, F.; Zhang, Y.; Wang, J.; Chen, Q.; Karim, M.M.; Gossen, B.D.; Peng, G. Identification of Two Major QTLs in Brassica napus Lines with Introgressed Clubroot Resistance from Turnip Cultivar ECD01. Front. Plant Sci. 2021, 12, 785989. [Google Scholar] [CrossRef] [PubMed]
  24. Nguyen, M.L.; Monakhos, G.F.; Komakhin, R.A.; Monakhos, S.G. The New Clubroot Resistance Locus Is Located on Chromosome A05 in Chinese Cabbage (Brassica rapa L.). Russ. J. Genet. 2018, 54, 296–304. [Google Scholar] [CrossRef]
  25. Suwabe, K.; Tsukazaki, H.; Iketani, H.; Hatakeyama, K.; Kondo, M.; Fujimura, M.; Nunome, T.; Fukuoka, H.; Hirai, M.; Matsumoto, S. Simple sequence repeat-based comparative genomics between Brassica rapa and Arabidopsis thaliana: The genetic origin of clubroot resistance. Genetics 2006, 173, 309–319. [Google Scholar] [CrossRef]
  26. Zhu, H.; Zhai, W.; Li, X.; Zhu, Y. Two QTLs controlling Clubroot resistance identified from Bulked Segregant Sequencing in Pakchoi (Brassica campestris ssp. chinensis Makino). Sci. Rep. 2019, 9, 9228. [Google Scholar] [CrossRef]
  27. Hatakeyama, K.; Suwabe, K.; Tomita, R.N.; Kato, T.; Nunome, T.; Fukuoka, H.; Matsumoto, S. Identification and characterization of Crr1a, a gene for resistance to clubroot disease (Plasmodiophora brassicae Woronin) in Brassica rapa L. PLoS ONE 2013, 8, e54745. [Google Scholar] [CrossRef]
  28. Laila, R.; Park, J.I.; Robin, A.H.K.; Natarajan, S.; Vijayakumar, H.; Shirasawa, K.; Isobe, S.; Kim, H.T.; Nou, I.S. Mapping of a novel clubroot resistance QTL using ddRAD-seq in Chinese cabbage (Brassica rapa L.). BMC Plant Biol. 2019, 19, 13. [Google Scholar] [CrossRef]
  29. Karim, M.M.; Dakouri, A.; Zhang, Y.; Chen, Q.; Peng, G.; Strelkov, S.E.; Gossen, B.D.; Yu, F. Two Clubroot-Resistance Genes, Rcr3 and Rcr9(wa), Mapped in Brassica rapa Using Bulk Segregant RNA Sequencing. Int. J. Mol. Sci. 2020, 21, 5033. [Google Scholar] [CrossRef]
  30. Ashraf, M.; Akram, N.A.; Mehboob Ur, R.; Foolad, M.R. Marker-assisted selection in plant breeding for salinity tolerance. Methods Mol. Biol. 2012, 913, 305–333. [Google Scholar] [CrossRef]
  31. Pei, D.; Song, S.; Kang, J.; Zhang, C.; Wang, J.; Dong, T.; Ge, M.; Pervaiz, T.; Zhang, P.; Fang, J. Characterization of Simple Sequence Repeat (SSR) Markers Mined in Whole Grape Genomes. Genes 2023, 14, 663. [Google Scholar] [CrossRef] [PubMed]
  32. Gemmill, C.E.C.; Grierson, E.R.P. Inter-Simple Sequence Repeats (ISSR), Microsatellite-Primed Genomic Profiling Using Universal Primers. Methods Mol. Biol. 2021, 2222, 249–262. [Google Scholar] [CrossRef] [PubMed]
  33. Vishwakarma, M.K.; Kale, S.M.; Sriswathi, M.; Naresh, T.; Shasidhar, Y.; Garg, V.; Pandey, M.K.; Varshney, R.K. Genome-Wide Discovery and Deployment of Insertions and Deletions Markers Provided Greater Insights on Species, Genomes, and Sections Relationships in the Genus Arachis. Front. Plant Sci. 2017, 8, 2064. [Google Scholar] [CrossRef] [PubMed]
  34. Fan, Z.; Robbins, M.D.; Staub, J.E. Population development by phenotypic selection with subsequent marker-assisted selection for line extraction in cucumber (Cucumis sativus L.). Theor. Appl. Genet. 2006, 112, 843–855. [Google Scholar] [CrossRef]
  35. Sureshkumar, S.; Tamilkumar, P.; Senthil, N.; Nagarajan, P.; Thangavelu, A.U.; Raveendran, M.; Vellaikumar, S.; Ganesan, K.N.; Balagopal, R.; Vijayalakshmi, G.; et al. Marker assisted selection of low phytic acid trait in maize (Zea mays L.). Hereditas 2014, 151, 20–27. [Google Scholar] [CrossRef]
  36. Khan, M.A.; Durel, C.E.; Duffy, B.; Drouet, D.; Kellerhals, M.; Gessler, C.; Patocchi, A. Development of molecular markers linked to the ‘Fiesta’ linkage group 7 major QTL for fire blight resistance and their application for marker-assisted selection. Genome 2007, 50, 568–577. [Google Scholar] [CrossRef]
  37. Davierwala, A.P.; Reddy, A.P.; Lagu, M.D.; Ranjekar, P.K.; Gupta, V.S. Marker assisted selection of bacterial blight resistance genes in rice. Biochem. Genet. 2001, 39, 261–278. [Google Scholar] [CrossRef] [PubMed]
  38. Zhan, Z.; Shah, N.; Jia, R.; Li, X.; Zhang, C.; Piao, Z. Transferring of clubroot-resistant locus CRd from Chinese cabbage (Brassica rapa) to canola (Brassica napus) through interspecific hybridization. Breed. Sci. 2022, 72, 189–197. [Google Scholar] [CrossRef]
  39. Li, X.; Wei, Y.; Ma, Y.; Cao, G.; Ma, S.; Zhang, T.; Zhan, Z.; Piao, Z. Marker-Assisted Pyramiding of CRa and CRd Genes to Improve the Clubroot Resistance of Brassica rapa. Genes 2022, 13, 2414. [Google Scholar] [CrossRef]
  40. Kawasaki, M.; Ohara, T.; Ishida, M.; Takahata, Y.; Hatakeyama, K. Development of novel clubroot resistant rapeseed lines (Brassica napus L.) effective against Japanese field isolates by marker assisted selection. Breed. Sci. 2021, 71, 528–537. [Google Scholar] [CrossRef]
  41. Mehraj, H.; Akter, A.; Miyaji, N.; Miyazaki, J.; Shea, D.J.; Fujimoto, R.; Doullah, M.A. Genetics of Clubroot and Fusarium Wilt Disease Resistance in Brassica Vegetables: The Application of Marker Assisted Breeding for Disease Resistance. Plants 2020, 9, 726. [Google Scholar] [CrossRef] [PubMed]
  42. Greer, S.F.; Surendran, A.; Grant, M.; Lillywhite, R. The current status, challenges, and future perspectives for managing diseases of brassicas. Front. Microbiol. 2023, 14, 1209258. [Google Scholar] [CrossRef] [PubMed]
  43. Klueken, A.M.; Mahfoud, Y.; Rößler, S.; Ludwig-Müller, J. Testing Effects of Seed Treatments against Clubroot Disease in Various Oilseed Rape Hybrids. Pathogens 2023, 12, 1339. [Google Scholar] [CrossRef] [PubMed]
  44. Pang, W.; Liang, Y.; Zhan, Z.; Li, X.; Piao, Z. Development of a Sinitic Clubroot Differential Set for the Pathotype Classification of Plasmodiophora brassicae. Front. Plant Sci. 2020, 11, 568771. [Google Scholar] [CrossRef]
  45. Piao, Z.; Lim, R.Y.P. Genetics of Clubroot Resistance in Brassica Species. J. Plant Growth Regul. 2009, 28, 252–264. [Google Scholar] [CrossRef]
  46. Shen, S.; Xu, S.; Wang, M.; Ma, T.; Chen, N.; Wang, J.; Zheng, H.; Yang, L.; Zou, D.; Xin, W.; et al. BSA-Seq for the Identification of Major Genes for EPN in Rice. Int. J. Mol. Sci. 2023, 24, 14838. [Google Scholar] [CrossRef]
  47. Dai, D.; Huang, L.; Zhang, X.; Zhang, S.; Yuan, Y.; Wu, G.; Hou, Y.; Yuan, X.; Chen, X.; Xue, C. Identification of a Branch Number Locus in Soybean Using BSA-Seq and GWAS Approaches. Int. J. Mol. Sci. 2024, 25, 873. [Google Scholar] [CrossRef] [PubMed]
  48. Fu, R.; Zhao, L.; Chen, C.; Wang, J.; Lu, D. Conjunctive Analysis of BSA-Seq and SSR Markers Unveil the Candidate Genes for Resistance to Rice False Smut. Biomolecules 2024, 14, 79. [Google Scholar] [CrossRef]
  49. Liu, H.; Zheng, Z.; Sun, Z.; Qi, F.; Wang, J.; Wang, M.; Dong, W.; Cui, K.; Zhao, M.; Wang, X.; et al. Identification of two major QTLs for pod shell thickness in peanut (Arachis hypogaea L.) using BSA-seq analysis. BMC Genom. 2024, 25, 65. [Google Scholar] [CrossRef]
  50. Zheng, R.; Deng, M.; Lv, D.; Tong, B.; Liu, Y.; Luo, H. Combined BSA-Seq and RNA-Seq Reveal Genes Associated with the Visual Stay-Green of Maize (Zea mays L.). Int. J. Mol. Sci. 2023, 24, 17617. [Google Scholar] [CrossRef]
  51. Hasan, J.; Megha, S.; Rahman, H. Clubroot in Brassica: Recent advances in genomics, breeding, and disease management. Genome 2021, 64, 735–760. [Google Scholar] [CrossRef] [PubMed]
  52. Wang, Y.; Xiang, X.; Huang, F.; Yu, W.; Zhou, X.; Li, B.; Zhang, Y.; Chen, P.; Zhang, C. Fine Mapping of Clubroot Resistance Loci CRA8.1 and Candidate Gene Analysis in Chinese Cabbage (Brassica rapa L.). Front. Plant Sci. 2022, 13, 898108. [Google Scholar] [CrossRef]
  53. Gan, C.; Yan, C.; Pang, W.; Cui, L.; Fu, P.; Yu, X.; Qiu, Z.; Zhu, M.; Piao, Z.; Deng, X. Identification of Novel Locus RsCr6 Related to Clubroot Resistance in Radish (Raphanus sativus L.). Front. Plant Sci. 2022, 13, 866211. [Google Scholar] [CrossRef]
  54. Doyle, J. A rapid DNA isolation procedure for small quantities of fresh leaf tissue. Phytochem. Bull. 1987, 19, 11–15. [Google Scholar]
  55. McKenna, A.; Hanna, M.; Banks, E.; Sivachenko, A.; Cibulskis, K.; Kernytsky, A.; Garimella, K.; Altshuler, D.; Gabriel, S.; Daly, M.; et al. The Genome Analysis Toolkit: A MapReduce framework for analyzing next-generation DNA sequencing data. Genome Res. 2010, 20, 1297–1303. [Google Scholar] [CrossRef]
  56. Wang, K.; Li, M.; Hakonarson, H. ANNOVAR: Functional annotation of genetic variants from high-throughput sequencing data. Nucleic Acids Res. 2010, 38, e164. [Google Scholar] [CrossRef]
  57. Hill, J.T.; Demarest, B.L.; Bisgrove, B.W.; Gorsi, B.; Su, Y.C.; Yost, H.J. MMAPPR: Mutation mapping analysis pipeline for pooled RNA-seq. Genome Res. 2013, 23, 687–697. [Google Scholar] [CrossRef] [PubMed]
  58. Li, Q.; Wan, J.M. SSRHunter: Development of a local searching software for SSR sites. Yi Chuan 2005, 27, 808–810. [Google Scholar]
  59. Ge, Y.; Ramchiary, N.; Wang, T.; Liang, C.; Wang, N.; Wang, Z.; Choi, S.R.; Lim, Y.P.; Piao, Z.Y. Development and linkage mapping of unigene-derived microsatellite markers in Brassica rapa L. Jpn. J. Breed. 2011, 61, 160–167. [Google Scholar] [CrossRef]
  60. Ooijen, J.; Jw, V.T.V. JoinMap 4, Software for the Calculation of Genetic Linkage Maps in Experimental Populations; Kyazma BV: Wageningen, The Netherlands, 2006. [Google Scholar]
  61. Livak, K.J.; Schmittgen, T.D.L. Analysis of relative gene expression data using real-time quantitative PCR and the 2-DDCt method. Methods 2001, 25, 402–408. [Google Scholar] [CrossRef]
Figure 1. Phenotype of two parental Chinese cabbage lines and the F1 offspring after inoculation with “KEL-23” isolate. (a) Resistance parent “377” (P1). (b) Susceptible parent “12A” (P2). (c) The F1 offspring individuals.
Ijms 25 10462 g001
Figure 2. Distribution of SNPs and InDels.
Ijms 25 10462 g002
Figure 3. The Euclidean distance calculations of SNPs between the R- and S-pool samples. The horizontal axis indicates the physical distances across each chromosome, and the vertical axis represents the fit values of the ED values raised to the fourth power. The solid blue line corresponds to the actual fitting curve of the SNPs, while the dashed black line denotes the threshold line.
Ijms 25 10462 g003
Figure 4. Preliminary mapping of the BraPb8.3 gene locus. (a) Genetic mapping and Logarithm of Odds (LODs) threshold analysis for BraPb8.3 gene locus. (b) Preliminary mapping of the BraPb8.3 gene, including analysis of recombinant genotypes. Marker genotypes ‘377’ and ‘12A’ are represented in black and white, respectively, with heterozygous genotypes depicted in gray. Phenotypic classifications are indicated by ‘R’ for resistance and ‘S’ for susceptibility. The Arabic numerals beneath the figure indicate the count of recombinants.
Ijms 25 10462 g004
Figure 5. Genotypic and phenotypic analysis of 96 recombinants from the fine mapping study. Genotypes for markers ‘377’ and ‘12A’ are depicted in black and white, respectively, with heterozygous genotypes indicated in gray. Phenotypic classifications are denoted by ‘R’ for resistance, ‘S’ for susceptibility, and ‘S&R’ for families displaying mixed phenotypes of both resistance and susceptibility. The Arabic numerals beneath the figure indicate the count of recombinants.
Ijms 25 10462 g005
Figure 6. Relative expression levels of Bra020861 and Bra020876 genes in the roots of Chinese cabbage following inoculation with P. brassicae. The horizontal axis represents days after inoculation (DAI), with “ND” signifying that the gene expression was below the detection threshold. ** p < 0.01.
Ijms 25 10462 g006
Table 1. Genetic analysis of clubroot resistance in the 377, 12A, F1, and F2 populations.
Resistant PlantSusceptible PlantTheoretical Ratioχ2χ20.05
377360
12A036
F1280
F23571133:10.183.84
Table 2. Quality control of sequencing data.
SampleR-PoolS-Pool
Genome Length351,063,200351,063,200
Clean Reads72,065,69467,798,184
Clean Bases10,553,867,0529,861,094,696
Mapped Bases10,004,832,1289,374,230,064
Mapping Rate (%)94.8095.06
Duplication Rate (%)17.4117.60
Uniq Rate (%)67.0067.46
Mean Depth28.4526.65
Coverage Rate (%) (>=4X)94.8894.97
Genome Length351,063,200351,063,200
Table 3. Characteristics of 22 predicted genes between molecular markers “srt8-65” and “srt8-25”.
GeneHomologous GenesFunctional Annotations
Bra020856AT4G22140Encoding a chromatin remodeling factor that regulates flowering time
Bra020857AT4G22120Calcium-permeable stretch-activated cation channel
Bra020858AT4G22100Beta glucosidase 2
Bra020859AT4G22080Root hair specific 14
Bra020860AT4G22060F-box protein
Bra020861AT3G25510Disease resistance protein (TIR-NBS-LRR class) family protein
Bra020862AT4G21910MATE efflux family protein
Bra020863AT4G21910MATE efflux family protein
Bra020864AT4G21895DNA binding protein
Bra020865AT4G21870HSP20-like chaperone
Bra020866AT4G21865Hypothetical protein
Bra020867AT4G32270Unknown
Bra020868AT4G21850Methionine sulfoxide reductase B9
Bra020869AT3G18550Unknown
Bra020870AT4G21810DERLIN-2.1
Bra020871AT4G21800Conserved hypothetical ATP binding protein
Bra020872AT4G21750Encodes a homeobox protein similar to GL2
Bra020873AT4G21710Encodes the unique second-largest subunit of DNA-dependent RNA polymerase II
Bra020874AT4G21710Encodes the unique second-largest subunit of DNA-dependent RNA polymerase II
Bra020875AT4G20930Encodes a 3-hydroxyisobutyrate dehydrogenase
Bra020876AT4G20940Leucine-rich repeat N-terminal domain
Bra020877AT4G20960Cytidine and deoxycytidylate deaminase zinc-binding region
Disclaimer/Publisher’s Note: The statements, opinions and data contained in all publications are solely those of the individual author(s) and contributor(s) and not of MDPI and/or the editor(s). MDPI and/or the editor(s) disclaim responsibility for any injury to people or property resulting from any ideas, methods, instructions or products referred to in the content.

