Article

Codon Bias of the DDR1 Gene and Transcription Factor EHF in Multiple Species

College of Animal Science and Technology, Anhui Agricultural University, Hefei 230036, China
*
Authors to whom correspondence should be addressed.
These authors contributed equally to this work.
Int. J. Mol. Sci. 2024, 25(19), 10696; https://doi.org/10.3390/ijms251910696
Submission received: 31 August 2024 / Revised: 28 September 2024 / Accepted: 1 October 2024 / Published: 4 October 2024
(This article belongs to the Section Molecular Biology)

Abstract

:
Milk production is an essential economic trait in cattle, and understanding the genetic regulation of this trait can enhance breeding strategies. The discoidin domain receptor 1 (DDR1) gene has been identified as a key candidate gene that influences milk production, and ETS homologous factor (EHF) is recognized as a critical transcription factor that regulates DDR1 expression. Codon usage bias, which affects gene expression and protein function, has not been fully explored in cattle. This study aims to examine the codon usage bias of DDR1 and EHF transcription factors to understand their roles in dairy production traits. Data from 24 species revealed that both DDR1 and EHF predominantly used G/C-ending codons, with the GC3 content averaging 75.49% for DDR1 and 61.72% for EHF. Synonymous codon usage analysis identified high-frequency codons for both DDR1 and EHF, with 17 codons common to both genes. Correlation analysis indicated a negative relationship between the effective number of codons and codon adaptation index for both DDR1 and EHF. Phylogenetic and clustering analyses revealed similar codon usage patterns among closely related species. These findings suggest that EHF plays a crucial role in regulating DDR1 expression, offering new insights into genetically regulating milk production in cattle.

1. Introduction

Milk production is regulated by various genes and factors. Our previous ATAC-seq and RNA-seq analyses of mammary gland tissues at different lactation stages in cows revealed that the discoidin domain receptor 1 (DDR1) gene is a promising candidate gene that influences dairy production traits. Furthermore, the ETS homologous factor (EHF) transcription factor (TF) was predicted to regulate the expression of DDR1 based on the animal transcription factor database (TFDB) 4.0. Moreover, DDR1 has been shown to play a pivotal role in various dairy production traits [1,2,3,4]. The DDR1 gene is a member of the receptor tyrosine kinase family (PTK), and its ligand is collagen [5,6]. Recent studies have indicated that aberrant activation of the DDR1 gene is a key factor in the initiation and progression of tumors [7,8]. Further investigation into DDR1 revealed a connection with the breast. Initial studies in mice have demonstrated that the mRNA level of DDR1 increases during pregnancy [2]. Subsequent studies employing mice, in which the DDR1 gene had been ablated, have indicated that DDR1 regulates the proliferation of mammary epithelial cells within the mammary glands [9]. These findings suggest that DDR1 plays a pivotal role in mediating the extracellular matrix in the mammary gland. Subsequently, research conducted on mouse HC11 mammary epithelial cells has indicated that lactation might be caused by the prolactin pathway and the DDR1 gene working with the extracellular matrix pathway. This has been demonstrated by the overexpression of collagen and the DDR1 gene, both of which activate Stat5 and increase β-casein [3].
An analysis of common expression networks and miRNA pathways that affect milk yield in dairy cows has identified DDR1 and DDHX1 as key genes in the miRNA regulatory network that regulates milk yield [1]. Furthermore, the DDR1 gene and ErbB2/ErbB3 proteins have been shown to regulate the expression in mammary epithelial cells through a regulatory pathway [10]. Given this evidence, it can be reasonably concluded that the DDR1 gene controls the growth and metabolism of mammary epithelial cells, as well as the development of mammary glands in mammals, by regulating downstream primers, such as the extracellular matrix, Stat5, ErbB2/ErbB3, and other factors. TFs are proteins that possess DNA-binding domains (DBDs) that enable them to recognize specific DNA sequences and, subsequently, control the expression of genes in all organisms [11]. Therefore, it has been postulated that DDR1 regulates lactating cells in dairy cows, a phenomenon which affects the development of the mammary gland, milk synthesis and secretion, and the growth and metabolism of mammary epithelial cells [1,9,12]. In addition, this study provides a theoretical foundation for enhancing milk quality and increasing milk production. TF plays pivotal roles in the regulation of gene expression, driving species evolution, influencing animal genetics, and affecting diseases. Moreover, the evolution of gene regulation and species diversity is facilitated by TF regulatory networks and target prediction [13,14,15,16,17]. Based on an analysis of the available literature and data provided by the Animal TFDB 4.0, we have identified TFs that are potentially involved in the regulation of DDR1. The results have revealed that EHF may play a role in lactation. EHF, also known as epithelial-specific ESE-3, is a notable member of the ETS superfamily, which comprises the ESE subfamily [18]. Research indicates that the level of EHF activity varies depending on the specific type of cancer. For example, some malignancies benefit from TFs, such as gastric and ovarian cancers [19,20], whereas oral and colon cancers [21,22] use TFs to limit tumor growth. EHF affects breast epithelial cells and plays a significant role in the development of breast cancer [23]. A notable increase in EHF has been observed by using qPCR in a mouse model of transplanted breast cancer [24]. Further research has indicated that the EHF TF expression is significantly higher in breast cancer cells than in normal epithelial cells [25]. The present hypothesis posits that the EHF TF influences the development of the mammary gland and, subsequently, milk productivity. This hypothesis is based on an analysis of existing research on these factors.
Transcription is the process by which genetic information is transferred from DNA to mRNA, with codons formed at intervals of three nucleotides. Except for five special codons, the remaining 18 amino acids are encoded by multiple synonymous codons, a phenomenon known as codon parsimony [26,27]. Codon usage bias (CUB) refers to the unequal utilization of synonymous codons encoding distinct amino acids, and it shows that certain codons are employed at a higher frequency than others [28,29,30]. The evolution of the genome has been influenced by CUB, which can be attributed to a combination of genetic mutations, natural selection, and genetic drift [31,32,33]. The following factors influence CUB: CG heterogeneity [34], tRNA abundance [35], gene length [36], mRNA secondary structure [37], protein hydrophobicity [38], and amino acid conservation. Understanding codons has also facilitated the gradual evolution of relevant codon preference research methods. The current method of analyzing codon characteristics employs the following parameters: codon adaptation index (CAI) [39], effective number of codons (ENC) [40], frequency of optimal codons (FOC) [41], and GC3. Moreover, principal component analysis (PCA) and cluster analysis have recently garnered significant attention in the field of codon preference analysis [42]. Given the contributions of diverse approaches and viewpoints to the establishment of codon preference analysis methods, it is essential to recognize these distinctions and their respective foci when analyzing methods and conducting joint studies. Studies on codon preference have enabled the acquisition of detailed information regarding gene sequences that may be employed to make well-informed decisions regarding species selection and improvement; moreover, such data may exert a considerable influence on the evolution of genomes [43]. Codon bias research facilitates the analysis of several important areas within the field of biological evolution and phylogeny, including the molecular evolution of genes, horizontal gene transfer between species, protein-coding regions, and DNA translation. In addition, it may influence the regulation of genes over time and cycles, the structure and function of proteins, and the expression of high-level genes [28]. Increased expression of recombinant or insect-resistant proteins in plants has been achieved by codon preference. Bollworm resistance in transgenic crops is caused by the significant expression and synthesis of Bt proteins in cotton via codon preference [44]. Codon bias represents a viable approach for bioremediation, as evidenced by its capacity to enhance P450 protein synthesis in monocotyledons through heterologous systems [45]. Moreover, gene expression and protein shape of Pichia pastoris in a yeast expression system has been regulated through the use of codon bias [46]. The study of codon preference facilitates the extraction of distinctive data regarding gene sequences, which may exert a significant influence on genome evolution and serve as a theoretical foundation for species improvement and selection [43].
This study analyzes the CUB of the DDR1 gene and the corresponding CDS region of the EHF TF across 24 species and explores the correlations and phylogenetic relationships between the CUB of DDR1 and EHF TF. This research offers new insights into the codon and phylogenetic relationship between the EHF TF and DDR1 and may provide a novel theoretical basis for enhancing milk production performance in cattle.

2. Results

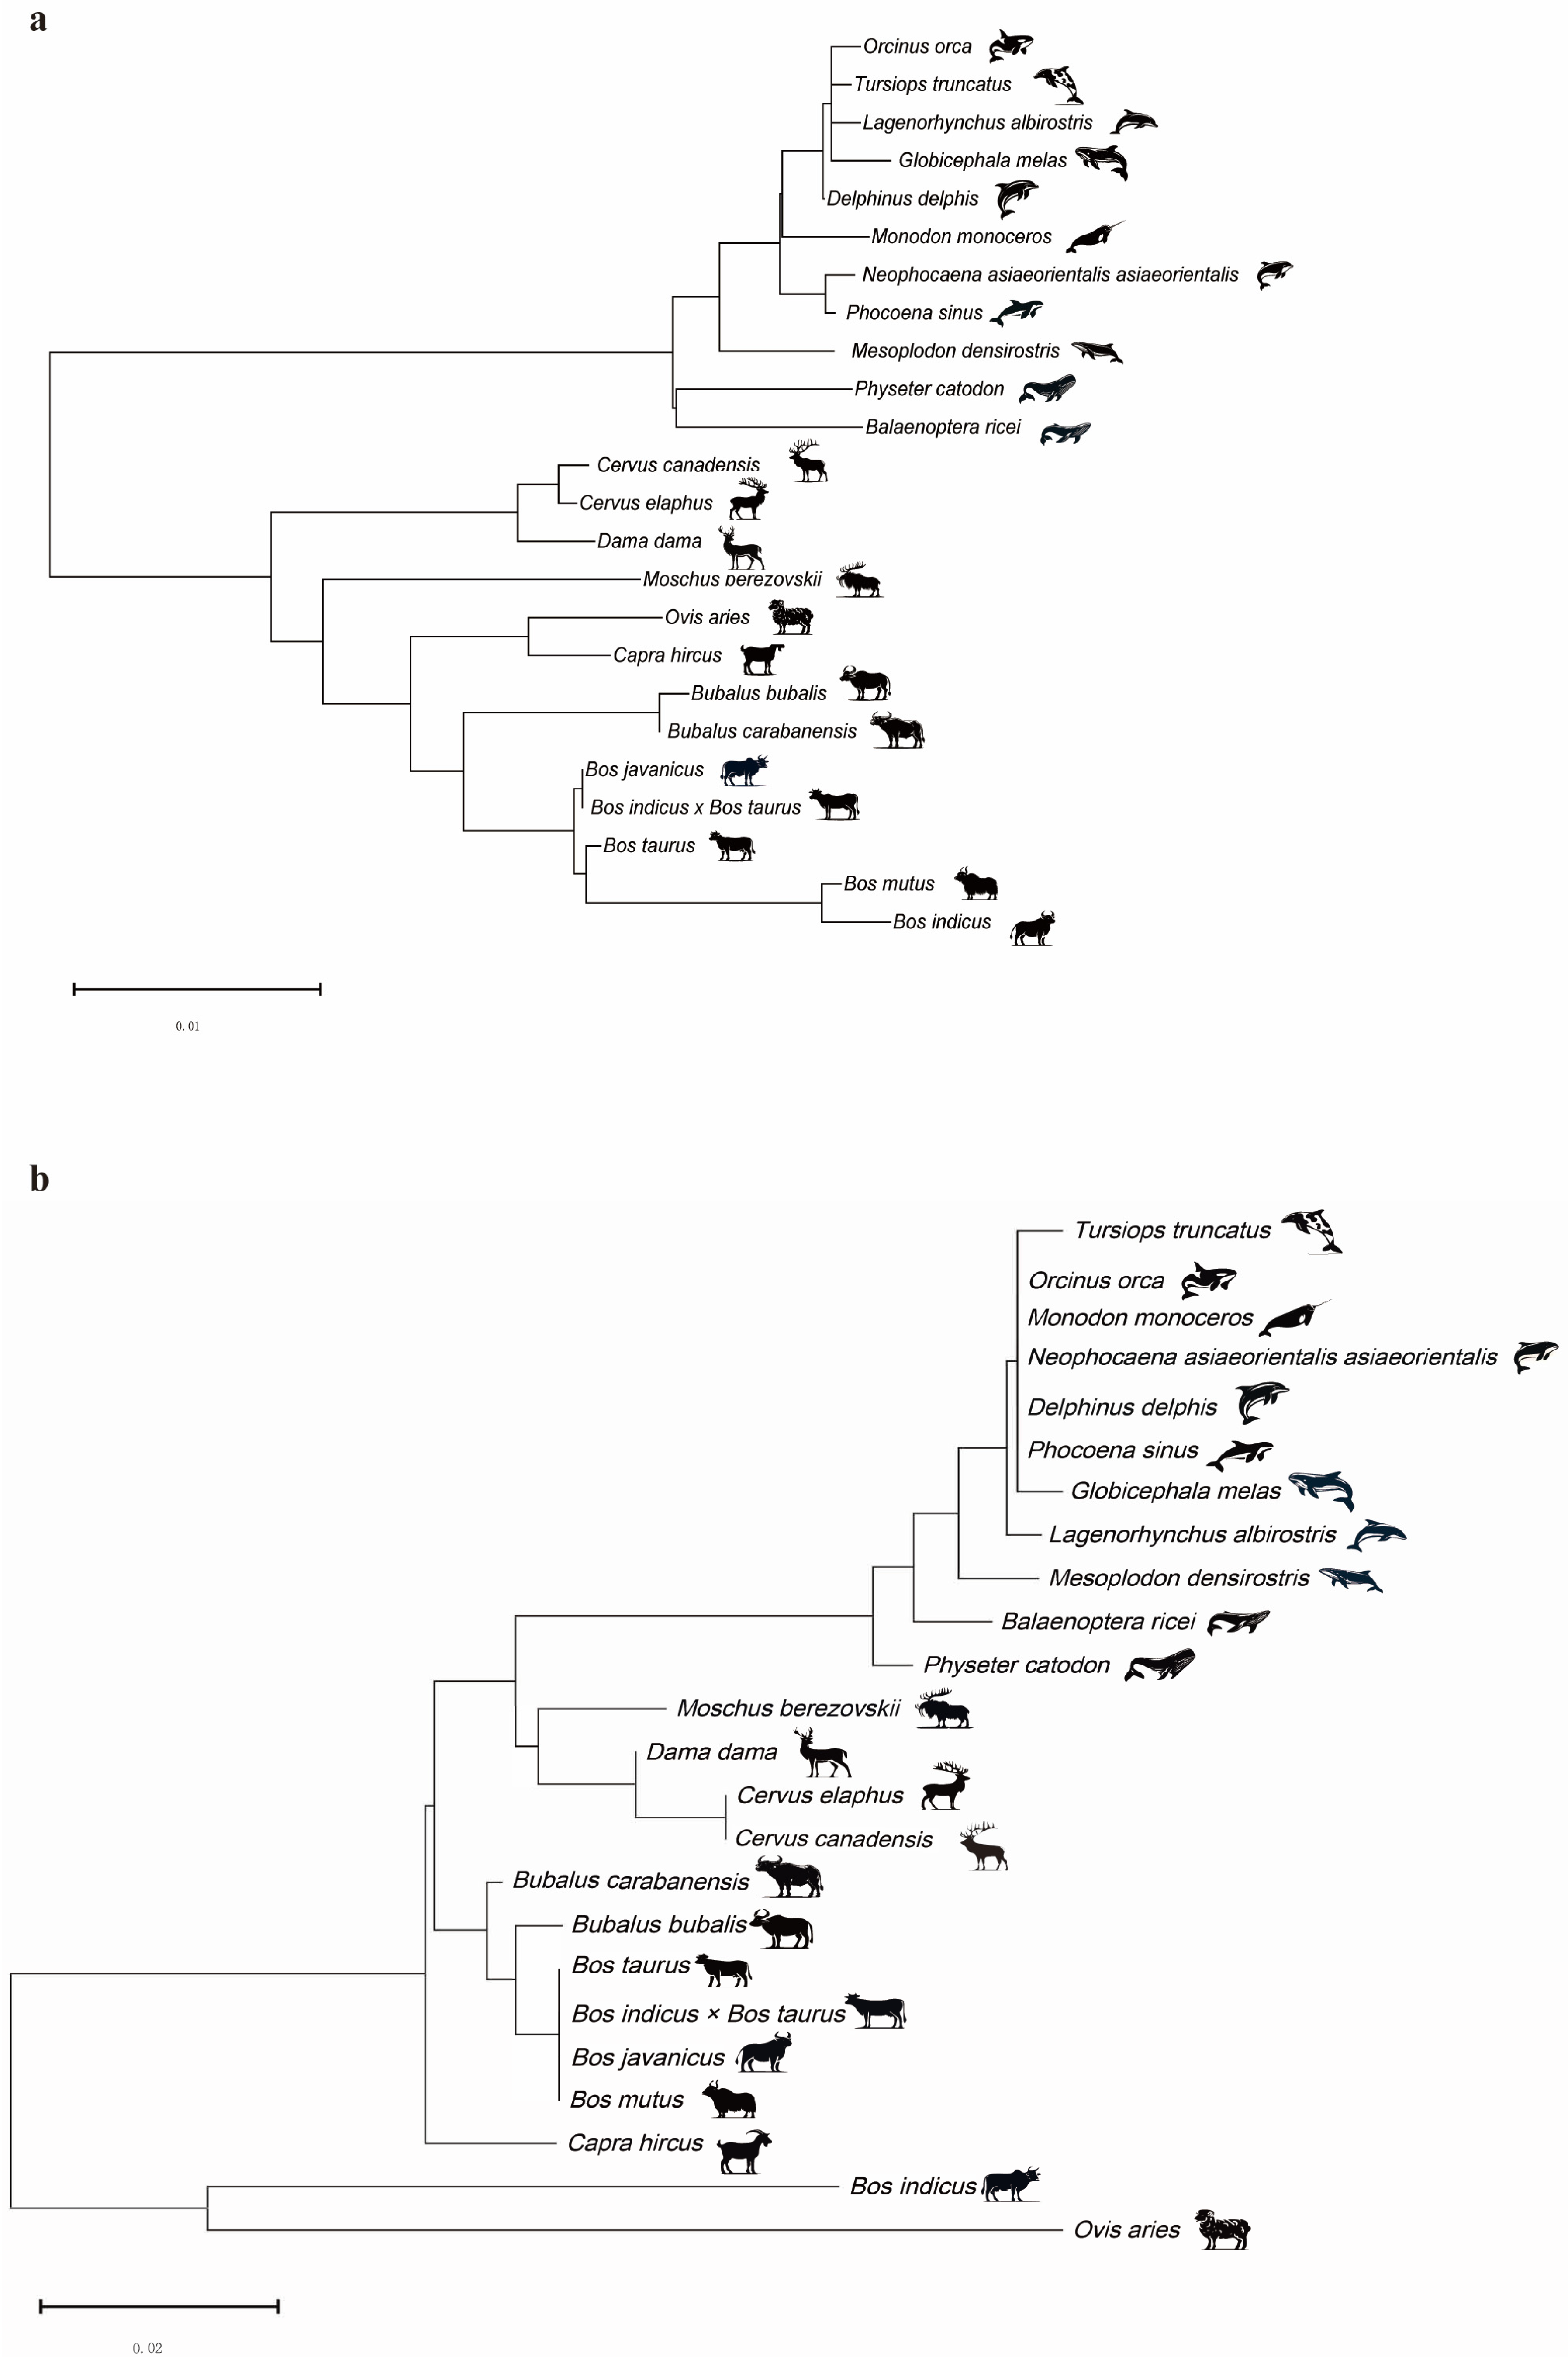
2.1. Construction of DDR1 Gene and EHF Phylogenetic Trees

To examine similarities in species relatedness, phylogenetic trees were constructed for both DDR1 and EHF. The phylogenetic tree for DDR1 (Figure 1a) revealed that aquatic and terrestrial animals were clustered together. The phylogenetic tree for EHF (Figure 1b) yielded comparable results, with the species in the same branch displaying a broader range of relatedness. In addition, there was evidence of close kinship among species, as the DDR1 gene node and TFs of EHF were found to be shared by Tursiops truncatus, Orcinus orca, Globicephala melas, Bos indicus × Bos taurus cross, and Bos javanicus. Moreover, Bos taurus, Bos mutus, Physeter catodon, and Balaenoptera ricei were projected to connect to a higher-level node on one side and share a node with each other, thereby demonstrating comparable affinities. These findings suggest that DDR1 and EHF are comparable in their capacity to predict species affinities.

2.2. Codon Usage Patterns for the DDR1 Gene and EHF

To investigate CUB and adaptations in the coding sequences (CDS) of EHF and DDR1, we calculated 14 contributor correlation indices using CodonW 1.4.4 [47]. The usage frequencies of C3s and G3s in DDR1 were higher than those of A3s and T3s, with a mean of 75.49% for GC3s which is significantly greater than the random distribution of 50% (Table 1). Similarly, in EHF, the frequencies of C3s and G3s also surpassed those of A3s and T3s, with a mean of 61.72% for GC3s which is also above the random distribution (Table 2). A comparison of the main contributor values for DDR1 and EHF indicated a preference for G/C in both, although codons ending in G/C were favored in DDR1. ENC and CAI, as important metrics for codon analysis, showed similar preferences in DDR1 and EHF (Table S1). These results suggest that codons exhibit comparable preferences in DDR1 and EHF, with DDR1 showing a stronger inclination toward G/C endings.

2.3. Relative Synonymous Codon Usage (RSCU) Values Analysis and Determination of Putative Optimal Codons for DDR1 and EHF across 24 Species

To gain insights into CUB and optimal codons of DDR1 and EHF, we conducted statistical analyses. The results demonstrate the presence of 23 codons with a RSCU value greater than 1 in DDR1 (Table 3). The codons identified were UUC, CUC, CUG, AUC, GUG, UCC, CCC, ACC, GCC, UAC, CAC, CAG, AAC, AAG, GAC, GAG, UGC, CGC, CGG, AGC, AGG, GGC, and GGG. All 23 codons terminated in G/C. In contrast, 24 codons with RSCU values greater than 1 were identified in EHF: UUC, CUC, CUG, AUC, GUC, GUA, GUG, UCC, CCU, ACC, GCC, UAC, CAC, CAG, AAC, AAA, GAC, GAA, UGC, CGA, CGG, AGC, AGA, and GGG (Table 4). Among the codons of DDR1 and EHF, six codons ended with A/U, whereas the remaining 18 codons predominantly ended with G/C. This further reinforces the observed preference for G/C-ending codons for both DDR1 and EHF TFs. Analysis of the DDR1 and EHF codons revealed that 27 low-frequency codons (RSCU < 1) and 17 high-frequency codons (RSCU > 1) were shared between the two (see Figures S1 and S2).
The optimal codon was identified as AGG, which exhibited ΔRSCU ≥ 0.08, high > 1, and low < 1 based on the RSCU values of the DDR1 gene across 24 species (Table S2). The optimal codons for EHF were CCC, UAC, and GGA (ΔRSCU ≥ 0.08, high > 1, and low < 1) (Table S3).

2.4. Hierarchical Clustering Analysis of RSCU for DDR1 and EHF

Hierarchical clustering analysis of the RSCU values of DDR1 and EHF (Figure 2a,b) revealed that aquatic and terrestrial animals were grouped separately, an output which aligns with the findings from the phylogenetic tree. Furthermore, species that demonstrated close affinities for both the DDR1 gene and EHF TFs, such as Bos javanicus and Bos mutus, also exhibited a similar pattern in the hierarchical clustering analysis. Moreover, the results of the hierarchical cluster analysis were in accordance with the predicted affinities indicated by the phylogenetic trees, as exemplified by Tursiops truncatus, Orcinus orca, and Lagenorhynchus albirostris. These findings suggest that the CDS of the DDR1 gene and EHF TF, along with their associated codons, display similarities in species affinities. Furthermore, identical codon RSCUs were identified in the CDS sequences of DDR1 and EHF in the species with comparable affinities.

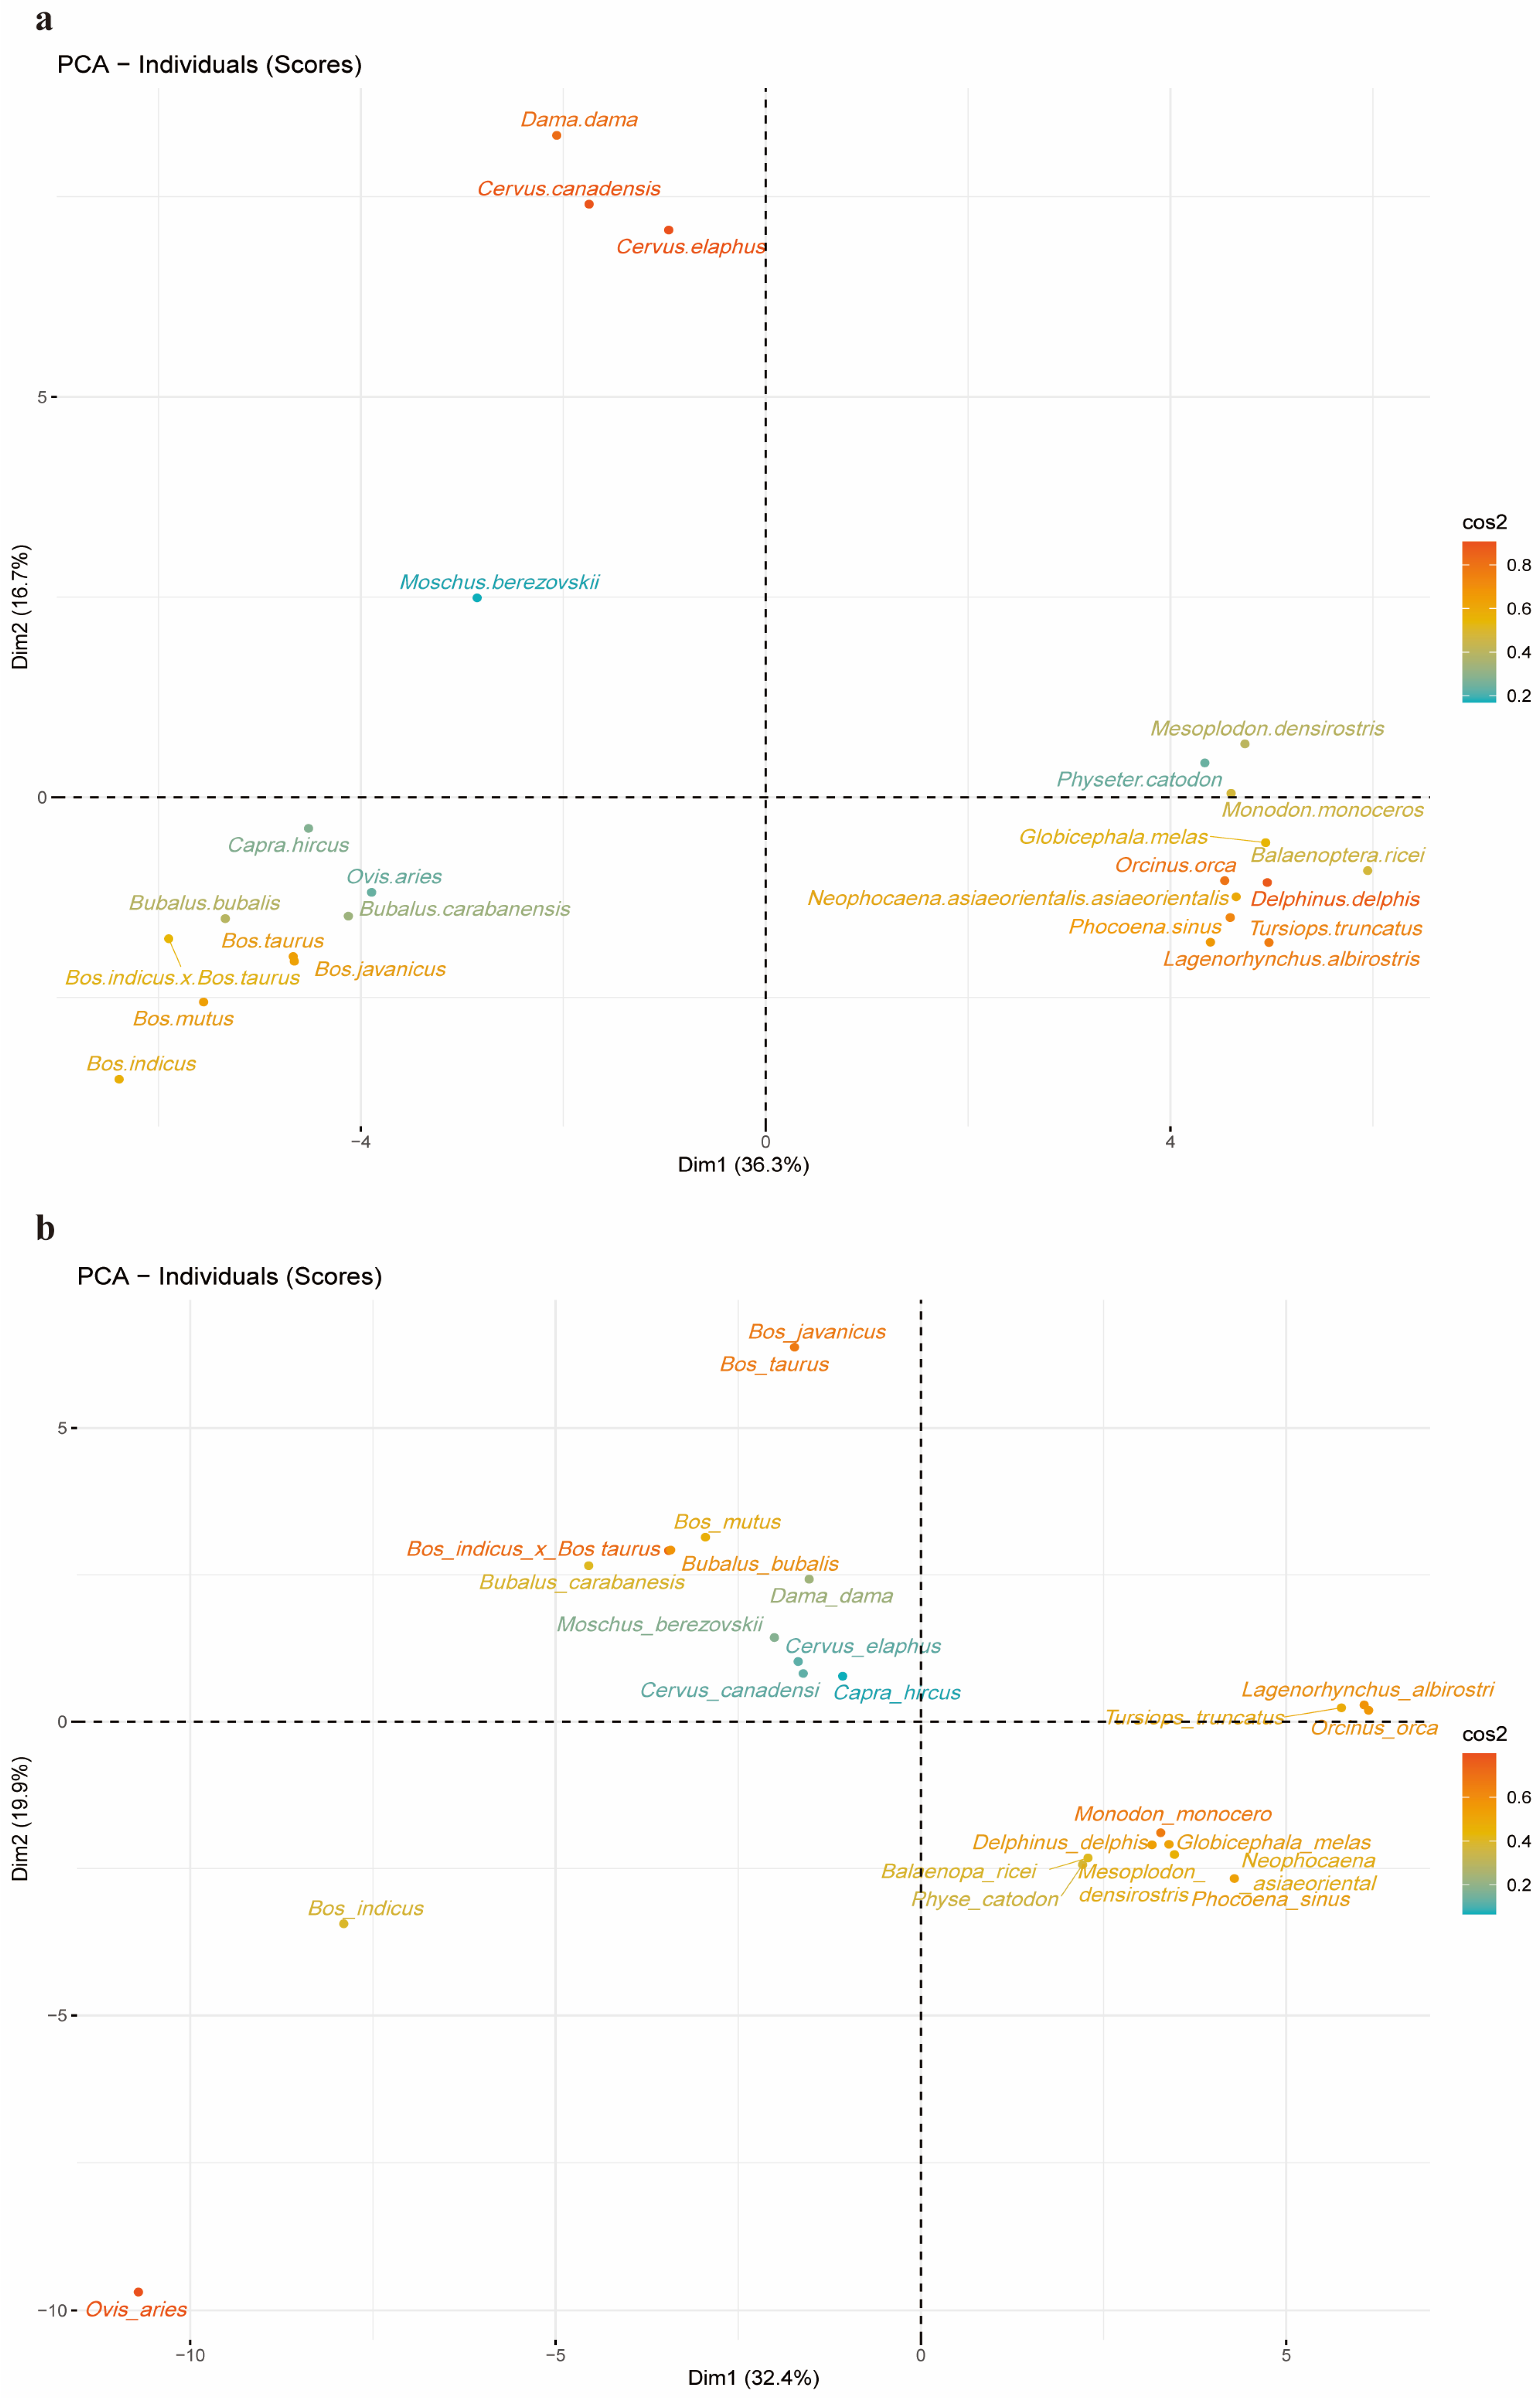
2.5. PCA Analysis of 24 Species and Codons Separately Using RSCU Values

To further investigate codon preference and species affinity, we performed a PCA for downclustering. Regarding the DDR1 gene, the species Ovis aries, Capra hircus, Bubalus bubalis, Bubalus carabanensis, Bos javanicus, Bos indicus × Bos taurus, Bos taurus, Bos mutus, and Bos indicus formed a cluster (Figure 3a). In contrast, Bos javanicus and Bos taurus constituted a separate cluster and exhibited a closer relationship with the EHF TF (Figure 3b). Moschus berezovskii, Dama dama, Cervus elaphus, Cervus canadensis, Bubalus carabanensis, Bubalus bubalis, Bos indicus × Bos taurus, Bos mutus, and Capra hircus formed a cluster, although the related species Bubalus carabanensis, Bubalus bubalis, and Bos mutus exhibited similar affinities. Although dimensionality reduction revealed that certain codons contributed more to DDR1 than others, the codons GUG, UGU, GUA, UUG, AGG, UGC, and CUA contributed more to DDR1. In contrast, codons ACG, AUA, CGC, UCG, ACA, GUU, CCU, AUC, and AUU contributed the most to the EHF TF (Figure S2). The results demonstrated consistency in the predicted phylogenetic relationships and CUB between Bos javanicus and Bos taurus, as well as among Bubalus bubalis, Bubalus carabanensis, and Bos mutus for the DDR1 and EHF TFs. This finding provides further evidence to support the hypothesis that CUB is associated with phylogenetic relationships between species.

2.6. Correlation Analysis of Codon Usage Preference between DDR1 Gene and EHF

To investigate the factors that influence codon preference in DRR1 and EHF, we conducted correlation analyses to examine the relationship between the 14 major contribution indices and their respective codons. Significant correlations were identified between the indices of ENC, CAI, and GC3s among the DDR1 genes and EHF. The correlation coefficients between ENC and CAI were all significantly negative (DDR1: r = −0.52, p < 0.01; EHF: r = −0.46, p < 0.05) (Figure S3). This suggests that the codon usage of DDR1 and EHF may have been influenced by gene selection and regulation, indicating that codon optimization may have been employed during evolution to enhance translation efficiency and gene expression levels. Furthermore, significant negative correlations were observed between the GC3s and ENC correlation coefficients (DDR1 gene: r = −0.45, p < 0.05; EHF: r = −0.52, p < 0.01) (Figure 4a,b). It is plausible that a gene’s favored codon may have been influenced by the presence of GC3s, which optimized codon usage patterns during evolution to enhance gene expression and translation efficiency. This indicated a potential correlation between the GC content at the third position of the codon and the observed pattern of codon usage.

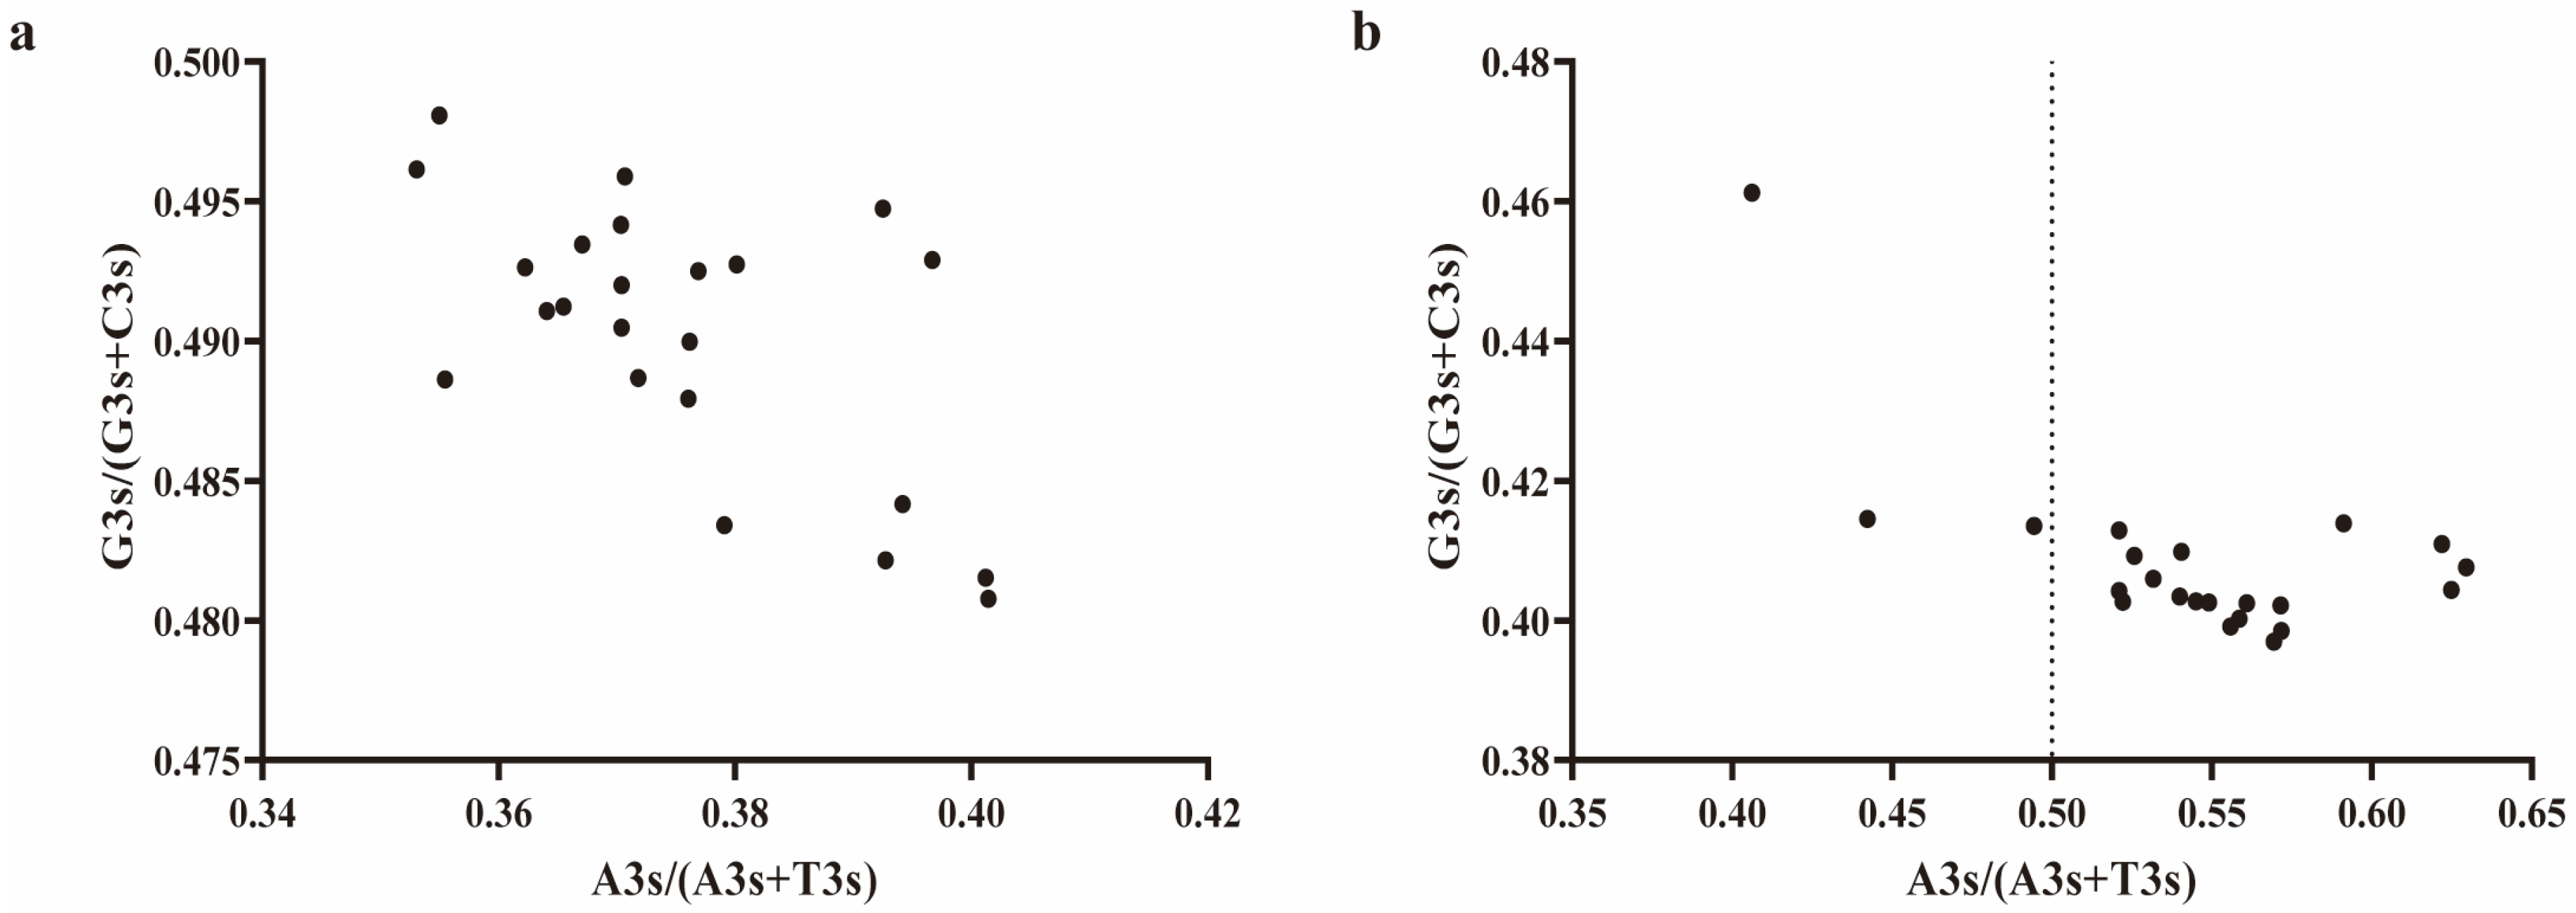
2.7. Analysis of DDR1 Gene and EHF Third Codon Bias

To investigate codon usage patterns, selective pressures, and biological evolution, as well as gaining a deeper understanding of their functions and regulatory mechanisms, we conducted CDS codon parity rule 2 (PR2) analysis of the DDR1 and EHF TFs. The values of [A3/(A3 + U3)] and [G3/(G3 + C3)] in the DDR1 CDS codon were both lower than 0.5 (Figure 5a). In the case of EHF, the value of [A3/(A3 + U3)] was greater than 0.5, whereas the value of [G3/(G3 + C3)] was lower than 0.5 (Figure 5b). These findings suggest that a multitude of factors, including evolutionary pressures and selective forces, contribute to the overall complexity of codon usage patterns observed in the DDR1 gene and EHF.

2.8. Multidimensional Clustering Analysis of CAI for DDR1–EHF Based on K-Means

To further examine the genetic correlation between the DDR1 and EHF codons, CAI was employed as a codon bias to assess the genes. Following CAI normalization of DDR1 and EHF, the results demonstrated that Bubalus bubalis, Bos taurus, Bos indicus × Bos taurus, Bos javanicus, Bos mutus, Dama dama, Capra hircus, Moschus berezovskii, and Bos indicus formed one of three clusters (Figure 6). Bovine animals exhibited a closer genetic relationship, with Bos taurus displaying a closer affinity to Bos javanicus than to other species within the same group. The codon sequences of the DDR1 gene and EHF TF exhibited notable similarities regarding species genetic linkages, as revealed through multidimensional prediction.

3. Discussion

Codon preference selection directly influences gene expression, and the use of optimal codons can significantly enhance translation efficiency and accuracy [48]. Therefore, changes in the GC content ratio affect the selection of codons and amino acids. Studies in mammals have shown that genes with a higher GC content often exhibit higher expression levels [49]. Additionally, TFs influence codon usage patterns, and significant correlations have been observed between the GC3 content and selected encoded amino acids [50,51]. This study analyzed the CDS sequences of DDR1 and its predicted EHF TF in 24 randomly selected species, and the results show that the RSCU exhibited a preference for G/C-ending codons. Although the GC3 value of the EHF TF was lower than that of the DDR1 gene, both still showed a preference for C and G at the third codon position. The study also revealed that the human genome exhibits a preference for G/C-ending codons [52]. For instance, Daphnia and Drosophila melanogaster have been shown to exhibit a preference for G/C, while Plasmodium falciparum has been found to exhibit a preference for A/T [53,54]. Although different species exhibit varying codon preferences for the same gene [55], the expression levels of DDR1 and EHF TFs may still be correlated with the GC content in the 24 randomly selected mammalian species.
During biological evolution, CUB has been primarily influenced by the combined effects of mutation and selection pressure [56]. The impact of translational selection and mutational pressure on CUB is often illustrated through the correlation between ENC and CAI values [57,58,59]. If the correlation (r) between translational selection and mutation approaches equals −1, it indicates that translational selection exerts more influence than mutations. Conversely, if r is close to 0, it indicates no correlation, implying that mutations might have a greater impact than translational selection [60]. The ENC-GC3s plot is typically used to determine CUB [61]. We conducted a correlation analysis of codon usage in the CDS regions of DDR1 and EHF, and the results indicate that codon usage is more influenced by gene selection and regulation. Furthermore, the data suggest that the preference for codons is influenced by the combined action of mutational pressure and selection forces. The optimal codons for DDR1 and EHF were AGG, CCC, and GGA. The negative correlation between CG3 and ENC, approaching r = −0.5 (DDR1 gene: r = −0.52; EHF: r = −0.46), indicated the joint action of selection and mutation pressures, which is consistent with the reduced number of optimal codons. In mammals, mutational pressures or selection forces are believed to significantly affect CUB [62,63]. The differences in the results between DDR1 and EHF may suggest that both have maintained a high degree of conservation.
Numerous studies have demonstrated the link between codon usage and species phylogenetic relationships [64,65]. Previous research has also shown that both genes and TFs exhibit codon preferences [43,66]. This study jointly analyzed the codon bias of the DDR1 gene and predicted the codon preferences of the EHF TF. Through phylogenetic tree analysis, hierarchical clustering, PCA, and k-means clustering, it was revealed that the codon usage frequency in DDR1 and EHF was similar among species with close phylogenetic relationships. This was further confirmed in the k-means clustering analysis after CAI homogenization of DDR1 and EHF, where Bos javanicus and Bos taurus exhibited a closer phylogenetic relationship. Additionally, aside from the 0.001 and 0.18 CAI and ENC differences in DDR1, respectively, both DDR1 and EHF showed significant similarities in codon parameter values. This indicates a significant correlation between species phylogeny and the codon preferences of the DDR1 gene and EHF TF, potentially providing a new perspective for evolutionary analysis of species relationships.
Previous studies have shown that genes use codons to encode amino acid sequences, thereby defining the translation rules from nucleic acids to proteins [67,68,69]. TFs bind to specific DNA sequences to regulate transcription, linking gene regulation with signal transduction [70,71]. Codon optimization is a valuable method for precisely regulating gene expression [27]. Given that dairy production is an important economic trait in global livestock farming, examining the CUB of DDR1 and EHF TFs can influence the expression of codons related to dairy production genes through gene editing techniques. This approach could enhance the roles of DDR1 and EHF in dairy production and lead to improvements in breeding strategies. Research on CUB plays a crucial role in regulating gene expression and protein function; however, this field has not been fully explored with respect to cattle. Therefore, this study is the first to reveal significant characteristics of codon usage in DDR1 and EHF, thus providing new research directions and enabling further investigation of codon preferences, ultimately helping increase the protein yield of genes and TFs [72,73]. Preliminary studies on codons in lactation-related genes and transcription factors offer a new theoretical pathway for improving milk production in cattle. Additionally, these studies elucidate the roles of codons in TFs, genes, and species phylogeny, broadening the prospects for cross-species comparative analyses, with potential applications in the genetic improvement of other economically important species. Future research could explore how adjusting codon usage patterns in key genes may enhance production performance and biological adaptability, thereby delivering greater economic benefits to livestock farming.

4. Materials and Methods

4.1. DDR1 Gene Data and EHF TF Data Collection

Aquatic and terrestrial animals were randomly selected to represent a specific number of species in each genus. This was done to increase the accuracy of the results and minimize the deliberate nature of the screening process. Twenty-four species carrying DDR1 were randomly selected for screening. For further details, refer to Table S4. The CDS format of the DDR1 gene for all species was obtained from the National Center for Biotechnology Information (NCBI) GenBank database (http://www.ncbi.nlm.nih.gov/, accessed on 15 January 2024).
The Animal TFDB 4.0 (https://guolab.wchscu.cn/AnimalTFDB4/, accessed on 15 January 2024) was used to annotate and predict the animal TFs [11]. The database then predicted the corresponding TFs based on the DDR1 promoter sequences, resulting in the highest ranked TF, EHF. Upon completion of the aforementioned steps, the FASTA format containing the corresponding EHF for the 24 species was obtained from the NCBI GenBank.

4.2. Phylogenetic Trees and Hierarchical Cluster Analysis

The CodonW 1.4.4 software (CodonCode Corporation, Boston, MA, USA) was employed to analyze the DDR1 gene and EHF CDS sequences and compute several metrics pertaining to CUB. The T3s, C3s, A3s, G3s, CAI, CBI, Fop, ENC, GC3s, GC, L_sym, L_aa, Gravy, and Aromo values were individually tabulated and summarized in Excel. A phylogenetic tree was constructed for the DDR1 gene and EHF TF using the default elaboration of MEGA 7.0.12 (MEGA Limited, Dhaka, Bangladesh) and bootstrap values of 1000 replicates using the neighbor-joining (NJ) method. NJ is a distance-based method used to construct evolutionary trees from a pairwise evolutionary distance matrix of the given sequences, and it was applied to investigate the relationships between genes and species [74]. Furthermore, Chiplot (https://www.chiplot.online/, accessed on 16 January 2024) was used to generate correlation indicator plots and hierarchical cluster analyses for the 24 species, using codon and RSCU values, respectively.

4.3. Parametric Statistical Methods for Codons

In accordance with the findings from CodonW, the RSCU and FOC tables for the DDR1 gene and EHF were constructed in Excel. The RSCU table, which represents the ratio of the observed frequency of a specific synonymous codon to its expected frequency under the assumption of random usage, was used to identify alterations in the usage patterns of all synonymous codons across the gene. A codon was considered used with a relatively high frequency if its RSCU value exceeded one. Codon correlation analysis is a common method for measuring preference [67]. The relative codon usage frequency intersection was determined using the online program Venny 2.1.0 (https://bioinfogp.cnb.csic.es/tools/venny/index.html, accessed on 16 January 2024).
The RSCU index was calculated using the following formula:
R S C U = G i j j i N i G i j N i
where G i j represents the number of observations for the ith codon of the jth amino acid, which contains a total of N i synonymous codons [55].
The expression levels of DDR1 in the 24 species were ranked by size using the ENC values. The top five species were classified as having low expression, whereas the bottom five were considered to have high expression. The high-expression group comprised Bos taurus, Bos indicus × Bos taurus, Bos javanicus, Bos indicus, and Bos mutus, whereas the low-expression group comprised Neophocaena asiaeorientalis, Balaenoptera ricei, Monodon monoceros, Orcinus orca, and Physeter catodon. Subsequently, the ENCs and RSCUs of the selected species were matched and the mean RSCU values for the two sets of codons were determined independently. Subsequently, the difference between the RSCUs of the high and low groups was calculated to determine ΔRSCU. Zhang et al. conducted subsequent analyses after employing the same procedure for TFs involved in EHF [75].
The calculation formula is as follows:
R S C U = R S C U h i g h e x p r e s s i o n s R S C U l o w e x p r e s s i o n s

4.4. Codon Correlation and Third Codon Analysis

PR2 plot analysis and ENC and CAI correlation analyses of DDR1 and EHF were performed using GraphPad Prism 10. ENC is a measure of the degree of random variability in codon usage, whereas CAI quantifies the relative fitness of specific codons [39,40]. The relationship between translational selection and mutational pressure on CUB is frequently demonstrated using the fit between the ENC and CAI [57,58,59]. If the correlation coefficient (r) between translation selection and mutation is close to −1, then translation selection is more influential than mutation selection. Conversely, if r is near 0, then the two are not correlated and mutation may be more influential than translation selection [60]. Pass PR2 plots are frequently examined to investigate the impact of selection and mutational forces on codon usage. The effects of codon usage in response to selection pressures and mutations were frequently examined using pass PR2 plot analyses. The degree and direction of PR2 preference are represented by vectors originating from the center. The horizontal coordinate was [A3/(A3 + U3)], whereas the vertical coordinate was [G3/(G3 + U3)]. Both coordinates were centered at (0.5, 0.5) [76,77].

4.5. PCA and K-Means Cluster Analyses

The R software version 4.3.2 (R Foundation for Statistical Computing, Vienna, Austria) and the three R packages ggplot2, factoextra, and ggrepel were employed to plot the PCAs. For the DDR1 gene and EHF, the downscaling and visualization of RSCU values and species data enabled the visual depiction of codon contributions and cluster analyses of genes and species contained in TFs [78,79].
The partitioning of the provided data points into k-prespecified, non-overlapping clusters, with each data point assigned to a single cluster, is referred to as k-means clustering [80]. The CAIs corresponding to the DDR1 gene and the EHF TF of the 24 species were processed using the ggplot2 and ggrepel packages in the R software, version 4.3.2. The k-means clustering method was employed to analyze species clustering.

5. Conclusions

This study is the first to simultaneously analyze the CUB of the TF EHF and the DDR1 gene associated with mammary traits. The results demonstrate that both the DDR1 gene and the predicted EHF TF exhibit a preference for codons ending in C and G. Phylogenetic tree construction, hierarchical clustering, PCA, and k-means clustering revealed that CUB is closely tied to phylogenetic relationships among species. Species with similar codon usage patterns tend to share closer evolutionary relationships. Furthermore, the codon usage patterns of EHF and DDR1 are shaped by both selective pressures and mutational forces. Despite some differences in codon usage among species, phylogenetically related species tend to display similar codon preferences.
These findings suggest that EHF may function as a key TF regulating DDR1 expression, particularly in the context of genetic regulation of milk production. This study offers new theoretical insights into improving mammary traits and advancing cattle breeding strategies. Additionally, it opens new research avenues for breeding improvements in other economically important species.

Supplementary Materials

The following supporting information can be downloaded from https://www.mdpi.com/article/10.3390/ijms251910696/s1.

Author Contributions

Conceptualization: Z.Z. and W.L.; methodology: W.L., Z.W. and S.M.; software: Z.Z., Z.W. and F.Z.; validation: Z.Z., W.L. and H.L.; formal analysis: Z.W.; investigation: Z.Z.; resources: X.Z. (Xiaodong Zhang) and X.Z. (Xianrui Zheng); data curation: Y.D., writing—original draft: Z.Z., W.L. and X.Z. (Xianrui Zheng); writing—review & editing: X.Z. (Xianrui Zheng); project administration: Z.Y. and X.Z. (Xianrui Zheng); funding acquisition: Z.Y. and X.Z. (Xianrui Zheng). All authors have read and agreed to the published version of the manuscript.

Funding

This research was funded by the National Natural Science Foundation (32102510), the Anhui Natural Science Foundation (2108085QC131), and the Anhui Provincial Key Research and Development Project (2022j11020009).

Institutional Review Board Statement

Not applicable.

Informed Consent Statement

Not applicable.

Data Availability Statement

Data are contained within the article and Supplementary Materials.

Conflicts of Interest

The authors declare no conflicts of interest.

References

  1. Do, D.N.; Dudemaine, P.L.; Li, R.; Ibeagha-Awemu, E.M. Co-Expression Network and Pathway Analyses Reveal Important Modules of miRNAs Regulating Milk Yield and Component Traits. Int. J. Mol. Sci. 2017, 18, 1560. [Google Scholar] [CrossRef] [PubMed]
  2. Barker, K.T.; Martindale, J.E.; Mitchell, P.J.; Kamalati, T.; Page, M.J.; Phippard, D.J.; Dale, T.C.; Gusterson, B.A.; Crompton, M.R. Expression patterns of the novel receptor-like tyrosine kinase, DDR, in human breast tumours. Oncogene 1995, 10, 569–575. [Google Scholar]
  3. Faraci-Orf, E.; McFadden, C.; Vogel, W.F. DDR1 signaling is essential to sustain Stat5 function during lactogenesis. J. Cell. Biochem. 2006, 97, 109–121. [Google Scholar] [CrossRef]
  4. Rauner, G.; Jin, D.X.; Miller, D.H.; Gierahn, T.M.; Li, C.M.; Sokol, E.S.; Feng, Y.X.; Mathis, R.A.; Love, J.C.; Gupta, P.B.; et al. Breast tissue regeneration is driven by cell-matrix interactions coordinating multi-lineage stem cell differentiation through DDR1. Nat. Commun. 2021, 12, 7116. [Google Scholar] [CrossRef] [PubMed]
  5. Zhang, X.; Hu, Y.; Pan, Y.; Xiong, Y.; Zhang, Y.; Han, M.; Dong, K.; Song, J.; Liang, H.; Ding, Z.; et al. DDR1 promotes hepatocellular carcinoma metastasis through recruiting PSD4 to ARF6. Oncogene 2022, 41, 1821–1834. [Google Scholar] [CrossRef] [PubMed]
  6. Ngai, D.; Mohabeer, A.L.; Mao, A.; Lino, M.; Bendeck, M.P. Stiffness-responsive feedback autoregulation of DDR1 expression is mediated by a DDR1-YAP/TAZ axis. Matrix Biol. 2022, 110, 129–140. [Google Scholar] [CrossRef]
  7. Sun, X.; Wu, B.; Chiang, H.C.; Deng, H.; Zhang, X.; Xiong, W.; Liu, J.; Rozeboom, A.M.; Harris, B.T.; Blommaert, E.; et al. Tumour DDR1 promotes collagen fibre alignment to instigate immune exclusion. Nature 2021, 599, 673–678. [Google Scholar] [CrossRef]
  8. Shenoy, G.P.; Pal, R.; Purwarga Matada, G.S.; Singh, E.; Raghavendra, N.M.; Dhiwar, P.S. Discoidin domain receptor inhibitors as anticancer agents: A systematic review on recent development of DDRs inhibitors, their resistance and structure activity relationship. Bioorg. Chem. 2023, 130, 106215. [Google Scholar] [CrossRef]
  9. Vogel, W.F.; Aszódi, A.; Alves, F.; Pawson, T. Discoidin domain receptor 1 tyrosine kinase has an essential role in mammary gland development. Mol. Cell. Biol. 2001, 21, 2906–2917. [Google Scholar] [CrossRef]
  10. Toscani, A.M.; Aguilera, P.; Coluccio Leskow, F. Discoidin domain receptor 1 regulates ErbB2/ErbB3 signaling in mammary epithelial cells. FEBS Lett. 2022, 596, 2795–2807. [Google Scholar] [CrossRef]
  11. Shen, W.K.; Chen, S.Y.; Gan, Z.Q.; Zhang, Y.Z.; Yue, T.; Chen, M.M.; Xue, Y.; Hu, H.; Guo, A.Y. AnimalTFDB 4.0: A comprehensive animal transcription factor database updated with variation and expression annotations. Nucleic Acids Res. 2023, 51, D39–D45. [Google Scholar] [CrossRef] [PubMed]
  12. Biswas, S.K.; Banerjee, S.; Baker, G.W.; Kuo, C.Y.; Chowdhury, I. The Mammary Gland: Basic Structure and Molecular Signaling during Development. Int. J. Mol. Sci. 2022, 23, 3883. [Google Scholar] [CrossRef] [PubMed]
  13. Hu, H.; Zhang, Q.; Hu, F.F.; Liu, C.J.; Guo, A.Y. A comprehensive survey for human transcription factors on expression, regulation, interaction, phenotype and cancer survival. Brief Bioinform. 2021, 22, bbab002. [Google Scholar] [CrossRef] [PubMed]
  14. Nitta, K.R.; Jolma, A.; Yin, Y.; Morgunova, E.; Kivioja, T.; Akhtar, J.; Hens, K.; Toivonen, J.; Deplancke, B.; Furlong, E.E.; et al. Conservation of transcription factor binding specificities across 600 million years of bilateria evolution. eLife 2015, 4, e04837. [Google Scholar] [CrossRef] [PubMed]
  15. Barrera, L.A.; Vedenko, A.; Kurland, J.V.; Rogers, J.M.; Gisselbrecht, S.S.; Rossin, E.J.; Woodard, J.; Mariani, L.; Kock, K.H.; Inukai, S.; et al. Survey of variation in human transcription factors reveals prevalent DNA binding changes. Science 2016, 351, 1450–1454. [Google Scholar] [CrossRef]
  16. Xie, G.Y.; Xia, M.; Miao, Y.R.; Luo, M.; Zhang, Q.; Guo, A.Y. FFLtool: A web server for transcription factor and miRNA feed forward loop analysis in human. Bioinformatics 2020, 36, 2605–2607. [Google Scholar] [CrossRef]
  17. Zhang, Q.; Liu, W.; Zhang, H.M.; Xie, G.Y.; Miao, Y.R.; Xia, M.; Guo, A.Y. hTFtarget: A Comprehensive Database for Regulations of Human Transcription Factors and Their Targets. Genom. Proteom. Bioinform. 2020, 18, 120–128. [Google Scholar] [CrossRef]
  18. Bochert, M.A.; Kleinbaum, L.A.; Sun, L.Y.; Burton, F.H. Molecular cloning and expression of Ehf, a new member of the ets transcription factor/oncoprotein gene family. Biochem. Biophys. Res. Commun. 1998, 246, 176–181. [Google Scholar] [CrossRef]
  19. Li, W.; Okabe, A.; Usui, G.; Fukuyo, M.; Matsusaka, K.; Rahmutulla, B.; Mano, Y.; Hoshii, T.; Funata, S.; Hiura, N.; et al. Activation of EHF via STAT3 phosphorylation by LMP2A in Epstein-Barr virus-positive gastric cancer. Cancer Sci. 2021, 112, 3349–3362. [Google Scholar] [CrossRef]
  20. Brenne, K.; Nymoen, D.A.; Hetland, T.E.; Trope, C.G.; Davidson, B. Expression of the ETS transcription factor EHF in serous ovarian carcinoma effusions is a marker of poor survival. Hum. Pathol. 2012, 43, 496–505. [Google Scholar] [CrossRef]
  21. Wang, L.; Xing, J.; Cheng, R.; Shao, Y.; Li, P.; Zhu, S.; Zhang, S. Abnormal Localization and Tumor Suppressor Function of Epithelial Tissue-Specific Transcription Factor ESE3 in Esophageal Squamous Cell Carcinoma. PLoS ONE 2015, 10, e0126319. [Google Scholar] [CrossRef]
  22. Taniue, K.; Oda, T.; Hayashi, T.; Okuno, M.; Akiyama, T. A member of the ETS family, EHF, and the ATPase RUVBL1 inhibit p53-mediated apoptosis. EMBO Rep. 2011, 12, 682–689. [Google Scholar] [CrossRef] [PubMed]
  23. Kleinbaum, L.A.; Duggan, C.; Ferreira, E.; Coffey, G.P.; Butticè, G.; Burton, F.H. Human chromosomal localization, tissue/tumor expression, and regulatory function of the ETS family gene EHF. Biochem. Biophys. Res. Commun. 1999, 264, 119–126. [Google Scholar] [CrossRef]
  24. Galang, C.K.; Muller, W.J.; Foos, G.; Oshima, R.G.; Hauser, C.A. Changes in the expression of many Ets family transcription factors and of potential target genes in normal mammary tissue and tumors. J. Biol. Chem. 2004, 279, 11281–11292. [Google Scholar] [CrossRef]
  25. He, J.; Pan, Y.; Hu, J.; Albarracin, C.; Wu, Y.; Dai, J.L. Profile of Ets gene expression in human breast carcinoma. Cancer Biol. Ther. 2007, 6, 76–82. [Google Scholar] [CrossRef] [PubMed]
  26. Novoa, E.M.; Pavon-Eternod, M.; Pan, T.; Ribas de Pouplana, L. A role for tRNA modifications in genome structure and codon usage. Cell 2012, 149, 202–213. [Google Scholar] [CrossRef]
  27. Quax, T.E.; Claassens, N.J.; Söll, D.; van der Oost, J. Codon Bias as a Means to Fine-Tune Gene Expression. Mol. Cell 2015, 59, 149–161. [Google Scholar] [CrossRef] [PubMed]
  28. Parvathy, S.T.; Udayasuriyan, V.; Bhadana, V. Codon usage bias. Mol. Biol. Rep. 2022, 49, 539–565. [Google Scholar] [CrossRef] [PubMed]
  29. Ma, Q.P.; Li, C.; Wang, J.; Wang, Y.; Ding, Z.T. Analysis of synonymous codon usage in FAD7 genes from different plant species. Genet. Mol. Res. 2015, 14, 1414–1422. [Google Scholar] [CrossRef]
  30. Liu, Y. A code within the genetic code: Codon usage regulates co-translational protein folding. Cell Commun. Signal. 2020, 18, 145. [Google Scholar] [CrossRef]
  31. Pedersen, A.K.; Wiuf, C.; Christiansen, F.B. A codon-based model designed to describe lentiviral evolution. Mol. Biol. Evol. 1998, 15, 1069–1081. [Google Scholar] [CrossRef] [PubMed]
  32. Mazumdar, P.; Binti Othman, R.; Mebus, K.; Ramakrishnan, N.; Ann Harikrishna, J. Codon usage and codon pair patterns in non-grass monocot genomes. Ann. Bot. 2017, 120, 893–909. [Google Scholar] [CrossRef] [PubMed]
  33. Sharp, P.M.; Li, W.H. An evolutionary perspective on synonymous codon usage in unicellular organisms. J. Mol. Evol. 1986, 24, 28–38. [Google Scholar] [CrossRef]
  34. Gu, W.; Zhou, T.; Ma, J.; Sun, X.; Lu, Z. The relationship between synonymous codon usage and protein structure in Escherichia coli and Homo sapiens. Biosystems 2004, 73, 89–97. [Google Scholar] [CrossRef]
  35. Moriyama, E.N.; Powell, J.R. Codon usage bias and tRNA abundance in Drosophila. J. Mol. Evol. 1997, 45, 514–523. [Google Scholar] [CrossRef]
  36. Moriyama, E.N.; Powell, J.R. Gene length and codon usage bias in Drosophila melanogaster, Saccharomyces cerevisiae and Escherichia coli. Nucleic Acids Res. 1998, 26, 3188–3193. [Google Scholar] [CrossRef]
  37. Gu, W.; Zhou, T.; Ma, J.; Sun, X.; Lu, Z. Folding type specific secondary structure propensities of synonymous codons. IEEE Trans. Nanobiosci. 2003, 2, 150–157. [Google Scholar]
  38. Romero, H.; Zavala, A.; Musto, H. Codon usage in Chlamydia trachomatis is the result of strand-specific mutational biases and a complex pattern of selective forces. Nucleic Acids Res. 2000, 28, 2084–2090. [Google Scholar] [CrossRef]
  39. Lee, S.; Weon, S.; Lee, S.; Kang, C. Relative codon adaptation index, a sensitive measure of codon usage bias. Evol. Bioinform. Online 2010, 6, 47–55. [Google Scholar] [CrossRef]
  40. Wright, F. The ‘effective number of codons’ used in a gene. Gene 1990, 87, 23–29. [Google Scholar] [CrossRef]
  41. Ikemura, T. Correlation between the abundance of Escherichia coli transfer RNAs and the occurrence of the respective codons in its protein genes. J. Mol. Biol. 1981, 146, 1–21. [Google Scholar] [CrossRef] [PubMed]
  42. Hsieh, K.L.; Yang, I.C. Incorporating PCA and fuzzy-ART techniques into achieve organism classification based on codon usage consideration. Comput. Biol. Med. 2008, 38, 886–893. [Google Scholar] [CrossRef] [PubMed]
  43. Gao, Y.; Lu, Y.; Song, Y.; Jing, L. Analysis of codon usage bias of WRKY transcription factors in Helianthus annuus. BMC Genom. Data 2022, 23, 46. [Google Scholar] [CrossRef]
  44. Srihari, J.; Sakthi, A.; Balakrishnan, N.; Duraialagaraja, S.; Varatharajalu, U. Study of Expression of Indigenous Bt cry2AX1 Gene in T 3 Progeny of Cotton and its Efficacy Against Helicoverpa armigera (Hubner). Braz. Arch. Biol. Technol. 2020, 63, 2020. [Google Scholar]
  45. Batard, Y.; Hehn, A.; Nedelkina, S.; Schalk, M.; Pallett, K.; Schaller, H.; Werck-Reichhart, D. Increasing expression of P450 and P450-reductase proteins from monocots in heterologous systems. Arch. Biochem. Biophys. 2000, 379, 161–169. [Google Scholar] [CrossRef]
  46. Xu, Y.; Liu, K.; Han, Y.; Xing, Y.; Zhang, Y.; Yang, Q.; Zhou, M. Codon usage bias regulates gene expression and protein conformation in yeast expression system P. pastoris. Microb. Cell Fact. 2021, 20, 91. [Google Scholar] [CrossRef] [PubMed]
  47. Peden, J.F. Analysis of Codon Usage. Ph.D. Thesis, University of Nottingham, Nottingham, UK, 1999. [Google Scholar]
  48. Bazzini, A.A.; Del Viso, F.; Moreno-Mateos, M.A.; Johnstone, T.G.; Vejnar, C.E.; Qin, Y.; Yao, J.; Khokha, M.K.; Giraldez, A.J. Codon identity regulates mRNA stability and translation efficiency during the maternal-to-zygotic transition. EMBO J. 2016, 35, 2087–2103. [Google Scholar] [CrossRef]
  49. Radrizzani, S.; Kudla, G.; Izsvák, Z.; Hurst, L.D. Selection on synonymous sites: The unwanted transcript hypothesis. Nat. Rev. Genet. 2024, 25, 431–448. [Google Scholar] [CrossRef] [PubMed]
  50. Xing, K.; He, X. Reassessing the “duon” hypothesis of protein evolution. Mol. Biol. Evol. 2015, 32, 1056–1062. [Google Scholar] [CrossRef]
  51. Chen, L.; Liu, T.; Yang, D.; Nong, X.; Xie, Y.; Fu, Y.; Wu, X.; Huang, X.; Gu, X.; Wang, S.; et al. Analysis of codon usage patterns in Taenia pisiformis through annotated transcriptome data. Biochem. Biophys. Res. Commun. 2013, 430, 1344–1348. [Google Scholar] [CrossRef]
  52. Dhindsa, R.S.; Copeland, B.R.; Mustoe, A.M.; Goldstein, D.B. Natural Selection Shapes Codon Usage in the Human Genome. Am. J. Hum. Genet. 2020, 107, 83–95. [Google Scholar] [CrossRef] [PubMed]
  53. Liu, Y.; Yang, Q.; Zhao, F. Synonymous but Not Silent: The Codon Usage Code for Gene Expression and Protein Folding. Annu. Rev. Biochem. 2021, 90, 375–401. [Google Scholar] [CrossRef] [PubMed]
  54. Saul, A.; Battistutta, D. Codon usage in Plasmodium falciparum. Mol. Biochem. Parasitol. 1988, 27, 35–42. [Google Scholar] [CrossRef]
  55. Xiong, B.; Wang, T.; Huang, S.; Liao, L.; Wang, X.; Deng, H.; Zhang, M.; He, J.; Sun, G.; He, S.; et al. Analysis of Codon Usage Bias in Xyloglucan Endotransglycosylase (XET) Genes. Int. J. Mol. Sci. 2023, 24, 6108. [Google Scholar] [CrossRef] [PubMed]
  56. Duret, L. Evolution of synonymous codon usage in metazoans. Curr. Opin. Genet. Dev. 2002, 12, 640–649. [Google Scholar] [CrossRef] [PubMed]
  57. Nasrullah, I.; Butt, A.M.; Tahir, S.; Idrees, M.; Tong, Y. Genomic analysis of codon usage shows influence of mutation pressure, natural selection, and host features on Marburg virus evolution. BMC Evol. Biol. 2015, 15, 174. [Google Scholar] [CrossRef]
  58. Vicario, S.; Moriyama, E.N.; Powell, J.R. Codon usage in twelve species of Drosophila. BMC Evol. Biol. 2007, 7, 226. [Google Scholar] [CrossRef]
  59. Tao, P.; Dai, L.; Luo, M.; Tang, F.; Tien, P.; Pan, Z. Analysis of synonymous codon usage in classical swine fever virus. Virus Genes 2009, 38, 104–112. [Google Scholar] [CrossRef]
  60. Wang, H.; Liu, S.; Zhang, B.; Wei, W. Analysis of Synonymous Codon Usage Bias of Zika Virus and Its Adaption to the Hosts. PLoS ONE 2016, 11, e0166260. [Google Scholar] [CrossRef]
  61. Wang, D.; Yang, B. Analysis of codon usage bias of thioredoxin in apicomplexan protozoa. Parasit. Vectors 2023, 16, 431. [Google Scholar] [CrossRef]
  62. Ouyang, T.; Zhong, J.; Chai, Z.; Wang, J.; Zhang, M.; Wu, Z.; Xin, J. Codon Usage Bias and Cluster Analysis of the MMP-2 and MMP-9 Genes in Seven Mammals. Genet. Res. 2022, 2022, 2823356. [Google Scholar] [CrossRef]
  63. Chakraborty, S.; Uddin, A.; Choudhury, M.N. Factors affecting the codon usage bias of SRY gene across mammals. Gene 2017, 630, 13–20. [Google Scholar] [CrossRef] [PubMed]
  64. Chakraborty, S.; Nag, D.; Mazumder, T.H.; Uddin, A. Codon usage pattern and prediction of gene expression level in Bungarus species. Gene 2017, 604, 48–60. [Google Scholar] [CrossRef] [PubMed]
  65. Somaratne, Y.; Guan, D.L.; Wang, W.Q.; Zhao, L.; Xu, S.Q. The Complete Chloroplast Genomes of Two Lespedeza Species: Insights into Codon Usage Bias, RNA Editing Sites, and Phylogenetic Relationships in Desmodieae (Fabaceae: Papilionoideae). Plants 2019, 9, 51. [Google Scholar] [CrossRef] [PubMed]
  66. Bu, Y.; Wu, X.; Sun, N.; Man, Y.; Jing, Y. Codon usage bias predicts the functional MYB10 gene in Populus. J. Plant Physiol. 2021, 265, 153491. [Google Scholar] [CrossRef]
  67. Crick, F.H.; Barnett, L.; Brenner, S.; Watts-Tobin, R.J. General nature of the genetic code for proteins. Nature 1961, 192, 1227–1232. [Google Scholar] [CrossRef]
  68. Nirenberg, M. Historical review: Deciphering the genetic code—A personal account. Trends Biochem. Sci. 2004, 29, 46–54. [Google Scholar] [CrossRef]
  69. Matthaei, H.; Nirenberg, M.W. The dependence of cell-free protein synthesis in E. coli upon RNA prepared from ribosomes. Biochem. Biophys. Res. Commun. 1961, 4, 404–408. [Google Scholar] [CrossRef]
  70. Lambert, S.A.; Jolma, A.; Campitelli, L.F.; Das, P.K.; Yin, Y.; Albu, M.; Chen, X.; Taipale, J.; Hughes, T.R.; Weirauch, M.T. The Human Transcription Factors. Cell 2018, 172, 650–665. [Google Scholar] [CrossRef]
  71. Weidemüller, P.; Kholmatov, M.; Petsalaki, E.; Zaugg, J.B. Transcription factors: Bridge between cell signaling and gene regulation. Proteomics 2021, 21, e2000034. [Google Scholar] [CrossRef]
  72. Kwon, K.C.; Chan, H.T.; León, I.R.; Williams-Carrier, R.; Barkan, A.; Daniell, H. Codon Optimization to Enhance Expression Yields Insights into Chloroplast Translation. Plant Physiol. 2016, 172, 62–77. [Google Scholar] [CrossRef] [PubMed]
  73. Baeza, M.; Sepulveda, D.; Cifuentes, V.; Alcaíno, J. Codon usage bias in yeasts and its correlation with gene expression, growth temperature, and protein structure. Front. Microbiol. 2024, 15, 1414422. [Google Scholar] [CrossRef] [PubMed]
  74. Kumar, S.; Stecher, G.; Tamura, K. MEGA7: Molecular Evolutionary Genetics Analysis Version 7.0 for Bigger Datasets. Mol. Biol. Evol. 2016, 33, 1870–1874. [Google Scholar] [CrossRef] [PubMed]
  75. Zhang, W.-J.; Zhou, J.; Li, Z.-F.; Wang, L.; Gu, X.; Zhong, Y. Comparative Analysis of Codon Usage Patterns Among Mitochondrion, Chloroplast and Nuclear Genes in Triticum aestivum L. J. Integr. Plant Biol. 2007, 49, 246–254. [Google Scholar] [CrossRef]
  76. Sueoka, N. Intrastrand parity rules of DNA base composition and usage biases of synonymous codons. J. Mol. Evol. 1995, 40, 318–325. [Google Scholar] [CrossRef]
  77. Sueoka, N. Translation-coupled violation of Parity Rule 2 in human genes is not the cause of heterogeneity of the DNA G+C content of third codon position. Gene 1999, 238, 53–58. [Google Scholar] [CrossRef]
  78. Kassambara, A.; Mundt, F. Extract and Visualize the Results of Multivariate Data Analyses [R Package Factoextra Version 1.0.7]; R Foundation: Indianapolis, IN, USA, 2020. [Google Scholar]
  79. Husson, F.; Josse, J.; Le, S.; Mazet, J. Multivariate exploratory data analysis and data mining. Cran 2020, 1, 1–130. [Google Scholar]
  80. Ikotun, A.M.; Ezugwu, A.E. Boosting k-means clustering with symbiotic organisms search for automatic clustering problems. PLoS ONE 2022, 17, e0272861. [Google Scholar] [CrossRef]
Figure 1. Construction of DDR1 gene and EHF phylogenetic trees. (a) Phylogenetic tree constructed based on the CDS sequence of the DDR1 gene. (b) Phylogenetic tree constructed based on the CDS sequence of the EHF TFs.
Ijms 25 10696 g001
Figure 2. Hierarchical cluster analysis. (a) Cluster analysis of 59 codon systems in the CDS region of the DDR1 gene among 24 species. (b) Cluster analysis of 59 codon systems in the CDS region of the EHF TFs among 24 species.
Ijms 25 10696 g002
Figure 3. Species dimensionality reduction cluster analysis. (a) Construction of species PCA dimensionality reduction cluster analysis based on the RSCU values of the CDS sequence codon of the DDR1 gene. (b) Construction of species PCA dimensionality reduction cluster analysis based on the RSCU values of the CDS sequence codon of the EHF TF.
Ijms 25 10696 g003
Figure 4. Correlation analysis of codon metrics (* for p ≤ 0.05; ** for p ≤ 0.01; *** for p ≤ 0.001; **** for p ≤ 0.0001). (a) Correlation analysis of codon metrics based on CDS sequences of DDR1 gene, (b) correlation analysis of codon metrics based on CDS sequences of EHF TFs.
Ijms 25 10696 g004
Figure 5. PR2 plot analysis. (a) Third codon preference analysis of the DDR1 gene; (b) third codon preference analysis of the EHF TF. The dotted line represents the theoretical codon base usage frequency under mutation pressure, where A/T and C/G would be used at equal frequencies. The dots indicate the actual codon usage frequencies, reflecting the combined influences of both mutation pressure and natural selection.
Ijms 25 10696 g005
Figure 6. Multidimensional clustering analysis of CAI for DDR1–EHF based on k-means.
Ijms 25 10696 g006
Table 1. Coding sequence features of the DDR1 gene in 24 species.
SpeciesT3s/%C3s/%A3s/%G3s/%CAICBIFopNcGC3s/%GC/%GravyAromo
Bos taurus17.2347.3911.2144.480.1970.0710.44241.4975.9063.30−0.230.09
Bos indicus × Bos taurus17.4946.5811.3045.610.1990.0660.44141.5975.7062.90−0.220.09
Bos javanicus17.2347.3911.2144.480.1980.0720.44341.6775.9063.30−0.220.09
Bos indicus16.7347.9411.2244.390.1980.0820.44841.7276.3063.40−0.200.09
Bos mutus17.0447.7211.0244.430.1990.0820.44941.7876.2063.30−0.200.09
Bubalus carabanensis16.8247.8511.2744.440.2020.0830.44941.8076.2063.40−0.220.09
Bubalus bubalis17.0847.1311.2345.810.2050.0810.45041.8276.1063.00−0.210.09
Capra hircus17.2147.4010.4146.000.2070.0870.45341.8576.6063.30−0.220.09
Ovis aries17.9846.5910.5945.80.2080.0880.45441.9475.8063.00−0.210.09
Cervus elaphus18.7746.2811.1144.230.2040.0830.45041.9674.6062.90−0.220.09
Dama dama18.4146.8711.2443.860.2050.0870.45242.0074.9063.00−0.220.09
Moschus berezovskii18.1246.6810.9244.480.2030.0740.44442.0075.3063.20−0.210.09
Cervus canadensis18.9046.1510.8244.530.2040.0830.45042.0174.7063.00−0.220.09
Globicephala melas18.3547.2310.1245.130.2100.0940.45642.0275.9063.20−0.270.09
Phocoena sinus18.2846.7410.5345.130.2140.1010.46042.0275.6063.20−0.220.09
Mesoplodon densirostris18.5446.0811.3744.760.2080.0830.44942.1474.7062.90−0.220.09
Lagenorhynchus albirostri18.1246.6810.6645.210.2100.0970.45742.1675.6063.10−0.220.09
Delphinus delphis18.3846.4110.6645.210.2100.0910.45442.1975.4063.00−0.220.09
Tursiops truncatus18.1246.8110.6645.060.2110.0950.45642.1975.6063.10−0.220.09
Neophocaena asiaeoriental asiaeoriental18.5446.4810.5345.130.2140.1010.46042.2175.3063.10−0.220.09
Balaenoptera ricei19.3545.7510.5645.050.2060.0760.44542.3274.6062.80−0.230.09
Monodon monoceros18.6446.2811.2444.460.2110.0960.45642.5274.7062.80−0.220.09
Orcinus orca18.3846.2810.8145.210.2090.0900.45242.5775.3063.00−0.220.09
Physeter catodon19.1745.6310.5545.280.2080.0890.45242.6674.8063.00−0.220.09
Table 2. Coding sequence signatures of EHF in 24 species.
SpeciesT3s/%C3s/%A3s/%G3s/%CAICBIFopNcGC3s/%GC%GravyAromo
Bos taurus21.3846.5430.9232.870.2770.2150.55457.5259.9049.10−0.950.10
Bos indicus × Bos taurus22.6749.7825.7334.020.2920.2260.5654.0163.1050.70−0.810.11
Bos javanicus21.3846.5430.9232.870.2770.2150.55457.5259.9049.10−0.950.10
Bos indicus27.3747.3721.7133.540.3040.1870.53650.4661.7050.80−0.470.10
Bos mutus21.9549.7628.0433.520.2870.2060.5553.4662.3050.40−0.870.12
Bubalus carabanensis25.5747.0325.0033.160.2760.1990.54254.6860.9050.00−0.640.12
Bubalus bubalis24.2248.8826.3433.160.290.2040.54854.0661.6050.10−0.790.11
Capra hircus23.2148.6627.8032.810.2840.2180.55555.0361.2050.20−0.800.11
Ovis aries34.6037.2623.6731.900.2490.1080.48354.8153.6049.40−0.280.12
Cervus elaphus23.2149.1125.7334.020.2740.1870.53753.9362.6050.80−0.790.11
Dama dama22.6450.0024.7433.710.2840.2420.56753.5663.6051.00−0.680.12
Moschus berezovskii21.8850.0025.7334.720.2880.230.56253.4263.7051.20−0.780.11
Cervus canadensis23.2149.1125.2434.540.2740.1870.53754.3163.0050.90−0.790.11
Globicephala melas21.1750.4526.7933.670.2720.1980.54452.5363.3050.90−0.770.11
Phocoena sinus21.1749.5528.2333.330.2690.1850.53753.2462.3050.60−0.760.11
Mesoplodon densirostris22.9749.5526.9633.510.2720.1750.53252.3262.1050.20−0.800.12
Lagenorhynchus albirostri19.2348.0832.0332.640.2510.1750.53256.1660.7049.10−0.920.10
Delphinus delphis21.7250.2326.4433.850.2710.2020.54653.0863.2050.70−0.780.11
Tursiops truncatus19.8746.7932.6832.640.2530.1750.53257.4459.7048.80−0.920.10
Neophocaena asiaeoriental asiaeoriental21.1749.5528.2333.330.2690.1850.53753.2462.3050.60−0.760.11
Balaenoptera ricei20.2751.3527.0534.020.2660.1980.54453.1564.1050.80−0.800.11
Monodon monoceros20.7250.9027.4033.510.2720.1990.54453.0563.3050.70−0.760.11
Orcinus orca19.2347.4432.6832.640.2530.1750.53256.5860.2049.00−0.920.10
Physeter catodon21.6250.4527.0533.510.270.1980.54452.6263.0050.60−0.790.11
T3s: frequency of the nucleotide T at the third codon position; C3s: frequency of the nucleotide C at the third codon position; A3s: frequency of the nucleotide A at the third codon position; G3s: frequency of the nucleotide G at the third codon position; CAI: codon adaptation index; CBI: codon bias index; Fop: frequency of optimal codons; Nc: effective number of codons; GC3s: frequency of the nucleotides G + C at the third codon position; GC: G + C content; Gravy: hydrophilicity index of the protein; Aromo: proportion of aromatic amino acids in the protein.
Table 3. Relative synonymous codon usage values and number of codons for 24 DDR1 genes.
Amino AcidCodonNumberRSCUAmino AcidCodonNumberRSCU
PheUUU3180.77AlaGCU2530.60
UUC *5061.23GCC *10052.38
LeuUUA1050.24GCA1770.42
UUG1550.36GCG2520.60
CUU1820.42TyrUAU2810.87
CUC *6641.52UAC *3661.13
CUA1410.33HisCAU1500.58
CUG *13683.14CAC *3691.42
IleAUU740.36GlnCAA740.19
AUC *5222.52CAG *6821.81
AUA260.13AsnAAU2120.66
ValGUU1180.32AAC *4271.34
GUC3010.83LysAAA450.16
GUA750.21AAG *5131.84
GUG *9582.63AspGAU4750.79
SerUCU1570.75GAC *7261.21
UCC *2891.38GluGAA1500.25
UCA770.37GAG *10491.75
UCG790.38CysUGU1270.62
AGU1480.71UGC *2821.38
AGC *5052.41ArgCGU950.35
ProCCU4230.89CGC *4281.59
CCC *8641.82CGA1270.47
CCA3430.72CGG *6302.33
CCG2680.56AGA620.23
ThrACU1240.60AGG *2771.03
ACC *4432.15GlyGGU1510.30
ACA1260.61GGC *8251.64
ACG1330.65GGA2680.53
GGG *7671.53
“*” Indicates more frequently used codons (RSCU > 1).
Table 4. Relative synonymous codon usage values and number of codons for 24 EHF.
Amino AcidCodonNumberRSCUAmino AcidCodonNumberRSCU
PheUUU870.64AlaGCU370.54
UUC *1641.36GCC *1161.76
LeuUUA710.70GCA630.97
UUG740.73GCG490.72
CUU660.61TyrUAU1100.83
CUC *1871.74UAC *1561.17
CUA330.32HisCAU810.63
CUG *2011.91CAC *1651.37
IleAUU850.89GlnCAA670.35
AUC *1972.07CAG *3271.65
AUA30.03AsnAAU1890.85
ValGUU230.36AAC *2531.15
GUC *561.08LysAAA *2421.06
GUA *671.27AAG2140.94
GUG *691.29AspGAU730.46
SerUCU320.36GAC *2431.54
UCC *1091.24GluGAA *2761.24
UCA350.41GAG1680.76
UCG100.12CysUGU30.04
AGU810.91UGC *1071.96
AGC*2592.95ArgCGU340.62
ProCCU*951.35CGC330.59
CCC660.96CGA *611.10
CCA*641.00CGG *681.36
CCG450.69AGA771.47
ThrACU740.66AGG *480.88
ACC*2111.90GlyGGU700.70
ACA1101.00GGC1010.99
ACG510.44GGA950.94
GGG *1371.38
“*” indicates codons more frequently used codons (RSCU > 1).
Disclaimer/Publisher’s Note: The statements, opinions and data contained in all publications are solely those of the individual author(s) and contributor(s) and not of MDPI and/or the editor(s). MDPI and/or the editor(s) disclaim responsibility for any injury to people or property resulting from any ideas, methods, instructions or products referred to in the content.

