
Anti-Proliferative and Anti-Migratory Activity of Licorice Extract and Glycyrrhetinic Acid on Papillary Thyroid Cancer Cell Cultures

 ,
,  , , , , , , , and
Abstract
1. Introduction
2. Results
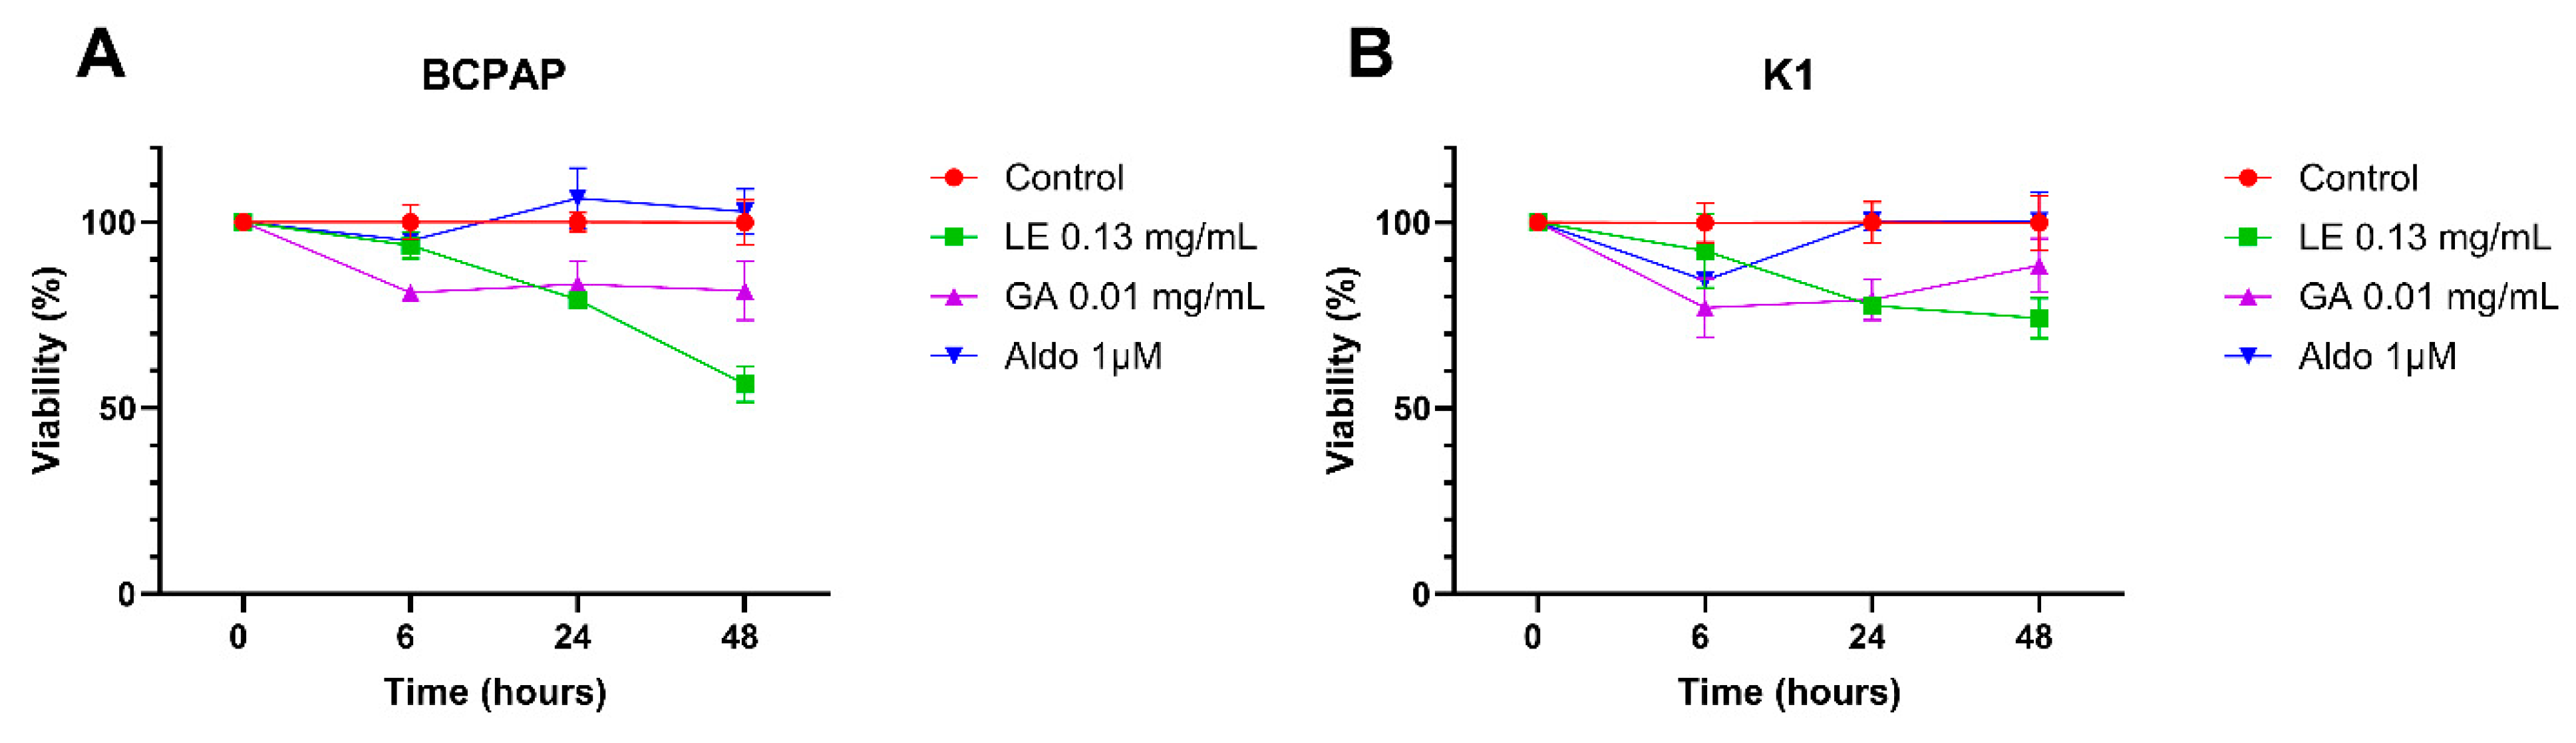
2.1. Cell Viability
2.2. Cell Migration
2.3. Cell Cycle Analysis
2.4. Apoptosis Analysis
2.5. Oxidative Stress Analysis
3. Discussion
4. Materials and Methods
4.1. Cell Cultures and Maintenance
4.2. Plant Material, Crude Extract and LC/MS Analysis
4.3. Drugs
4.4. Cell Viability
4.5. Wound Healing
4.6. Cell Cycle Analysis
4.7. Apoptosis Analysis
4.8. Reactive Oxygen Species-Glo H2O2 Assay
4.9. Statistical Analysis
5. Conclusions
Supplementary Materials
Author Contributions
Funding
Institutional Review Board Statement
Informed Consent Statement
Data Availability Statement
Acknowledgments
Conflicts of Interest
References
- Siegel, R.; Ma, J.; Zou, Z.; Jemal, A. Cancer statistics, 2014. CA Cancer J. Clin. 2014, 64, 9–29. [Google Scholar] [CrossRef] [PubMed]
- Galuppini, F.; Pennelli, G.; Vianello, F.; Censi, S.; Zambonin, L.; Watutantrige-Fernando, S.; Manso, J.; Nacamulli, D.; Lora, O.; Pelizzo, M.R.; et al. BRAF analysis before surgery for papillary thyroid carcinoma: Correlation with clinicopathological features and prognosis in a single-institution prospective experience. Clin. Chem. Lab. Med. 2016, 54, 1531–1539. [Google Scholar] [CrossRef] [PubMed]
- Davies, L.; Welch, H.G. Current thyroid cancer trends in the United States. JAMA Otolaryngol. Head Neck Surg. 2014, 140, 317–322. [Google Scholar] [CrossRef] [PubMed]
- Haugen, B.R.; Alexander, E.K.; Bible, K.C.; Doherty, G.M.; Mandel, S.J.; Nikiforov, Y.E.; Pacini, F.; Randolph, G.W.; Sawka, A.M.; Schlumberger, M.; et al. 2015 American Thyroid Association Management Guidelines for Adult Patients with Thyroid Nodules and Differentiated Thyroid Cancer: The American Thyroid Association Guidelines Task Force on Thyroid Nodules and Differentiated Thyroid Cancer. Thyroid 2016, 26, 1–133. [Google Scholar] [CrossRef]
- Eustatia-Rutten, C.F.; Corssmit, E.P.; Biermasz, N.R.; Pereira, A.M.; Romijn, J.A.; Smit, J.W. Survival and death causes in differentiated thyroid carcinoma. J. Clin. Endocrinol. Metab. 2006, 91, 313–319. [Google Scholar] [CrossRef]
- Barollo, S.; Pezzani, R.; Cristiani, A.; Redaelli, M.; Zambonin, L.; Rubin, B.; Bertazza, L.; Zane, M.; Mucignat-Caretta, C.; Bulfone, A.; et al. Prevalence, tumorigenic role, and biochemical implications of rare BRAF alterations. Thyroid 2014, 24, 809–819. [Google Scholar] [CrossRef]
- Bahmani, M.; Shirzad, H.; Shahinfard, N.; Sheivandi, L.; Rafieian-Kopaei, M. Cancer Phytotherapy: Recent Views on the Role of Antioxidant and Angiogenesis Activities. J. Evid. Based Complementary Altern. Med. 2017, 22, 299–309. [Google Scholar] [CrossRef]
- Cragg, G.M.; Newman, D.J. Plants as a source of anti-cancer agents. J. Ethnopharmacol. 2005, 100, 72–79. [Google Scholar] [CrossRef] [PubMed]
- Yang, R.; Wang, L.Q.; Yuan, B.C.; Liu, Y. The Pharmacological Activities of Licorice. Planta Med. 2015, 81, 1654–1669. [Google Scholar] [CrossRef]
- Khan, R.; Khan, A.Q.; Lateef, A.; Rehman, M.U.; Tahir, M.; Ali, F.; Hamiza, O.O.; Sultana, S. Glycyrrhizic acid suppresses the development of precancerous lesions via regulating the hyperproliferation, inflammation, angiogenesis and apoptosis in the colon of Wistar rats. PLoS ONE 2013, 8, e56020. [Google Scholar] [CrossRef]
- Chueh, F.S.; Hsiao, Y.T.; Chang, S.J.; Wu, P.P.; Yang, J.S.; Lin, J.J.; Chung, J.G.; Lai, T.Y. Glycyrrhizic acid induces apoptosis in WEHI-3 mouse leukemia cells through the caspase- and mitochondria-dependent pathways. Oncol. Rep. 2012, 28, 2069–2076. [Google Scholar] [CrossRef] [PubMed]
- Xiao, X.Y.; Hao, M.; Yang, X.Y.; Ba, Q.; Li, M.; Ni, S.J.; Wang, L.S.; Du, X. Licochalcone A inhibits growth of gastric cancer cells by arresting cell cycle progression and inducing apoptosis. Cancer Lett. 2011, 302, 69–75. [Google Scholar] [CrossRef]
- Choi, A.Y.; Choi, J.H.; Hwang, K.Y.; Jeong, Y.J.; Choe, W.; Yoon, K.S.; Ha, J.; Kim, S.S.; Youn, J.H.; Yeo, E.J.; et al. Correction to: Licochalcone A induces apoptosis through endoplasmic reticulum stress via a phospholipase Cγ1-, Ca2+-, and reactive oxygen species-dependent pathway in HepG2 human hepatocellular carcinoma cells. Apoptosis 2019, 24, 200–203. [Google Scholar] [CrossRef] [PubMed]
- Kim, J.S.; Park, M.R.; Lee, S.Y.; Kim, D.K.; Moon, S.M.; Kim, C.S.; Cho, S.S.; Yoon, G.; Im, H.J.; You, J.S.; et al. Licochalcone A induces apoptosis in KB human oral cancer cells via a caspase-dependent FasL signaling pathway. Oncol. Rep. 2014, 31, 755–762. [Google Scholar] [CrossRef] [PubMed]
- Hsu, Y.L.; Wu, L.Y.; Hou, M.F.; Tsai, E.M.; Lee, J.N.; Liang, H.L.; Jong, Y.J.; Hung, C.H.; Kuo, P.L. Glabridin, an isoflavan from licorice root, inhibits migration, invasion and angiogenesis of MDA-MB-231 human breast adenocarcinoma cells by inhibiting focal adhesion kinase/Rho signaling pathway. Mol. Nutr. Food Res. 2011, 55, 318–327. [Google Scholar] [CrossRef]
- Tamir, S.; Eizenberg, M.; Somjen, D.; Stern, N.; Shelach, R.; Kaye, A.; Vaya, J. Estrogenic and antiproliferative properties of glabridin from licorice in human breast cancer cells. Cancer Res. 2000, 60, 5704–5709. [Google Scholar]
- Lin, D.; Zhong, W.; Li, J.; Zhang, B.; Song, G.; Hu, T. Involvement of BID translocation in glycyrrhetinic acid and 11-deoxy glycyrrhetinic acid-induced attenuation of gastric cancer growth. Nutr. Cancer 2014, 66, 463–473. [Google Scholar] [CrossRef]
- Shetty, A.V.; Thirugnanam, S.; Dakshinamoorthy, G.; Samykutty, A.; Zheng, G.; Chen, A.; Bosland, M.C.; Kajdacsy-Balla, A.; Gnanasekar, M. 18alpha-glycyrrhetinic acid targets prostate cancer cells by down-regulating inflammation-related genes. Int. J. Oncol. 2011, 39, 635–640. [Google Scholar]
- Sabbadin, C.; Bordin, L.; Dona, G.; Manso, J.; Avruscio, G.; Armanini, D. Licorice: From Pseudohyperaldosteronism to Therapeutic Uses. Front. Endocrinol. 2019, 10, 484. [Google Scholar] [CrossRef]
- Sabbadin, C.; Andrisani, A.; Ambrosini, G.; Bordin, L.; Dona, G.; Manso, J.; Ceccato, F.; Scaroni, C.; Armanini, D. Aldosterone in Gynecology and Its Involvement on the Risk of Hypertension in Pregnancy. Front. Endocrinol. 2019, 10, 575. [Google Scholar] [CrossRef]
- Balsamo, A.; Cicognani, A.; Gennari, M.; Sippell, W.G.; Menabo, S.; Baronio, F.; Riepe, F.G. Functional characterization of naturally occurring NR3C2 gene mutations in Italian patients suffering from pseudohypoaldosteronism type 1. Eur. J. Endocrinol. 2007, 156, 249–256. [Google Scholar] [CrossRef] [PubMed]
- Booth, R.E.; Johnson, J.P.; Stockand, J.D. Aldosterone. Adv. Physiol. Educ. 2002, 26, 8–20. [Google Scholar] [CrossRef]
- Patel, P.D.; Sherman, T.G.; Goldman, D.J.; Watson, S.J. Molecular cloning of a mineralocorticoid (type I) receptor complementary DNA from rat hippocampus. Mol. Endocrinol. 1989, 3, 1877–1885. [Google Scholar] [CrossRef]
- Pearce, P.; Funder, J.W. High affinity aldosterone binding sites (type I receptors) in rat heart. Clin. Exp. Pharmacol. Physiol. 1987, 14, 859–866. [Google Scholar] [CrossRef] [PubMed]
- Armanini, D.; Endres, S.; Kuhnle, U.; Weber, P.C. Parallel determination of mineralocorticoid and glucocorticoid receptors in T- and B-lymphocytes of human spleen. Acta Endocrinol. 1988, 118, 479–482. [Google Scholar] [CrossRef] [PubMed]
- Manso, J.; Pedron, M.C.; Mondin, A.; Censi, S.; Pennelli, G.; Galuppini, F.; Barollo, S.; Bertazza, L.; Radu, C.M.; Ghini, F.; et al. First Evidence of Mineralocorticoid Receptor Gene and Protein Expression in Rat and Human Thyroid Tissues and Cell Cultures. Int. J. Mol. Sci. 2024, 25, 754. [Google Scholar] [CrossRef]
- Affinito, O.; Orlandella, F.M.; Luciano, N.; Salvatore, M.; Salvatore, G.; Franzese, M. Evolution of intra-tumoral heterogeneity across different pathological stages in papillary thyroid carcinoma. Cancer Cell Int. 2022, 22, 263. [Google Scholar] [CrossRef]
- Saiselet, M.; Floor, S.; Tarabichi, M.; Dom, G.; Hebrant, A.; van Staveren, W.C.; Maenhaut, C. Thyroid cancer cell lines: An overview. Front. Endocrinol. 2012, 3, 133. [Google Scholar] [CrossRef]
- Chintharlapalli, S.; Papineni, S.; Lee, S.O.; Lei, P.; Jin, U.H.; Sherman, S.I.; Santarpia, L.; Safe, S. Inhibition of pituitary tumor-transforming gene-1 in thyroid cancer cells by drugs that decrease specificity proteins. Mol. Carcinog. 2011, 50, 655–667. [Google Scholar] [CrossRef]
- Pei, L. Identification of c-myc as a down-stream target for pituitary tumor-transforming gene. J. Biol. Chem. 2001, 276, 8484–8491. [Google Scholar] [CrossRef]
- Boelaert, K.; Yu, R.; Tannahill, L.A.; Stratford, A.L.; Khanim, F.L.; Eggo, M.C.; Moore, J.S.; Young, L.S.; Gittoes, N.J.; Franklyn, J.A.; et al. PTTG’s C-terminal PXXP motifs modulate critical cellular processes in vitro. J. Mol. Endocrinol. 2004, 33, 663–677. [Google Scholar] [CrossRef] [PubMed]
- Baltina, L.A. Chemical modification of glycyrrhizic acid as a route to new bioactive compounds for medicine. Curr. Med. Chem. 2003, 10, 155–171. [Google Scholar] [CrossRef] [PubMed]
- Caroline, M.L.; Muthukumar, R.S.; Priya, A.H.H.; Nachiammai, N. Anticancer Effect of Plectranthus Amboinicus and Glycyrrhiza Glabra on Oral Cancer Cell Line: An Invitro Experimental Study. Asian Pac. J. Cancer Prev. 2023, 24, 881–887. [Google Scholar] [CrossRef] [PubMed]
- Derwahl, M.; Nicula, D. Estrogen and its role in thyroid cancer. Endocr. Relat. Cancer 2014, 21, T273–T283. [Google Scholar] [CrossRef]
- Chaudhuri, P.K.; Prinz, R. Estrogen receptor in normal and neoplastic human thyroid tissue. Am. J. Otolaryngol. 1989, 10, 322–326. [Google Scholar] [CrossRef]
- Jalali-Nadoushan, M.R.; Amirtouri, R.; Davati, A.; Askari, S.; Siadati, S. Expression of estrogen and progesterone receptors in papillary thyroid carcinoma. Caspian J. Intern. Med. 2016, 7, 183–187. [Google Scholar]
- Lu, Y.; Li, J.; Li, J. Estrogen and thyroid diseases: An update. Minerva Med. 2016, 107, 239–244. [Google Scholar]
- Vannucchi, G.; De Leo, S.; Perrino, M.; Rossi, S.; Tosi, D.; Cirello, V.; Colombo, C.; Bulfamante, G.; Vicentini, L.; Fugazzola, L. Impact of estrogen and progesterone receptor expression on the clinical and molecular features of papillary thyroid cancer. Eur. J. Endocrinol. 2015, 173, 29–36. [Google Scholar] [CrossRef]
- Rubio, G.A.; Catanuto, P.; Glassberg, M.K.; Lew, J.I.; Elliot, S.J. Estrogen receptor subtype expression and regulation is altered in papillary thyroid cancer after menopause. Surgery 2018, 163, 143–149. [Google Scholar] [CrossRef]
- Sturniolo, G.; Zafon, C.; Moleti, M.; Castellví, J.; Vermiglio, F.; Mesa, J. Immunohistochemical Expression of Estrogen Receptor-α and Progesterone Receptor in Patients with Papillary Thyroid Cancer. Eur. Thyroid J. 2016, 5, 224–230. [Google Scholar] [CrossRef]
- Dong, W.; Zhang, H.; Li, J.; Guan, H.; He, L.; Wang, Z.; Shan, Z.; Teng, W. Estrogen Induces Metastatic Potential of Papillary Thyroid Cancer Cells through Estrogen Receptor α and β. Int. J. Endocrinol. 2013, 2013, 941568. [Google Scholar] [CrossRef]
- Liu, J.; Xu, T.; Ma, L.; Chang, W. Signal Pathway of Estrogen and Estrogen Receptor in the Development of Thyroid Cancer. Front. Oncol. 2021, 11, 593479. [Google Scholar] [CrossRef] [PubMed]
- Yang, S.; Gong, Z.; Liu, Z.; Wei, M.; Xue, L.; Vlantis, A.C.; Zhang, Y.; Chan, J.Y.; van Hasselt, C.A.; Zeng, X.; et al. Differential Effects of Estrogen Receptor Alpha and Beta on Endogenous Ligands of Peroxisome Proliferator-Activated Receptor Gamma in Papillary Thyroid Cancer. Front. Endocrinol. 2021, 12, 708248. [Google Scholar] [CrossRef] [PubMed]
- Satomi, Y.; Nishino, H.; Shibata, S. Glycyrrhetinic acid and related compounds induce G1 arrest and apoptosis in human hepatocellular carcinoma HepG2. Anticancer Res. 2005, 25, 4043–4047. [Google Scholar] [PubMed]
- Hawthorne, S.; Gallagher, S. Effects of glycyrrhetinic acid and liquorice extract on cell proliferation and prostate-specific antigen secretion in LNCaP prostate cancer cells. J. Pharm. Pharmacol. 2008, 60, 661–666. [Google Scholar] [CrossRef]
- Rabbitt, E.H.; Lavery, G.G.; Walker, E.A.; Cooper, M.S.; Stewart, P.M.; Hewison, M. Prereceptor regulation of glucocorticoid action by 11beta-hydroxysteroid dehydrogenase: A novel determinant of cell proliferation. FASEB J. 2002, 16, 36–44. [Google Scholar] [CrossRef]


| Retention Time (min) | Identification | [M-H]- | Fragmentation | Licorice Extract (mg/g) |
|---|---|---|---|---|
| 14.3 | Licorice saponine G2 isomer 1 | 837 | 775 661 351 | 0.80 ± 0.01 |
| 15 | Licorice saponine G2 isomer 2 | 837 | 745 631 351 | 0.22 ± 0.01 |
| 15.6 | Glycyrrhizin | 821 | 759 645 351 | 5.51 ± 0.02 |
| 15.9 | Licorice saponine B2 | 807 | 745 631 351 | 2.65 ± 0.02 |
| 16.4 | Glycyrrhizinic acid isomer 1 | 821 | 759 645 351 | 0.09 ± 0.01 |
| 16.7 | Licorice saponine B2 isomer | 807 | 745 631 351 | 1.91 ± 0.01 |
Disclaimer/Publisher’s Note: The statements, opinions and data contained in all publications are solely those of the individual author(s) and contributor(s) and not of MDPI and/or the editor(s). MDPI and/or the editor(s) disclaim responsibility for any injury to people or property resulting from any ideas, methods, instructions or products referred to in the content. |
© 2024 by the authors. Licensee MDPI, Basel, Switzerland. This article is an open access article distributed under the terms and conditions of the Creative Commons Attribution (CC BY) license (https://creativecommons.org/licenses/by/4.0/).
Share and Cite
Manso, J.; Censi, S.; Pedron, M.C.; Bertazza, L.; Mondin, A.; Ruggeri, E.; Barollo, S.; Sabbadin, C.; Merante Boschin, I.; Armanini, D.; et al. Anti-Proliferative and Anti-Migratory Activity of Licorice Extract and Glycyrrhetinic Acid on Papillary Thyroid Cancer Cell Cultures. Int. J. Mol. Sci. 2024, 25, 10800. https://doi.org/10.3390/ijms251910800
Manso J, Censi S, Pedron MC, Bertazza L, Mondin A, Ruggeri E, Barollo S, Sabbadin C, Merante Boschin I, Armanini D, et al. Anti-Proliferative and Anti-Migratory Activity of Licorice Extract and Glycyrrhetinic Acid on Papillary Thyroid Cancer Cell Cultures. International Journal of Molecular Sciences. 2024; 25(19):10800. https://doi.org/10.3390/ijms251910800
Chicago/Turabian StyleManso, Jacopo, Simona Censi, Maria Chiara Pedron, Loris Bertazza, Alberto Mondin, Edoardo Ruggeri, Susi Barollo, Chiara Sabbadin, Isabella Merante Boschin, Decio Armanini, and et al. 2024. "Anti-Proliferative and Anti-Migratory Activity of Licorice Extract and Glycyrrhetinic Acid on Papillary Thyroid Cancer Cell Cultures" International Journal of Molecular Sciences 25, no. 19: 10800. https://doi.org/10.3390/ijms251910800
APA StyleManso, J., Censi, S., Pedron, M. C., Bertazza, L., Mondin, A., Ruggeri, E., Barollo, S., Sabbadin, C., Merante Boschin, I., Armanini, D., & Mian, C. (2024). Anti-Proliferative and Anti-Migratory Activity of Licorice Extract and Glycyrrhetinic Acid on Papillary Thyroid Cancer Cell Cultures. International Journal of Molecular Sciences, 25(19), 10800. https://doi.org/10.3390/ijms251910800