
Photodynamic Therapy against Colorectal Cancer Using Porphin-Loaded Arene Ruthenium Cages

 , ,
, ,  and
and 
Abstract
1. Introduction
2. Results
2.1. Cell Viability and Phototoxic Effect Evaluation
2.2. ROS Production
2.3. Cellular Internalization
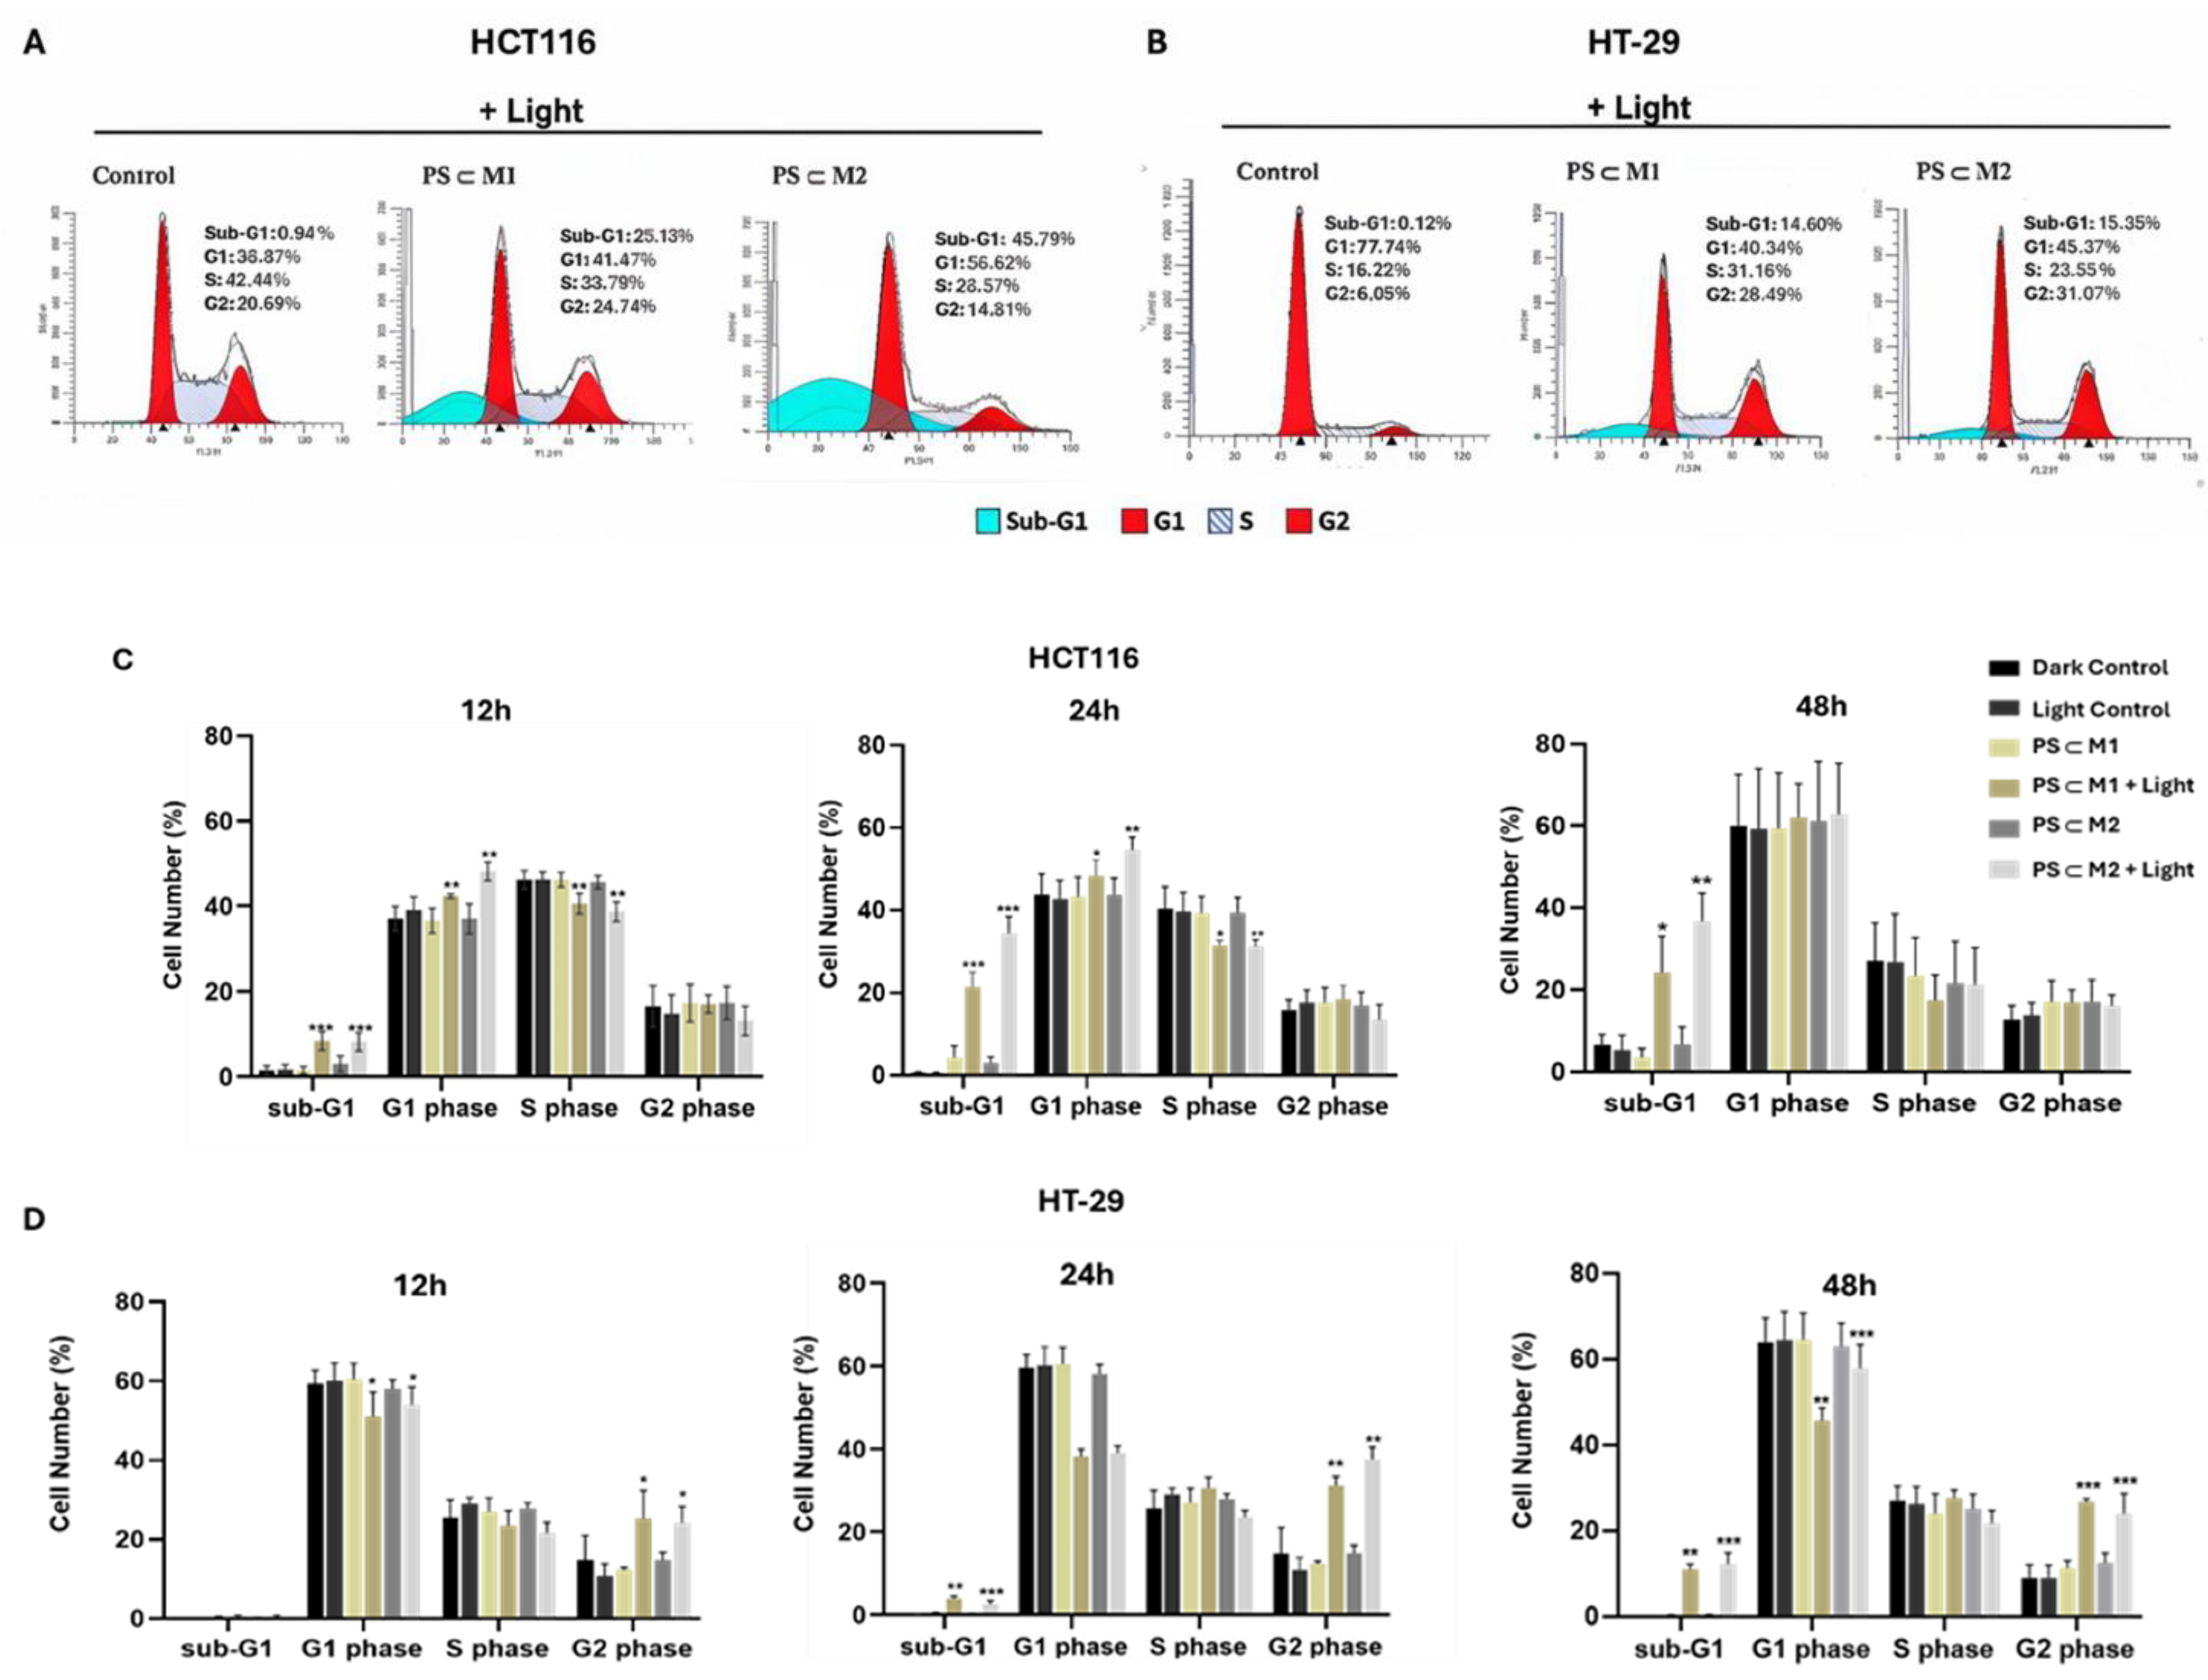
2.4. Cell Cycle Analysis
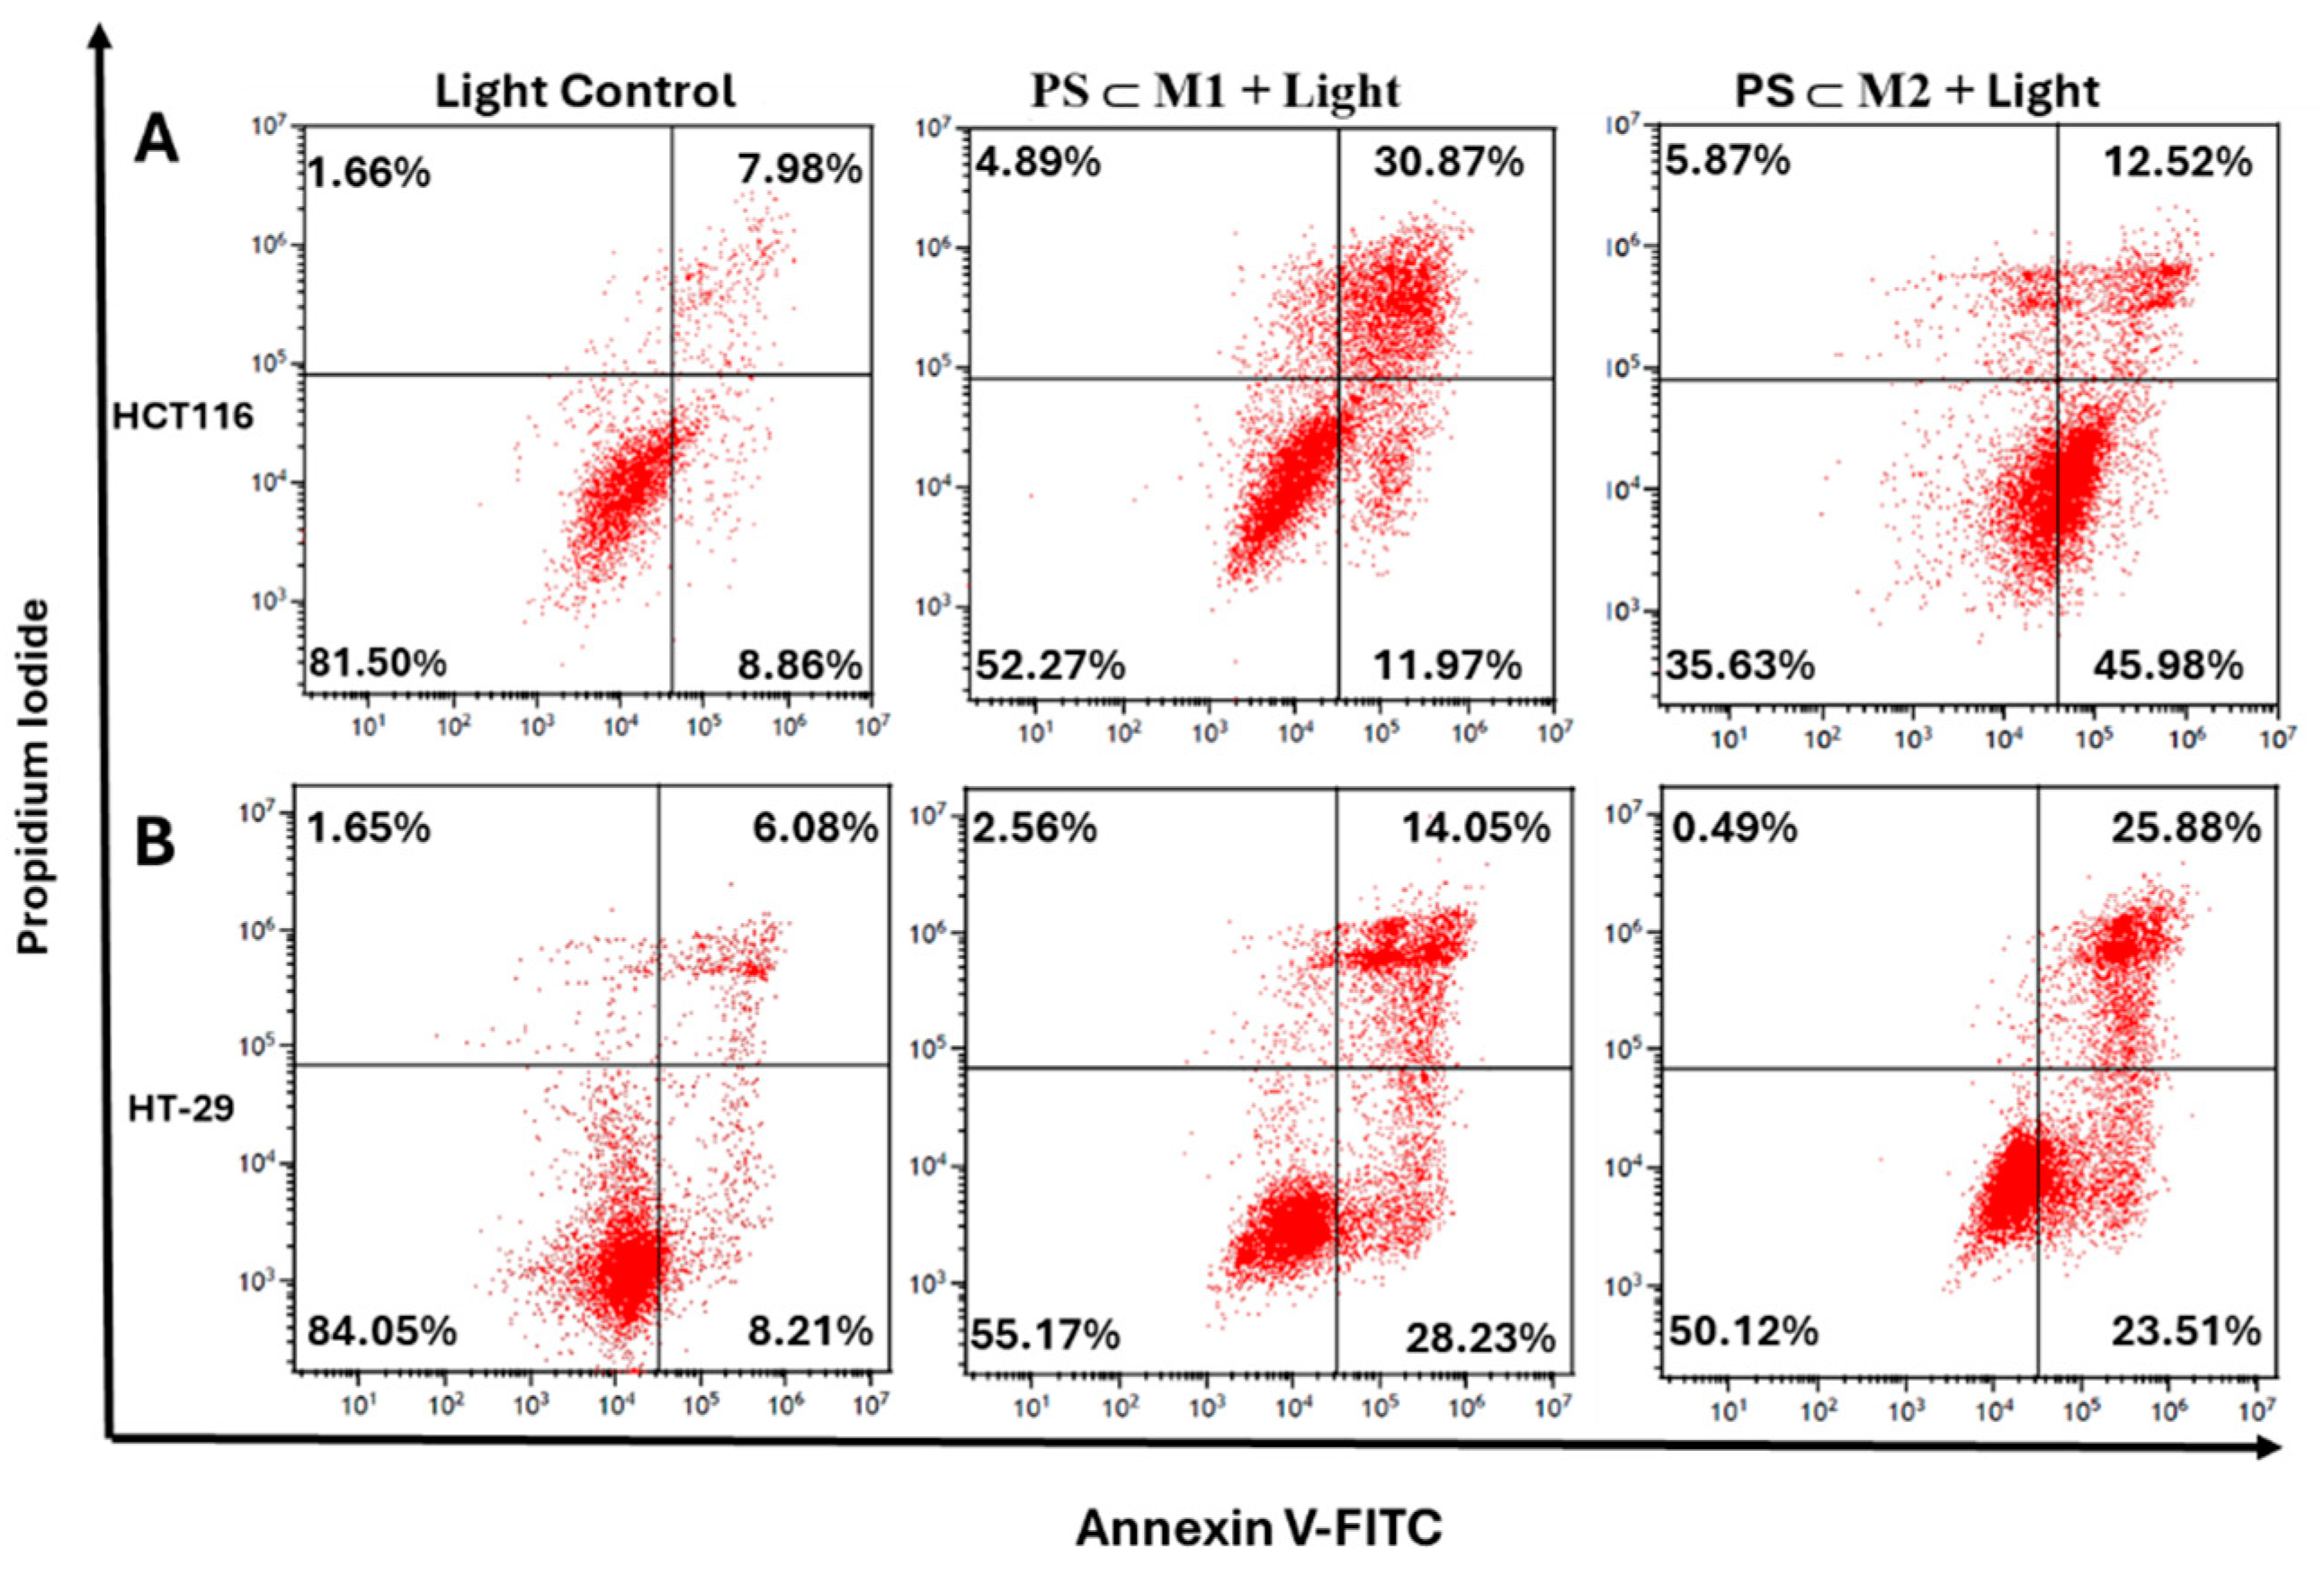
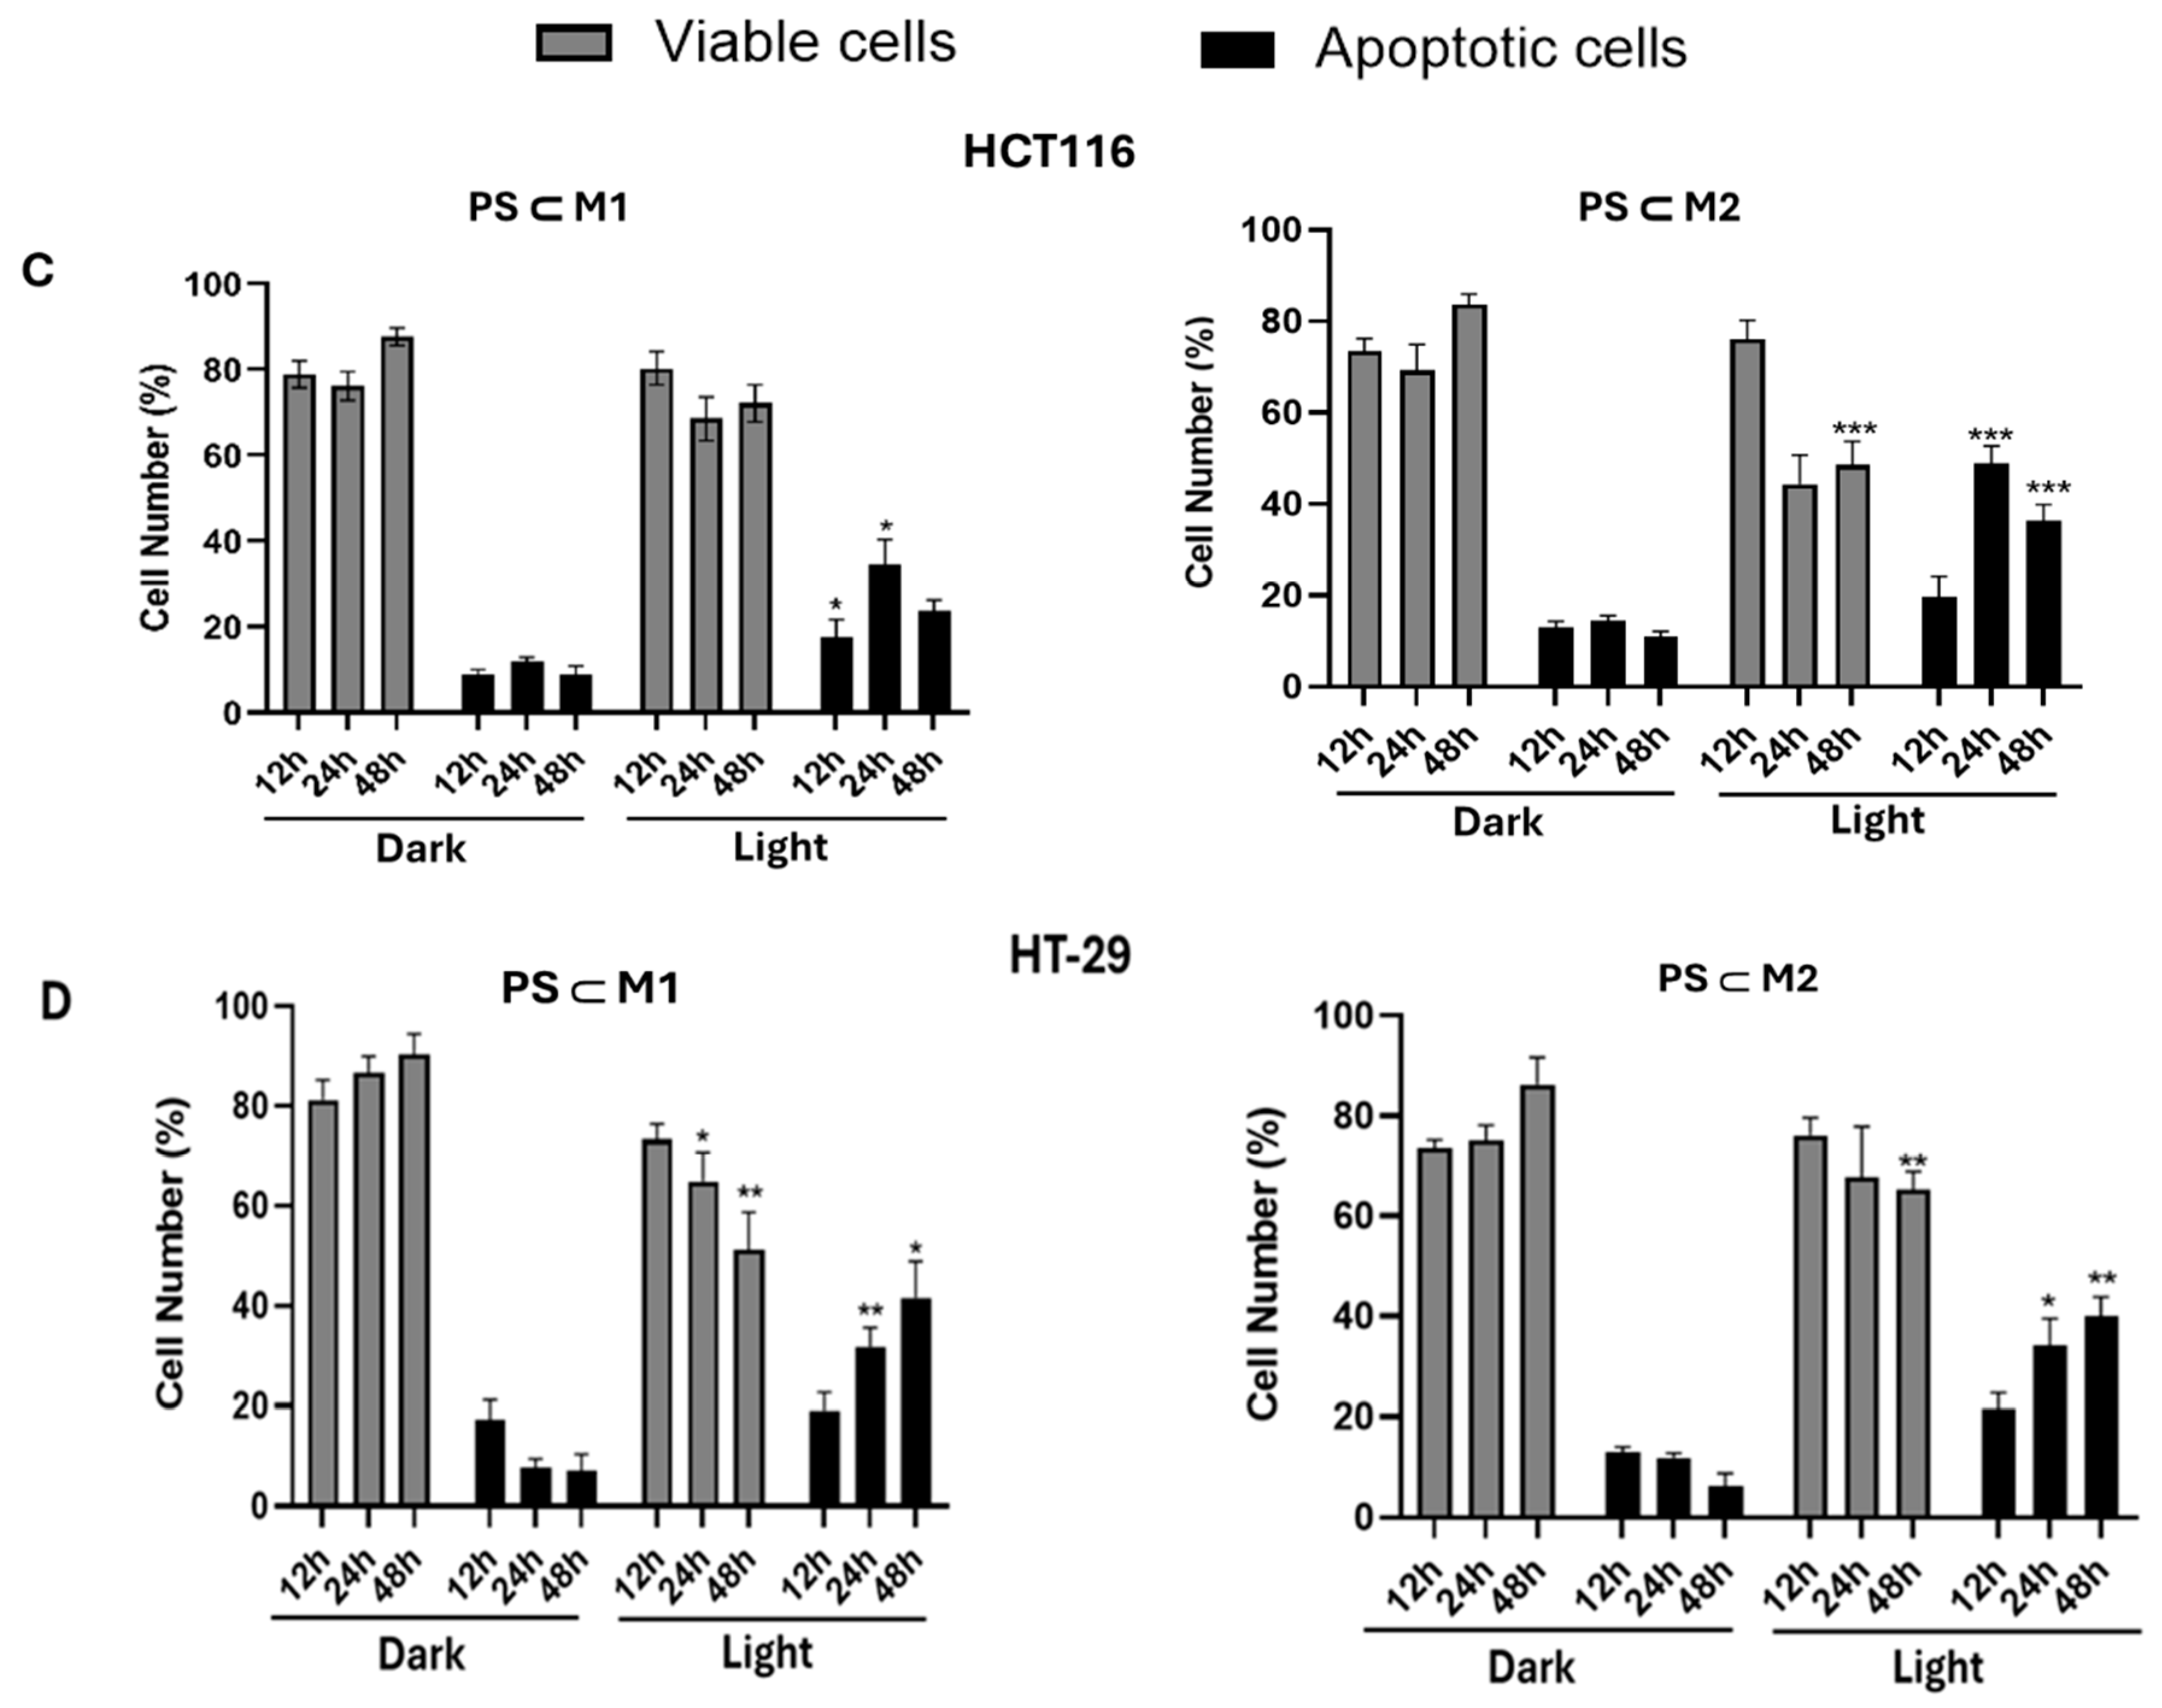
2.5. Annexin V-PI
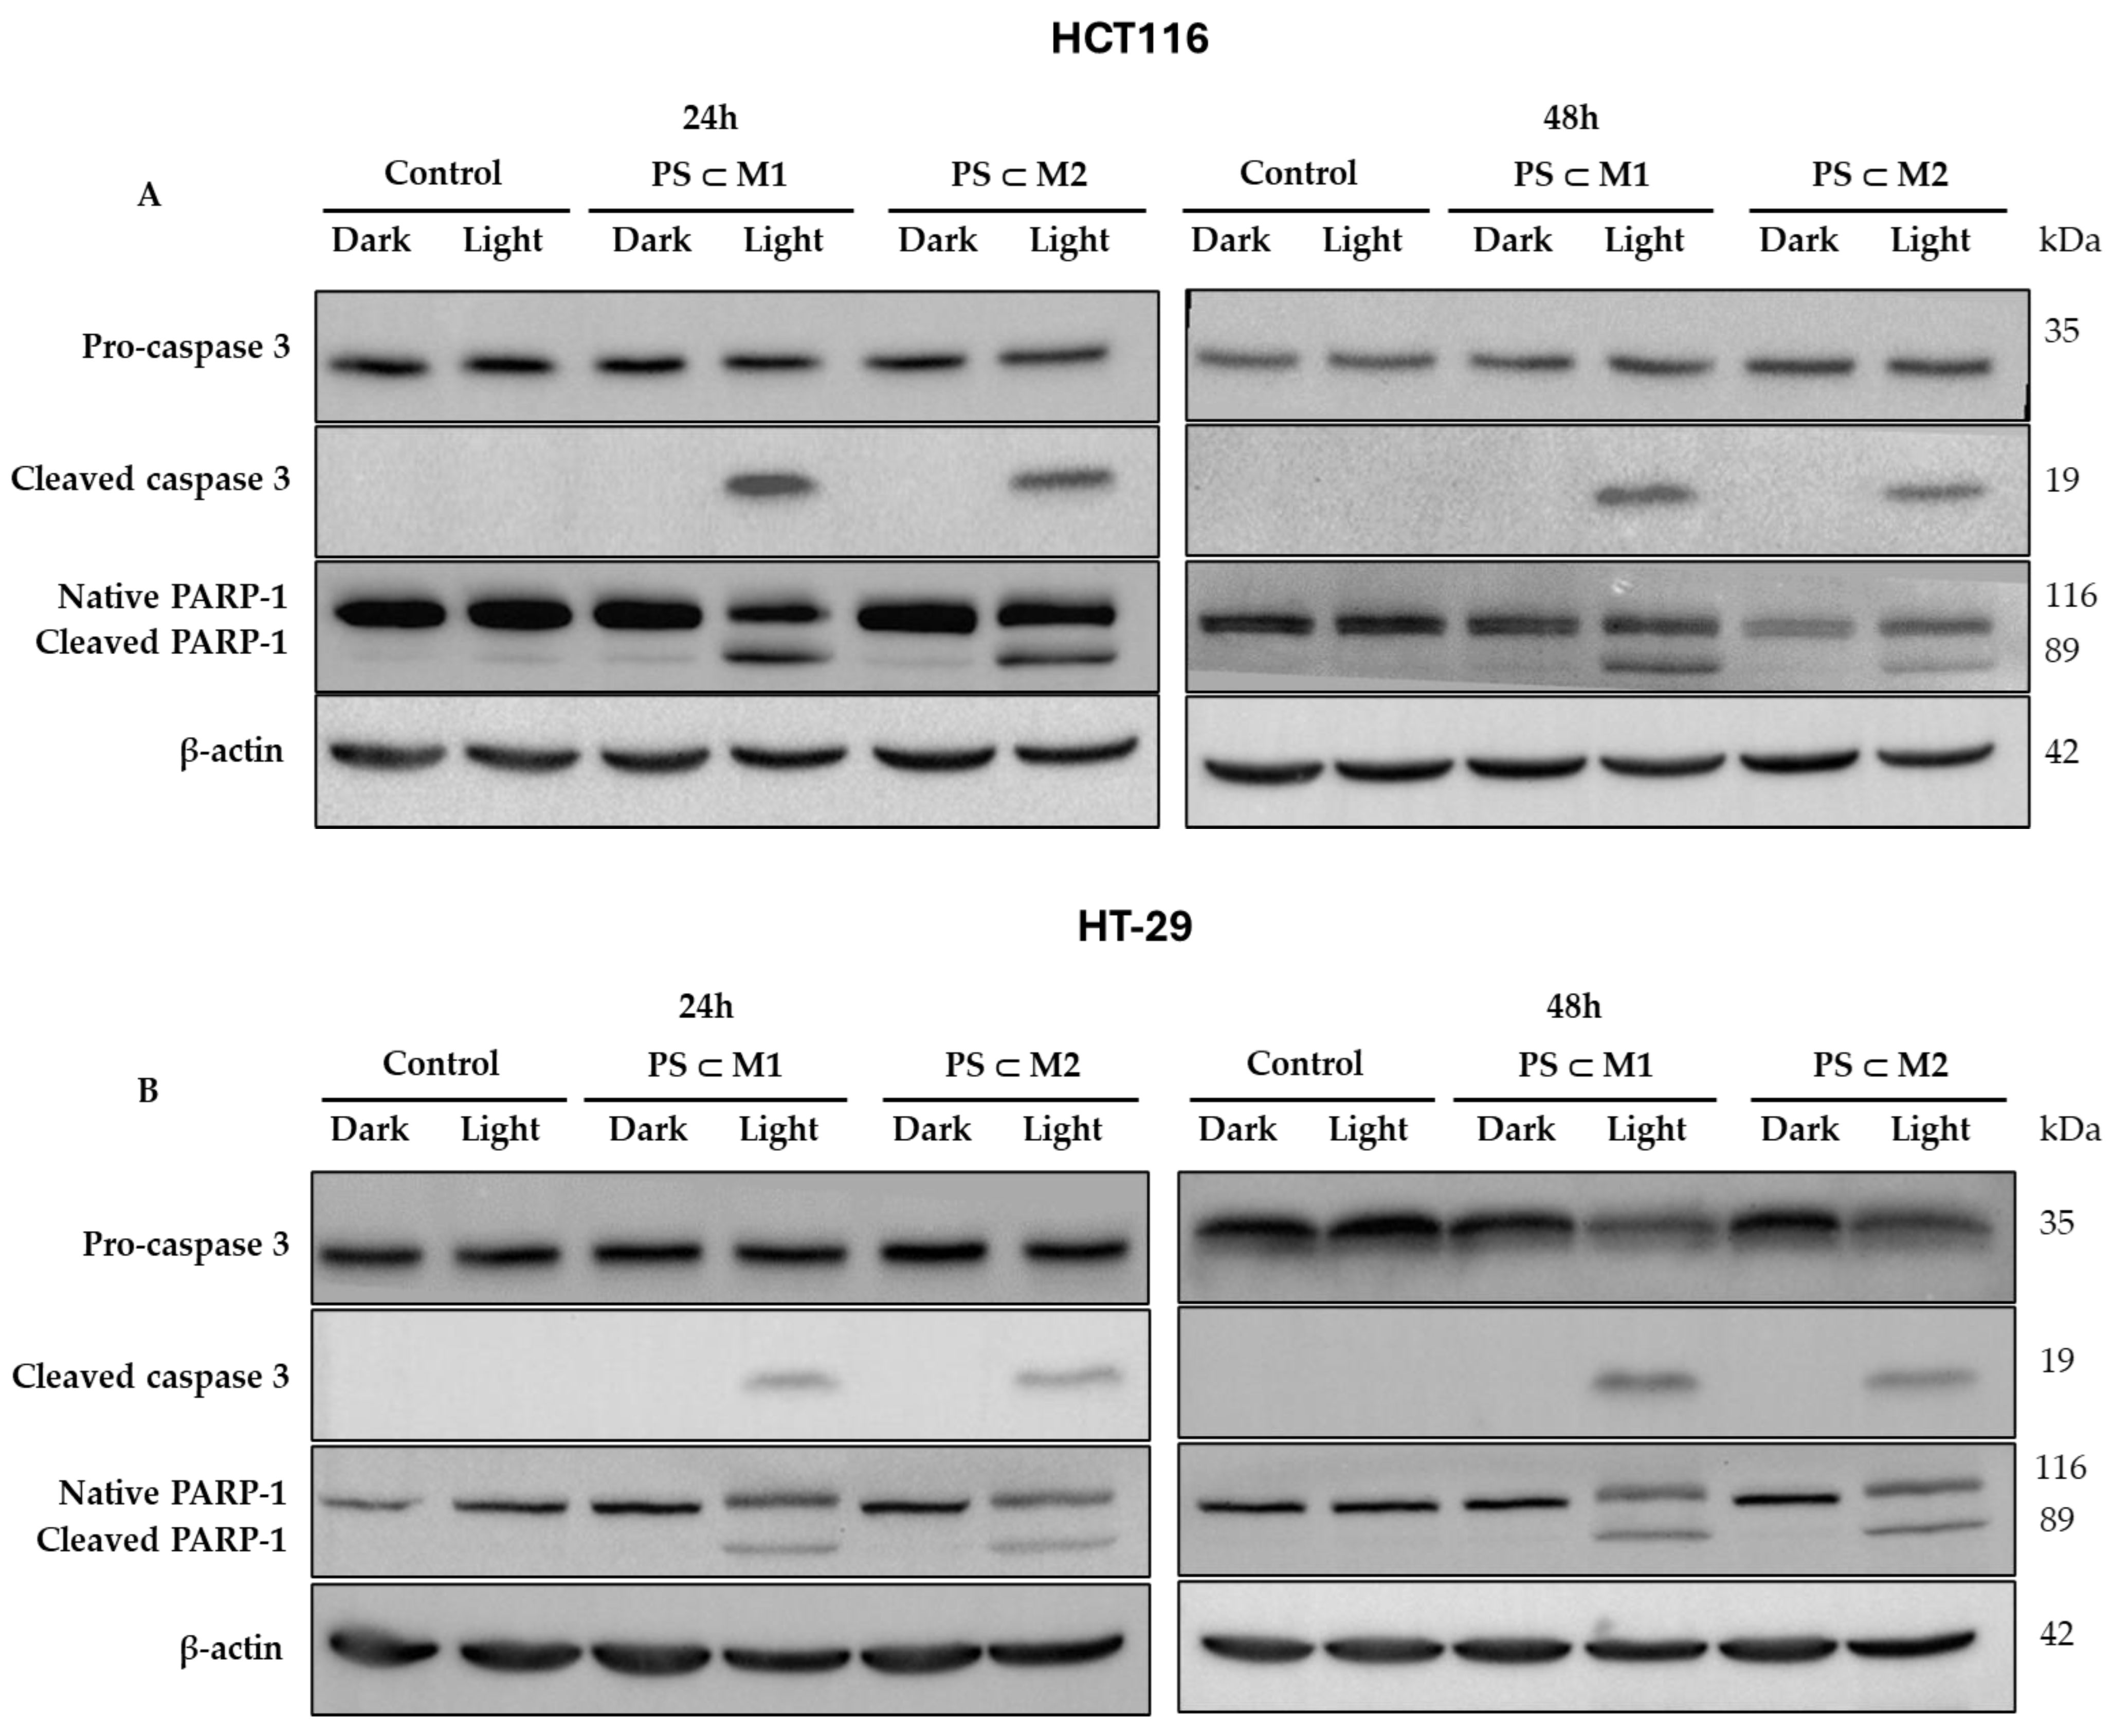
2.6. Western Blot
2.7. DNA Fragmentation
3. Discussion
4. Materials and Methods
4.1. Materials
4.2. Synthesis of the Arene-Ruthenium Assemblies Lodging a Photosensitizer
4.3. Cell Culture and Treatment
4.4. Light Source
4.5. Cell Viability Assay
4.6. Intracellular ROS Generation
4.7. Cellular Internalization
4.8. Cell Cycle Analysis
4.9. Apoptotic Assays
4.9.1. Annexin V-FITC/PI Dual Staining Assay
4.9.2. Protein Extraction and Western Blot Analysis
4.9.3. DNA Fragmentation
4.10. Statistical Analysis
5. Conclusions
Author Contributions
Funding
Institutional Review Board Statement
Informed Consent Statement
Data Availability Statement
Conflicts of Interest
Abbreviations
References
- Biller, L.H.; Schrag, D. Diagnosis and Treatment of Metastatic Colorectal Cancer: A Review. JAMA 2021, 325, 669–685. [Google Scholar] [CrossRef] [PubMed]
- Papavassiliou, A.G.; Delle Cave, D. Novel Therapeutic Approaches for Colorectal Cancer Treatment. Int. J. Mol. Sci. 2024, 25, 2228. [Google Scholar] [CrossRef]
- Negarandeh, R.; Salehifar, E.; Saghafi, F.; Jalali, H.; Janbabaei, G.; Abdhaghighi, M.J.; Nosrati, A. Evaluation of Adverse Effects of Chemotherapy Regimens of 5-Fluoropyrimidines Derivatives and Their Association with DPYD Polymorphisms in Colorectal Cancer Patients. BMC Cancer 2020, 20, 560. [Google Scholar] [CrossRef] [PubMed]
- Shan, J.; Han, D.; Shen, C.; Lei, Q.; Zhang, Y. Mechanism and Strategies of Immunotherapy Resistance in Colorectal Cancer. Front. Immunol. 2022, 13, 1016646. [Google Scholar] [CrossRef]
- Zhou, J.; Ji, Q.; Li, Q. Resistance to Anti-EGFR Therapies in Metastatic Colorectal Cancer: Underlying Mechanisms and Reversal Strategies. J. Exp. Clin. Cancer Res. 2021, 40, 328. [Google Scholar] [CrossRef]
- Kozovska, Z.; Gabrisova, V.; Kucerova, L. Colon Cancer: Cancer Stem Cells Markers, Drug Resistance and Treatment. Biomed. Pharmacother. 2014, 68, 911–916. [Google Scholar] [CrossRef]
- Federica, A.; Aebisher, D.; Bartusik-Aebisher, D. Photodynamic Therapy. In The Biochemical Guide to Enzymes; Nova Science Publishers, Inc.: Hauppauge, NY, USA, 2023. [Google Scholar]
- Agostinis, P.; Berg, K.; Cengel, K.A.; Foster, T.H.; Girotti, A.W.; Gollnick, S.O.; Hahn, S.M.; Hamblin, M.R.; Juzeniene, A.; Kessel, D.; et al. Photodynamic Therapy of Cancer: An Update. CA Cancer J. Clin. 2011, 61, 250–281. [Google Scholar] [CrossRef]
- Kwiatkowski, S.; Knap, B.; Przystupski, D.; Saczko, J.; Kędzierska, E.; Knap-Czop, K.; Kotlińska, J.; Michel, O.; Kotowski, K.; Kulbacka, J. Photodynamic Therapy—Mechanisms, Photosensitizers and Combinations. Biomed. Pharmacother. 2018, 106, 1098–1107. [Google Scholar] [CrossRef]
- Zhu, W.; Gao, Y.H.; Liao, P.Y.; Chen, D.Y.; Sun, N.N.; Nguyen Thi, P.A.; Yan, Y.J.; Wu, X.F.; Chen, Z.L. Comparison between Porphin, Chlorin and Bacteriochlorin Derivatives for Photodynamic Therapy: Synthesis, Photophysical Properties, and Biological Activity. Eur. J. Med. Chem. 2018, 160, 146–156. [Google Scholar] [CrossRef]
- Sharifkazemi, H.; Amini, S.M.; Koohi Ortakand, R.; Narouie, B. A Review of Photodynamic Therapy in Different Types of Tumors. Transl. Res. Urol. 2022, 4, 61–70. [Google Scholar]
- Kawczyk-Krupka, A.; Bugaj, A.M.; Latos, W.; Zaremba, K.; Wawrzyniec, K.; Sieroń, A. Photodynamic Therapy in Colorectal Cancer Treatment: The State of the Art in Clinical Trials. Photodiagnosis Photodyn. Ther. 2015, 12, 545–553. [Google Scholar] [CrossRef] [PubMed]
- De Annunzio, S.R.; Costa, N.C.S.; Graminha, M.A.S.; Fontana, C.R.; Mezzina, R.D. Chlorin, Phthalocyanine, and Porphyrin Types Derivatives in Phototreatment of Cutaneous Manifestations: A Review. Int. J. Mol. Sci. 2019, 20, 3861. [Google Scholar] [CrossRef] [PubMed]
- Juzeniene, A.; Moan, J. The History of PDT in Norway. Part II. Recent Advances in General PDT and ALA-PDT. Photodiagnosis Photodyn. Ther. 2007, 4, 80–87. [Google Scholar] [CrossRef] [PubMed]
- Luksiene, Z. Photodynamic Therapy: Mechanism of Action and Ways to Improve the Efficiency of Treatment. Medicina 2003, 39, 1137–1150. [Google Scholar]
- Plekhova, N.; Shevchenko, O.; Korshunova, O.; Stepanyugina, A.; Tananaev, I.; Apanasevich, V. Development of Novel Tetrapyrrole Structure Photosensitizers for Cancer Photodynamic Therapy. Bioengineering 2022, 9, 82. [Google Scholar] [CrossRef]
- Park, J.; Jiang, Q.; Feng, D.; Mao, L.; Zhou, H.-C. Size-Controlled Synthesis of Porphyrinic Metal-Organic Framework and Functionalization for Targeted Photodynamic Therapy. J. Am. Chem. Soc. 2016, 138, 3518–3525. [Google Scholar] [CrossRef]
- Nakamura, Y.; Mochida, A.; Choyke, P.L.; Kobayashi, H. Nanodrug Delivery: Is the Enhanced Permeability and Retention Effect Sufficient for Curing Cancer? Bioconjug Chem. 2016, 27, 2225–2238. [Google Scholar] [CrossRef]
- Ejigah, V.; Owoseni, O.; Bataille-Backer, P.; Ogundipe, O.D.; Fisusi, F.A.; Adesina, S.K. Approaches to Improve Macromolecule and Nanoparticle Accumulation in the Tumor Microenvironment by the Enhanced Permeability and Retention Effect. Polymers 2022, 14, 2601. [Google Scholar] [CrossRef]
- Bretin, L.; Pinon, A.; Bouramtane, S.; Ouk, C.; Richard, L.; Perrin, M.L.; Chaunavel, A.; Carrion, C.; Bregier, F.; Sol, V.; et al. Photodynamic Therapy Activity of New Porphyrin-Xylan-Coated Silica Nanoparticles in Human Colorectal Cancer. Cancers 2019, 11, 1474. [Google Scholar] [CrossRef]
- Mfouo-Tynga, I.S.; Dias, L.D.; Inada, N.M.; Kurachi, C. Features of Third Generation Photosensitizers Used in Anticancer Photodynamic Therapy: Review. Photodiagnosis Photodyn. Ther. 2021, 34, 102091. [Google Scholar] [CrossRef]
- Massoud, J.; Pinon, A.; Gallardo-Villagrán, M.; Paulus, L.; Ouk, C.; Carrion, C.; Antoun, S.; Diab-Assaf, M.; Therrien, B.; Liagre, B. A Combination of Ruthenium Complexes and Photosensitizers to Treat Colorectal Cancer. Inorganics 2023, 11, 451. [Google Scholar] [CrossRef]
- Paulus, L.; Gallardo-Villagrán, M.; Carrion, C.; Ouk, C.; Martin, F.; Therrien, B.; Léger, D.Y.; Liagre, B. The Effect of Photosensitizer Metalation Incorporated into Arene–Ruthenium Assemblies on Prostate Cancer. Int. J. Mol. Sci. 2023, 24, 13614. [Google Scholar] [CrossRef]
- Janbeih, Z.; Gallardo-Villagrán, M.; Therrien, B.; Diab-Assaf, M.; Liagre, B.; Benov, L. Cellular Uptake and Phototoxicity Optimization of Arene Ruthenium Porphyrin Derivatives. Inorganics 2024, 12, 86. [Google Scholar] [CrossRef]
- Candelaria, P.V.; Leoh, L.S.; Penichet, M.L.; Daniels-Wells, T.R. Antibodies Targeting the Transferrin Receptor 1 (TfR1) as Direct Anti-Cancer Agents. Front. Immunol. 2021, 12, 607692. [Google Scholar] [CrossRef] [PubMed]
- Wang, M.; Wang, H.; Xu, X.; Lai, T.P.; Zhou, Y.; Hao, Q.; Li, H.; Sun, H. Binding of Ruthenium and Osmium at Non-iron Sites of Transferrin Accounts for Their Iron-Independent Cellular Uptake. J. Inorg. Biochem. 2022, 234, 111885. [Google Scholar] [CrossRef]
- Guo, W.; Zheng, W.; Luo, Q.; Li, X.; Zhao, Y.; Xiong, S.; Wang, F. Transferrin Serves as a Mediator to Deliver Organometallic Ruthenium(II) Anticancer Complexes into Cells. Inorg. Chem. 2013, 52, 5328–5338. [Google Scholar] [CrossRef]
- Biancalana, L.; Pampaloni, G.; Marchetti, F. Arene Ruthenium(II) Complexes with Phosphorous Ligands as Possible Anticancer Agents. Chimia 2017, 71, 573–579. [Google Scholar] [CrossRef]
- Gandioso, A.; Purkait, K.; Gasser, G. Recent Approaches towards the Development of Ru(II) Polypyridyl Complexes for Anticancer Photodynamic Therapy. Chimia 2021, 75, 845–855. [Google Scholar] [CrossRef]
- Abraham, M.H.; Acree, W.E. Solvation Descriptors for Porphyrins (Porphines). New J. Chem. 2016, 40, 9945–9950. [Google Scholar] [CrossRef]
- Gallardo-Villagrán, M.; Paulus, L.; Charissoux, J.-L.; Sutour, S.; Vergne-Salle, P.; Leger, D.Y.; Liagre, B.; Therrien, B. Evaluation of Ruthenium-Based Assemblies as Carriers of Photosensitizers to Treat Rheumatoid Arthritis by Photodynamic Therapy. Pharmaceutics 2021, 13, 2104. [Google Scholar] [CrossRef]
- Zhang, L.; Deng, M.; Liu, J.; Zhang, J.; Wang, F.; Yu, W. The Pathogenicity of Vancomycin-Resistant Enterococcus faecalis to Colon Cancer Cells. BMC Infect. Dis. 2024, 24, 230. [Google Scholar] [CrossRef] [PubMed]
- Barry, N.P.E.; Zava, O.; Dyson, P.J.; Therrien, B. Excellent Correlation between Drug Release and Portal Size in Metalla-Cage Drug-Delivery Systems. Chem. Eur. J. 2011, 17, 9669–9677. [Google Scholar] [CrossRef] [PubMed]
- Schmitt, F.; Freudenreich, J.; Barry, N.P.E.; Juillerat-Jeanneret, L.; Süss-Fink, G.; Therrien, B. Organometallic Cages as Vehicles for Intracellular Release of Photosensitizers. J. Am. Chem. Soc. 2012, 134, 754–757. [Google Scholar] [CrossRef] [PubMed]
- Baskaran, R.; Lee, J.; Yang, S.G. Clinical Development of Photodynamic Agents and Therapeutic Applications. Biomater. Res. 2018, 22, 25. [Google Scholar] [CrossRef]
- Sun, R.W.Y.; Zhang, M.; Li, D.; Li, M.; Wong, A.S.T. Enhanced Anti-Cancer Activities of a Gold(III) Pyrrolidinedithiocarbamato Complex Incorporated in a Biodegradable Metal-Organic Framework. J. Inorg. Biochem. 2016, 163, 1–7. [Google Scholar] [CrossRef]
- Liu, J.; Zhang, C.; Rees, T.W.; Ke, L.; Ji, L.; Chao, H. Harnessing Ruthenium(II) as Photodynamic Agents: Encouraging Advances in Cancer Therapy. Coord. Chem. Rev. 2018, 363, 17–28. [Google Scholar] [CrossRef]
- Bogoeva, V.; Siksjø, M.; Sæterbø, K.G.; Melø, T.B.; Bjørkøy, A.; Lindgren, M.; Gederaas, O.A. Ruthenium Porphyrin-Induced Photodamage in Bladder Cancer Cells. Photodiagnosis Photodyn. Ther. 2016, 14, 9–17. [Google Scholar] [CrossRef]
- Lu, Y.; Shen, T.; Yang, H.; Gu, W. Ruthenium Complexes Induce HepG2 Human Hepatocellular Carcinoma Cell Apoptosis and Inhibit Cell Migration and Invasion through Regulation of the Nrf2 Pathway. Int. J. Mol. Sci. 2016, 17, 775. [Google Scholar] [CrossRef]
- Zhao, P.; Xu, L.C.; Huang, J.W.; Zheng, K.C.; Liu, J.; Yu, H.C.; Ji, L.N. DNA Binding and Photocleavage Properties of a Novel Cationic Porphyrin-Anthraquinone Hybrid. Biophys. Chem. 2008, 134, 72–83. [Google Scholar] [CrossRef]
- Rani-Beeram, S.; Meyer, K.; McCrate, A.; Hong, Y.; Nielsen, M.; Swavey, S. A Fluorinated Ruthenium Porphyrin as a Potential Photodynamic Therapy Agent: Synthesis, Characterization, DNA Binding, and Melanoma Cell Studies. Inorg. Chem. 2008, 47, 11278–11283. [Google Scholar] [CrossRef]
- Li, W.; Xie, Q.; Lai, L.; Mo, Z.; Peng, X.; Leng, E.; Zhang, D.; Sun, H.; Li, Y.; Mei, W.; et al. In Vitro Evaluation of Ruthenium Complexes for Photodynamic Therapy. Photodiagnosis Photodyn. Ther. 2017, 18, 83–94. [Google Scholar] [CrossRef] [PubMed]
- Li, W.; Jiang, G.B.; Yao, J.H.; Wang, X.Z.; Wang, J.; Han, B.J.; Xie, Y.Y.; Lin, G.J.; Huang, H.L.; Liu, Y.J. Ruthenium(II) Complexes: DNA-Binding, Cytotoxicity, Apoptosis, Cellular Localization, Cell Cycle Arrest, Reactive Oxygen Species, Mitochondrial Membrane Potential and Western Blot Analysis. J. Photochem. Photobiol. B 2014, 140, 94–104. [Google Scholar] [CrossRef] [PubMed]
- Dogutan, D.K.; Ptaszek, M.; Lindsey, J.S. Direct Synthesis of Magnesium Porphine via 1-Formyldipyrromethane. J. Org. Chem. 2007, 72, 5008–5011. [Google Scholar] [CrossRef] [PubMed]


Disclaimer/Publisher’s Note: The statements, opinions and data contained in all publications are solely those of the individual author(s) and contributor(s) and not of MDPI and/or the editor(s). MDPI and/or the editor(s) disclaim responsibility for any injury to people or property resulting from any ideas, methods, instructions or products referred to in the content. |
© 2024 by the authors. Licensee MDPI, Basel, Switzerland. This article is an open access article distributed under the terms and conditions of the Creative Commons Attribution (CC BY) license (https://creativecommons.org/licenses/by/4.0/).
Share and Cite
Ghaddar, S.; Pinon, A.; Gallardo-Villagran, M.; Massoud, J.; Ouk, C.; Carrion, C.; Diab-Assaf, M.; Therrien, B.; Liagre, B. Photodynamic Therapy against Colorectal Cancer Using Porphin-Loaded Arene Ruthenium Cages. Int. J. Mol. Sci. 2024, 25, 10847. https://doi.org/10.3390/ijms251910847
Ghaddar S, Pinon A, Gallardo-Villagran M, Massoud J, Ouk C, Carrion C, Diab-Assaf M, Therrien B, Liagre B. Photodynamic Therapy against Colorectal Cancer Using Porphin-Loaded Arene Ruthenium Cages. International Journal of Molecular Sciences. 2024; 25(19):10847. https://doi.org/10.3390/ijms251910847
Chicago/Turabian StyleGhaddar, Suzan, Aline Pinon, Manuel Gallardo-Villagran, Jacquie Massoud, Catherine Ouk, Claire Carrion, Mona Diab-Assaf, Bruno Therrien, and Bertrand Liagre. 2024. "Photodynamic Therapy against Colorectal Cancer Using Porphin-Loaded Arene Ruthenium Cages" International Journal of Molecular Sciences 25, no. 19: 10847. https://doi.org/10.3390/ijms251910847
APA StyleGhaddar, S., Pinon, A., Gallardo-Villagran, M., Massoud, J., Ouk, C., Carrion, C., Diab-Assaf, M., Therrien, B., & Liagre, B. (2024). Photodynamic Therapy against Colorectal Cancer Using Porphin-Loaded Arene Ruthenium Cages. International Journal of Molecular Sciences, 25(19), 10847. https://doi.org/10.3390/ijms251910847